tr cracking impact plastic composite ties final
TRANSCRIPT
8/17/2019 TR Cracking Impact Plastic Composite Ties Final
http://slidepdf.com/reader/full/tr-cracking-impact-plastic-composite-ties-final 1/54
DOT/FRA/ORD-12/03 Final ReportMarch 2012
Cracking and Impact Performance Characteristicsof Plastic Composite Ties
Office of RailroadPolicy and DevelopmentWashington, DC 20590
U.S. Departmentof Transportation
Federal Railroad
Administration
8/17/2019 TR Cracking Impact Plastic Composite Ties Final
http://slidepdf.com/reader/full/tr-cracking-impact-plastic-composite-ties-final 2/54
NOTICEThe United States Government does not endorse products ormanufacturers. Trade or manufacturers’ names appear herein solely
because they are considered essential to the objective of this report.
NOTICEThis document is disseminated under the sponsorship of the Departmentof Transportation in the interest of information exchange. The UnitedStates Government assumes no liability for its contents or use thereof.Any opinions, findings and conclusions, or recommendations expressedin this material do not necessarily reflect the views or policies of theUnited States Government, nor does mention of trade names, commercial
products, or organizations imply endorsement by the United States
Government. The United States Government assumes no liability for thecontent or use of the material contained in this document.
8/17/2019 TR Cracking Impact Plastic Composite Ties Final
http://slidepdf.com/reader/full/tr-cracking-impact-plastic-composite-ties-final 3/54
i
REPORT DOCUMENTATION PAGE Form approvedOMB No. 0704-0188
Public reporting burden for this collection of information is estimated to average 1 hour per response, including the time for reviewing instructions, searchingexisting data sources, gathering and maintaining the data needed, and completing and reviewing the collection of information. Send comments regardingthis burden estimate or any other aspect of this collection of information, including suggestions for reducing this burden to Washington HeadquartersServices, Directorate for Information Operations and Reports, 1215 Jefferson Davis Highway, Suite 1204, Arlington, VA 22202-4302, and to the Office ofManagement and Budget, Paperwork Reduction Project (0702-0288), Washington, D.C. 20503
1. AGENCY USE ONLY (Leave blank) 2. REPORT DATE 3. REPORT TYPE AND DATES COVEREDMarch 2012 Technical Report
4. TITLE AND SUBTITLECracking and Impact Performance Characteristics of Plastic Composite Ties
5. FUNDING NUMBERS
6. AUTHOR(S)Richard Reiff and Carmen Trevizo
7. PERFORMING ORGANIZATION NAME(S) AND ADDRESS(ES)Transportation Technology Center, Inc.P.O. Box 11130Pueblo, CO 81001
8. PERFORMING ORGANIZATIONREPORT NUMBERSDTFR53-00-C-00012Task Order 227
9. SPONSORING/MONITORING AGENCY NAME(S) AND ADDRESS(ES)
U.S. Department of TransportationFederal Railroad AdministrationOffice of Railroad Policy and Development, MS 201200 New Jersey Avenue, SEWashington, DC 20590
10. SPONSORING/MONITORING AGENCYREPORT NUMBER
DOT/FRA/ORD-12/03
11. SUPPLEMENTARY NOTES
Program Manager: Mahmood Fateh12a. DISTRIBUTION/AVAILABILITY STATEMENT 12b. DISTRIBUTION CODEThis document is available to the public on the FRA Web site athttp://www.fra.dot.gov.13. ABSTRACT
As followup to a workshop on Engineered Composite Ties sponsored by the American Railway Engineering and
Maintenance-of-Way Association and the Federal Railroad Administration, the Transportation Technology Center, Inc.,in Pueblo, CO, conducted a series of tests addressing material performance issues. A primary objective of the workshopwas to identify performance concerns and potential areas of research by using input from the Class I railroadrepresentatives. Class I railroads have installed plastic/composite ties in their tracks for several years for evaluation
purposes. A panel of Class I railroad engineers attending the workshop noted tie cracking and fractures during handling,installation, and service as priority areas of concern.
14. SUBJECT TERMSHigh-density polyethylene, modulus of elasticity, modulus of rupture, plasticcomposite ties
15. NUMBER OF PAGES
54
16. PRICE CODE
17. SECURITY CLASSIFICATIONOF REPORT
18. SECURITY CLASSIFICATIONOF THIS PAGE
19. SECURITYCLASSIFICATION OF
ABSTRACT
20. LIMITATION OF ABSTRACT
UNCLASSIFIED UNCLASSIFIED UNCLASSIFIED
NSN 7540-01-280-5500 Standard Form 298 (Rev. 2-89)Prescribed by ANSI/NISO Std. 239.18
298-102
8/17/2019 TR Cracking Impact Plastic Composite Ties Final
http://slidepdf.com/reader/full/tr-cracking-impact-plastic-composite-ties-final 4/54
ii
METRIC/ENGLISH CONVERSION FACTORSENGLISH TO METRIC METRIC TO ENGLISH
LENGTH (APPROXIMATE) LENGTH (APPROXIMATE)
1 inch (in) = 2.5 centimeters (cm) 1 millimeter (mm) = 0.04 inch (in)
1 foot (ft) = 30 centimeters (cm) 1 centimeter (cm) = 0.4 inch (in)
1 yard (yd) = 0.9 meter (m) 1 meter (m) = 3.3 feet (ft)
1 mile (mi) = 1.6 kilometers (km) 1 meter (m) = 1.1 yards (yd)
1 kilometer (km) = 0.6 mile (mi)
AREA (APPROXIMATE) AREA (APPROXIMATE)
1 square inch (sq in, in 2) = 6.5 square centimeters(cm 2)
1 square centimeter (cm 2) = 0.16 square inch (sq in, in 2)
1 square foot (sq ft, ft 2) = 0.09 square meter (m 2) 1 square meter (m 2) = 1.2 square yards (sq yd,yd 2)
1 square yard (sq yd, yd 2) = 0.8 square meter (m 2) 1 square kilometer (km 2) = 0.4 square mile (sq mi, mi 2)
1 square mile (sq mi, mi 2) = 2.6 square kilometers(km 2)
10,000 square meters (m 2) = 1 hectare (ha) = 2.5 acres
1 acre = 0.4 hectare (he) = 4,000 square meters (m 2)
MASS - WEIGHT (APPROXIMATE) MASS - WEIGHT (APPROXIMATE)
1 ounce (oz) = 28 grams (gm) 1 gram (gm) = 0.036 ounce (oz)
1 pound (lb) = 0.45 kilogram (kg) 1 kilogram (kg) = 2.2 pounds (lb)
1 short ton = 2,000pounds (lb)
= 0.9 tonne (t) 1 tonne (t) ==
1,000 kilograms (kg)1.1 short tons
VOLUME (APPROXIMATE) VOLUME (APPROXIMATE)
1 teaspoon (tsp) = 5 milliliters (ml) 1 milliliter (ml) = 0.03 fluid ounce (fl oz)
1 tablespoon (tbsp) = 15 milliliters (ml) 1 liter (l) = 2.1 pints (pt)
1 fluid ounce (fl oz) = 30 milliliters (ml) 1 liter (l) = 1.06 quarts (qt)
1 cup (c) = 0.24 liter (l) 1 liter (l) = 0.26 gallon (gal)
1 pint (pt) = 0.47 liter (l)
1 quart (qt) = 0.96 liter (l)
1 gallon (gal) = 3.8 liters (l)
1 cubic foot (cu ft, ft 3) = 0.03 cubic meter (m 3) 1 cubic meter (m 3) = 36 cubic feet (cu ft, ft 3)
1 cubic yard (cu yd, yd 3) = 0.76 cubic meter (m 3) 1 cubic meter (m 3) = 1.3 cubic yards (cu yd, yd 3)
TEMPERATURE (EXACT) TEMPERATURE (EXACT)
[(x-32)(5/9)] F = y C [(9/5) y + 32] C = x F
QUICK INCH - CENTIMETER LENGTH CONVERSION10 2 3 4 5
Inches
Centimeters 0 1 3 4 52 6 1110987 1312
QUICK FAHRENHEIT - CELSIUS TEMPERATURE CONVERSION -40° -22° -4° 14° 32° 50° 68° 86° 104° 122° 140° 158° 176° 194° 212°
°F
°C -40° -30° -20° -10° 0° 10° 20° 30° 40° 50° 60° 70° 80° 90° 100°
For more exact and or other conversion factors, see NIST Miscellaneous Publication 286, Units of Weights andMeasures. Price $2.50 SD Catalog No. C13 10286 Updated 6/17/98
8/17/2019 TR Cracking Impact Plastic Composite Ties Final
http://slidepdf.com/reader/full/tr-cracking-impact-plastic-composite-ties-final 5/54
iii
Acknowledgments
A test of this scope required the cooperative effort of several individuals and companies.The Federal Railroad Administration, through Mahmood Fateh of the Office of RailroadPolicy and Development, provided the funding and technical direction for this project.Mr. Richard Lampo of the U.S. Army Corps of Engineers, Engineer Research andDevelopment Center, Construction Engineering Research Laboratory at Champaign, IL,
provided direct technical assistance. Transportation Technology Center, Inc., supportwas provided by Rafael Jimenez and James Rzonca. BNSF Railway provided ties andoutside technical assistance through John Bosshart and Henry Sullivan of TieTek.Without the generous support and cooperation from these individuals and theiremployers, this program could not have been conducted.
8/17/2019 TR Cracking Impact Plastic Composite Ties Final
http://slidepdf.com/reader/full/tr-cracking-impact-plastic-composite-ties-final 6/54
iv
Contents
Executive Summary ............................................................................................................ 1
1 Introduction ................................................................................................................. 2
2 Objectives and Findings .............................................................................................. 33 Approach ..................................................................................................................... 4
4 Methodology ................................................................................................................ 5
5 Ties Evaluated ............................................................................................................. 6
6 Test Matrix .................................................................................................................. 7
6.1 RS Tests — Bending .............................................................................................. 7
6.2 RS Tests — Impact Loading .................................................................................. 7
6.3 Center Bending Tests ........................................................................................... 8
7 Results ......................................................................................................................... 97.1 RS Stiffness: Half-Length Tie Samples, No Fastener System Attached............. 9
7.2 RSP: Half-Length Tie Samples with Holes Predrilled for SS Plates, NoFastener System Attached .................................................................................. 10
7.3 RSP: Half-Length Tie Samples with SS Fastening System Plate Installed ...... 11
7.4 RSP: Half-Length Tie Samples, with Overdriven SS Fastener SystemAttached ............................................................................................................. 13
7.5 RSP: Half-Length Tie Samples with CS Fastener System Attached ................ 14
7.6 RSN: Half-Length Tie Samples with CS Fastener System Attached................ 147.7 RSN: Half-Length Tie Samples with SS Fastener System Attached ................ 16
7.8 RSN Tests by Tie Type ...................................................................................... 17
7.9 Impact Tests: RSP, Half-Length Tie Samples .................................................. 18
7.10 Overall Impact Testing Results .......................................................................... 24
7.11 Full-Length Tie Center Bending — MOE ........................................................... 24
7.12 Full-Length Tie Center Bending — MOR ........................................................... 25
8 Addendum to Test Matrix ......................................................................................... 27
8.1 Overview of Additional Testing for Repeatability ............................................. 278.2 Results Separated by Tie Manufacturer ............................................................. 29
8.3 Summary of Observations: Effects from Tie Aging and Retesting afterOutside Storage .................................................................................................. 34
8.4 Testing Procedures ............................................................................................. 34
8.5 Tie Samples Required to Obtain Statistically Sound Average ........................... 35
8/17/2019 TR Cracking Impact Plastic Composite Ties Final
http://slidepdf.com/reader/full/tr-cracking-impact-plastic-composite-ties-final 7/54
v
9 Discussion of Results and Recommendations ........................................................... 36
9.1 Items to Consider for Further Testing ................................................................ 36
9.2 Recommendations for Future Testing ................................................................ 37
Appendix A. Test Matrix and Codes ............................................................................... 38
Abbreviations and Acronyms ............................................................................................ 44
8/17/2019 TR Cracking Impact Plastic Composite Ties Final
http://slidepdf.com/reader/full/tr-cracking-impact-plastic-composite-ties-final 8/54
vi
Illustrations
Figure 1. Test Setup for RS Stiffness Testing; Supports Are 30 in Apart ....................... 9
Figure 2. RS Bending Stiffness, No Fastening System or Drilled Holes ....................... 10
Figure 3. RSP, Holes Only (New) and Holes from Overdriven SSs, -25°F, No Fastener ..................................................................................................... 11
Figure 4. RSP, Half-Length Tie Test Fixture Setup for SSs Tie Plate SystemFitted to the RS ................................................................................................ 12
Figure 5. RSP Results from Evaluating a SS System on All New Ties ......................... 12
Figure 6. RSP Stiffness Using an Overdriven SS Fastening System Attached ............. 13
Figure 7. RSP Stiffness Using Standard CSs/Tie Plate System with No Predrilling ofHoles on New Ties .......................................................................................... 14
Figure 8. RSN Bending Load Fixture and Setup ........................................................... 15
Figure 9. RSN Bending Test Results, All New Ties, CS Fastening System ................. 15
Figure 10. RSN Bending Results, All New Ties, SS Fastening System ........................ 16
Figure 11. RSN Bending Results, All Ties, Overdriven SS Fastening System ............. 16
Figure 12. RSN Results, All Fastening Systems, for Type A Only ............................... 17
Figure 13. RSN Results, All Fastening Systems, for Type B Only ............................... 17
Figure 14. RSN Results, All Fastening Systems, for Type C Only ............................... 18
Figure 15. Impact Loading Test Fixture and Configuration .......................................... 19
Figure 16. RSP, Type A — Standard SS Plate, Fully Applied with Normal Holes, No Plate, New Ties .......................................................................................... 20
Figure 17. RSP, Type A — SS Plate Overdriven, Fully Applied with OverdrivenHoles Only, No Plate ....................................................................................... 20
Figure 18. RSP, Impact Type A — Overdriven, Standard SS Plate Fully Applied andwith Normal Holes, No Plate .......................................................................... 21
Figure 19. RSP, Impact Type C — SS Fastening System Fully Applied withOverdriven Holes Only, No Tie Plate ............................................................. 22
Figure 20. RSP, New Type B — Standard SS Plate Fully Applied with Normal Holes, No Plate ........................................................................................................... 23
Figure 21. RSP, Type B — SS Plate Overdriven Fully Applied with Overdriven HolesOnly, No Plate ................................................................................................. 23
Figure 22. Tie Test Center Bending Load Fixture Setup ............................................... 24
Figure 23. RS Bending Test Results, Average Stiffness for All Tests ConductedMay 2007 ......................................................................................................... 28
Figure 24. Standard Deviation of Bending Test Results Shown in Figure 23 ............... 28
8/17/2019 TR Cracking Impact Plastic Composite Ties Final
http://slidepdf.com/reader/full/tr-cracking-impact-plastic-composite-ties-final 9/54
vii
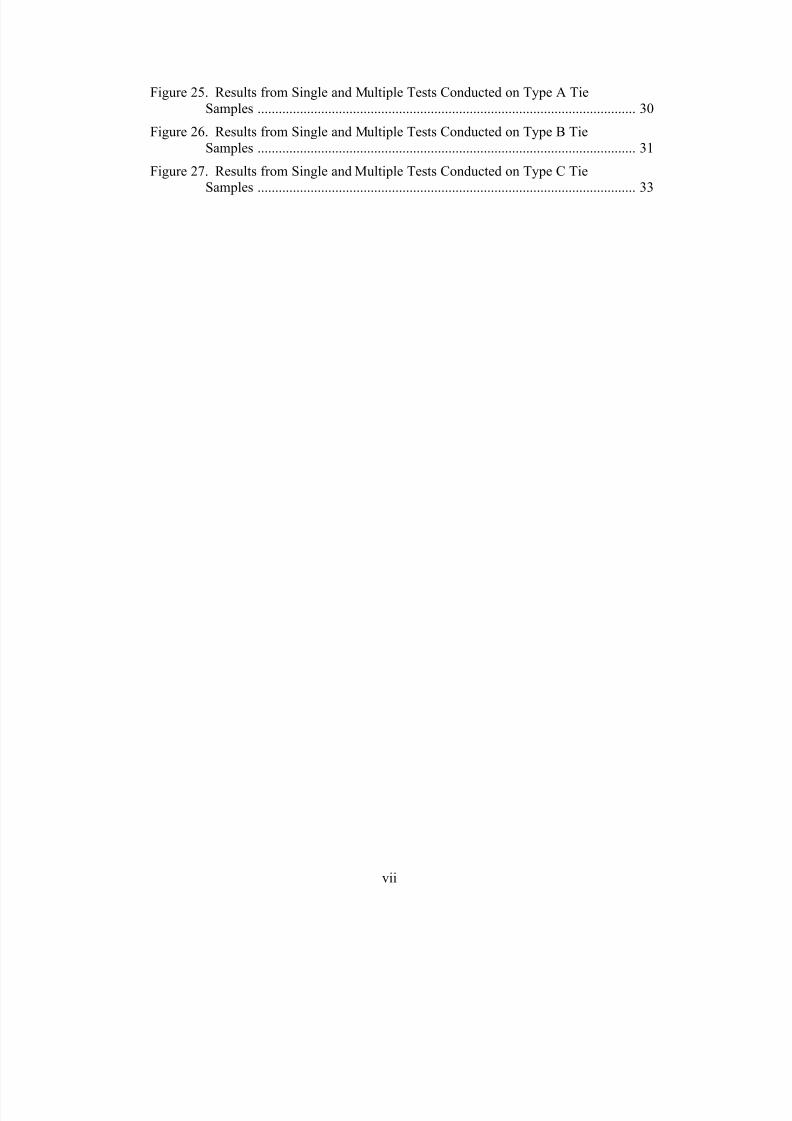
Figure 25. Results from Single and Multiple Tests Conducted on Type A TieSamples ........................................................................................................... 30
Figure 26. Results from Single and Multiple Tests Conducted on Type B TieSamples ........................................................................................................... 31
Figure 27. Results from Single and Multiple Tests Conducted on Type C TieSamples ........................................................................................................... 33
8/17/2019 TR Cracking Impact Plastic Composite Ties Final
http://slidepdf.com/reader/full/tr-cracking-impact-plastic-composite-ties-final 10/54
viii
Tables
Table 1. Summary of Load/Deflection Results — Center Bending ................................ 25
Table 2. MOR Test Results ............................................................................................ 26
Table 3. MOR Summarized Results .............................................................................. 26
8/17/2019 TR Cracking Impact Plastic Composite Ties Final
http://slidepdf.com/reader/full/tr-cracking-impact-plastic-composite-ties-final 11/54
1
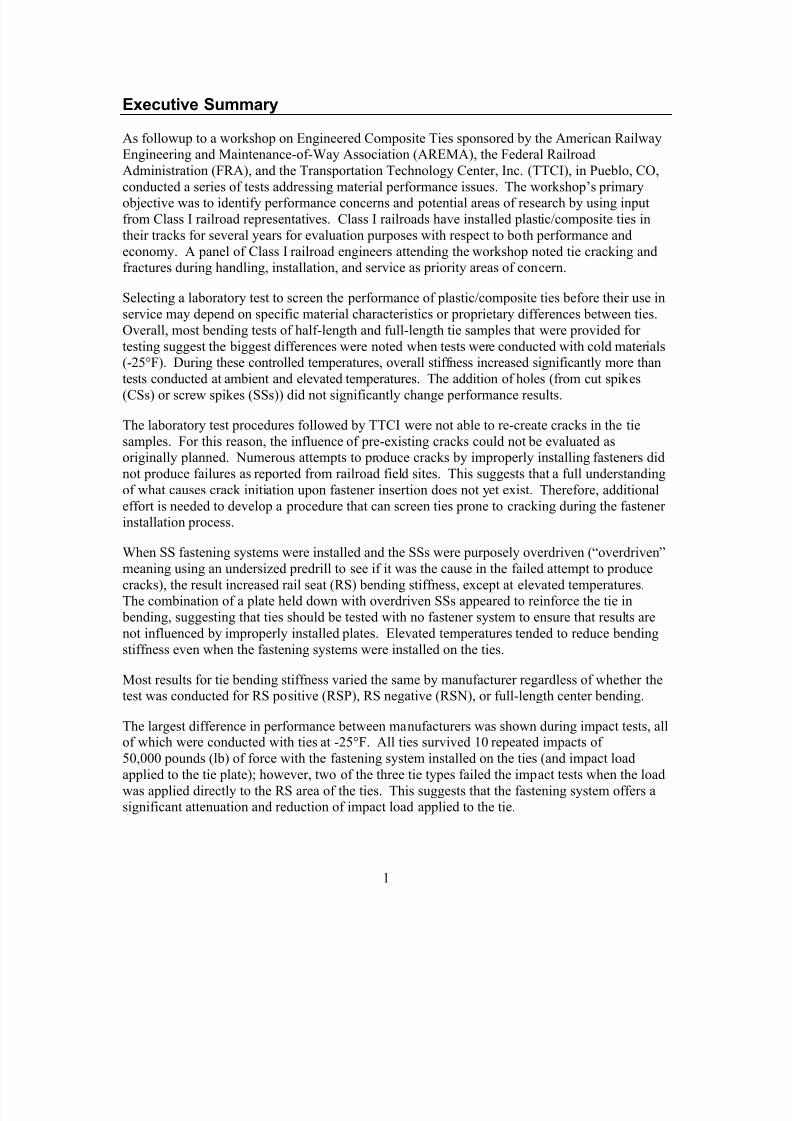
Executive Summary
As followup to a workshop on Engineered Composite Ties sponsored by the American RailwayEngineering and Maintenance-of-Way Association (AREMA), the Federal RailroadAdministration (FRA), and the Transportation Technology Center, Inc. (TTCI), in Pueblo, CO,conducted a series of tests addressing material performance issues. The workshop’s primaryobjective was to identify performance concerns and potential areas of research by using inputfrom Class I railroad representatives. Class I railroads have installed plastic/composite ties intheir tracks for several years for evaluation purposes with respect to both performance andeconomy. A panel of Class I railroad engineers attending the workshop noted tie cracking andfractures during handling, installation, and service as priority areas of concern.
Selecting a laboratory test to screen the performance of plastic/composite ties before their use inservice may depend on specific material characteristics or proprietary differences between ties.Overall, most bending tests of half-length and full-length tie samples that were provided fortesting suggest the biggest differences were noted when tests were conducted with cold materials(-25°F). During these controlled temperatures, overall stiffness increased significantly more thantests conducted at ambient and elevated temperatures. The addition of holes (from cut spikes(CSs) or screw spikes (SSs)) did not significantly change performance results.
The laboratory test procedures followed by TTCI were not able to re-create cracks in the tiesamples. For this reason, the influence of pre-existing cracks could not be evaluated asoriginally planned. Numerous attempts to produce cracks by improperly installing fasteners didnot produce failures as reported from railroad field sites. This suggests that a full understandingof what causes crack initiation upon fastener insertion does not yet exist. Therefore, additionaleffort is needed to develop a procedure that can screen ties prone to cracking during the fastenerinstallation process.
When SS fastening systems were installed and the SSs were purposely overdriven ( ―overdriven ‖ meaning using an undersized predrill to see if it was the cause in the failed attempt to producecracks), the result increased rail seat (RS) bending stiffness, except at elevated temperatures.The combination of a plate held down with overdriven SSs appeared to reinforce the tie in
bending, suggesting that ties should be tested with no fastener system to ensure that results arenot influenced by improperly installed plates. Elevated temperatures tended to reduce bendingstiffness even when the fastening systems were installed on the ties.
Most results for tie bending stiffness varied the same by manufacturer regardless of whether thetest was conducted for RS positive (RSP), RS negative (RSN), or full-length center bending.
The largest difference in performance between manufacturers was shown during impact tests, allof which were conducted with ties at -25°F. All ties survived 10 repeated impacts of50,000 pounds (lb) of force with the fastening system installed on the ties (and impact loadapplied to the tie plate); however, two of the three tie types failed the impact tests when the loadwas applied directly to the RS area of the ties. This suggests that the fastening system offers asignificant attenuation and reduction of impact load applied to the tie.
8/17/2019 TR Cracking Impact Plastic Composite Ties Final
http://slidepdf.com/reader/full/tr-cracking-impact-plastic-composite-ties-final 12/54
2
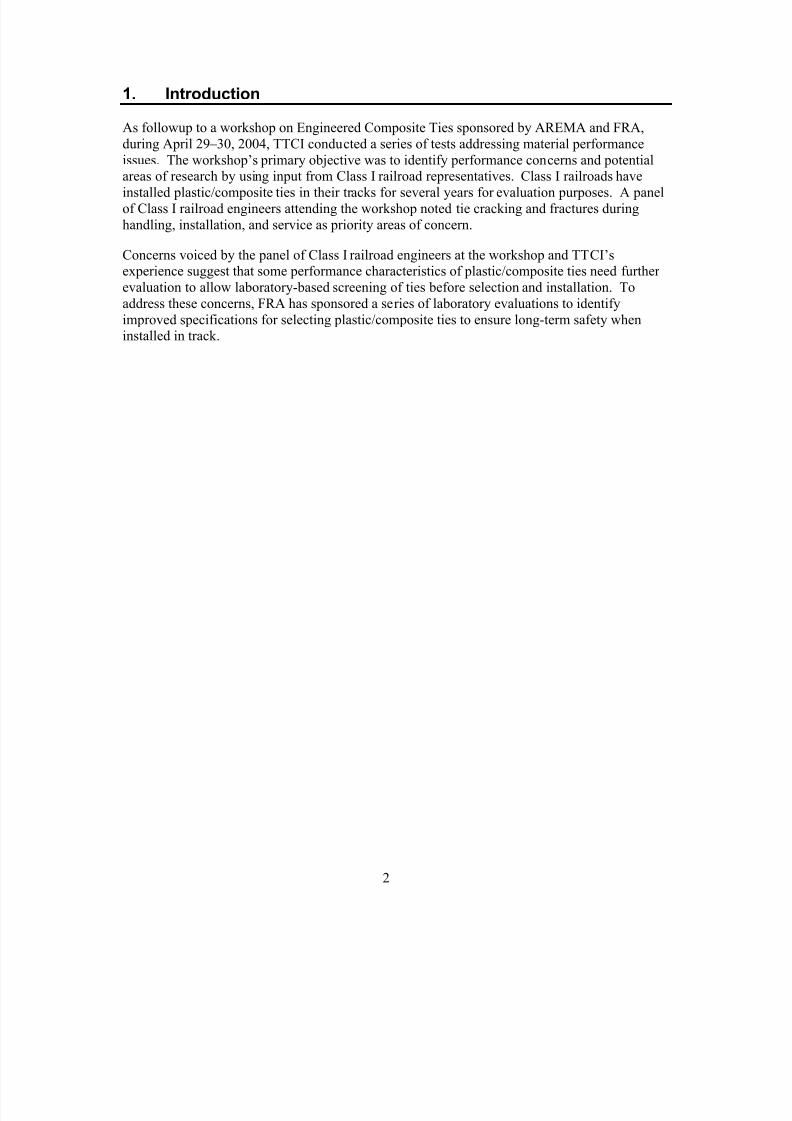
1. Introduction
As followup to a workshop on Engineered Composite Ties sponsored by AREMA and FRA,during April 29 – 30, 2004, TTCI conducted a series of tests addressing material performanceissues. The workshop’s primary objective was to identify performance concerns and potential
areas of research by using input from Class I railroad representatives. Class I railroads haveinstalled plastic/composite ties in their tracks for several years for evaluation purposes. A panelof Class I railroad engineers attending the workshop noted tie cracking and fractures duringhandling, installation, and service as priority areas of concern.
Concerns voiced by the panel of Class I railroad engineers at the workshop and TTCI’sexperience suggest that some performance characteristics of plastic/composite ties need furtherevaluation to allow laboratory-based screening of ties before selection and installation. Toaddress these concerns, FRA has sponsored a series of laboratory evaluations to identifyimproved specifications for selecting plastic/composite ties to ensure long-term safety wheninstalled in track.
8/17/2019 TR Cracking Impact Plastic Composite Ties Final
http://slidepdf.com/reader/full/tr-cracking-impact-plastic-composite-ties-final 13/54
3
2. Objectives and Findings
Many issues related to plastic/composite tie performance were raised at the EngineeredComposite Ties workshop. AREMA Committee 30 used the workshop results to propose futureupdates to Chapter 30, Part 5, of the AREMA Railway Engineering Manual. Questions
regarding major issues with plastic/composite tie performance addressed at the workshop andthat were evaluated in this FRA-sponsored project include the following:
Do the stress risers created by the SS threads as they cut into the plastic/composite tiematerial weaken the RS area?
Does the reduction of cross-sectional area (approximately 10 percent), caused by predrilling for SSs, reduce the bending strength of the RS area with the fastening system(four SSs and tie plate) in place?
Does a plastic/composite tie that is cracked as a result of SS installation provide less bending strength in the RS area with the fastening system (four SSs and tie plate) in
place? What is the bending strength in the RS area with the SSs and tie plate removed when
cracks are present and without cracks?
Because of the wide range of tie plate hole patterns, some railroads prefer to install CSswithout first predrilling a pilot hole. What effect does the wedging force created whenCSs are pressed into the plastic/composite ties have on weakening the RS area?
In a simulated center-bound tie condition (three-point bending), how much center- bending load will result in 1-inch track gage widening? When the load is released, willthe tie be permanently deformed?
The load environment under heavy axle load (HAL) traffic can be quite severe. How do plastic/composite ties perform under simulated impact forces?
What is the effect of ambient temperature on:- Modulus of elasticity (MOE)?- Modulus of rupture (MOR)?- Permanent deformation after bending at the tie center?
8/17/2019 TR Cracking Impact Plastic Composite Ties Final
http://slidepdf.com/reader/full/tr-cracking-impact-plastic-composite-ties-final 14/54
4
3. Approach
Plastic/composite ties from three different manufacturers are beginning to see more widespreaduse in Class I railroad applications. Examples of these ties were selected to obtain performancedata on designs with known performance history. These same three tie types have also been inservice successfully under 39-ton HAL traffic on the High Tonnage Loop (HTL) at the Facilityfor Accelerated Service Testing (FAST) for at least 400 million gross tons (MGT); a few of theinitial plastic/composite ties installed in the HTL have seen 1,000 MGT.
Since the initiation of this test program, two of the three manufacturers have ceased producing plastic/composite ties. Through cooperative efforts from Association of American Railroads(AAR) member railroads (along with purchases from excess stock), TTCI was able to obtain25 new, unused, and properly stored tie samples from three designs. All tie designs tested metthe following criteria:
Tie samples passed all existing, current AREMA Chapter 30 requirements for
plastic/composite ties. A minimum of 10 tie samples had survived in revenue service or at FAST, demonstrating
that they can survive under freight railroad operating conditions.
The FRA Contract Officer Technical Representative approved tie designs selected for testing.
8/17/2019 TR Cracking Impact Plastic Composite Ties Final
http://slidepdf.com/reader/full/tr-cracking-impact-plastic-composite-ties-final 15/54
5
4. Methodology
The Test Implementation Plan generated for this project focused on three areas of interest:
1. RS Bending- In the RS area with each fastening system (CSs, SSs, and their corresponding tie
plates) in place — no cracks in the tie- In the RS area with SS system in place when cracks are present in the tie- In the RS area with the SSs removed — vacant holes — no cracks in the tie- In the RS area with the SSs removed — vacant holes with cracks in the tie- Calculated MOR- Compared with a plastic/composite tie, virgin RS area — never predrilled, never
fastened
- Compared with an oak tie with SSs and tie plate in place2. RS Impact Loading
- In the RS area with SS system in place with no cracks in the tie- In the RS area with SS system in place when cracks are present in the tie- In the RS area with the SSs removed — vacant holes — no cracks in the tie- In the RS area with the SSs removed — vacant holes with cracks in the tie- Accessed RS condition
3. Tie Center Bending
- At the center of the tie — MOE, MOR, and permanent deformation at 1-inch gagewidening
- Compared with published MOE and MOR test results
The tests were performed to produce three-point positive and three-point negative bendingmoments by using a Material Testing System (MTS) machine. Vertical deflection at the neutralaxis, center of each span, was measured using a string potentiometer. A load cell on the MTSmachine was used to measure the applied loads.
The tests were repeated using CSs and SSs at tie-center temperatures of -25°F ( 5), 80°F
(ambient) ( 5) and at 120°F ( 5). The low-temperature requirement was achieved by storingthe test tie samples in a cold storage room at Transportation Technology Center (TTC), inPueblo, CO. Heat lamps were used to raise the test tie samples to the high-temperaturerequirement. A thermocouple was embedded near the center of the test tie samples at the neutralaxis to monitor temperature.
All load and deflection data was collected using TTCI’s electronic data acquisition system . Eachsample tie was used for one test only.
8/17/2019 TR Cracking Impact Plastic Composite Ties Final
http://slidepdf.com/reader/full/tr-cracking-impact-plastic-composite-ties-final 16/54
6
5. Ties Evaluated
Most current plastic composite ties use high-density polyethylene (HDPE) as the primarymanufacturing component. Other materials are added to the basic tie mix for several reasons — one of which is to act as reinforcing material to improve specific physical properties. Ties made
from 100-percent HDPE would be too flexible to hold gage under load or meet the AREMAminimum-bending modulus. Each manufacturer has its own proprietary mix of ingredients and production process. Ties from three manufacturers used in this study have the following genericdescriptions:
Type A: Two different thermoplastics are mixed in this formula. Polystyrene plastic isadded to HDPE as reinforcement.
Type B: HDPE with crystalline mineral fillers added to increase compression strengthand abrasion resistance. Reinforcing fibers are added to increase bending modulus.
Type C: Glass fibers are added to HDPE to increase bending modulus and abrasion
resistance. Type D: Wood (oak) is used as a control.
8/17/2019 TR Cracking Impact Plastic Composite Ties Final
http://slidepdf.com/reader/full/tr-cracking-impact-plastic-composite-ties-final 17/54
7
6. Test Matrix
The Appendix shows a matrix of all ties tested. Each test summary section shows details of thesetup. The following provides an overview of the tests.
6.1 RS Tests—
BendingThe RS tests were performed on half-length tie samples as follows:
CSs: 14-inch tie plate with five CSs — two diagonally opposed anchor spikes, two gage-side rail spikes, and one field-side rail spike — no pilot holes.
The CSd test tie samples were loaded in the center of a 28-inch span.
SSs: 16-inch tie plate with four standard 15/16-inch SSs — 11/16-inch diameter by5-inch-deep pilot holes.
Cracked RS tests: RS cracks were intended for 21 ties by inserting SSs into small-diameter pilot holes. Although this occurs in TTCI’s field test s, laboratory simulations
produced no cracks in ties.
The SSd test tie samples were loaded in the center of a 30-inch span.
The RSs were loaded to a maximum 20-kilopound (kip) vertical load or failure at a rateof 5 kip per minute (min).
Positive moment loads were applied directly onto the tie plates. Negative moment loadswere applied to a 5½ × 9 × 1-inch-thick rubber support (50 durometer, A scale) on the
bottom of the test tie sample directly under the RS. In both cases, a 2 × 9 × 1-inch-thickrubber support (50 durometer, A scale) was used at each reaction point.
6.2 RS Tests —Impact LoadingThe RS tests were performed on half-length tie samples as follows:
Fastening system: 16-inch tie plate with four standard 15/16-inch SSs, 11/16-inchdiameter by 5-inch deep pilot holes, and two e-clip rail fasteners.
Cracked RS tests: RS cracks were intended to be created in six ties by inserting SSs intosmall-diameter pilot holes. Although this created cracks in TTCI’s field test s, thelaboratory simulations did not produce cracks.
The SSd test tie samples were loaded in the center of a 30-inch span.
An impact load, to simulate those caused by wheel flats and special trackwork, wasapplied to a short rail section fastened to the tie sample.
A pretest trial was performed to verify that the impact pulse and duration (delta time) iswithin the range seen in track.
Each test configuration was subjected to 10 impacts.
8/17/2019 TR Cracking Impact Plastic Composite Ties Final
http://slidepdf.com/reader/full/tr-cracking-impact-plastic-composite-ties-final 18/54
8
6.3 Center Bending Tests
The center bending tests were performed on full-length ties as follows:
MOE and Permanent Deformation:- The test ties were loaded at the center of a 60-inch span using a 5½ × 9 × 1-inch-thick
rubber support. A 2 × 9 × 1-inch-thick rubber support (50 durometer, A scale) wasused at each reaction point.
- The vertical load was applied at a crosshead speed of 1 in/min until the tie-centerdeflection measured at the neutral axis reached 2.5 in.
- The 2.5-inch tie-center deflection was held for 30 min at ambient temperature andthen unloaded.
- Residual tie-center deflection were measured once the load is released and again after24 hours.
- MOE was calculated as tangent modulus (from 0 to 400 pounds per square inch (psi)) per American Society for Testing and Materials (ASTM) Standards test methodD6109.
MOR:- The test ties were loaded at the center of a 60-inch span.- The vertical load was applied at a crosshead speed of 1 in/min to a maximum tie-
center deflection of 5 in or failure.- MOR was calculated as per ASTM test method D6109.
8/17/2019 TR Cracking Impact Plastic Composite Ties Final
http://slidepdf.com/reader/full/tr-cracking-impact-plastic-composite-ties-final 19/54
9
7. Results
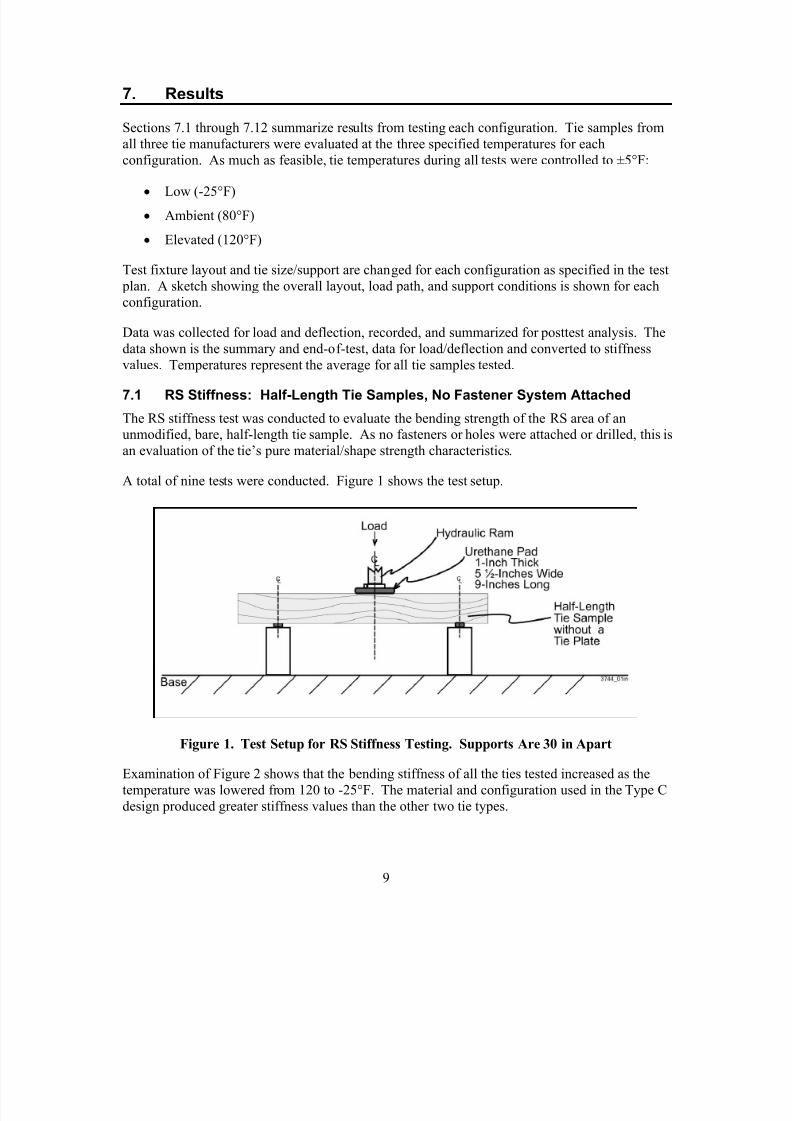
Sections 7.1 through 7.12 summarize results from testing each configuration. Tie samples fromall three tie manufacturers were evaluated at the three specified temperatures for eachconfiguration. As much as feasible, tie temperatures during all tests were controlled to ±5°F:
Low (-25°F)
Ambient (80°F)
Elevated (120°F)
Test fixture layout and tie size/support are changed for each configuration as specified in the test plan. A sketch showing the overall layout, load path, and support conditions is shown for eachconfiguration.
Data was collected for load and deflection, recorded, and summarized for posttest analysis. Thedata shown is the summary and end-of-test, data for load/deflection and converted to stiffnessvalues. Temperatures represent the average for all tie samples tested.
7.1 RS Stiffness: Half-Length Tie Samples, No Fastener System Attached
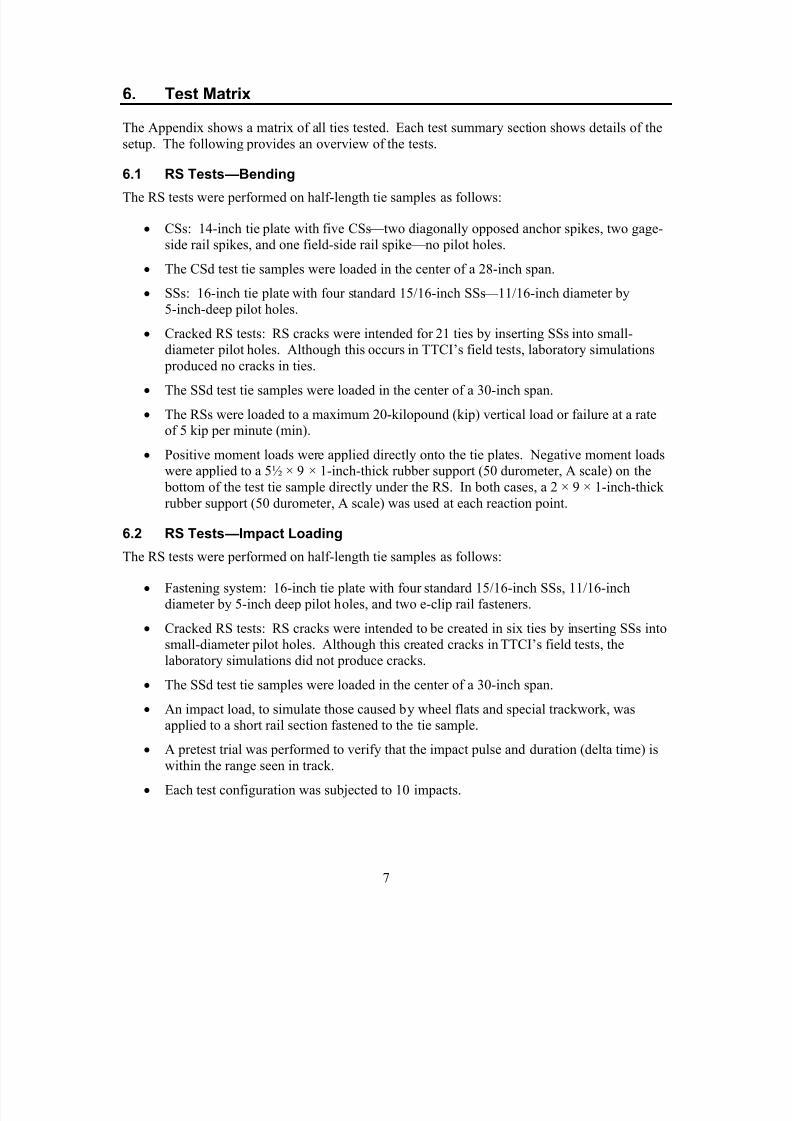
The RS stiffness test was conducted to evaluate the bending strength of the RS area of anunmodified, bare, half-length tie sample. As no fasteners or holes were attached or drilled, this isan evaluation of the tie’s pure material/shape strength characteristics.
A total of nine tests were conducted. Figure 1 shows the test setup.
Figure 1. Test Setup for RS Stiffness Testing. Supports Are 30 in Apart
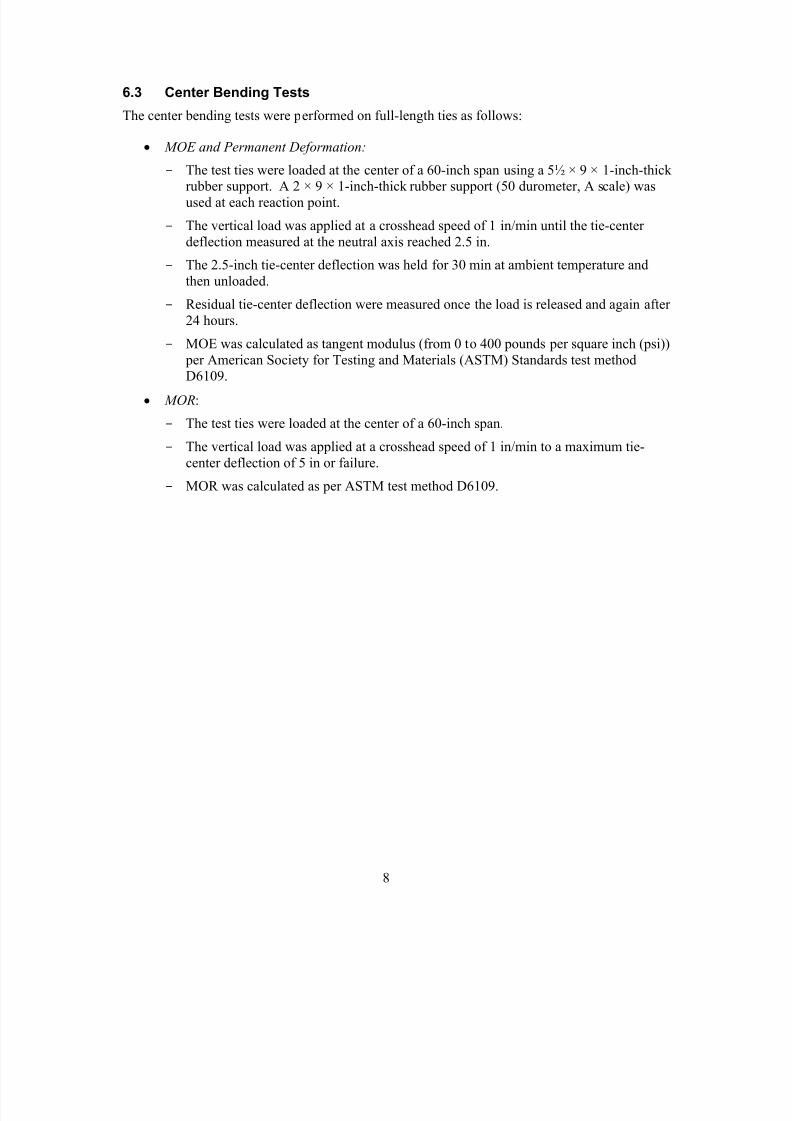
Examination of Figure 2 shows that the bending stiffness of all the ties tested increased as thetemperature was lowered from 120 to -25°F. The material and configuration used in the Type Cdesign produced greater stiffness values than the other two tie types.
8/17/2019 TR Cracking Impact Plastic Composite Ties Final
http://slidepdf.com/reader/full/tr-cracking-impact-plastic-composite-ties-final 20/54
10
Figure 2. RS Bending Stiffness, No Fastening System or Drilled Holes
As this test only evaluates bending stiffness of the tie material, it does not show the effect(increase or decrease) on bending stiffness that may result from the addition of holes, tie plates,or fasteners. Other tests, as outlined in Sections 7.2 through 7.9, repeat these basic evaluationsof RS bending but with the addition of various fastening systems.
No ties failed or broke during these RSP tests.
7.2 RSP: Half-Length Tie Samples with Holes Predrilled for SS Plates, NoFastener System Attached
The RSP bending test was conducted to evaluate the effect of drilling a set of holes into the tiesto hold a SS tie plate on the bending strength of the RS area of a half-length tie sample. Thisseries used a total of six tie samples, two from each of the three manufacturers. None of the tieshad a specific side identified as the top or bottom of the tie; therefore, TTCI arbitrarily selectedthe top of the tie for the purpose of installing the fastening system.
One set of three ties used four holes drilled to the specified size (11/16-inch diameter), whereasthe second set of three ties used overdriven SSs into undersized (7/16-inch diameter) holes.
Overdriven SSs were used to simulate ties with pre-existing cracks. The intent, based on the test plan, was to create ties that had holes with cracks because of improper installation procedures.To obtain such cracks in a repeatable fashion, 5-inch-deep undersized holes of 7/16 in with a5/8 × 1-inch deep counter bore were first drilled in a pattern to hold a SS tie plate (four holes);SSs were then force driven into the holes in an attempt to create cracks initiating from andaround the hole. The counter bore was needed to allow the SS to start. Such cracks have beennoted in field installations of plastic/composite ties when improper (too small) holes were drilledfor SSs. Although TTCI evaluated a number of hole patterns and sizes during pretest trials, none
0 10 20 30 40 50 60 70
80 90
-27 83 120
( T h o u s a n
d s
)
Temperature °F
S t i f f n e s s ( l b / i n )
Type A (3, 2, 1) Type C (69, 68, 67) Type B (36, 35, 34)
8/17/2019 TR Cracking Impact Plastic Composite Ties Final
http://slidepdf.com/reader/full/tr-cracking-impact-plastic-composite-ties-final 21/54
11
of them produced visible cracking on the tie samples tested. This suggests that other factors mayhave been encountered at some field installations where such cracks occurred with someregularity.
For purposes of this project, ties intended to be tested with cracks in the hole area are identifiedas overdriven rather than precracked because no visible cracks were produced.
It was assumed that ties with cracked/overdriven SSs would be most susceptible to increasedfailure when brittle, thus susceptible to failure at lower temperatures. For this comparison, tieswith pre-drilled and overdriven SSs were limited to tie samples tested at -25°F.
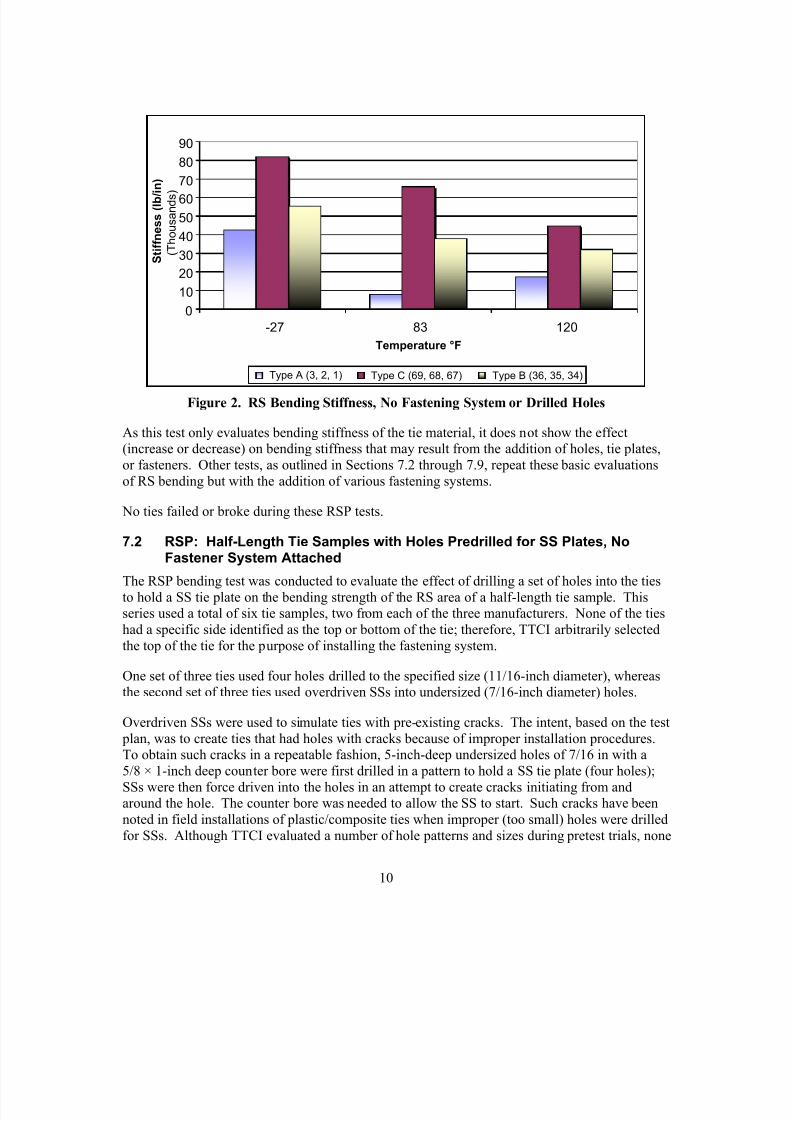
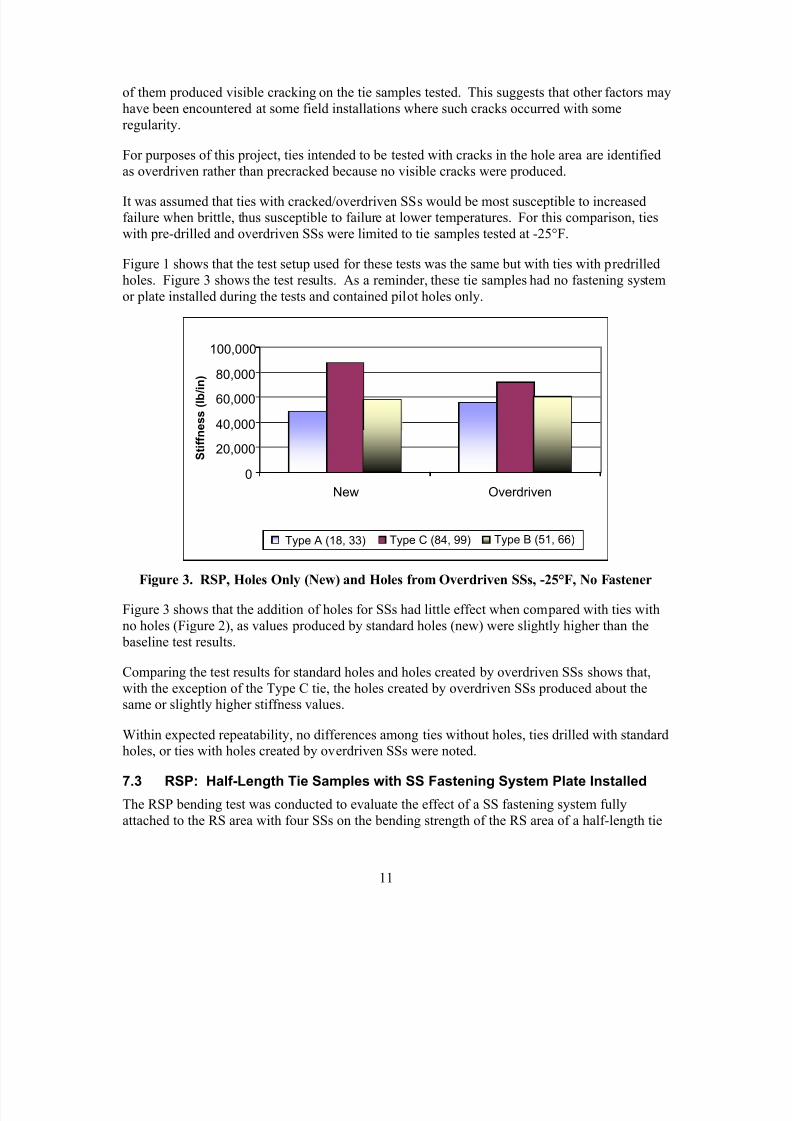
Figure 1 shows that the test setup used for these tests was the same but with ties with predrilledholes. Figure 3 shows the test results. As a reminder, these tie samples had no fastening systemor plate installed during the tests and contained pilot holes only.
Figure 3. RSP, Holes Only (New) and Holes from Overdriven SSs, -25°F, No Fastener
Figure 3 shows that the addition of holes for SSs had little effect when compared with ties withno holes (Figure 2), as values produced by standard holes (new) were slightly higher than the
baseline test results.
Comparing the test results for standard holes and holes created by overdriven SSs shows that,with the exception of the Type C tie, the holes created by overdriven SSs produced about thesame or slightly higher stiffness values.
Within expected repeatability, no differences among ties without holes, ties drilled with standardholes, or ties with holes created by overdriven SSs were noted.
7.3 RSP: Half-Length Tie Samples with SS Fastening System Plate Installed
The RSP bending test was conducted to evaluate the effect of a SS fastening system fullyattached to the RS area with four SSs on the bending strength of the RS area of a half-length tie
0
20,000
40,000
60,000
80,000
100,000
New Overdriven
S t i f f n e s s ( l b / i n )
Type A (18, 33) Type C (84, 99) Type B (51, 66)
8/17/2019 TR Cracking Impact Plastic Composite Ties Final
http://slidepdf.com/reader/full/tr-cracking-impact-plastic-composite-ties-final 22/54
12
sample. SS holes of proper size were predrilled, and SSs were firmly driven into the ties using pneumatic air drivers.
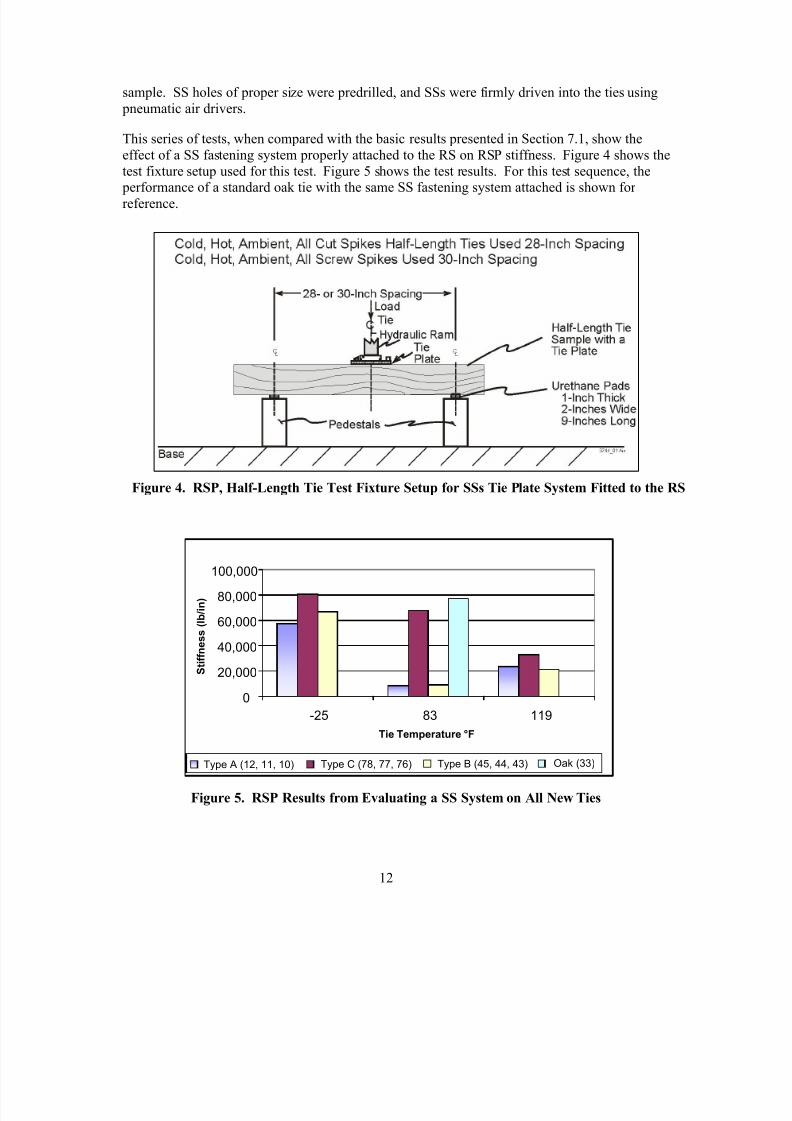
This series of tests, when compared with the basic results presented in Section 7.1, show theeffect of a SS fastening system properly attached to the RS on RSP stiffness. Figure 4 shows thetest fixture setup used for this test. Figure 5 shows the test results. For this test sequence, the
performance of a standard oak tie with the same SS fastening system attached is shown forreference.
Figure 4. RSP, Half-Length Tie Test Fixture Setup for SSs Tie Plate System Fitted to the RS
Figure 5. RSP Results from Evaluating a SS System on All New Ties
0
20,000
40,000
60,000
80,000
100,000
-25 83 119 Tie Temperature °F
S t i f f n e s s ( l b / i n )
Type A (12, 11, 10) Type C (78, 77, 76) Type B (45, 44, 43) Oak (33)
8/17/2019 TR Cracking Impact Plastic Composite Ties Final
http://slidepdf.com/reader/full/tr-cracking-impact-plastic-composite-ties-final 23/54
13
When compared with the data in Figure 2, results suggest a similar trend between elevated andlow temperatures for all ties. Both the Type A and Type B ties exhibited a reduction in stiffnessat ambient temperature (compared with elevated temperatures) with the SS fastening systemattached. With no fastening system, this trend was noticeable only with the Type C tie.
When overall bending stiffness values are compared, the addition of the SS fastening systemincreased stiffness, especially in the tests conducted at low temperature. This increase in
bending stiffness as a result of the installation of the fastening system was not consistentlyobtained at other temperature conditions, suggesting the actual force and seating of the tie platemay not have been uniform in all cases.
Overall, the addition of a SS fastening system fully attached to the RS increased the stiffness at-25°F, whereas for other temperatures some tie samples exhibited a reduction in stiffness.
7.4 RSP: Half-Length Tie Samples, with Overdriven SS Fastener SystemAttached
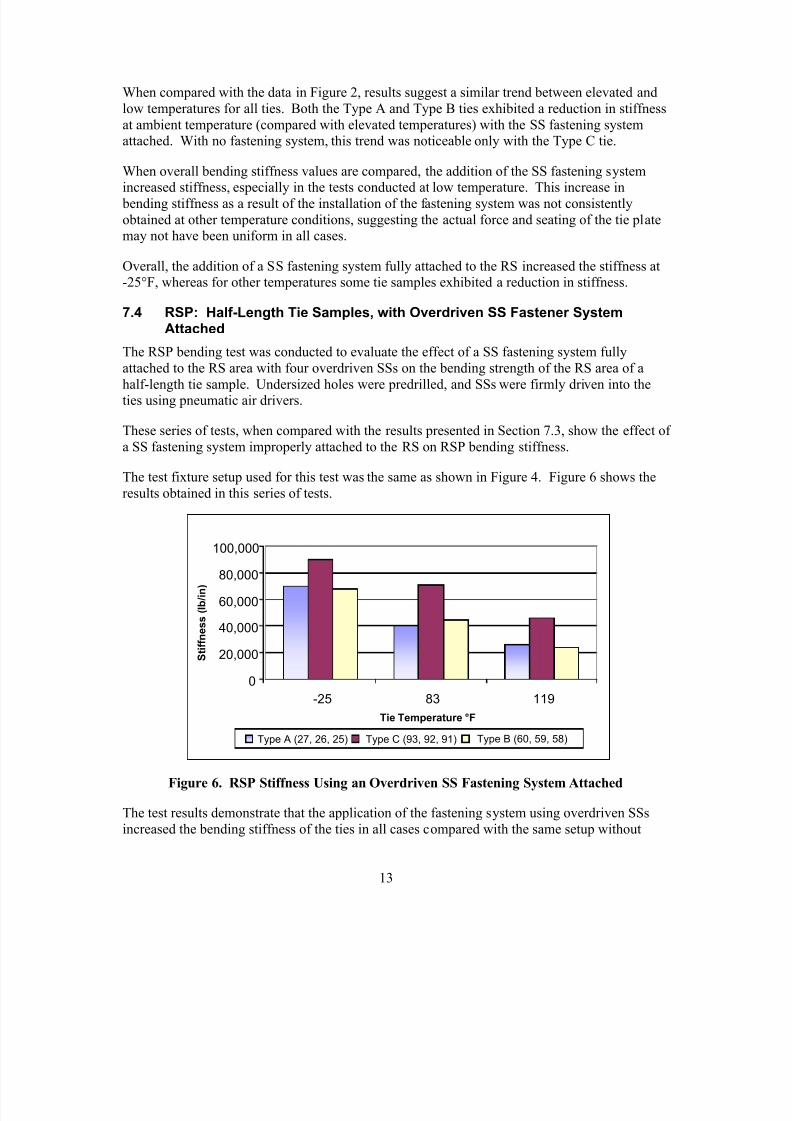
The RSP bending test was conducted to evaluate the effect of a SS fastening system fullyattached to the RS area with four overdriven SSs on the bending strength of the RS area of ahalf-length tie sample. Undersized holes were predrilled, and SSs were firmly driven into theties using pneumatic air drivers.
These series of tests, when compared with the results presented in Section 7.3, show the effect ofa SS fastening system improperly attached to the RS on RSP bending stiffness.
The test fixture setup used for this test was the same as shown in Figure 4. Figure 6 shows theresults obtained in this series of tests.
Figure 6. RSP Stiffness Using an Overdriven SS Fastening System Attached
The test results demonstrate that the application of the fastening system using overdriven SSsincreased the bending stiffness of the ties in all cases compared with the same setup without
0
20,000
40,000
60,000
80,000
100,000
-25 83 119
Tie Temperature °F
S t i f f n e s s ( l b / i n )
Type A (27, 26, 25) Type C (93, 92, 91) Type B (60, 59, 58)
8/17/2019 TR Cracking Impact Plastic Composite Ties Final
http://slidepdf.com/reader/full/tr-cracking-impact-plastic-composite-ties-final 24/54
14
overdriven SSs (Figure 5). The largest increase was noted in the low temperature test, whereaselevated temperature testing indicated the least increase in bending stiffness.
7.5 RSP: Half-Length Tie Samples with CS Fastener System Attached
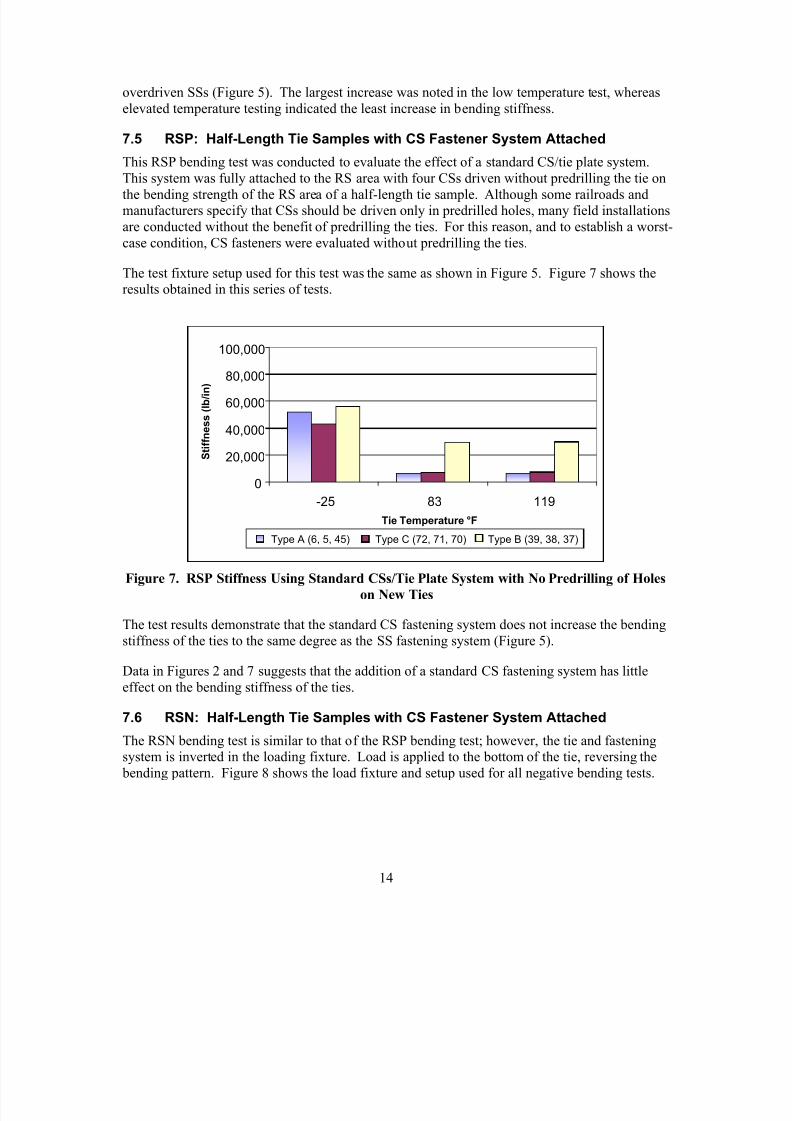
This RSP bending test was conducted to evaluate the effect of a standard CS/tie plate system.
This system was fully attached to the RS area with four CSs driven without predrilling the tie onthe bending strength of the RS area of a half-length tie sample. Although some railroads andmanufacturers specify that CSs should be driven only in predrilled holes, many field installationsare conducted without the benefit of predrilling the ties. For this reason, and to establish a worst-case condition, CS fasteners were evaluated without predrilling the ties.
The test fixture setup used for this test was the same as shown in Figure 5. Figure 7 shows theresults obtained in this series of tests.
Figure 7. RSP Stiffness Using Standard CSs/Tie Plate System with No Predrilling of Holeson New Ties
The test results demonstrate that the standard CS fastening system does not increase the bendingstiffness of the ties to the same degree as the SS fastening system (Figure 5).
Data in Figures 2 and 7 suggests that the addition of a standard CS fastening system has littleeffect on the bending stiffness of the ties.
7.6 RSN: Half-Length Tie Samples with CS Fastener System AttachedThe RSN bending test is similar to that of the RSP bending test; however, the tie and fasteningsystem is inverted in the loading fixture. Load is applied to the bottom of the tie, reversing the
bending pattern. Figure 8 shows the load fixture and setup used for all negative bending tests.
0
20,000
40,000
60,000
80,000
100,000
-25 83 119 Tie Temperature °F
S t i f f n e s s ( l b / i n )
Type A (6, 5, 45) Type C (72, 71, 70) Type B (39, 38, 37)

8/17/2019 TR Cracking Impact Plastic Composite Ties Final
http://slidepdf.com/reader/full/tr-cracking-impact-plastic-composite-ties-final 25/54
15
Figure 8. RSN Bending Load Fixture and Setup
The RSN bending test was conducted to determine whether the application of reverse loadingwith the holes/fastening system attached to the ties leads to premature breakage or reducedstiffness.
Figure 9 shows the results for the ties equipped with a CS fastening system.
Figure 9. RSN Bending Test Results, All New Ties, CS Fastening System
Results of RSN bending tests, when compared with those obtained in the RSP bending tests(Section 7.5), show mixed effects. At the low temperature, only the Type A tie exhibited anyreduced stiffness (slight) under negative bending, whereas at ambient temperature, it wassubstantially higher. The Type B tie exhibited greater stiffness under positive bending at roomand elevated temperatures.
0 10 20 30 40 50 60
70
-30 83 117
( T h o u s a n
d s )
Temperature °F
T i e S t i f f n e s s ( l b / i n )
Type A Type C Type B
8/17/2019 TR Cracking Impact Plastic Composite Ties Final
http://slidepdf.com/reader/full/tr-cracking-impact-plastic-composite-ties-final 26/54
16
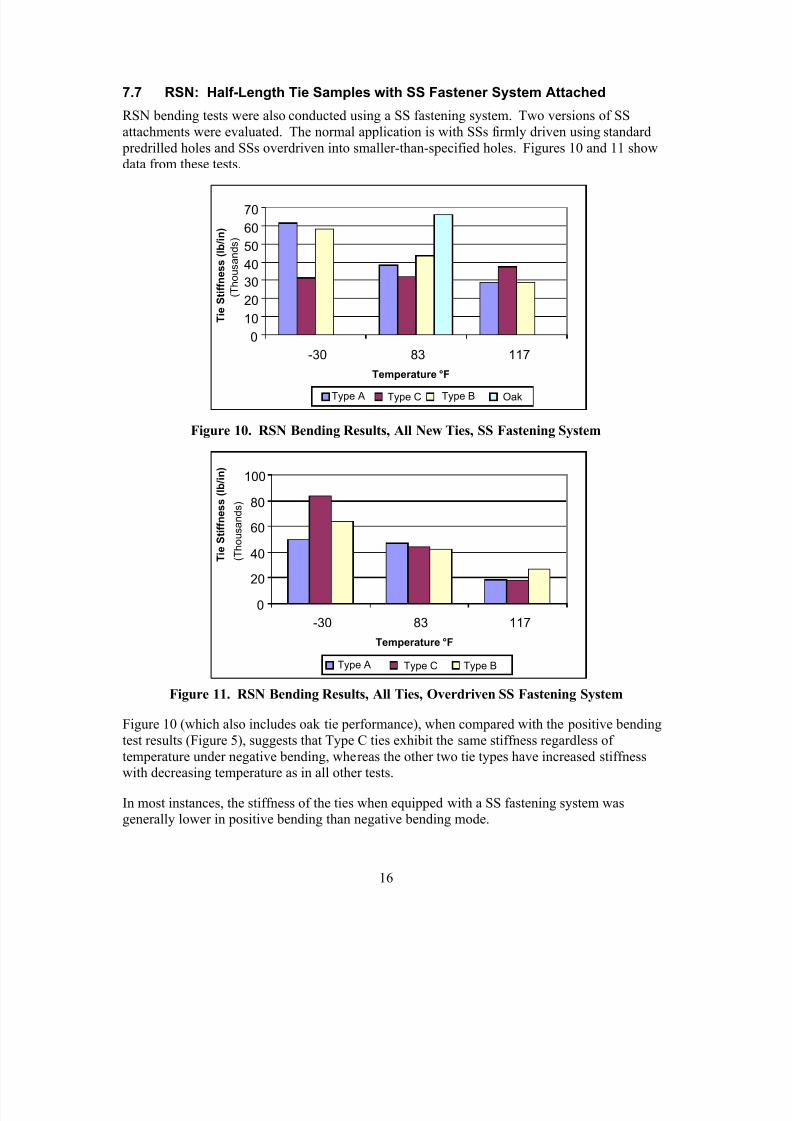
7.7 RSN: Half-Length Tie Samples with SS Fastener System Attached
RSN bending tests were also conducted using a SS fastening system. Two versions of SSattachments were evaluated. The normal application is with SSs firmly driven using standard
predrilled holes and SSs overdriven into smaller-than-specified holes. Figures 10 and 11 showdata from these tests.
Figure 10. RSN Bending Results, All New Ties, SS Fastening System
Figure 11. RSN Bending Results, All Ties, Overdriven SS Fastening System
Figure 10 (which also includes oak tie performance), when compared with the positive bendingtest results (Figure 5), suggests that Type C ties exhibit the same stiffness regardless oftemperature under negative bending, whereas the other two tie types have increased stiffnesswith decreasing temperature as in all other tests.
In most instances, the stiffness of the ties when equipped with a SS fastening system wasgenerally lower in positive bending than negative bending mode.
0 10 20 30 40 50 60 70
-30 83 117
( T h o u s a n
d s
)
Temperature °F
T i e S t i f f n e s s ( l b / i n )
Type A Type C Type B Oak
0
20
40
60
80
100
-30 83 117
( T h o u s a n
d s
)
Temperature °F
T i e S t i f f n e s s ( l b / i n )
Type A Type C Type B
8/17/2019 TR Cracking Impact Plastic Composite Ties Final
http://slidepdf.com/reader/full/tr-cracking-impact-plastic-composite-ties-final 27/54
17
Overdriving the SSs (Section 7.4) had the effect of reducing stiffness at elevated temperature,less of an influence at ambient temperature, and mixed results at the low temperature.
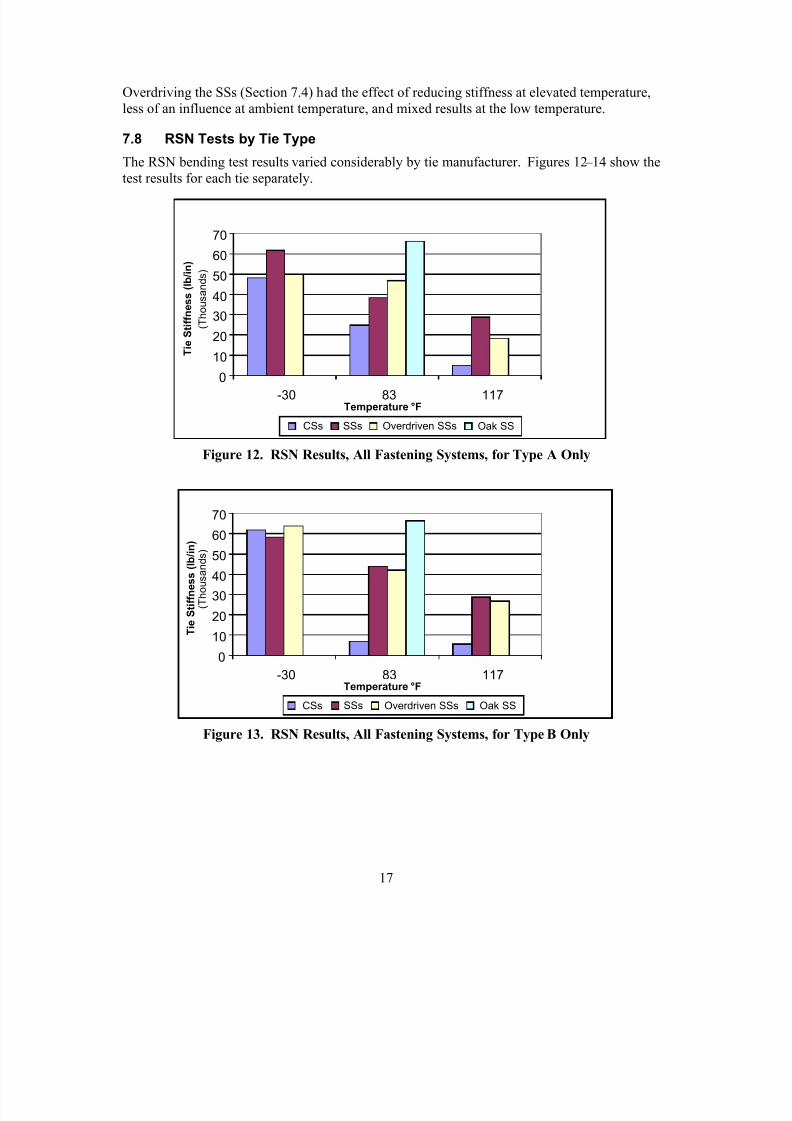
7.8 RSN Tests by Tie Type
The RSN bending test results varied considerably by tie manufacturer. Figures 12 – 14 show the
test results for each tie separately.
Figure 12. RSN Results, All Fastening Systems, for Type A Only
Figure 13. RSN Results, All Fastening Systems, for Type B Only
0 10
20 30 40 50 60 70
-30 83 117
( T h o u s a n
d s
)
Temperature °F
T i e S t i f f n e s s ( l b / i n )
CSs SSs Overdriven SSs Oak SS
0 10 20 30 40 50 60
70
-30 83 117
( T h o u s a n
d s
)
Temperature °F
T i e S t i f f n e s s ( l b / i n )
CSs SSs Overdriven SSs Oak SS
8/17/2019 TR Cracking Impact Plastic Composite Ties Final
http://slidepdf.com/reader/full/tr-cracking-impact-plastic-composite-ties-final 28/54
18
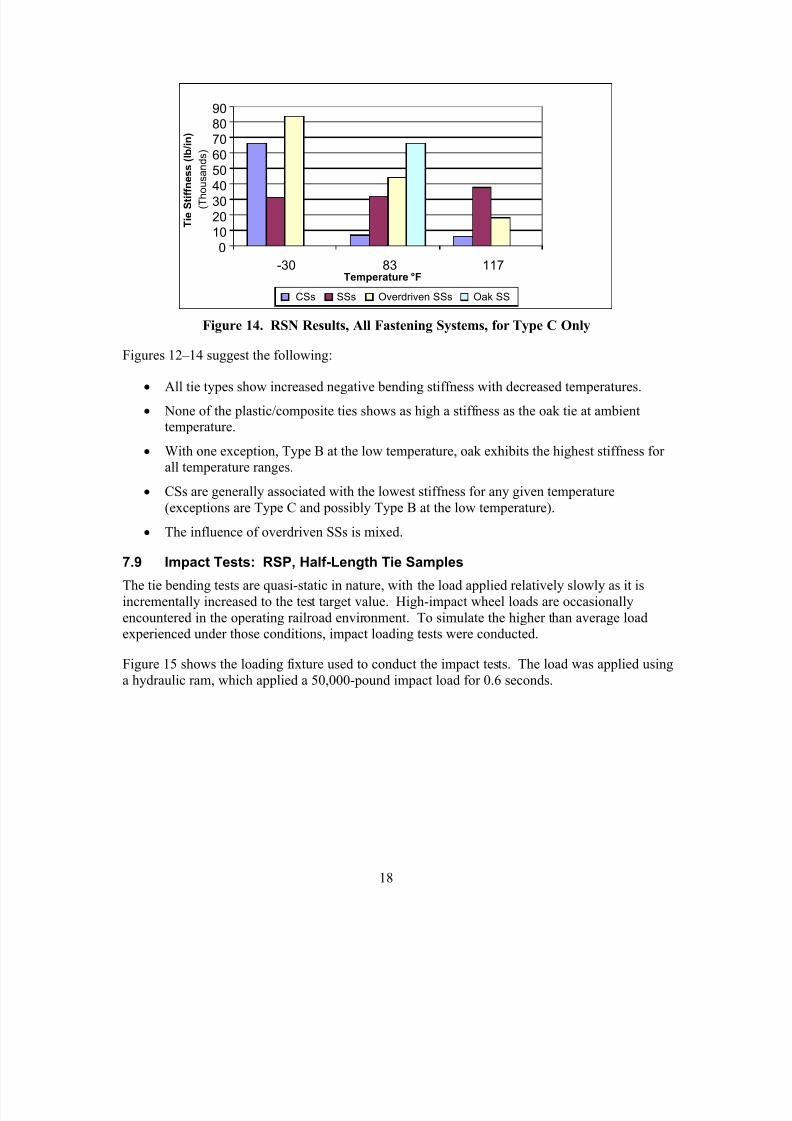
Figure 14. RSN Results, All Fastening Systems, for Type C Only
Figures 12 – 14 suggest the following:
All tie types show increased negative bending stiffness with decreased temperatures.
None of the plastic/composite ties shows as high a stiffness as the oak tie at ambienttemperature.
With one exception, Type B at the low temperature, oak exhibits the highest stiffness forall temperature ranges.
CSs are generally associated with the lowest stiffness for any given temperature(exceptions are Type C and possibly Type B at the low temperature).
The influence of overdriven SSs is mixed.7.9 Impact Tests: RSP, Half-Length Tie Samples
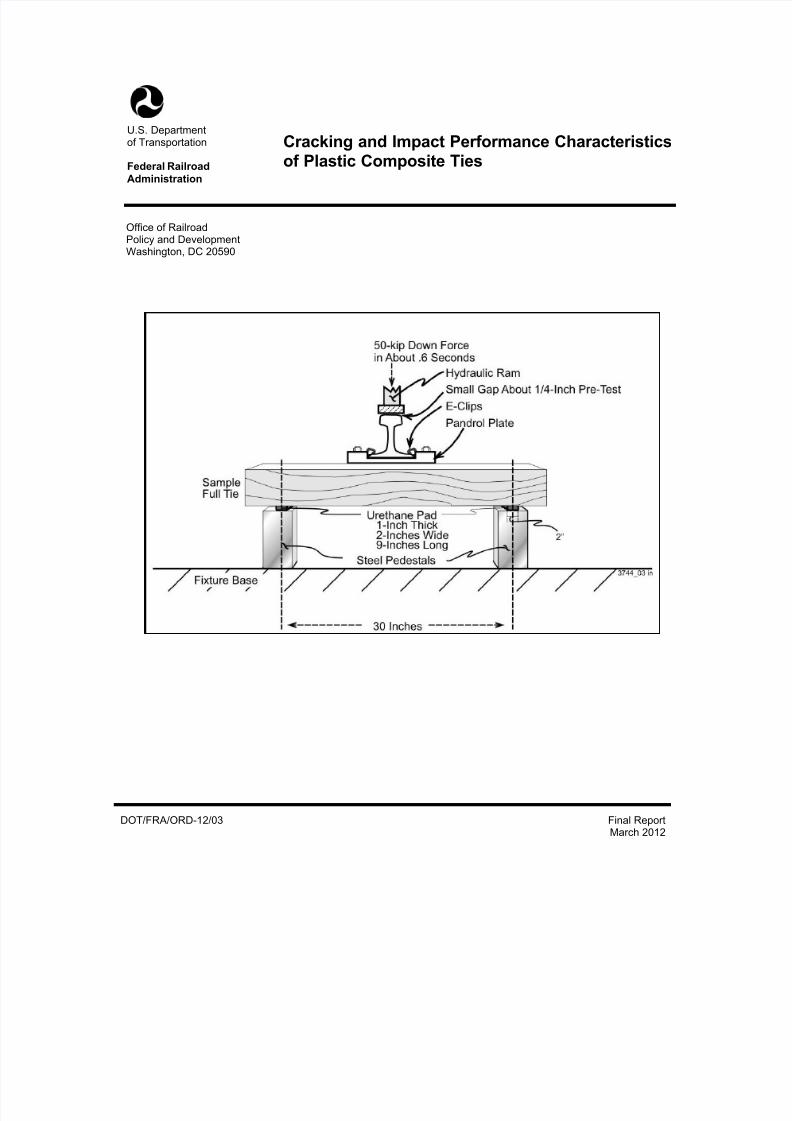
The tie bending tests are quasi-static in nature, with the load applied relatively slowly as it isincrementally increased to the test target value. High-impact wheel loads are occasionallyencountered in the operating railroad environment. To simulate the higher than average loadexperienced under those conditions, impact loading tests were conducted.
Figure 15 shows the loading fixture used to conduct the impact tests. The load was applied usinga hydraulic ram, which applied a 50,000-pound impact load for 0.6 seconds.
0 10 20 30 40 50 60 70 80 90
-30 83 117
( T h o u s a n
d s
)
Temperature °F
T i e S t i f f n e s s
( l b / i n )
CSs SSs Overdriven SSs Oak SS
8/17/2019 TR Cracking Impact Plastic Composite Ties Final
http://slidepdf.com/reader/full/tr-cracking-impact-plastic-composite-ties-final 29/54
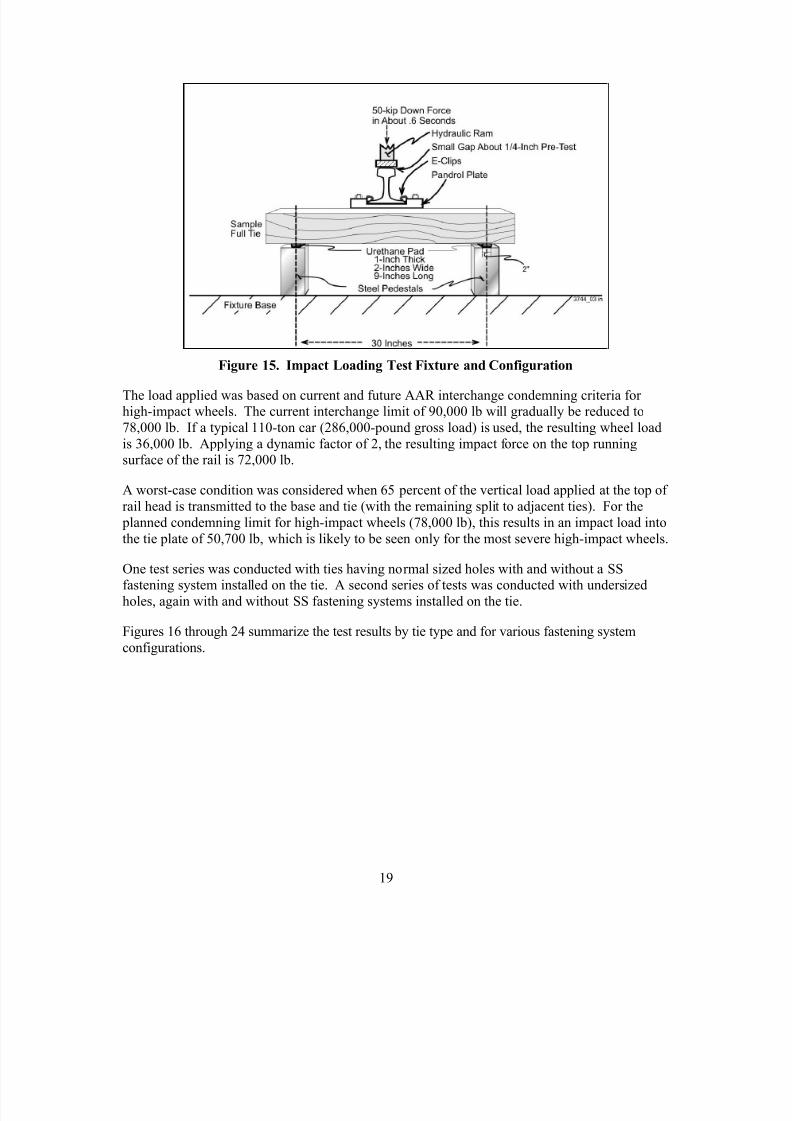
19
Figure 15. Impact Loading Test Fixture and Configuration
The load applied was based on current and future AAR interchange condemning criteria forhigh-impact wheels. The current interchange limit of 90,000 lb will gradually be reduced to78,000 lb. If a typical 110-ton car (286,000-pound gross load) is used, the resulting wheel loadis 36,000 lb. Applying a dynamic factor of 2, the resulting impact force on the top runningsurface of the rail is 72,000 lb.
A worst-case condition was considered when 65 percent of the vertical load applied at the top ofrail head is transmitted to the base and tie (with the remaining split to adjacent ties). For the
planned condemning limit for high-impact wheels (78,000 lb), this results in an impact load intothe tie plate of 50,700 lb, which is likely to be seen only for the most severe high-impact wheels.
One test series was conducted with ties having normal sized holes with and without a SSfastening system installed on the tie. A second series of tests was conducted with undersizedholes, again with and without SS fastening systems installed on the tie.
Figures 16 through 24 summarize the test results by tie type and for various fastening systemconfigurations.
8/17/2019 TR Cracking Impact Plastic Composite Ties Final
http://slidepdf.com/reader/full/tr-cracking-impact-plastic-composite-ties-final 30/54
20
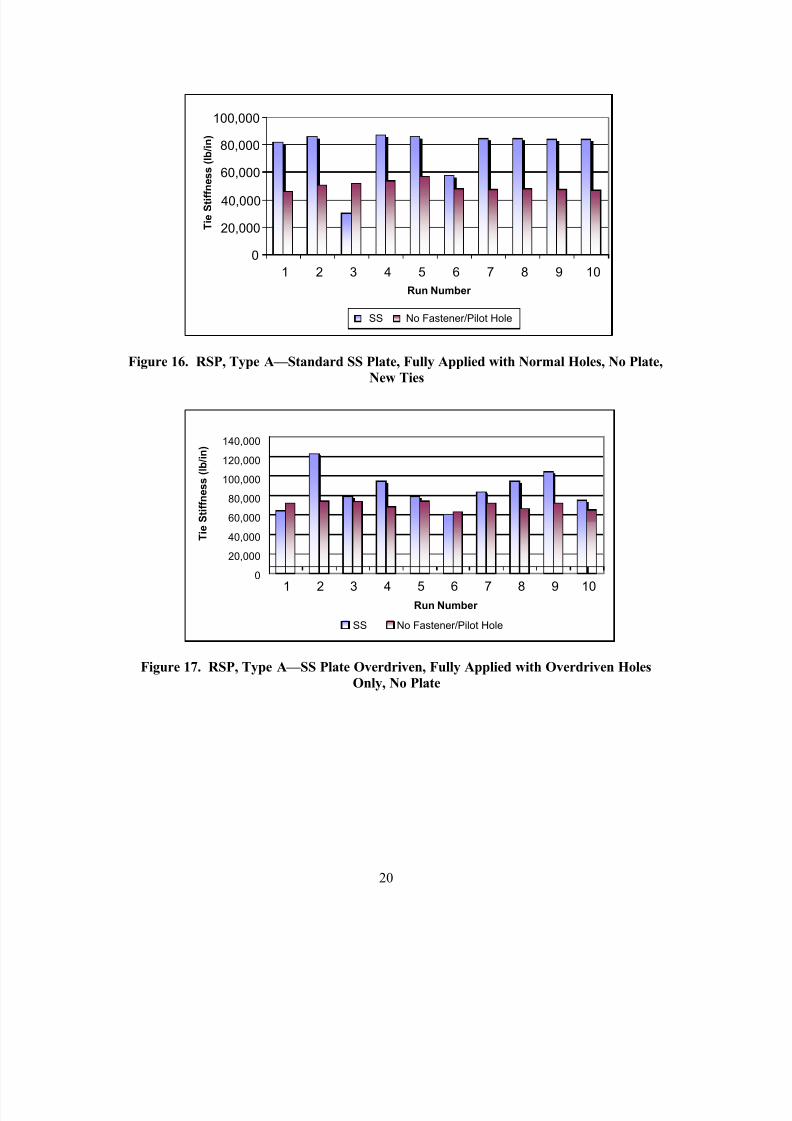
Figure 16. RSP, Type A — Standard SS Plate, Fully Applied with Normal Holes, No Plate,New Ties
Figure 17. RSP, Type A — SS Plate Overdriven, Fully Applied with Overdriven HolesOnly, No Plate
0 20,000 40,000
60,000 80,000
100,000 120,000 140,000
1 2 3 4 5 6 7 8 9 10 Run Number
T i e S t i f f n e s s ( l b / i n )
0
20,000
40,000 60,000
80,000
100,000
1 2 3 4 5 6 7 8 9 10 Run Number
T i e S t i f f n e s s
( l b / i n )
SS No Fastener/Pilot Hole
140,000
120,000
100,000
80,000
60,000
40,00020,000
0
SS No Fastener/Pilot Hole
8/17/2019 TR Cracking Impact Plastic Composite Ties Final
http://slidepdf.com/reader/full/tr-cracking-impact-plastic-composite-ties-final 31/54
21
All ties were tested at -25°F. In each case, new half-length tie sections were used for each seriesof 10 impacts. The tie was positioned in the test fixture; then, 10 repeated impacts of 50,000 lbeach were applied while measuring the deflection of the tie. The stiffness value for each impactis shown for run numbers 1 through 10. All ties survived 10 impacts when the SS system wasapplied, as shown in blue. The no fastener/pilot hole bars represent the 10 impacts when no
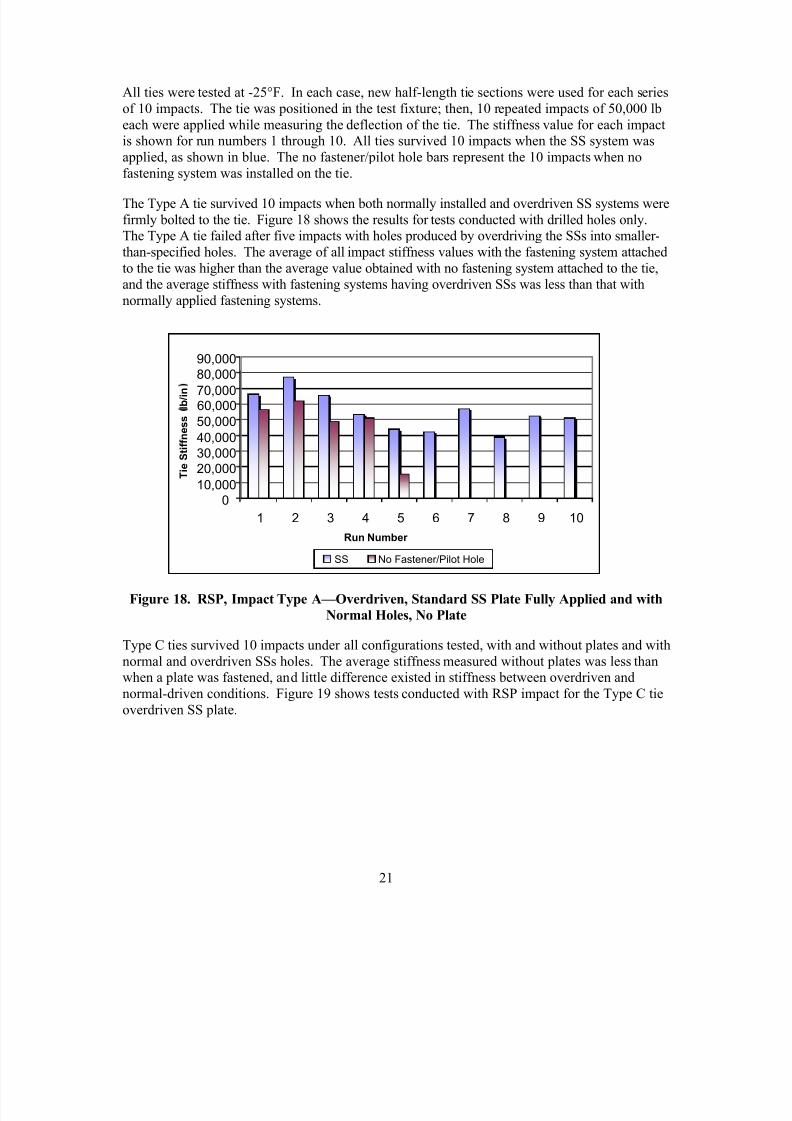
fastening system was installed on the tie.The Type A tie survived 10 impacts when both normally installed and overdriven SS systems werefirmly bolted to the tie. Figure 18 shows the results for tests conducted with drilled holes only.The Type A tie failed after five impacts with holes produced by overdriving the SSs into smaller-than-specified holes. The average of all impact stiffness values with the fastening system attachedto the tie was higher than the average value obtained with no fastening system attached to the tie,and the average stiffness with fastening systems having overdriven SSs was less than that withnormally applied fastening systems.
Figure 18. RSP, Impact Type A — Overdriven, Standard SS Plate Fully Applied and withNormal Holes, No Plate
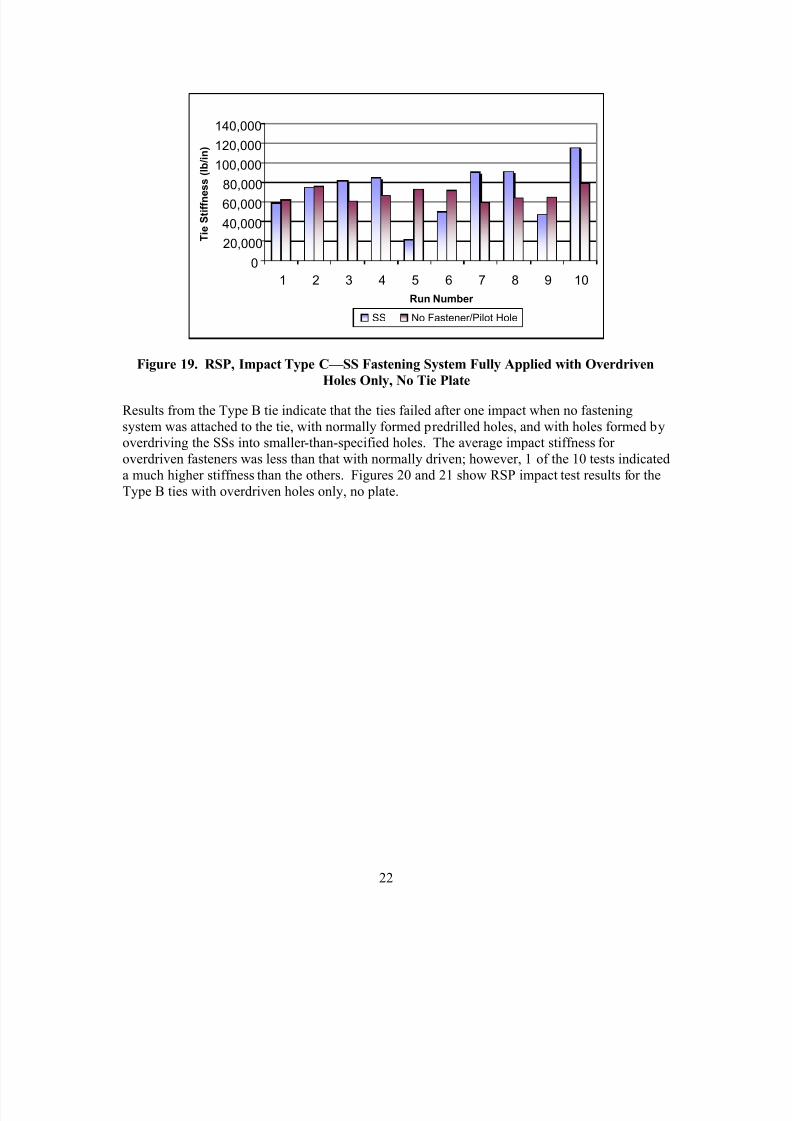
Type C ties survived 10 impacts under all configurations tested, with and without plates and withnormal and overdriven SSs holes. The average stiffness measured without plates was less thanwhen a plate was fastened, and little difference existed in stiffness between overdriven andnormal-driven conditions. Figure 19 shows tests conducted with RSP impact for the Type C tie
overdriven SS plate.
0 10,000 20,000 30,000 40,000 50,000
70,000 80,000 90,000
1 2 3 4 5 6 7 8 9 10
Run Number
T i e S t i f f n e s s l b / i n
SS No Fastener/Pilot Hole
60,000
8/17/2019 TR Cracking Impact Plastic Composite Ties Final
http://slidepdf.com/reader/full/tr-cracking-impact-plastic-composite-ties-final 32/54
22
Figure 19. RSP, Impact Type C — SS Fastening System Fully Applied with OverdrivenHoles Only, No Tie Plate
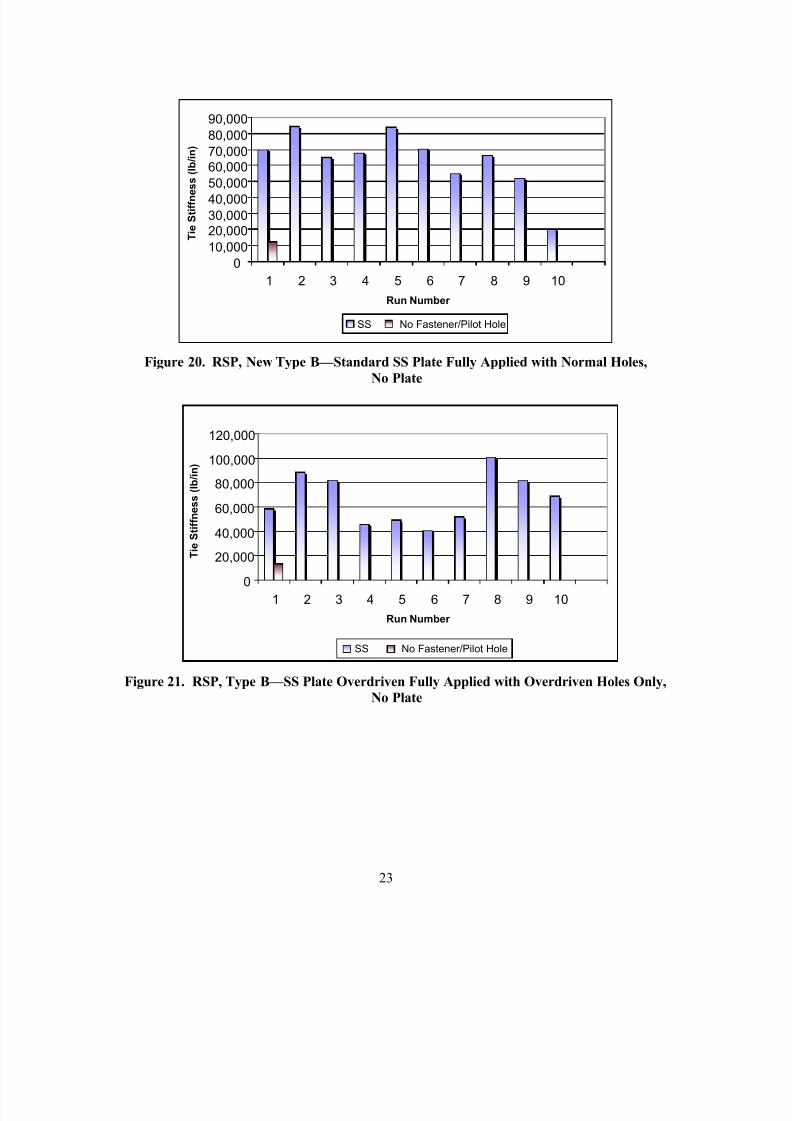
Results from the Type B tie indicate that the ties failed after one impact when no fasteningsystem was attached to the tie, with normally formed predrilled holes, and with holes formed byoverdriving the SSs into smaller-than-specified holes. The average impact stiffness foroverdriven fasteners was less than that with normally driven; however, 1 of the 10 tests indicateda much higher stiffness than the others. Figures 20 and 21 show RSP impact test results for theType B ties with overdriven holes only, no plate.
0 20,000 40,000 60,000 80,000
100,000 120,000 140,000
1 2 3 4 5 6 7 8 9 10 Run Number
T i e S t i f f n e s s ( l b / i n )
SS No Fastener/Pilot Hole
8/17/2019 TR Cracking Impact Plastic Composite Ties Final
http://slidepdf.com/reader/full/tr-cracking-impact-plastic-composite-ties-final 33/54
23
Figure 20. RSP, New Type B — Standard SS Plate Fully Applied with Normal Holes,No Plate
Figure 21. RSP, Type B — SS Plate Overdriven Fully Applied with Overdriven Holes Only,No Plate
0 10,000 20,000 30,000 40,000 50,000 60,000 70,000 80,000 90,000
1 2 3 4 5 6 7 8 9 10
Run Number
T i e S t i f f n e s s ( l b / i n )
SS No Fastener/Pilot Hole
0
20,000 40,000
60,000
80,000
100,000
120,000
1 2 3 4 5 6 7 8 9 10
Run Number
T i e S t i f f n e s s ( l b / i n )
SS No Fastener/Pilot Hole
8/17/2019 TR Cracking Impact Plastic Composite Ties Final
http://slidepdf.com/reader/full/tr-cracking-impact-plastic-composite-ties-final 34/54
24
7.10 Overall Impact Testing Results
Impact test results indicate that no ties failed when the fastening system was firmly attached tothe ties, but two of the three tie types failed before 10 impacts when no fastening system wasattached.
This suggests that ties in the field with loose or worn fastening systems may become moresusceptible to fracture from exposure to impact loads.
7.11 Full-Length Tie Center Bending —MOE
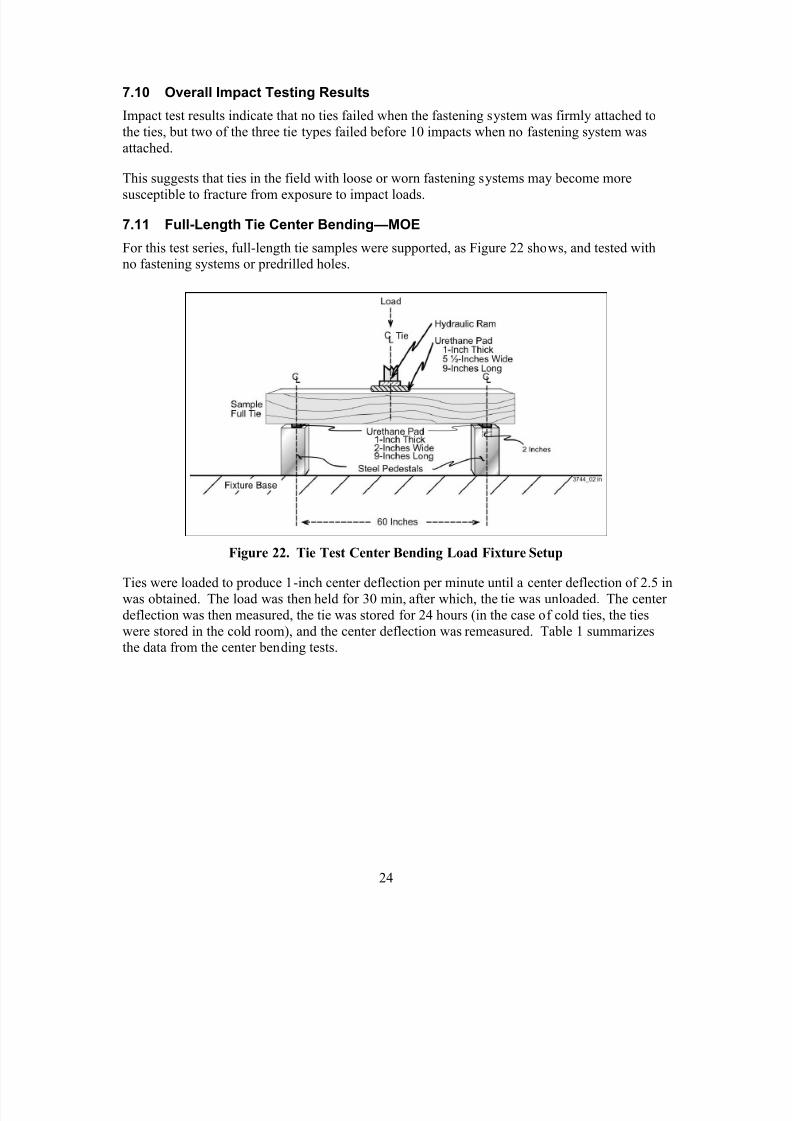
For this test series, full-length tie samples were supported, as Figure 22 shows, and tested withno fastening systems or predrilled holes.
Figure 22. Tie Test Center Bending Load Fixture Setup
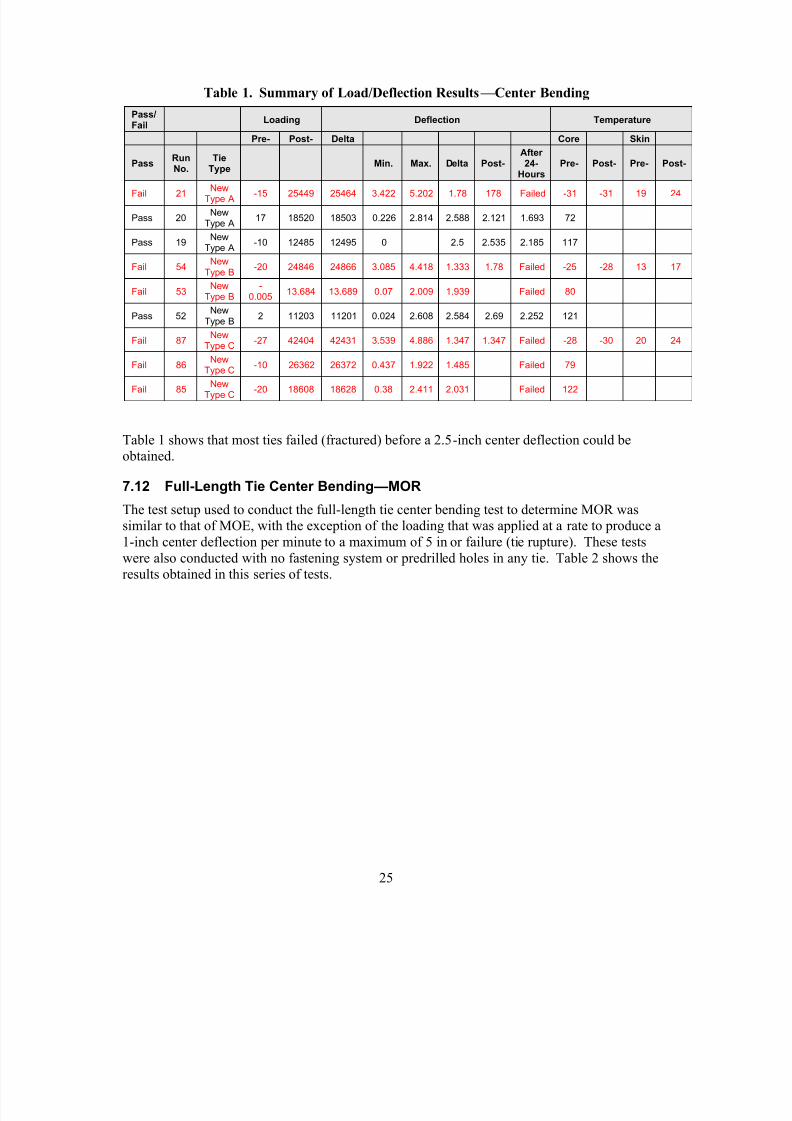
Ties were loaded to produce 1-inch center deflection per minute until a center deflection of 2.5 inwas obtained. The load was then held for 30 min, after which, the tie was unloaded. The centerdeflection was then measured, the tie was stored for 24 hours (in the case of cold ties, the tieswere stored in the cold room), and the center deflection was remeasured. Table 1 summarizesthe data from the center bending tests.
8/17/2019 TR Cracking Impact Plastic Composite Ties Final
http://slidepdf.com/reader/full/tr-cracking-impact-plastic-composite-ties-final 35/54
25
Table 1. Summary of Load/Deflection Results — Center BendingPass/Fail Loading Deflection Temperature
Pre- Post- Delta Core Skin
Pass RunNo.
TieType Min. Max. Delta Post-
After24-
Hours
Pre- Post- Pre- Post-
Fail 21 NewType A -15 25449 25464 3.422 5.202 1.78 178 Failed -31 -31 19 24
Pass 20 NewType A 17 18520 18503 0.226 2.814 2.588 2.121 1.693 72
Pass 19 NewType A -10 12485 12495 0 2.5 2.535 2.185 117
Fail 54 NewType B -20 24846 24866 3.085 4.418 1.333 1.78 Failed -25 -28 13 17
Fail 53 NewType B
-0.005 13.684 13.689 0.07 2.009 1.939 Failed 80
Pass 52 NewType B 2 11203 11201 0.024 2.608 2.584 2.69 2.252 121
Fail 87 NewType C -27 42404 42431 3.539 4.886 1.347 1.347 Failed -28 -30 20 24
Fail 86 NewType C -10 26362 26372 0.437 1.922 1.485 Failed 79
Fail 85 NewType C -20 18608 18628 0.38 2.411 2.031 Failed 122
Table 1 shows that most ties failed (fractured) before a 2.5-inch center deflection could beobtained.
7.12 Full-Length Tie Center Bending —MOR
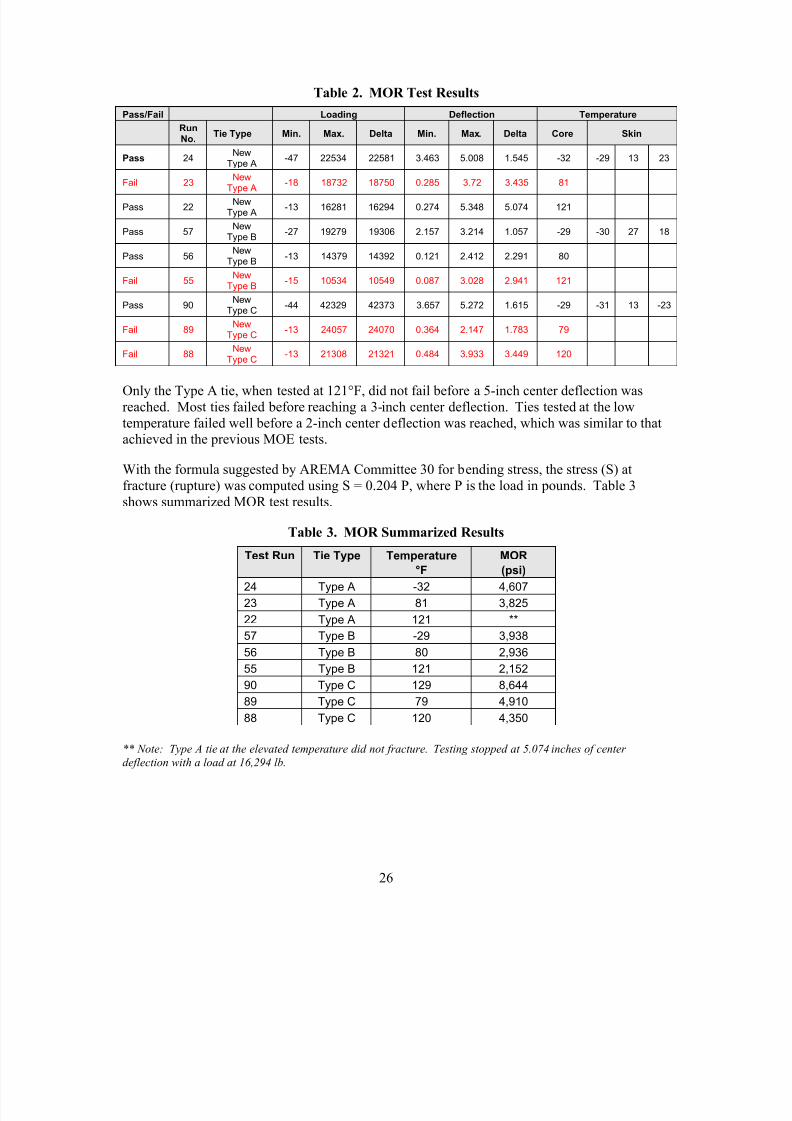
The test setup used to conduct the full-length tie center bending test to determine MOR wassimilar to that of MOE, with the exception of the loading that was applied at a rate to produce a1-inch center deflection per minute to a maximum of 5 in or failure (tie rupture). These testswere also conducted with no fastening system or predrilled holes in any tie. Table 2 shows theresults obtained in this series of tests.
8/17/2019 TR Cracking Impact Plastic Composite Ties Final
http://slidepdf.com/reader/full/tr-cracking-impact-plastic-composite-ties-final 36/54
26
Table 2. MOR Test ResultsPass/Fail Loading Deflection Temperature
RunNo. Tie Type Min. Max. Delta Min. Max. Delta Core Skin
Pass 24 NewType A -47 22534 22581 3.463 5.008 1.545 -32 -29 13 23
Fail 23 NewType A -18 18732 18750 0.285 3.72 3.435 81
Pass 22 NewType A -13 16281 16294 0.274 5.348 5.074 121
Pass 57 NewType B -27 19279 19306 2.157 3.214 1.057 -29 -30 27 18
Pass 56 NewType B -13 14379 14392 0.121 2.412 2.291 80
Fail 55 NewType B -15 10534 10549 0.087 3.028 2.941 121
Pass 90 NewType C -44 42329 42373 3.657 5.272 1.615 -29 -31 13 -23
Fail 89 NewType C -13 24057 24070 0.364 2.147 1.783 79
Fail 88New
Type C -13 21308 21321 0.484 3.933 3.449 120
Only the Type A tie, when tested at 121°F, did not fail before a 5-inch center deflection wasreached. Most ties failed before reaching a 3-inch center deflection. Ties tested at the lowtemperature failed well before a 2-inch center deflection was reached, which was similar to thatachieved in the previous MOE tests.
With the formula suggested by AREMA Committee 30 for bending stress, the stress (S) atfracture (rupture) was computed using S = 0.204 P, where P is the load in pounds. Table 3shows summarized MOR test results.
Table 3. MOR Summarized ResultsTest Run Tie Type Temperature
°FMOR(psi)
24 Type A -32 4,60723 Type A 81 3,82522 Type A 121 **57 Type B -29 3,93856 Type B 80 2,93655 Type B 121 2,15290 Type C 129 8,64489 Type C 79 4,910
88 Type C 120 4,350
** Note: Type A tie at the elevated temperature did not fracture. Testing stopped at 5.074 inches of centerdeflection with a load at 16,294 lb.
8/17/2019 TR Cracking Impact Plastic Composite Ties Final
http://slidepdf.com/reader/full/tr-cracking-impact-plastic-composite-ties-final 37/54
27
8. Addendum to Test Matrix
After assessing results from over 130 tests (all of which were single tests on individual tiesamples), reviewers raised a concern regarding variability within materials and statisticalsignificance of the data. To stay within the budget limitation of the statement of work, which
directed the test plan, only the numbers of tests called for in the statement of work wereconducted. This resulted in one tie sample per test for each variation of temperature and tie plate/fastening system. These results, from 130 variations, have been evaluated and reported as per the deliverable requirements.
During the tie acquisition process, extra tie samples were obtained as a contingency in case ofdamage during testing; thus, an opportunity to conduct additional testing on the remaining tiesample existed. A critical review of test results indicated some variations that did not followexpected trends. From this list of questionable results and the inventory of available half-lengthtie samples, a matrix for testing remaining tie samples within the remaining budget was prepared.To conduct the additional tests, approval was received to address the questionable results and to
improve overall statistical soundness of some key data.Specifically, additional tests were conducted to:
Determine variability in RS bending for several nearly identical tie samples from thesame manufacturer or two half-lengths of the same tie.
Determine variability of repeated tests on the same tie sample.
Confirm the influence, if any, of CS tie plates in their ability to increase bendingstiffness.
Confirm the influence, if any, of SS tie plates to increase bending stiffness.
8.1 Overview of Additional Testing for Repeatability
Average bending stiffness of multiple tie samples was determined using the remaining tiesamples as follows:
Tie-only (half-length tie, no holes or fasteners) tie samples from all three manufacturerswere evaluated to determine RS stiffness. These RS stiffness tests were performed onnew ties and are shown as RS/New.
After RS stiffness testing, these same tie samples had tie plates attached with CSs andRSP bending tests conducted. Figures 23 and 24 show the data plots as RSP/Used/CS.
Sufficient, new (untested) ties from Type C were available for RSP testing and were prepared with tie plates attached with CSs. Figures 23 and 24 show these results asRSP/New/CS.
Sufficient, new (untested) ties from Type B were available for RSP testing and were prepared with SSs and tie plates. Figures 23 and 24 show these results as RSP/New/SS.

8/17/2019 TR Cracking Impact Plastic Composite Ties Final
http://slidepdf.com/reader/full/tr-cracking-impact-plastic-composite-ties-final 38/54
28
Figure 23 shows the results of RS bending. Figure 24 shows the corresponding standarddeviation for these results.
Figure 23. RS Bending Test Results, Average Stiffness for All Tests Conducted May 2007
Figure 24. Standard Deviation of Bending Test Results Shown in Figure 23
0 5,000
10,000 15,000 20,000 25,000 30,000 35,000 40,000 45,000 50,000
A v e r a g e
S t i f f n e s s ( l b / i n )
R S / N e w
R S P / U s e
d /
C
S
R S P
/ N e w
/
C
S
R S P / N e w
/
S
S
Type A Type B Type C
0 1,000 2,000 3,000 4,000 5,000
6,000 7,000 8,000 9,000
S t i f f n e s s S T D
R S / N e w
R S P / U s e
d /
C S
R S P / N e w
/
C S
R S P / N e w
/
S S
Type A Type B Type C
8/17/2019 TR Cracking Impact Plastic Composite Ties Final
http://slidepdf.com/reader/full/tr-cracking-impact-plastic-composite-ties-final 39/54
29
Results of RS area bending tests performed on ties with and without fastening systems(Figure 23) suggest the following:
CS Fasteners: Results show that the addition of tie plates with CSs resulted in a veryslight reduction of measured stiffness (approximately 10 percent) for Type A and Type B
ties. The same stiffness tests conducted on the Type C material show that the addition oftie plates with CSs on used and new ties resulted in a significant lower stiffness comparedwith a bare tie (approximately a 22-percent reduction).
Therefore, although conventional wisdom suggests the addition of a tie plate should stiffen theRS area, results of these multiple tests suggest that this was not the case. For the ties evaluated,the addition of tie plates with cuts spikes actually lowered the measured stiffness.
SS Fasteners: Results conducted on the Type B ties, where sufficient tie samples wereavailable to conduct multiple tests, show an increase in stiffness compared to bare ties(approximately a 19-percent increased stiffness). In addition, ties with SSs producedhigher stiffness than ties with CSs from that same manufacturer (approximately a40-percent increase).
Variability: The standard deviation (Figure 24) for the Type A and Type B test resultswas relatively low compared with the results for Type C ties, which exhibited a muchhigher variation. This suggests a higher variation in material properties from tie to tiewith Type C ties. The number of repeated runs for each test configuration was stillrelatively low (approximately five) because of the limited tie samples available. Resultssuggest that more testing of multiple tie samples from a range of ties in each batch isneeded to ensure that viable values are being obtained.
8.2 Results Separated by Tie Manufacturer
Figures 25, 26, and 27 show the results by manufacturer (Type A, Type B, and Type C,respectively).
8.2.1 Type A Tie Samples Resu lts
Figure 25, results for Type A, includes the following notes:
The first entry pair, shown as 06 and marked as tie samples 2 and 5, is the result from theoriginal matrix (conducted December 2006). The second entry pair marked 07 isthe result from testing conducted in May 2007 on the same tie samples tested inDecember 2006.
All other entries (P1-A and P1-B through P3-B/4) were tested in May 2007.- P1, P2, P3, and P4 indicate a number of full-length ties for inventory control.- P1-A and P1-B indicate the two half-length tie samples from the same tie (P1). The
same marking procedure holds for P2-A, P2-B, P3-A, and P3-B.- Four example tests on tie samples P3-B are as follows: first, P3-B1; second, P3-B2;
third, P3-B3; and fourth, P3-B4.

8/17/2019 TR Cracking Impact Plastic Composite Ties Final
http://slidepdf.com/reader/full/tr-cracking-impact-plastic-composite-ties-final 40/54
30
Tie sample P1-B shows no data for a test conducted for RSP/Used/CS. This tie samplewas tested first new for RS, but during the spiking operation in preparation for RSPtesting, however, the tie fractured. No RSP was performed.
Figure 25. Results from Single and Multiple Tests Conducted on Type A Tie Samples
Results for the Type A tie samples indicate and suggest the following:
Tie samples 2 and 5 exhibited very large (250 percent) increases in stiffness from theDecember 2006 to May 2007 tests. It is not certain at this time if aging (from outsidestorage of this tie sample), any potential differences in test setup, or differences in thetemperature between December 2006 and May 2007 tests could explain this largediscrepancy between results.
Four multiple repeated tests conducted at the same time (P3-B to P3-B/4) producedvirtually identical results. No degradation or change in stiffness was noted over fourrepeated tests.
This suggests that the test results are repeatable within a given tie sample.
The May 2007 test results suggest little variation between the different ties tested. The addition of CSs had little effect on stiffness when compared with a bare tie.
Tie sample P1-B was the only tie sample that cracked during spiking operations fortesting conducted in December 2006 and May 2007.
Type A Ties
0 10,000
20,000
30,000
40,000
50,000
60,000
70,000
06 07 P1-A P1-B P2-A P2-B P3-A P3-B P3-B/2 P3-B/3 P3-B/4
Tie Sample
S t i f f n e s s ( l b / i n )
RS RSP/Used/CS
C r a c k e d
@ S
p i k i n g
S a m p l e
2
S a m p l e
5
S a m p l e
2
S a m p l e
5
8/17/2019 TR Cracking Impact Plastic Composite Ties Final
http://slidepdf.com/reader/full/tr-cracking-impact-plastic-composite-ties-final 41/54
31
8.2.2 Type B Tie Samples Resu lts
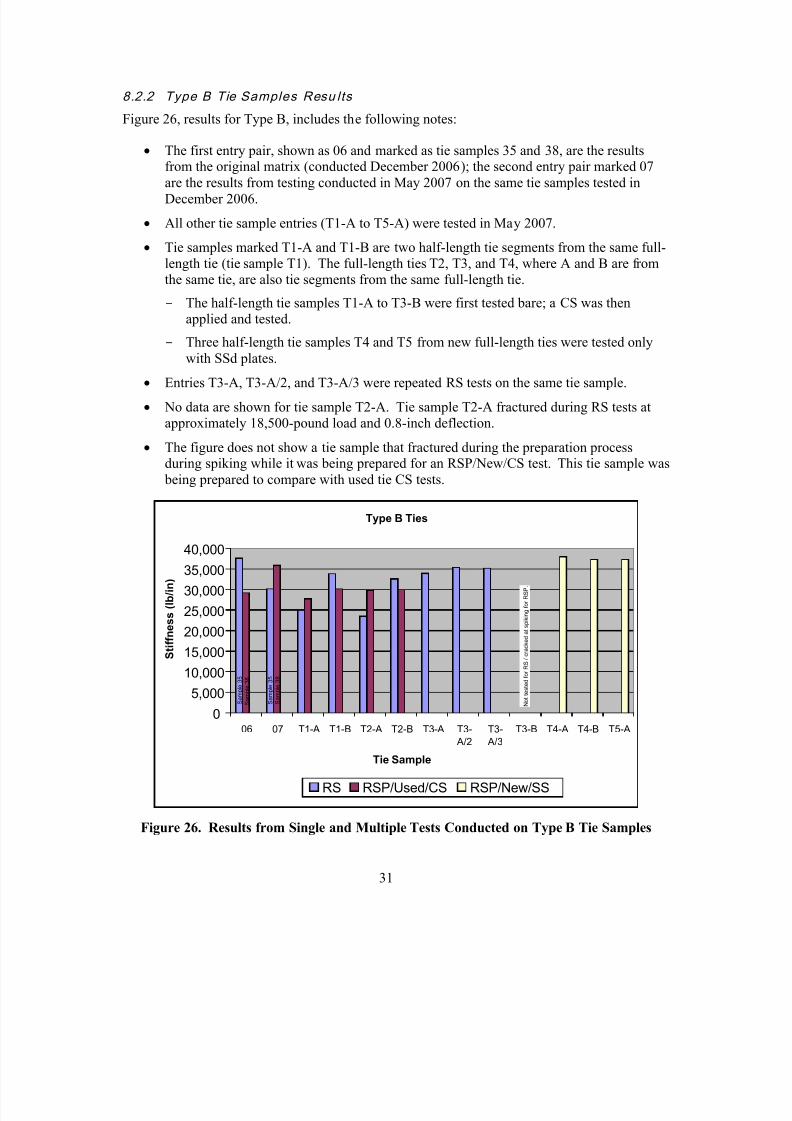
Figure 26, results for Type B, includes the following notes:
The first entry pair, shown as 06 and marked as tie samples 35 and 38, are the resultsfrom the original matrix (conducted December 2006); the second entry pair marked 07are the results from testing conducted in May 2007 on the same tie samples tested inDecember 2006.
All other tie sample entries (T1-A to T5-A) were tested in May 2007.
Tie samples marked T1-A and T1-B are two half-length tie segments from the same full-length tie (tie sample T1). The full-length ties T2, T3, and T4, where A and B are fromthe same tie, are also tie segments from the same full-length tie.- The half-length tie samples T1-A to T3-B were first tested bare; a CS was then
applied and tested.- Three half-length tie samples T4 and T5 from new full-length ties were tested only
with SSd plates. Entries T3-A, T3-A/2, and T3-A/3 were repeated RS tests on the same tie sample.
No data are shown for tie sample T2-A. Tie sample T2-A fractured during RS tests atapproximately 18,500-pound load and 0.8-inch deflection.
The figure does not show a tie sample that fractured during the preparation processduring spiking while it was being prepared for an RSP/New/CS test. This tie sample was
being prepared to compare with used tie CS tests.
Figure 26. Results from Single and Multiple Tests Conducted on Type B Tie Samples
Type B Ties
0
5,000 10,000 15,000 20,000 25,000 30,000 35,000 40,000
06 07 T1-A T1-B T2-A T2-B T3-A T3- A/2
T3- A/3
T3-B T4-A T4-B T5-A
Tie Sample
S t i f f n e s s ( l b / i n )
RS RSP/Used/CS RSP/New/SS
S a m p
l e 3 8
S a m p
l e 3 5
S a m p
l e 3 5
S a m p
l e 3 8
N o
t t e s t e
d f o r
R S / c r a c k e
d a
t s p
i k i n g
f o r
R S P
.
8/17/2019 TR Cracking Impact Plastic Composite Ties Final
http://slidepdf.com/reader/full/tr-cracking-impact-plastic-composite-ties-final 42/54
32
Results for the Type B tie samples indicate and suggest the following:
Potential differences in test setup or differences in ambient temperature between testingin December 2006 may have influenced the change in stiffness for the same tie sampletested in May 2007.
- Bare tie sample 35 exhibited a stiffness decrease of 20 percent between results fromDecember 2006 to May 2007.
- The tie sample with a CSd plate (tie sample 38) exhibited an increase in stiffness ofapproximately 25 percent between results from December 2006 to May 2007.
Three multiple, repeated tests conducted at the same time (tie sample T3-A to T-3A/3) produced virtually identical results. No degradation or change in stiffness was noted onthe same tie sample for three repeated tests.
The addition of tie plates held by CSs reduced the stiffness by a small amount in three ofthe four tie samples tested.
The addition of tie plates held by SSs generally increased stiffness by a small amountover that of bare ties (tie samples T4-A to T5-A).
The tie sample that failed during RS testing (tie sample T2-A) had a lower measuredstiffness value (23,125 lb/in)) at the point of failure than the average value for the otherties tested that did not break.
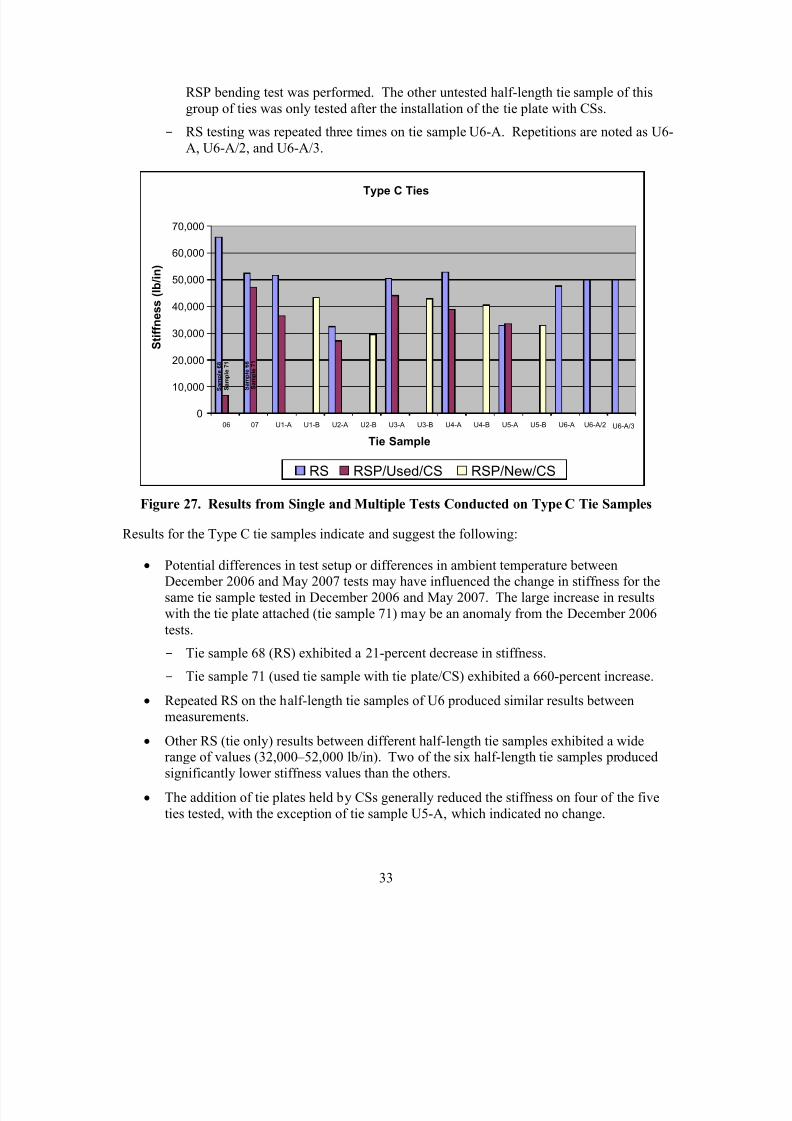
8.2.3 Type C Tie Samples Results
Figure 27, results for Type C, include the following notes:
The first entry pair, shown as 06 and marked as tie samples 68 and 71, is the result fromthe original matrix (conducted December 2006). The second entry pair marked 07 isthe result from testing conducted in May 2007 on the same tie samples tested inDecember 2006.
All other tie sample entries (U1-A to U6-A) were tested in May 2007.
Tie samples marked U1-A, U1-B, U2-A, U2-B to U6-A, and U6-B were the two half-length tie segments from the same full-length tie. Two test tie samples were obtainedfrom each of the six following full-length ties: U1, U2, U3, U4, U5, and U6.- One of each of the six new half-length tie samples was RS tested — no plates
(RS results marked as Ux-A).- From this group, five of the six ties then had a tie plate with CSs applied and retested
for RSP bending (RSP/Used/CS results marked as Ux-A).- Five of the remaining six untested half-length tie samples had a tie plate with CSs
applied and tested for RSP bending (RSP/New/CS marked as Ux-B).- For each full-length tie, two identical half-length tie samples were generated. An RS
test was performed on one half-length tie sample from each tie. After the test’scompletion, a tie plate with CSs was installed on each one of these tie samples, and a
8/17/2019 TR Cracking Impact Plastic Composite Ties Final
http://slidepdf.com/reader/full/tr-cracking-impact-plastic-composite-ties-final 43/54
33
RSP bending test was performed. The other untested half-length tie sample of thisgroup of ties was only tested after the installation of the tie plate with CSs.
- RS testing was repeated three times on tie sample U6-A. Repetitions are noted as U6-A, U6-A/2, and U6-A/3.
Figure 27. Results from Single and Multiple Tests Conducted on Type C Tie Samples
Results for the Type C tie samples indicate and suggest the following:
Potential differences in test setup or differences in ambient temperature betweenDecember 2006 and May 2007 tests may have influenced the change in stiffness for thesame tie sample tested in December 2006 and May 2007. The large increase in resultswith the tie plate attached (tie sample 71) may be an anomaly from the December 2006tests.- Tie sample 68 (RS) exhibited a 21-percent decrease in stiffness.- Tie sample 71 (used tie sample with tie plate/CS) exhibited a 660-percent increase.
Repeated RS on the half-length tie samples of U6 produced similar results between
measurements. Other RS (tie only) results between different half-length tie samples exhibited a wide
range of values (32,000 – 52,000 lb/in). Two of the six half-length tie samples producedsignificantly lower stiffness values than the others.
The addition of tie plates held by CSs generally reduced the stiffness on four of the fiveties tested, with the exception of tie sample U5-A, which indicated no change.
Type C Ties
0
10,000
20,000
30,000
40,000
50,000
60,000
70,000
06 07 U1-A U1-B U2-A U2-B U3-A U3-B U4-A U4-B U5-A U5-B U6-A U6-A/2 U6-A/3 Tie Sample
S t i f f n e s s ( l b / i n )
RS RSP/Used/CS
RSP/New/CS
S a m p l e
6 8
S a m p l e
7 1
S a m p l e
7 1
S a m p l e
6 8
8/17/2019 TR Cracking Impact Plastic Composite Ties Final
http://slidepdf.com/reader/full/tr-cracking-impact-plastic-composite-ties-final 44/54
34
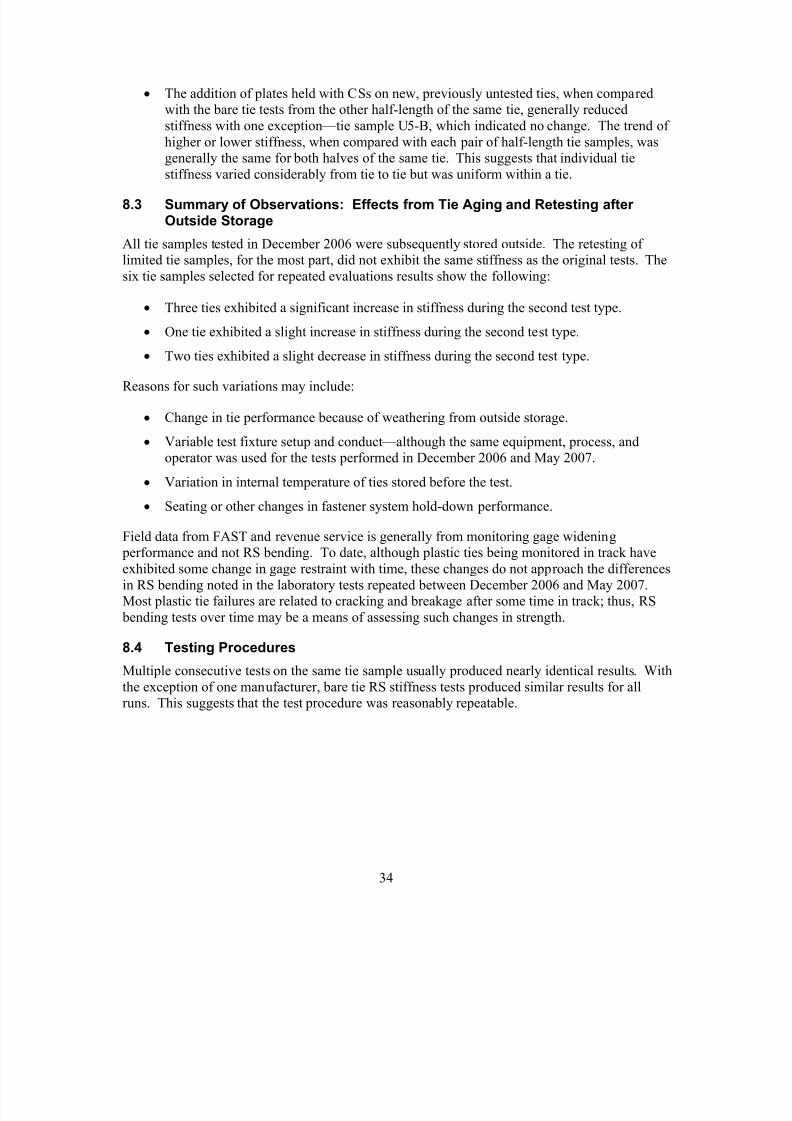
The addition of plates held with CSs on new, previously untested ties, when comparedwith the bare tie tests from the other half-length of the same tie, generally reducedstiffness with one exception — tie sample U5-B, which indicated no change. The trend ofhigher or lower stiffness, when compared with each pair of half-length tie samples, wasgenerally the same for both halves of the same tie. This suggests that individual tie
stiffness varied considerably from tie to tie but was uniform within a tie.8.3 Summary of Observations: Effects from Tie Aging and Retesting after
Outside Storage
All tie samples tested in December 2006 were subsequently stored outside. The retesting oflimited tie samples, for the most part, did not exhibit the same stiffness as the original tests. Thesix tie samples selected for repeated evaluations results show the following:
Three ties exhibited a significant increase in stiffness during the second test type.
One tie exhibited a slight increase in stiffness during the second test type.
Two ties exhibited a slight decrease in stiffness during the second test type.
Reasons for such variations may include:
Change in tie performance because of weathering from outside storage.
Variable test fixture setup and conduct — although the same equipment, process, andoperator was used for the tests performed in December 2006 and May 2007.
Variation in internal temperature of ties stored before the test.
Seating or other changes in fastener system hold-down performance.
Field data from FAST and revenue service is generally from monitoring gage widening performance and not RS bending. To date, although plastic ties being monitored in track haveexhibited some change in gage restraint with time, these changes do not approach the differencesin RS bending noted in the laboratory tests repeated between December 2006 and May 2007.Most plastic tie failures are related to cracking and breakage after some time in track; thus, RS
bending tests over time may be a means of assessing such changes in strength.
8.4 Testing Procedures
Multiple consecutive tests on the same tie sample usually produced nearly identical results. Withthe exception of one manufacturer, bare tie RS stiffness tests produced similar results for allruns. This suggests that the test procedure was reasonably repeatable.

8/17/2019 TR Cracking Impact Plastic Composite Ties Final
http://slidepdf.com/reader/full/tr-cracking-impact-plastic-composite-ties-final 45/54
35
8.5 Tie Samples Required to Obtain Statistically Sound Average
One manufacturer ’s ties exhibited a higher range of results than the two others. This suggeststhat production variations produced a wider range of tie stiffness for this batch of ties. For tiesexhibiting low standard deviation, the testing of five ties appears to provide a sufficiently lowvariability needed to determine average strength, whereas those that show a large standarddeviation after testing five tie samples will require additional samples to be obtained and tested.The number of ties will depend on expected production variability, source material control, andvariations from storage.
Ties with tie plates/CSs exhibited more variation between tests than bare tie or ties withSSs/plates.
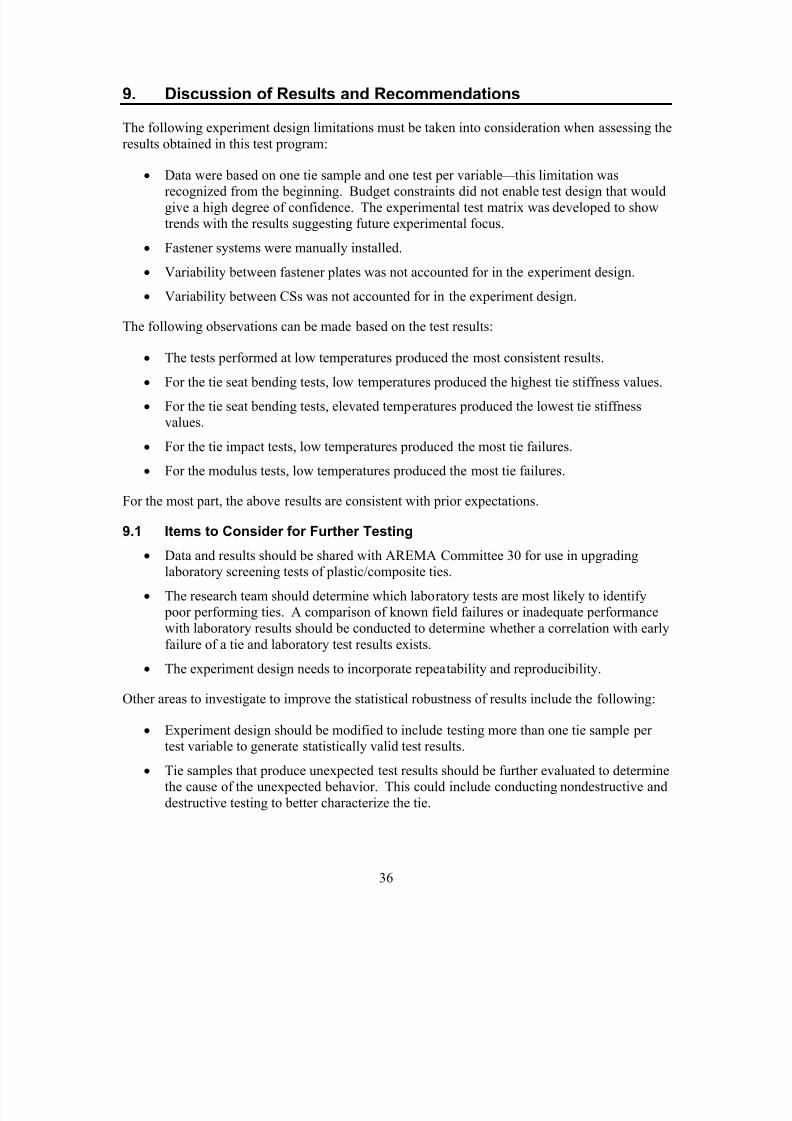
8/17/2019 TR Cracking Impact Plastic Composite Ties Final
http://slidepdf.com/reader/full/tr-cracking-impact-plastic-composite-ties-final 46/54
36
9. Discussion of Results and Recommendations
The following experiment design limitations must be taken into consideration when assessing theresults obtained in this test program:
Data were based on one tie sample and one test per variable — this limitation wasrecognized from the beginning. Budget constraints did not enable test design that wouldgive a high degree of confidence. The experimental test matrix was developed to showtrends with the results suggesting future experimental focus.
Fastener systems were manually installed.
Variability between fastener plates was not accounted for in the experiment design.
Variability between CSs was not accounted for in the experiment design.
The following observations can be made based on the test results:
The tests performed at low temperatures produced the most consistent results. For the tie seat bending tests, low temperatures produced the highest tie stiffness values.
For the tie seat bending tests, elevated temperatures produced the lowest tie stiffnessvalues.
For the tie impact tests, low temperatures produced the most tie failures.
For the modulus tests, low temperatures produced the most tie failures.
For the most part, the above results are consistent with prior expectations.
9.1 Items to Consider for Further Testing Data and results should be shared with AREMA Committee 30 for use in upgrading
laboratory screening tests of plastic/composite ties.
The research team should determine which laboratory tests are most likely to identify poor performing ties. A comparison of known field failures or inadequate performancewith laboratory results should be conducted to determine whether a correlation with earlyfailure of a tie and laboratory test results exists.
The experiment design needs to incorporate repeatability and reproducibility.
Other areas to investigate to improve the statistical robustness of results include the following:
Experiment design should be modified to include testing more than one tie sample pertest variable to generate statistically valid test results.
Tie samples that produce unexpected test results should be further evaluated to determinethe cause of the unexpected behavior. This could include conducting nondestructive anddestructive testing to better characterize the tie.
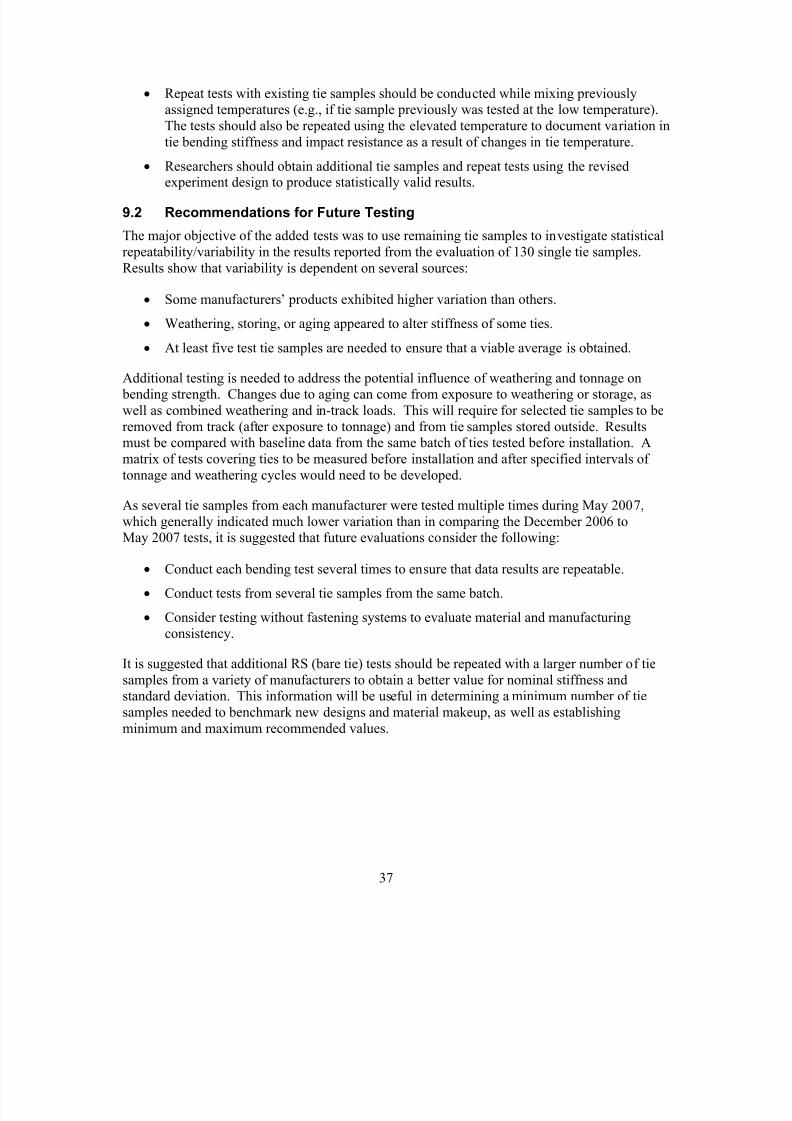
8/17/2019 TR Cracking Impact Plastic Composite Ties Final
http://slidepdf.com/reader/full/tr-cracking-impact-plastic-composite-ties-final 47/54
37
Repeat tests with existing tie samples should be conducted while mixing previouslyassigned temperatures (e.g., if tie sample previously was tested at the low temperature).The tests should also be repeated using the elevated temperature to document variation intie bending stiffness and impact resistance as a result of changes in tie temperature.
Researchers should obtain additional tie samples and repeat tests using the revisedexperiment design to produce statistically valid results.
9.2 Recommendations for Future Testing
The major objective of the added tests was to use remaining tie samples to investigate statisticalrepeatability/variability in the results reported from the evaluation of 130 single tie samples.Results show that variability is dependent on several sources:
Some manufacturers ’ products exhibited higher variation than others.
Weathering, storing, or aging appeared to alter stiffness of some ties.
At least five test tie samples are needed to ensure that a viable average is obtained.
Additional testing is needed to address the potential influence of weathering and tonnage on bending strength. Changes due to aging can come from exposure to weathering or storage, aswell as combined weathering and in-track loads. This will require for selected tie samples to beremoved from track (after exposure to tonnage) and from tie samples stored outside. Resultsmust be compared with baseline data from the same batch of ties tested before installation. Amatrix of tests covering ties to be measured before installation and after specified intervals oftonnage and weathering cycles would need to be developed.
As several tie samples from each manufacturer were tested multiple times during May 2007,which generally indicated much lower variation than in comparing the December 2006 to
May 2007 tests, it is suggested that future evaluations consider the following:
Conduct each bending test several times to ensure that data results are repeatable.
Conduct tests from several tie samples from the same batch.
Consider testing without fastening systems to evaluate material and manufacturingconsistency.
It is suggested that additional RS (bare tie) tests should be repeated with a larger number of tiesamples from a variety of manufacturers to obtain a better value for nominal stiffness andstandard deviation. This information will be useful in determining a minimum number of tie
samples needed to benchmark new designs and material makeup, as well as establishingminimum and maximum recommended values.
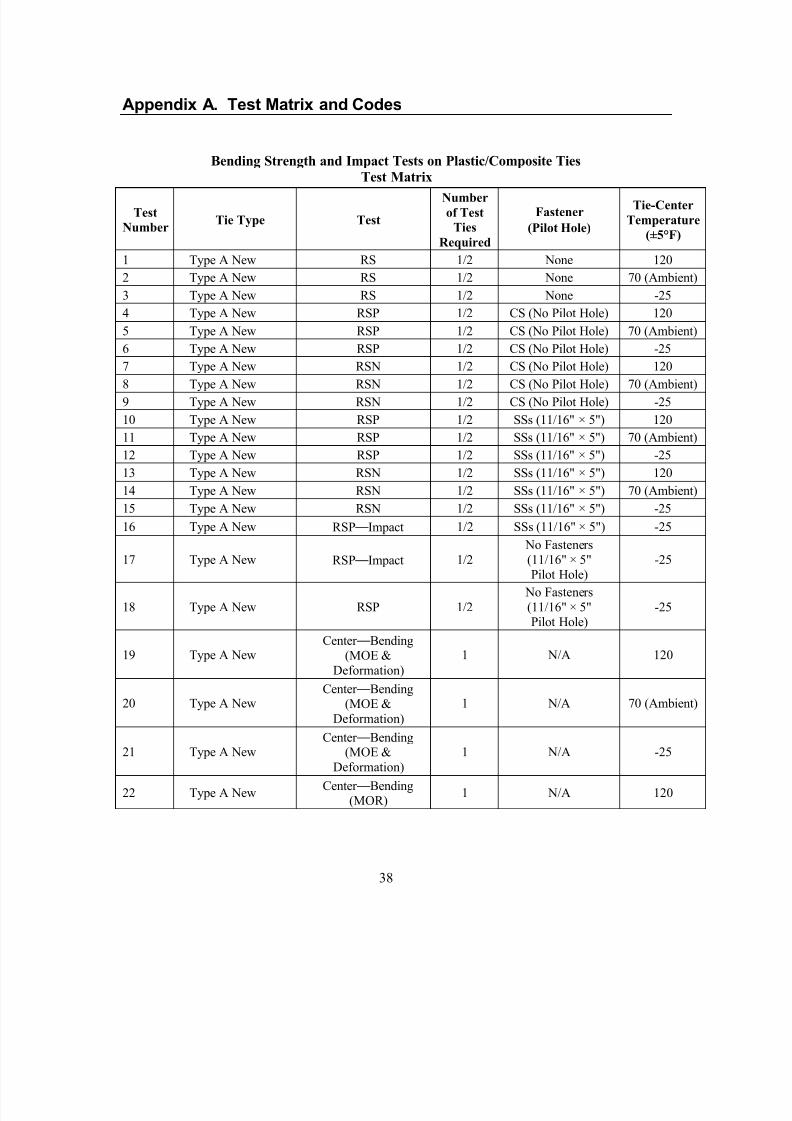
8/17/2019 TR Cracking Impact Plastic Composite Ties Final
http://slidepdf.com/reader/full/tr-cracking-impact-plastic-composite-ties-final 48/54
38
Appendix A. Test Matrix and Codes
Bending Strength and Impact Tests on Plastic/Composite Ties
Test Matrix
TestNumber Tie Type Test
Numberof Test
TiesRequired
Fastener(Pilot Hole)
Tie-CenterTemperature
(±5°F)
1 Type A New RS 1/2 None 1202 Type A New RS 1/2 None 70 (Ambient)3 Type A New RS 1/2 None -254 Type A New RSP 1/2 CS (No Pilot Hole) 1205 Type A New RSP 1/2 CS (No Pilot Hole) 70 (Ambient)6 Type A New RSP 1/2 CS (No Pilot Hole) -257 Type A New RSN 1/2 CS (No Pilot Hole) 1208 Type A New RSN 1/2 CS (No Pilot Hole) 70 (Ambient)9 Type A New RSN 1/2 CS (No Pilot Hole) -2510 Type A New RSP 1/2 SSs (11/16" × 5") 12011 Type A New RSP 1/2 SSs (11/16" × 5") 70 (Ambient)12 Type A New RSP 1/2 SSs (11/16" × 5") -2513 Type A New RSN 1/2 SSs (11/16" × 5") 12014 Type A New RSN 1/2 SSs (11/16" × 5") 70 (Ambient)15 Type A New RSN 1/2 SSs (11/16" × 5") -2516 Type A New RSP — Impact 1/2 SSs (11/16" × 5") -25
17 Type A New RSP — Impact 1/2 No Fasteners(11/16" × 5"Pilot Hole)
-25
18 Type A New RSP 1/2 No Fasteners(11/16" × 5"Pilot Hole)
-25
19 Type A NewCenter — Bending
(MOE &Deformation)
1 N/A 120
20 Type A NewCenter — Bending
(MOE &Deformation)
1 N/A 70 (Ambient)
21 Type A NewCenter — Bending
(MOE &Deformation)
1 N/A -25
22 Type A New Center — Bending(MOR)
1 N/A 120
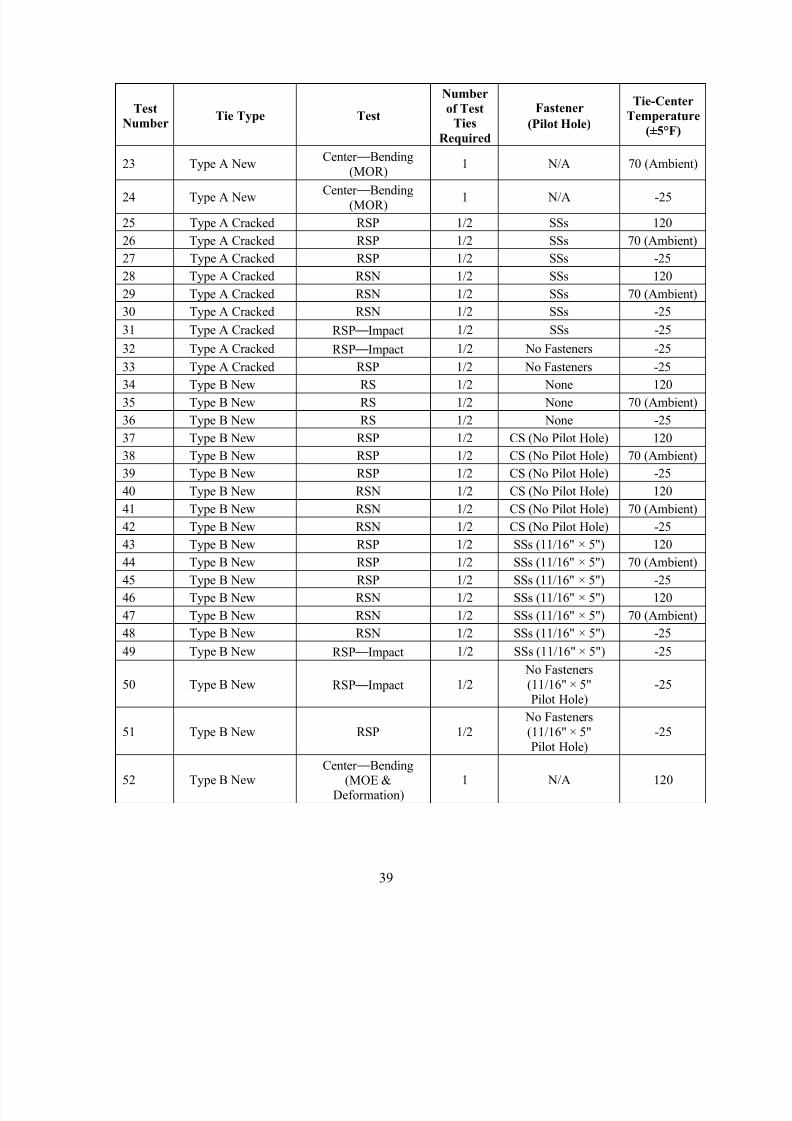
8/17/2019 TR Cracking Impact Plastic Composite Ties Final
http://slidepdf.com/reader/full/tr-cracking-impact-plastic-composite-ties-final 49/54
39
TestNumber Tie Type Test
Numberof Test
TiesRequired
Fastener(Pilot Hole)
Tie-CenterTemperature
(±5°F)
23 Type A New Center — Bending(MOR)
1 N/A 70 (Ambient)
24 Type A New Center — Bending(MOR)
1 N/A -25
25 Type A Cracked RSP 1/2 SSs 12026 Type A Cracked RSP 1/2 SSs 70 (Ambient)27 Type A Cracked RSP 1/2 SSs -2528 Type A Cracked RSN 1/2 SSs 12029 Type A Cracked RSN 1/2 SSs 70 (Ambient)30 Type A Cracked RSN 1/2 SSs -2531 Type A Cracked RSP — Impact 1/2 SSs -2532 Type A Cracked RSP — Impact 1/2 No Fasteners -2533 Type A Cracked RSP 1/2 No Fasteners -2534 Type B New RS 1/2 None 12035 Type B New RS 1/2 None 70 (Ambient)36 Type B New RS 1/2 None -2537 Type B New RSP 1/2 CS (No Pilot Hole) 12038 Type B New RSP 1/2 CS (No Pilot Hole) 70 (Ambient)39 Type B New RSP 1/2 CS (No Pilot Hole) -2540 Type B New RSN 1/2 CS (No Pilot Hole) 12041 Type B New RSN 1/2 CS (No Pilot Hole) 70 (Ambient)42 Type B New RSN 1/2 CS (No Pilot Hole) -2543 Type B New RSP 1/2 SSs (11/16" × 5") 12044 Type B New RSP 1/2 SSs (11/16" × 5") 70 (Ambient)45 Type B New RSP 1/2 SSs (11/16" × 5") -2546 Type B New RSN 1/2 SSs (11/16" × 5") 12047 Type B New RSN 1/2 SSs (11/16" × 5") 70 (Ambient)48 Type B New RSN 1/2 SSs (11/16" × 5") -2549 Type B New RSP — Impact 1/2 SSs (11/16" × 5") -25
50 Type B New RSP — Impact 1/2 No Fasteners(11/16" × 5"Pilot Hole)
-25
51 Type B New RSP 1/2 No Fasteners(11/16" × 5"Pilot Hole)
-25
52 Type B NewCenter — Bending
(MOE &Deformation)
1 N/A 120
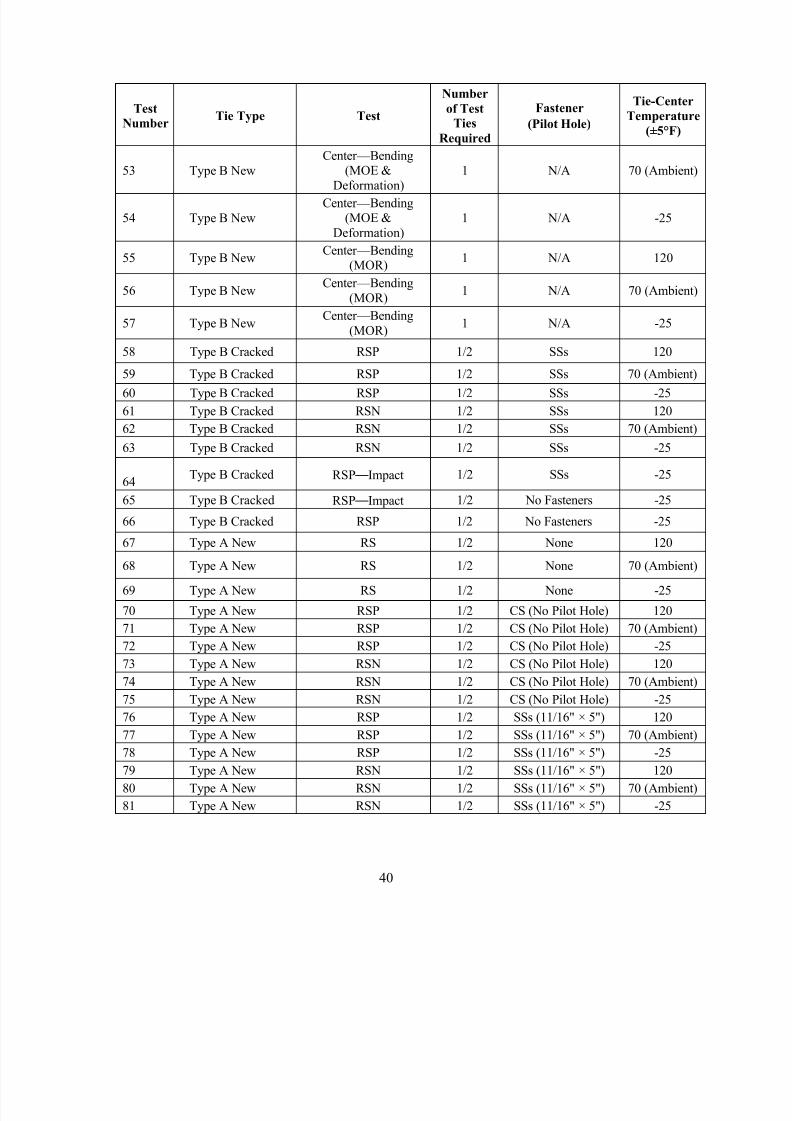
8/17/2019 TR Cracking Impact Plastic Composite Ties Final
http://slidepdf.com/reader/full/tr-cracking-impact-plastic-composite-ties-final 50/54
40
TestNumber Tie Type Test
Numberof Test
TiesRequired
Fastener(Pilot Hole)
Tie-CenterTemperature
(±5°F)
53 Type B NewCenter — Bending
(MOE &Deformation)
1 N/A 70 (Ambient)
54 Type B NewCenter — Bending
(MOE &Deformation)
1 N/A -25
55 Type B New Center — Bending(MOR) 1 N/A 120
56 Type B New Center — Bending(MOR) 1 N/A 70 (Ambient)
57 Type B New Center — Bending(MOR) 1 N/A -25
58 Type B Cracked RSP 1/2 SSs 12059 Type B Cracked RSP 1/2 SSs 70 (Ambient)60 Type B Cracked RSP 1/2 SSs -2561 Type B Cracked RSN 1/2 SSs 12062 Type B Cracked RSN 1/2 SSs 70 (Ambient)63 Type B Cracked RSN 1/2 SSs -25
64 Type B Cracked RSP — Impact 1/2 SSs -25
65 Type B Cracked RSP — Impact 1/2 No Fasteners -25
66 Type B Cracked RSP 1/2 No Fasteners -25
67 Type A New RS 1/2 None 120
68 Type A New RS 1/2 None 70 (Ambient)
69 Type A New RS 1/2 None -25
70 Type A New RSP 1/2 CS (No Pilot Hole) 12071 Type A New RSP 1/2 CS (No Pilot Hole) 70 (Ambient)72 Type A New RSP 1/2 CS (No Pilot Hole) -2573 Type A New RSN 1/2 CS (No Pilot Hole) 12074 Type A New RSN 1/2 CS (No Pilot Hole) 70 (Ambient)75 Type A New RSN 1/2 CS (No Pilot Hole) -25
76 Type A New RSP 1/2 SSs (11/16" × 5") 12077 Type A New RSP 1/2 SSs (11/16" × 5") 70 (Ambient)78 Type A New RSP 1/2 SSs (11/16" × 5") -2579 Type A New RSN 1/2 SSs (11/16" × 5") 12080 Type A New RSN 1/2 SSs (11/16" × 5") 70 (Ambient)81 Type A New RSN 1/2 SSs (11/16" × 5") -25

8/17/2019 TR Cracking Impact Plastic Composite Ties Final
http://slidepdf.com/reader/full/tr-cracking-impact-plastic-composite-ties-final 51/54

8/17/2019 TR Cracking Impact Plastic Composite Ties Final
http://slidepdf.com/reader/full/tr-cracking-impact-plastic-composite-ties-final 52/54
42
TestNumber Tie Type Test
Numberof Test
TiesRequired
Fastener(Pilot Hole)
Tie-CenterTemperature
(±5°F)
109 Type D New RSP 1/2 SSs (11/16" × 5") 120
110 Type D New RSP 1/2 SSs (11/16" × 5") 70 (Ambient)111 Type D New RSP 1/2 SSs (11/16" × 5") -25112 Type D New RSN 1/2 SSs (11/16" × 5") 120113 Type D New RSN 1/2 SSs (11/16" × 5") 70 (Ambient)114 Type D New RSN 1/2 SSs (11/16" × 5") -25115 Type D New RSP — Impact 1/2 SSs (11/16" × 5") -25
116 Type D New RSP — Impact 1/2 No Fasteners(11/16" × 5"Pilot Hole)
-25
117 Type D New RSP 1/2 No Fasteners(11/16" × 5"
Pilot Hole)
-25
118 Type D NewCenter — Bending
(MOE &Deformation)
1 N/A 120
119 Type D NewCenter — Bending
(MOE &Deformation)
1 N/A 70 (Ambient)
120 Type D NewCenter — Bending
(MOE &Deformation)
1 N/A -25
121 Type D New Center — Bending
(MOR)1 N/A 120
122 Type D New Center — Bending(MOR) 1 N/A 70 (Ambient)
123 Type D New Center — Bending(MOR) 1 N/A -25
124 Type D Cracked RSP 1/2 SSs 120
125 Type D Cracked RSP 1/2 SSs 70 (Ambient)
126 Type D Cracked RSP 1/2 SSs -25
127 Type D Cracked RSN 1/2 SSs 120
128 Type D Cracked RSN 1/2 SSs 70 (Ambient)
129 Type D Cracked RSN 1/2 SSs -25130 Type D Cracked RSP — Impact 1/2 SSs -25131 Type D Cracked RSP — Impact 1/2 No Fasteners -25
132 Type D Cracked RSP 1/2 No Fasteners -25
133 New Oak (Control) RSP 1/2 SSs (11/16" × 5") 70 (Ambient)134 New Oak (Control) RSN 1/2 SSs (11/16" × 5") 70 (Ambient)
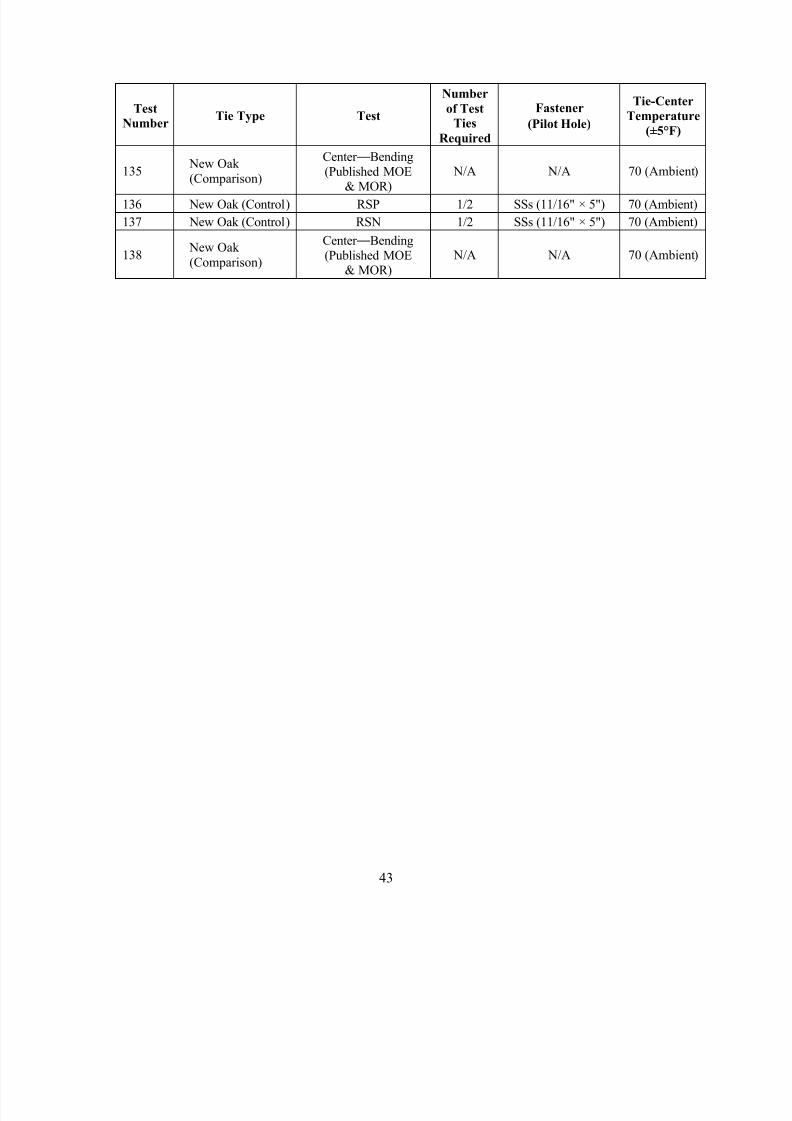
8/17/2019 TR Cracking Impact Plastic Composite Ties Final
http://slidepdf.com/reader/full/tr-cracking-impact-plastic-composite-ties-final 53/54
43
TestNumber Tie Type Test
Numberof Test
TiesRequired
Fastener(Pilot Hole)
Tie-CenterTemperature
(±5°F)
135 New Oak
(Comparison)
Center — Bending(Published MOE
& MOR) N/A N/A 70 (Ambient)
136 New Oak (Control) RSP 1/2 SSs (11/16" × 5") 70 (Ambient)137 New Oak (Control) RSN 1/2 SSs (11/16" × 5") 70 (Ambient)
138 New Oak(Comparison)
Center — Bending(Published MOE
& MOR) N/A N/A 70 (Ambient)
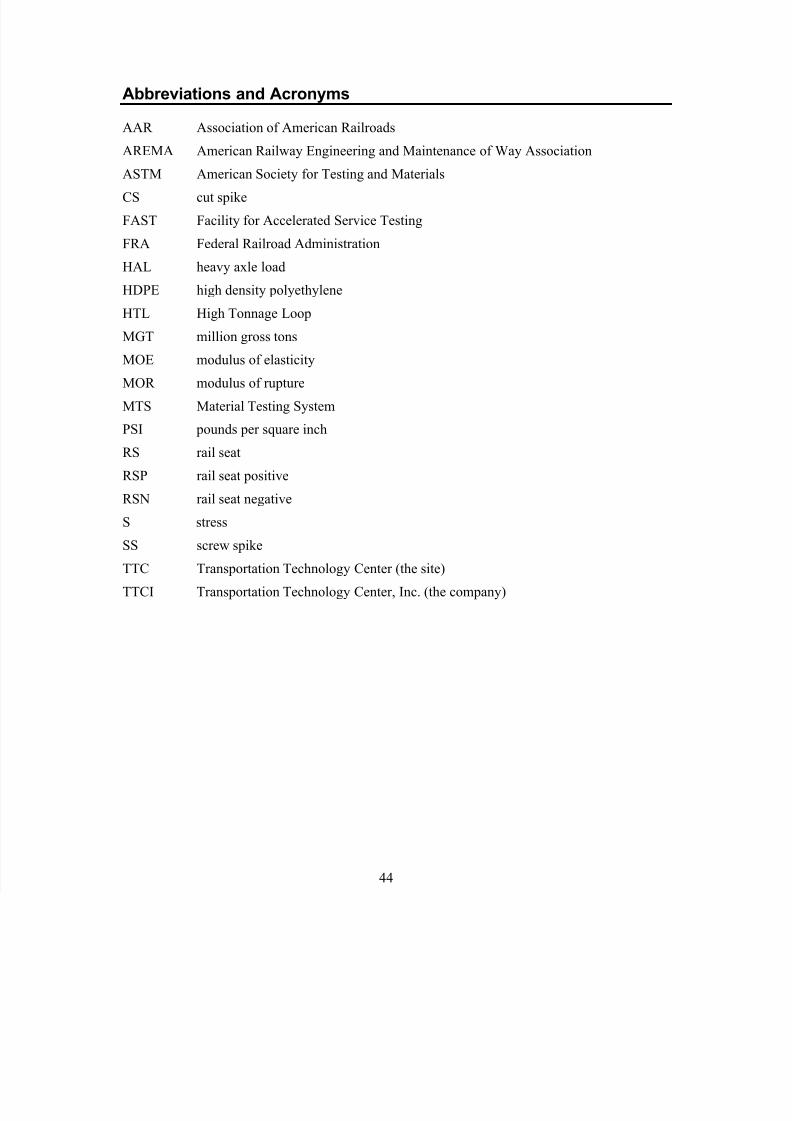
8/17/2019 TR Cracking Impact Plastic Composite Ties Final
http://slidepdf.com/reader/full/tr-cracking-impact-plastic-composite-ties-final 54/54
Abbreviations and Acronyms
AAR Association of American Railroads
AREMA American Railway Engineering and Maintenance of Way Association
ASTM American Society for Testing and MaterialsCS cut spike
FAST Facility for Accelerated Service Testing
FRA Federal Railroad Administration
HAL heavy axle load
HDPE high density polyethylene
HTL High Tonnage Loop
MGT million gross tons
MOE modulus of elasticityMOR modulus of rupture
MTS Material Testing System
PSI pounds per square inch
RS rail seat
RSP rail seat positive
RSN rail seat negative
S stress
SS screw spike
TTC Transportation Technology Center (the site)
TTCI Transportation Technology Center, Inc. (the company)