towards sustainable center of life - listed...
TRANSCRIPT

Central Pattana Public Company Limited (CPN)
CENTER OF ACTIVITIES
TOWARDS SUSTAINABLE CENTER OF LIFE
CENTER OF HAPPINESSCENTER OF
COMMUNITY
CENTER OF
ALL LIFESTYLES
Investor Presentation
May 2019 CPN Head Office
Discussion material on the Company’s latest information

DASHBOARD
Page 2
STRATEGY
UPDATES
GLAND
APPENDICES
DisclaimerPlease read before you proceed!
OVERVIEW
▪ The information contained in this presentation is for information purposes only and does not constitute an offer or
invitation to sell or the solicitation of an offer or invitation to purchase or subscribe for share in Central Pattana Public
Company Limited (“CPN” and shares in CPN, “shares”) in any jurisdiction nor should it or any part of it form the basis
of, or be relied upon in any connection with, any contract or commitment whatsoever.
▪ This presentation may include information which is forward-looking in nature. Forward-looking information involve
known and unknown risks, uncertainties and other factors which may impact on the actual outcomes, including
economic conditions in the markets in which CPN operates and general achievement of CPN business forecasts,
which will cause the actual results, performance or achievements of CPN to differ, perhaps materially, from the
results, performance or achievements expressed or implied in this presentation.
▪ This presentation has been prepared by the CPN. The information in this presentation has not been independently
verified. No representation, warranty, express or implied, is made as to, and no reliance should be placed on, the
fairness, accuracy, completeness or correctness of the information and opinions in this presentation. None of the
CPN or any of its agents or advisers, or any of their respective affiliates, advisers or representatives, shall have any
liability (in negligence or otherwise) for any loss howsoever arising from any use of this presentation or its contents or
otherwise arising in connection with this presentation.
▪ This presentation is made, furnished and distributed for information purposes only. No part of this presentation shall be
relied upon directly or indirectly for any investment decision-making or for any other purposes.
▪ This presentation and all other information, materials or documents provided in connection therewith, shall not, either
in whole or in part, be reproduced, redistributed or made available to any other person, save in strict compliance
with all applicable laws.

DASHBOARD
Page 3
STRATEGY
UPDATES
GLAND
APPENDICES
Agenda
OVERVIEW
Company Overview
CPN Strategic Direction
Business Updates
GLAND Progress
DASHBOARD
Page 4
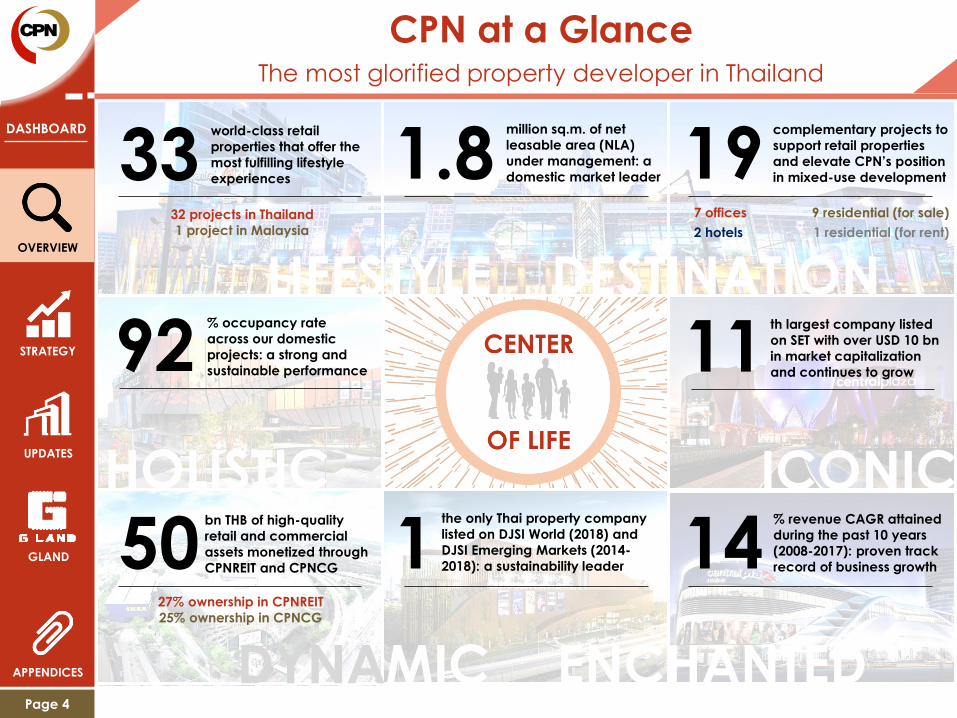
CPN at a GlanceThe most glorified property developer in Thailand
OVERVIEW
33 1.8 19
92 11
50 1 14
world-class retail
properties that offer the
most fulfilling lifestyle
experiences
million sq.m. of net
leasable area (NLA)
under management: a
domestic market leader
complementary projects to
support retail properties
and elevate CPN’s position
in mixed-use development
% occupancy rate
across our domestic
projects: a strong and
sustainable performance
th largest company listed
on SET with over USD 10 bn
in market capitalization
and continues to grow
the only Thai property company
listed on DJSI World (2018) and
DJSI Emerging Markets (2014-
2018): a sustainability leader
% revenue CAGR attained
during the past 10 years
(2008-2017): proven track
record of business growth
bn THB of high-quality
retail and commercial
assets monetized through
CPNREIT and CPNCG
DESTINATIONLIFESTYLE
HOLISTIC ICONIC
DYNAMIC ENCHANTED
27% ownership in CPNREIT
25% ownership in CPNCG
STRATEGY
UPDATES
GLAND
APPENDICES
32 projects in Thailand
1 project in Malaysia
7 offices 9 residential (for sale)
2 hotels 1 residential (for rent)

DASHBOARD
Page 5
Strong Support from Major ShareholdersCentral Group’s leadership in retail and lifestyle experiences
53%
Foreign
Institutions
31%
Other
16%
% ownership in CPN
by investor group out of
4,488million total shares
Listed entities / business units and Central Group’s ownership %
Robinson (ROBINS)
Central Plaza Hotel (CENTEL)COL PCL (COL)
Non-listed business units – mostly wholly-owned by Central Group
De
pt.
Sto
re
Gro
up
B2B
Sp
ec
ialty
Ho
tels
&
Re
sort
s
Re
sta
ura
nt
Gro
up
De
pt.
Sto
re
Gro
up
Fo
od
Re
tail
Gro
up
Ma
rke
tin
g
Gro
up
Ho
me
&
Ha
rdlin
eV
ietn
am
Gro
up
On
lin
e /
Dig
ita
l
62% 65%
50%
Supportive to CPN’s core business
Central Group’s brands serve as
effective and powerful “magnets”
OVERVIEW
STRATEGY
UPDATES
GLAND
APPENDICES

DASHBOARD
Page 6
Development & Management StructureViable structure to maximize economic value
CPN Developed & Managed Area
Note: CRG = Central Restaurant Group ; CMG = Central Marketing Group
12%CRG &
CMG88%
Third Party
Tenants
Comprises anchor
and assorted tenants
Standard
contractual and
pricing terms
Includes common
area
Joint-Developer Area
Comprises Central Group
dept. store and BUs
Shares cost of landscaping
and surrounding facilities
Invests in its own assets where
CPN is not a beneficiary
OVERVIEW
STRATEGY
UPDATES
GLAND
APPENDICES

DASHBOARD
Page 7
Superior Locations in ThailandIconic and highly accessible in both Bangkok and provinces
✓ Phuket 3
✓ Chonburi 2
✓ Rayong
✓ Chiangmai 1
✓ Chiangrai✓ Lampang✓ Phitsanulok
✓ Khonkaen✓ Nakhon Ratchasima✓ Udonthani✓ Ubonratchathani
✓ Suratthani4
✓ Hatyai✓ Nakhon Si Thammarat
Ayutthaya
Note:
Bangkok Metropolitan Area include operational shopping malls, namely at 1) Lardprao ; 2) Ramindra ; 3) Pinklao ; 4) Rama 3 ; 5) Bangna ; 6) Rama 2 ; 7) CentralWorld ; 8) Rattanathibet ;
9) Chaengwattana ; 10) Grand Rama 9 ; 11) Salaya ; 12) WestGate ; 13) EastVille ; 14) Mahachai, and announced future projects, namely at A) Central Village and B) Dusit Central Park
1. Chiangmai includes 2 shopping malls: CentralPlaza Chiangmai Airport and CentralFestival Chiangmai
2. Chonburi includes 3 shopping malls: CentralMarina, CentralFestival Pattaya Beach and CentralPlaza Chonburi
3. Phuket includes 2 shopping malls: Central Phuket Floresta and Central Phuket Festival (both under the same complex “Central Phuket”)
4. Suratthani includes 2 shopping malls: CentralPlaza Suratthani and CentralFestival Samui
NORTH
NORTHEAST
SOUTH
EAST
Existing Rail Lines
Extension Rail Lines
✓ Completed Projects
Future Projects
32 retail-centric projects in 16 provinces: 14 within and 18 outside of BMA
OVERVIEW
STRATEGY
UPDATES
GLAND
APPENDICES

DASHBOARD
Page 8
Sustainable Development (1/2)Not limited to the well-being of customers and tenants…
OVERVIEW
STRATEGY
UPDATES
GLAND
APPENDICES
HIGHLY SATISFIED CUSTOMERS
EDUCATEDTENANTS
Convenience & Accessibility
Government centers
Tourist-tailored Services
Tourist Centers and Lounges
Customer and tenant experience fulfillment
Through digitalized engagement
Convenience through mobile application
Forge & reinforce tenant relationship
Exclusive campaigns and T1C offers
Tenant and Local SMEs development
CPN Lead & SME marketplace

DASHBOARD
Page 9
Sustainable Development (2/2)…but also towards communities and environment
OVERVIEW
STRATEGY
UPDATES
GLAND
APPENDICES
LONG-TERMBUSINESS
PARTNERS
TRANSPARENT AND INTEGRITY
TOWARDS GENERAL PUBLIC
Local community engagement
Local landmark Social media integration
“Green” building
initiatives
Corporate governance and
sustainable development
Pledge to anti-corruption
► DJSI - Emerging Markets, SET SD Award - Rising star, Thailand Sustainability Investment
► Achieved 1.3% energy saving (usage)
Successful business
collaboration with
world-class partners
Solar rooftop at malls
Adoption of LED lighting
IKEA at CentralPlaza WestGate
Co-working space
JV investment
LEED certification (pending)
DASHBOARD
Page 10
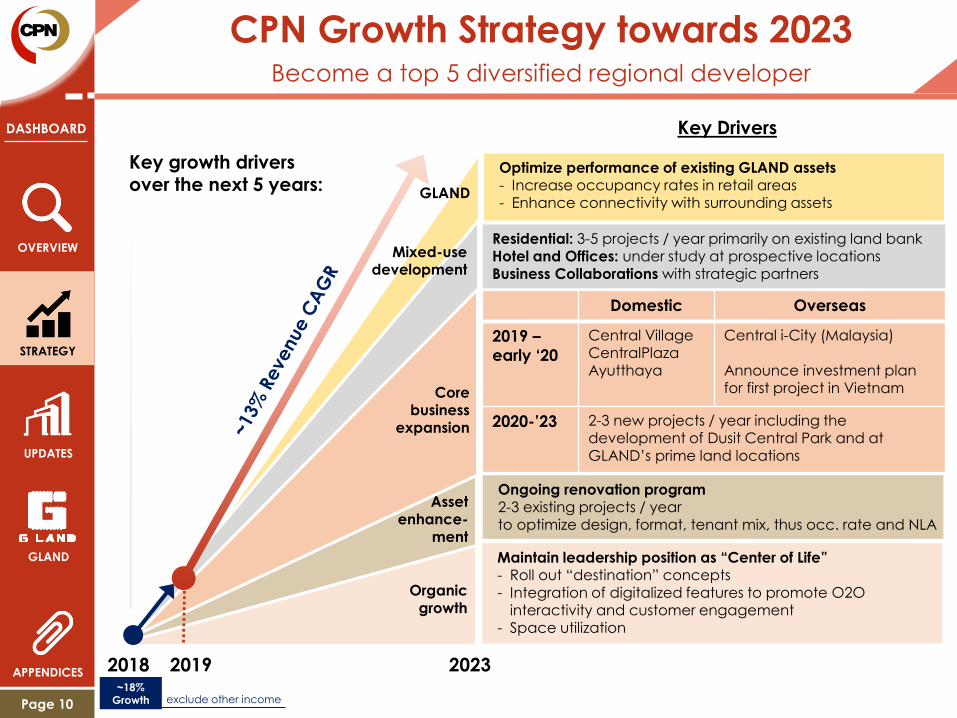
CPN Growth Strategy towards 2023Become a top 5 diversified regional developer
STRATEGY
OVERVIEW
UPDATES
GLAND
APPENDICES 2018 2019 2023
Key Drivers
Key growth driversover the next 5 years:
GLAND
~18%Growth
Core business
expansion
Asset enhance-
ment
Mixed-usedevelopment
Organicgrowth
Maintain leadership position as “Center of Life”- Roll out “destination” concepts- Integration of digitalized features to promote O2O
interactivity and customer engagement- Space utilization
Ongoing renovation program2-3 existing projects / year to optimize design, format, tenant mix, thus occ. rate and NLA
Domestic Overseas
2019 –
early ‘20
Central VillageCentralPlazaAyutthaya
Central i-City (Malaysia)
Announce investment plan for first project in Vietnam
2020-’23 2-3 new projects / year including the development of Dusit Central Park and at GLAND’s prime land locations
Residential: 3-5 projects / year primarily on existing land bankHotel and Offices: under study at prospective locationsBusiness Collaborations with strategic partners
Optimize performance of existing GLAND assets- Increase occupancy rates in retail areas- Enhance connectivity with surrounding assets
exclude other income
DASHBOARD
Page 11
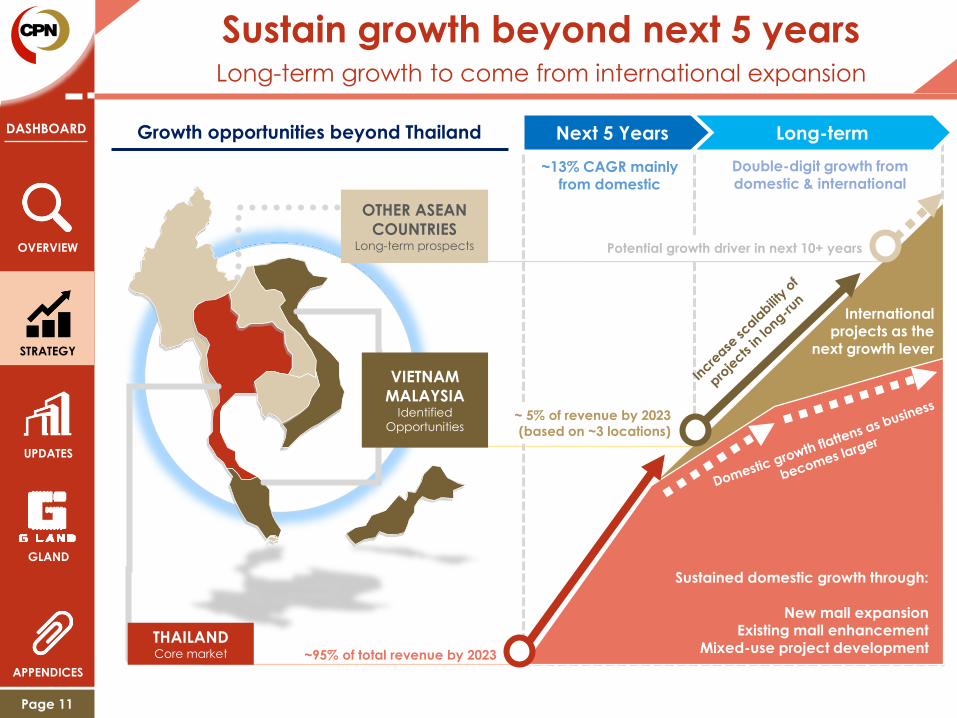
Sustain growth beyond next 5 yearsLong-term growth to come from international expansion
STRATEGY
OVERVIEW
UPDATES
GLAND
APPENDICES
Next 5 Years Long-term
Sustained domestic growth through:
New mall expansionExisting mall enhancement
Mixed-use project development
International projects as the
next growth lever
THAILANDCore market
VIETNAM
MALAYSIAIdentified
Opportunities
OTHER ASEAN
COUNTRIESLong-term prospects
~13% CAGR mainly from domestic
Double-digit growth from domestic & international
~95% of total revenue by 2023
~ 5% of revenue by 2023
(based on ~3 locations)
Potential growth driver in next 10+ years
Growth opportunities beyond Thailand

DASHBOARD
Page 12
Vietnam: the next overseas destinationThe gem of ASEAN retail market for long-term growth
STRATEGY
OVERVIEW
UPDATES
GLAND
APPENDICES
Source: CIA World Fact Book, World Bank, JLL, Colliers International, General Statistics Office of Vietnam
Vietnam at a glance Key advantages for CPN to enter Vietnam
High potential market with exceptional growth driven by consumer spending
Ample room to grow retail space per capita with low direct competition
Abundance of tenant network through strong presence of the Central Group
Over 250 retail outlets nationwide since 2011 comprising supermarkets, electronic retail,
department stores, as well as many international fashion and lifestyle brands
>80% of NLAlocated in non-CBD
areas in light of higher urbanization rate
1.0m sqm NLA
HO CHI MINH
HANOI
0.9m sqm NLA
6.74.6
Vietnam ASEAN
12.7
5.4
Vietnam ASEAN
74.5
66.5
Vietnam ASEAN
% forecasted annual GDP
growth during 2019-2021
% retail sales YoY
growth in 2017
% final consumption to
GDP in 201796.1
39.8
million
people
% population
under age 24
Growing young generation
Malls are influencing the retail supply
66
21
13
3.0m
sqm. retail
supply
% by format; in HCMC and Hanoi only
Malls &
Dept. Stores
Supermarket /
Hypermarket
C-Stores /
Bazaar
Shopping centers growing around cities
Retail NLA (sqm.) per capita
0.97 0.92
0.49
0.11 0.1 0.03
SIN BKK JKT HCMC Hanoi Hai Phong
Mainly supplied by a few
major local and foreign
players
DASHBOARD
Page 13
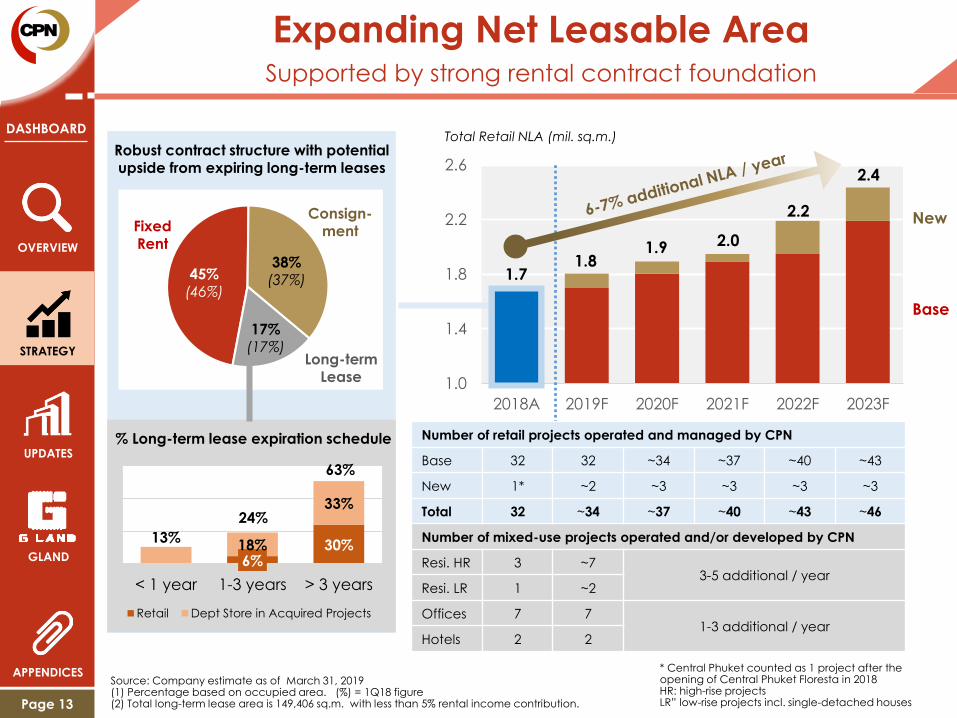
Expanding Net Leasable AreaSupported by strong rental contract foundation
1.0
1.4
1.8
2.2
2.6
2018A 2019F 2020F 2021F 2022F 2023F
Total Retail NLA (mil. sq.m.)
New
Base
1.71.8
1.9 2.0
2.2
2.4
Number of retail projects operated and managed by CPN
Base 32 32 ~34 ~37 ~40 ~43
New 1* ~2 ~3 ~3 ~3 ~3
Total 32 ~34 ~37 ~40 ~43 ~46
Number of mixed-use projects operated and/or developed by CPN
Resi. HR 3 ~73-5 additional / year
Resi. LR 1 ~2
Offices 7 71-3 additional / year
Hotels 2 2
Robust contract structure with potential upside from expiring long-term leases
Source: Company estimate as of March 31, 2019(1) Percentage based on occupied area. (%) = 1Q18 figure(2) Total long-term lease area is 149,406 sq.m. with less than 5% rental income contribution.
45%(46%)
38%(37%)
17%(17%)
FixedRent
Consign-ment
Long-termLease
6%30%18%
33%
< 1 year 1-3 years > 3 years
Retail Dept Store in Acquired Projects
% Long-term lease expiration schedule
13%
24%
63%
* Central Phuket counted as 1 project after the opening of Central Phuket Floresta in 2018HR: high-rise projectsLR” low-rise projects incl. single-detached houses
STRATEGY
OVERVIEW
UPDATES
GLAND
APPENDICES

DASHBOARD
Page 14
Capital Expenditure (CAPEX)Focused on development of malls and GLAND properties
0.8 1.2 2.5 1.8 1.2 2.14.0 4.6
4.2 3.82.1
3.53.6 1.7 1.5
1.51.5
0.9
5.010.9 9.5 13.1
14.6
5.8
5.3
4.3 6.3 2.61.113.6
0
5
10
15
20
25
30
2018A 2019F 2020F 2021F 2022F 2023F
(M&A)
Hotel
Unit: billion THB
Residential
Enhancements
New Malls(Prospective)
Prospective new malls include preliminary CAPEX for GLAND’s future projects and two projects in Vietnam, subject to revisionExcludes investments related to M&A, land lease acquisition / renewal and other non-business related investments
26.0
18.6
22.723.9
22.7
i-City (Malaysia)
20.5
Central Village
Central PhuketNew
Projects
Enhan-
cement
Mixed-
Use
2-3 projects / year
(unannounced)
2-3 projects / year
3-5 residential projects / year
Approx. 9 new hotels in next 5 years
CentralWorldRama 3
Pattaya BeachPhuket Festival
Lardprao
Phyll Pahol 34Niyham
Common Ground
At least 3low-rise resi.
Dusit Central Park(2023-2024)
ChiangraiChonburi
STRATEGY
OVERVIEW
UPDATES
GLAND
APPENDICES
Ayutthaya
New Malls(Announced)

DASHBOARD
Page 15
UPDATES
STRATEGY
OVERVIEW
GLAND
APPENDICES
New Projects in 2019 / early 2020Braced to deliver new experiences and formats
1Q19 3Q19 2020
Central i-City
Central Village
CentralPlaza
Ayutthaya
Exp. Opening 3Q19
Land Type Freehold
Investment (THB) ~5.00 bn
Est. NLA (sq.m.) ~40,000
Exp. Opening 2020
Land Type Freehold
Investment (THB) TBC
Est. NLA (sq.m.) TBC
Open Date 23-Mar-19
Land Type Freehold
Investment (THB) 8.00 bn
Est. NLA (sq.m.) ~83,000
Joint Investor I-R&D Bhd.

DASHBOARD
Page 16
UPDATES
Dusit Central ParkThe new era for one of Bangkok’s most endearing heritages
STRATEGY
OVERVIEW
GLAND
APPENDICES
Hotel: Dusit Thani Bangkok
Total rooms: ~250
Total floors: 39
Open date: 1H 2023
CPN own’ship: 40%
Sources: Dusit Thani PLC presentation; Dusit Central Park project announcement on April 1, 2019 ; CPN ownership represents ultimate ownership in each project
Retail: Central Park
Total area: ~80,000 sqm.
Total floors: 7+UG
Open date: 2H 2023
CPN own’ship: 85%
Office: Central Park Offices
Total area: ~90,000 sqm.
Total floors: 43
Bldg. format: Grade A
Open date: 2H 2023
CPN own’ship: 100%
Residential: 2 brands
Total units: ~389
Total floors: 69
Open date: 1H 2024
CPN own’ship: 40%
Dusit Residences
Total units: ~159
Size/unit (sqm.): 120-600
Dusit Parkside
Total units: ~230
Size/unit (sqm.): 60-260
23 rai land 36.7 bn THB total investment 440,000 sqm. total area>60 years Leasehold(extended in 2017)

DASHBOARD
Page 17
Residential DevelopmentAt least 3 new launches per year to complement core business
Co
mp
lete
fo
r Tr
an
sfe
rHigh Rise Projects Low Rise Projects
An
no
un
ce
d &
Un
de
r d
ev
elo
pm
en
t
Ow
n L
an
dO
wn
La
nd
Ac
qu
ire
d L
an
d
Ac
qu
ire
d L
an
d
Niyham Borommratchachonni(Phase 1: 9 units)
NiyhamBorommratchachonni
(Future phases) Phyll Pahol 34
Escent VilleChiangrai
Escent VilleChiangmai
EscentNakhonRatchasima
EscentUbonratchathani
EscentChiangmai
EscentRayong
EscentKhonkaen
More locations next to shopping malls available for development
Explore high potential stand-alone development in locations backed by strong demand
20182016 2016 2016
Note: Year denotes year of launch
2017
2018
2017 2017
2018
2019-20
UPDATES
STRATEGY
OVERVIEW
GLAND
APPENDICES

DASHBOARD
Page 18
UPDATES
STRATEGY
OVERVIEW
GLAND
APPENDICES
Asset Enhancement InitiativesActivities completed in 2018 and planned for 2019
Key activities in 1Q19
Note 1: Major renovation program for CentralWorld mostly completed by 4Q18 ; Minor workover still ongoing until full completion by 1Q19Note 2: Renovation program not including area transferred to CPNREIT
CentralPlaza Chiangrai: introducing the new “Northern Village” zone and
all-new food park
CentralPlaza Chiangrai
CentralPlaza Chonburi
CentralFestival Pattaya Beach2
Central Phuket Festival
Commence in 2018-19
Completed in 2018
CentralPlaza Lardprao
CentralWorld1
Launch of the all-new
CentralPlaza Chiangrai

DASHBOARD
Page 19
UPDATES
STRATEGY
OVERVIEW
GLAND
APPENDICES
2019 GuidanceAnother strong year of growth through business plan delivery
Total Revenue Growth Gross Profit Margin SG&A to Revenue Ratio
Annual CAPEX Gearing and Dividend Governance and Sustainability
➢ Surge from new & renovated malls
➢ Continued residential project transfers
➢ Sustained same-store rental revenue
growth from previous year
YoY growth including
contribution from GLAND
since acquisition in 2018
➢ Incremental same-store rental &
services gross profit margin excl. impact
from Rama 2 land lease renewal
➢ Continued utility cost savings initiatives
12%approx.
➢ Optimize organization headcount to
prepare for business expansion
➢ Continuous marketing events at malls to
maintain position as the preferred
destinations of customers
➢ Develop new projects and renovate
existing projects for near-term launches
/ re-opening respectively
➢ Explore new investment opportunities
bn THB of annual CAPEX19approx.
1.0xno more than
➢ Continue to optimize cost of funds
net debt-to-equity at
policy level, with the
aim not to exceed such,
to fund new investments
of net profit paid out to
shareholders to balance
return and need for
capital re-investments40%
no less than
➢ Continue to engage and nurture
livelihood of communities
➢ Maintain good CG practices
➢ Achieve LEED certification for assets
DJSIlisted status
5IOD CG Rating
MaintainAt least similar to 2018 level
MaintainAt least similar to 2018 level

DASHBOARD
Page 20
GLAND
GLAND Acquisition UpdateAssumes controlling stake; now reviewing investment plan
Before Shares Acquisition After Shares Acquisition
Charernkit
Group
50.43% CPN
67.53%
Retail and
Institutional
Shareholders
49.57%
Retail and
Institutional
Shareholders
32.47%
Timeline of events and approximated development and investment plan:
September – November 2018
Successfully acquired
controlling stake from major
shareholders, followed by
additional stake through
tender offer at 3.10 THB/share
May 2019
CPN acquired 50%
shares in Bayswater from
BTS Group, pairing with
GLAND as JV partners
Within 2019
Review and finalize
development plan
at GLAND’s sites
Late 2022 / Early 2023
Complete the first
mixed-use
development project
(earliest time frame)
2018 2019
STRATEGY
UPDATES
OVERVIEW
APPENDICES

DASHBOARD
Page 21
GLAND’s PortfolioHighly-valued land bank and a handful of high quality assets
GLAND
STRATEGY
UPDATES
OVERVIEW
APPENDICES
Information as of March 31, 2019; Occupancy rates at end of period; residential units transferred are cumulative as of end of period
Un
de
ve
lop
ed
Op
era
tio
na
lTr
nf.
to
REIT
G Tower
NLA (sqm.) 67,440
Occ. Rate 99%
Retail NLA 6,246
Retail OR 88%
The Ninth Tower Unilever House
NLA (sqm.) 62,950
Occ. Rate 95%
Retail NLA 5,692
Retail OR 52%
NLA (sqm.) 18,527
Occ. Rate 100%
Retail NLA 3,717
Retail OR 60%
Bell Grand Rama 9
Total Units 1,991
% Sold 98%
Retail NLA 10,288
Retail OR 74%
23-rai land at Rama 9
35-rai land on Kampangpetch Rd.
85-rai land at Don Muang
Office Buildings Residential Mixed-use
50-50 JV with BTS
Bayswater Co., Ltd.
48-rai land at Paholyothin

DASHBOARD
Page 22
End of PresentationThank you for your kind attention!
For more information, please contact:
Investor Relations Department
Central Pattana Public Company Limited
Central Pattana Public Company Limited
31st Fl, the Offices at CentralWorld
999-9 Rama I Rd., Patumwan District
Bangkok 10330
Thailand
+662 667 5555
ext. 1614, 1632, 1688 or 1689
Facsimile: +662 264 5593
http://www.cpn.co.th
STRATEGY
UPDATES
GLAND
APPENDICES
OVERVIEW
DASHBOARD
Page 23
APPENDICES
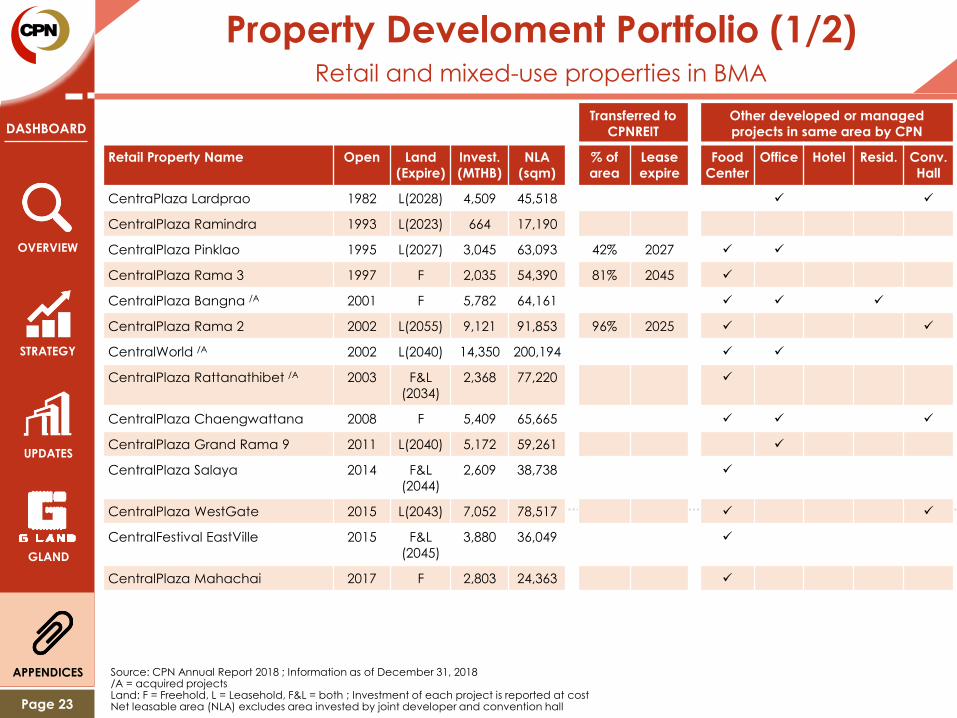
Property Develoment Portfolio (1/2)Retail and mixed-use properties in BMA
STRATEGY
UPDATES
GLAND
OVERVIEW
Transferred to
CPNREIT
Other developed or managed
projects in same area by CPN
Retail Property Name Open Land
(Expire)
Invest.
(MTHB)
NLA
(sqm)
% of
area
Lease
expire
Food
Center
Office Hotel Resid. Conv.
Hall
CentraPlaza Lardprao 1982 L(2028) 4,509 45,518 ✓ ✓
CentralPlaza Ramindra 1993 L(2023) 664 17,190
CentralPlaza Pinklao 1995 L(2027) 3,045 63,093 42% 2027 ✓ ✓
CentralPlaza Rama 3 1997 F 2,035 54,390 81% 2045 ✓
CentralPlaza Bangna /A 2001 F 5,782 64,161 ✓ ✓ ✓
CentralPlaza Rama 2 2002 L(2055) 9,121 91,853 96% 2025 ✓ ✓
CentralWorld /A 2002 L(2040) 14,350 200,194 ✓ ✓
CentralPlaza Rattanathibet /A 2003 F&L
(2034)
2,368 77,220 ✓
CentralPlaza Chaengwattana 2008 F 5,409 65,665 ✓ ✓ ✓
CentralPlaza Grand Rama 9 2011 L(2040) 5,172 59,261 ✓
CentralPlaza Salaya 2014 F&L
(2044)
2,609 38,738 ✓
CentralPlaza WestGate 2015 L(2043) 7,052 78,517 ✓ ✓
CentralFestival EastVille 2015 F&L
(2045)
3,880 36,049 ✓
CentralPlaza Mahachai 2017 F 2,803 24,363 ✓
Source: CPN Annual Report 2018 ; Information as of December 31, 2018/A = acquired projectsLand: F = Freehold, L = Leasehold, F&L = both ; Investment of each project is reported at costNet leasable area (NLA) excludes area invested by joint developer and convention hall

DASHBOARD
Page 24
APPENDICES
Property Develoment Portfolio (2/2)Retail and mixed-use properties in provinces
STRATEGY
UPDATES
GLAND
OVERVIEW
Transferred to
CPNREIT
Other developed or managed
projects in same area by CPN
Retail Property Name Open Land
(Expire)
Invest.
(MTHB)
NLA
(sqm)
% of
area
Lease
expire
Food
Center
Office Hotel Resid. Conv.
Hall
CentralMarina 1995 L(2035) 1,442 17,432 ✓
CentralPlaza Chiangmai Airport /A 1996 F 2,421 76,665 49% 2044 ✓ ✓
CentralFestival Pattaya Beach 2009 F&L
(2038)
4,500 63,093 50% 2037 ✓ ✓
CentralPlaza Udonthani /A 2009 F 4,614 71,716 ✓ ✓ ✓
CentralPlaza Chonburi 2009 F&L
(2027)
3,131 38,391 ✓
CentralPlaza Khonkaen 2009 F 3,951 47,318 ✓ ✓ ✓
CentralPlaza Chiangrai 2011 F 2,016 23,996 ✓ ✓
CentralPlaza Phitsanulok 2011 F 1,590 26,474 ✓
CentralPlaza Suratthani 2012 F 2,245 31,262 ✓ ✓
CentralPlaza Lampang 2012 L(2041) 1,145 21,977 ✓
CentralPlaza Ubonratchathani 2013 F 1,835 32,182 ✓
CentralFestival Chiangmai 2013 F 4,300 68,020 ✓ ✓
CentralFestival Hatyai 2013 F 4,917 66,802 ✓ ✓
CentralFestival Samui 2014 L(2043) 1,875 31,648 ✓
CentralPlaza Rayong 2015 F 2,685 29,466 ✓ ✓ ✓
Central Phuket
- Festival /A
- Floresta
2015
2018
L(2056)
L(2056)
8,152
5,499
40,151
32,468
✓
✓
CentralPlaza Nakhon Si Thamm. 2016 F 1,833 21,329 ✓
CentralPlaza Nakhon Ratchasima 2017 F 4,560 49,094 ✓ ✓ ✓

DASHBOARD
Page 25
CPN’s Asset Performance SummaryHigh occupancy rates sustained for domestic malls
APPENDICES
STRATEGY
UPDATES
GLAND
OVERVIEW
Freehold LeaseholdFreehold &
LeaseholdRetail
Department
StoreTotal 1Q18 4Q18 1Q19
BMA 14 4 7 3 0.71 0.06 0.77 91% 94% 93%
Provinces 18 12 4 2 0.66 0.06 0.72 92% 91% 90%
Domestic(1) 32 16 11 5 1.37 0.12 1.49 91% 92% 92%
Overseas 1 1 0 0 0.08 0.00 0.08 50%
Total(1) 33 17 11 5 1.45 0.12 1.57 91% 92% 90%
Retail PropertiesNo. of
Projects
Land NLA(1)(2)
(mn sqm) Occupancy Rate(1)
(1) Counts Central Phuket (Floresta + Festival) as one project ; Excludes area transferred to CPNREIT, CPNCG and area under GLAND(2) Excludes rental agreements < 1 year, such as kiosk, carts, ATMs and coin machines.
NLA split by region Rent revenue split by region
BMA, 49%
Provinces,
46%
Overseas,
5%
BMA, 58%
Provinces,
42%
Overseas,
0%
Non-core PropertiesNo. of
ProjectsNLA (sqm)
Occupancy Rate(1) (%)
1Q18 4Q18 1Q19
Office in BMA(1)(2) 5 56,174 94% 94% 93%
Residential in BMA 1 1,568 21% 21% 27%
Hotel in provincial area 2 561 rooms 85% 83% 86%

DASHBOARD
Page 26
APPENDICES
STRATEGY
UPDATES
GLAND
OVERVIEW
CPN’s Financial PerformanceConsistently growing revenue and core profit
Total RevenueMTHB
Operating ProfitMTHB
Normalized (LHS) and Net (RHS) ProfitMTHB
/1 Includes rental & services, hotel operation, food & beverages, real estate sales and other income. Excludes interest income and share of profit from joint ventures and associated companies
/2
/3
Excludes Central Phuket Floresta, Central i-City, CentralWorld, CentralPlaza Lardprao, CentralPlaza Chonburi and CentralPlaza Chiangrai, Central Phuket Festival, and CentralFestival Pattaya Beach.Due to the adoption of TFRS 15 on January 1, 2019 onwards, total revenue, gross profit margin and EBITDA margin for the current and comparison periods have been adjusted to reflect the nature of the food center services business.
25,713 29,234
30,875
36,065
7,962 8,674
2015 2016 2017 2018 1Q18 1Q19
9,074
10,814 11,314
12,371
3,168 3,380
2015 2016 2017 2018 1Q18 1Q19
7,746
9,244
9,893 10,823
2,822 2,902
7,880
9,244
13,568
11,216
2,822 2,847
2015 2016 2017 2018 1Q18 1Q19
% YoY Growth 2015 2016 2017 2018 1Q18 /3 1Q19 /3
Total revenues (Exc. non-recurring items) /1 9% 14% 6% 17% 3% 9%
Operating profit (Exc. non-recurring items) 7% 19% 5% 9% (1%) 6%
Normalized Net profit 7% 19% 7% 9% 2% 3%
Net profit 8% 17% 47% (17%) 2% 1%
Same store revenue growth 2% 2% 4% 3% 3% 2.4% /2
Gross Profit Margin (Exc. Other Income)(%) 48% 49% 50% 48% 52% 50%
EBITDA Margin (%) 53% 54% 54% 51% 57% 56%

DASHBOARD
Page 27
APPENDICES
STRATEGY
UPDATES
GLAND
OVERVIEW
Retail 84%
Office 2%
Food center 2%
Hotel 4%
Management
fee 2%
Other income
4%
Residential 2%
Total RevenueStrong growth achieved despite residential cooldown
25,713
29,234 30,875
36,065
7,962 8,674
0
5,000
10,000
15,000
20,000
25,000
30,000
35,000
40,000
0
5,000
10,000
15,000
20,000
25,000
30,000
35,000
40,000
2015 2016 2017 2018 1Q18 1Q19
(THB mn)
Note: /1 Includes revenues from residential projects and water & amusement park, and property management fees from CPNREIT & CPNCG.Excludes non-recurring items.
/2 Changed from “Revenue from food and beverages sales” due to the adoption of TFRS 15 from January 1, 2019 onwards to better reflect the nature of business of food center services.
1Q19 Breakdown
1Q19 total revenues /1 +9% YoY mainly contributed by
Rent and services +10.5% YoY
• Contributions from new shopping malls in 2018: Central
Phuket Floresta
• Improved performances at malls under renovation:
CentralWorld and CentralPlaza Rama 3
• Strong performances of existing shopping malls,
especially in Bangkok Metropolitan Area
Food center services /2 +20.6% YoY
• New food centers opened in 2018 at Central Phuket
Floresta, as well as renovated food court opened in 2018
at CentralWorld and Rama 3.
• Strong performances of existing food centers from
continuous roll-out of Food Destinations.
Hotel operations -0.5% YoY
• Lower overall occupancy rate as tourism seasonality
softens whereas F&B sales remain strong.
Real estate sales -34.0% YoY
• Lower number of condominium transfers as almost all the
units have been transferred since 2018
Active marketing and promotional events throughout the year
Collaboration with business partners, holding promotional
campaigns to encourage more spending from local
customers and cater for expanding foreign tourists visiting
Thailand, are vital to the strong revenue performance
throughout the year.
+9% YoY
• Rent from shops
• Promotional Area
(Events)
• Service income
• Convention hall
• On site media

DASHBOARD
Page 28
APPENDICES
STRATEGY
UPDATES
GLAND
OVERVIEW
Cost of OperationClosely aligned with revenue growth
12,634 14,041 14,518
17,579
3,592 3,955
0
4,000
8,000
12,000
16,000
20,000
2015 2016 2017 2018 1Q18 1Q19
(THB mn)
1Q19 Breakdown
1Q19 total costs /1 +10% YoY mainly contributed by
Cost of rent and services +11.9% YoY
• Higher operating and depreciation costs of newly
opened malls and renovated projects in 2018, namely
Central Phuket Floresta, CentralWorld and CentralPlazaRama 3.
• Higher maintenance, repair and personnel expenses to
support the expansion of new shopping malls.
• Higher utility cost, increased from the same period a year
earlier amidst the continuous rise in electricity Ft rate
throughout 2018.
Cost of food center services /2 +22.5% YoY
• Better cost management at existing food courts despite
higher cost from newly opened food courts in 2018.
Cost of hotel operations +14.3% YoY
• Mainly driven by the increase in food and beverages
sales at the hotels, otherwise in-line with revenue from
hotel operations.
Cost of real estate sales -44.6% YoY
• Consistent with the lower number of transfers with gross
profit margin maintained above target.
Continued focus on efficient cost management
Implementation of energy conservation initiatives at shopping
malls to yield lower electricity unit consumption, in face of
rising unit cost, is actively carried out to maintain or increase
overall gross profit margin.
+10% YoY
Note: /1 Excludes non-recurring items./2 Changed from “Cost of food and beverages sales” due to the adoption of TFRS 15 from January 1, 2019 onwards to better reflect the nature
of business of food center services.
Retail 92%Office 2%
Food center 2%
Hotel 3%
Residential
2%

DASHBOARD
Page 29
APPENDICES
STRATEGY
UPDATES
GLAND
OVERVIEW
SG&A Expenses BreakdownHigher cost base amidst business expansion
Personnel 50%
Advertising &
Promotion
12%
Depreciation
9%
Rental
Expense to
REIT 6%
Others 22%
4,030 4,406
5,066
6,114
1,203 1,421
0
1,000
2,000
3,000
4,000
5,000
6,000
7,000
2015 2016 2017 2018 1Q18 1Q19
(THB mn)
1Q19 Breakdown
1Q19 SG&A expenses +18% YoY mainly contributed by
• Higher personnel expenses to support business
expansion.
• Increase in various administrative expenses due to the
larger business size, as well as to support future business
expansion. The amount also includes administrative
expenses associated with GLAND’s operations.
Balancing overhead expenses with business plan
Close monitoring of operating performance and maintain
optimal SG&A expenses level according to business
requirements with potential incremental savings from 1)
synergy with Central Group in marketing activities and supply
chain management 2) preparing organizational readiness for
future growth
+18% YoY

DASHBOARD
Page 30
APPENDICES
STRATEGY
UPDATES
GLAND
OVERVIEW
Debt AnalysisHigher interest cost from shares purchase in GLAND in 2018
Finance cost and average cost of debt
Credit Rating Rating Outlook
AA Stable➢ Corporate credit
➢ Senior unsecured
debenture
Note: Weighted average interest rate was derived from interest expenses including interest capitalization for projects under development.All borrowings at denominated in THB. Includes consolidation of GLAND’s debt at THB 8,105 mn
1Q19 Debt Breakdown
29,785THB mn
29,785THB mn
+78% YoY677
509
633
364
418
3.89% 3.47%
3.23% 2.81%
3.08%
0%
1%
2%
3%
4%
5%
6%
-
100
200
300
400
500
600
700
800
2014 2015 2016 2017 2018
Interest expenses RS: Weighted average cost of debt
(THB mn)
105 175 186
3.17% 3.31% 3.30%
0%
1%
2%
3%
4%
5%
6%
-
200
400
600
800
1,000
1,200
1Q18 4Q18 1Q19 Fixed47%
Floating53%
Long-term loan
30% Short-term loan
30%
Short-term
bond
3%
Long-term bond
37%

DASHBOARD
Page 31
APPENDICES
STRATEGY
UPDATES
GLAND
OVERVIEW
Capital StructureNet gearing relatively stable compared to end of 2018
CPN’s net D/E ratios are historically below its debt covenant of 1.75x
1,869 3,773 4,326
3,204 5,361 3,067
3,143
19,842
16,019 22,623 17,904
9,529
30,398 29,785
36,824
41,748
46,801
53,005
63,880
74,176 77,050
0.49
0.29
0.39
0.28
0.07
0.37 0.35
0.00
0.10
0.20
0.30
0.40
0.50
0.60
0
10,000
20,000
30,000
40,000
50,000
60,000
70,000
80,000
2013 2014 2015 2016 2017 2018 1Q19
Cash & current investment Interest bearing debts Equity RS: Net D/E
(THB mn)(Times)

DASHBOARD
Page 32
APPENDICES
STRATEGY
UPDATES
GLAND
OVERVIEW
Impact of TFRS 15Amendment to the recognition of F&B revenue and costs
Under TFRS 15, revenue and cost of food center services is determined by whether or not the company acts as an agent or the principal in the transaction
Note: The adoption of TFRS 15 : Revenue from Contracts with Customers, effective for the fiscal period starting January 1, 2019 onwards, replaced TAS 18 : Revenue, which the company assumes significant risk and reward of ownership of the goods.
AMOUNT FOR EXAMPLE ONLY BEFORE ADJUSTMENT AFTER
REVENUE FROM FOOD & BEVERAGES SALES
(AGENT)120 (70) 50
REVENUE FROM FOOD CENTER SERVICES
(PRINCIPAL)30 - 30
REVENUE FROM FOOD & BEVERAGES BUSINESS 150 (70) 80
COST OF FOOD & BEVERAGES SALES
(AGENT)70 (70) -
COST OF FOOD CENTER SERVICES
(PRINCIPAL)10 - 10
COST OF FOOD & BEVERAGES BUSINESS 80 (70) 10
GROSS PROFIT FROM F&B (FOOD CENTER SERVICES) 70 - 70

DASHBOARD
Page 33
Financial StatementsStatement of Comprehensive Income
APPENDICES
STRATEGY
UPDATES
GLAND
OVERVIEW
Note: Due to the adoption of TFRS 15 on January 1, 2019 onwards, revenue and cost of food center services for the current and comparison periods have been adjusted to reflect the nature of the food center services business (previously reported as revenue and costs of food and beverages).
1Q 4Q 1Q YoY QoQ
2018 2018 2019 (%) (%)
Revenue from rent and services 6,776 7,370 7,488 11% 2%
Retail 6,603 7,193 7,310 11% 2%
Office 173 177 178 3% 0%
Revenue from hotel operations 310 370 309 (0%) (17%)
Revenue from food center services 169 211 204 21% (4%)
Revenue from real estate sales 216 377 142 (34%) (62%)
Other income 492 699 577 17% (17%)
Total revenues 7,962 9,028 8,719 10% (3%)
Excluding non-recurring items 7,962 8,943 8,674 9% (3%)
Cost of rent and services 3,299 3,797 3,790 15% (0%)
Retail 3,234 3,729 3,725 15% (0%)
Office 65 68 65 0% (5%)
Cost of hotel operations 87 173 99 14% (43%)
Cost of food center services 71 106 91 28% (14%)
Cost of real estate sales 135 191 75 (44%) (61%)
Total cost of operations 3,592 4,267 4,055 13% (5%)
Excluding non-recurring items 3,592 4,167 3,955 10% (5%)
Selling, general and admin expense 1,203 1,875 1,421 18% (24%)
Operating profits 3,168 2,886 3,243 2% 12%
Excluding non-recurring items 3,168 2,901 3,298 4% 14%
Net finance cost/income tax/others 345 356 396 15% 11%
Net profit 2,822 2,530 2,847 1% 13%
Excluding non-recurring items 2,822 2,545 2,902 3% 14%
Earnings per basic share (THB) 0.63 0.56 0.63 1% 13%
Excluding non-recurring items 0.63 0.57 0.65 3% 14%
Unit: million THB
DASHBOARD
Page 34
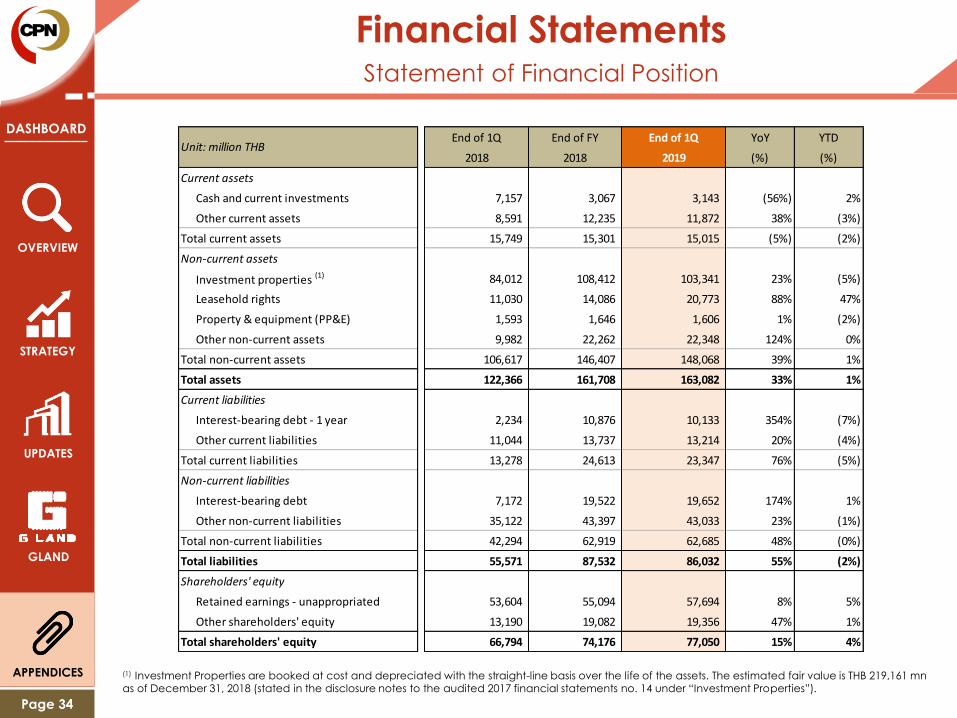
Financial StatementsStatement of Financial Position
APPENDICES
STRATEGY
UPDATES
GLAND
OVERVIEW
(1) Investment Properties are booked at cost and depreciated with the straight-line basis over the life of the assets. The estimated fair value is THB 219,161 mnas of December 31, 2018 (stated in the disclosure notes to the audited 2017 financial statements no. 14 under “Investment Properties”).
End of 1Q End of FY End of 1Q YoY YTD
2018 2018 2019 (%) (%)
Current assets
Cash and current investments 7,157 3,067 3,143 (56%) 2%
Other current assets 8,591 12,235 11,872 38% (3%)
Total current assets 15,749 15,301 15,015 (5%) (2%)
Non-current assets
Investment properties (1) 84,012 108,412 103,341 23% (5%)
Leasehold rights 11,030 14,086 20,773 88% 47%
Property & equipment (PP&E) 1,593 1,646 1,606 1% (2%)
Other non-current assets 9,982 22,262 22,348 124% 0%
Total non-current assets 106,617 146,407 148,068 39% 1%
Total assets 122,366 161,708 163,082 33% 1%
Current liabilities
Interest-bearing debt - 1 year 2,234 10,876 10,133 354% (7%)
Other current liabilities 11,044 13,737 13,214 20% (4%)
Total current liabilities 13,278 24,613 23,347 76% (5%)
Non-current liabilities
Interest-bearing debt 7,172 19,522 19,652 174% 1%
Other non-current liabilities 35,122 43,397 43,033 23% (1%)
Total non-current liabilities 42,294 62,919 62,685 48% (0%)
Total liabilities 55,571 87,532 86,032 55% (2%)
Shareholders' equity
Retained earnings - unappropriated 53,604 55,094 57,694 8% 5%
Other shareholders' equity 13,190 19,082 19,356 47% 1%
Total shareholders' equity 66,794 74,176 77,050 15% 4%
Unit: million THB

DASHBOARD
Page 35
Awards and AccoladesGlobally recognized for outstanding achievements
Sustainable Retail Property Developer
and Manager
AccreditedEnergy
Conserver
Top-Class
Brand and Management
5consec.
years
(2014-18) 4consec.
years
(2015-18)
CentralPlaza
Khonkaen
CentralFestival
Chiangmai
5consec.
years
(2014-18)
Thailand’s Top
Corporate Brands 2018 for property development
sector in recognition of the most
widely regarded brand amongst
customers, investors and the
general public.
Member of Dow Jones Sustainability Indices (DJSI) in 2018 showcases a track record of
excellence in performance, governance,
social and environmental development
SET Thailand Sustainability Investment 2018 listing confirms CPN’s commitment towards sustainable
growth and focus on environmental, social and
governance (ESG) factors
Thailand Energy Awards 2018 honors CPN on
developing and promoting energy
conservation retail facilities at 2
shopping centers.
Drive Award 2018 – Finance Excellence
Sponsored by Chulalongkorn University,
was given to the top Thai company that
demonstrated excellence in financial
leadership, performance, strategy and
management.
Best CEO – SET Awards 2018
Mr. Preecha Ekkunagul, President & CEO of
CPN was awarded the “Best CEO 2018” at
the SET Awards 2018, in recognition for
having demonstrated outstanding
performances in the company’s business,
strategic vision and sustainable
developmentAPPENDICES
STRATEGY
UPDATES
GLAND
OVERVIEW

DASHBOARD
Page 36
APPENDICES
STRATEGY
UPDATES
GLAND
OVERVIEW
CPN Shares Trading StatisticsAs at end of 1Q19
Dividend History
Dividend policy: paid annually approximately 40% of net profit
(unless there is compelling reason against this).
Note 1: Par split from THB 1.00 to THB 0.50 per share effective on May 7, 2013
Key Trading Statistics as of 1Q19
Key Metrics THB
Par Value 0.50
Share Price (THB) 73.25
Earnings per Diluted Share (THB) 0.63
P/E (x) 29.31
P/BV (x) 5.00
Dividend Yield(3) (%) 1.50%
Market Capitalization (THB bn) 328.74
Authorized Share Capital (mn shares) 4,488
Key Metrics 2018 2017 2016 2015 2014 2013
Par Value (THB) 0.50 0.50 0.50 0.50 0.50 0.50(1)
Dividend (THB/Share) 1.10 1.40 0.83 0.70 0.65 0.55
Dividend Paid
(THB mn)4,937 6,283 3,725 3,142 2,917 2,468
Dividend Payout
Ratio44% 46% 40% 40% 40% 39%

DASHBOARD
Page 37
APPENDICES
STRATEGY
UPDATES
GLAND
OVERVIEW
CPNREIT and CPNCGAsset performance summary
Note 1: Includes rental agreements < 1 year such as kiosk, carts, ATMs and coin machines and CPN acts as the property manager.Note 2: Percentage based on leasable area.
On December 1, 2017, CPNRF was converted into CPNREIT, which also leased additional assets in
CentralFestival Pattaya Beach and Hilton Pattaya. At the end of 4Q17, CPNREIT has five retail properties
and two office towers in its portfolio, with CPN REIT Management Co., Ltd., as the REIT manager and CPN
as the property manager.
CPNCG was established in September 2012 and currently owns one office with SCB Asset Management
Co., Ltd. as the fund manager and CPN as the property manager.
CPNREIT PropertiesRemaining Life Leasable Area(1) Occupancy Rate (%) (2)
(years) (sq.m.) 1Q18 4Q18 1Q19
Rama 3 (Retail) 76 Yr & 4 M 37,137 84 94 94
Rama 2 (Retail) 6 Yr & 4 M 82,588 95 96 95
Pinklao (Retail) 5 Yr & 9 M 27,656 99 99 98
Chiangmai Airport (Retail) 25 Yr & 1 M 37,820 92 93 94
Pattaya Beach (Retail) 18 Yr & 4 M 29,404 95 98 98
Pinklao Tower A & B (Office) 5 Yr & 9 M 34,320 83 90 90
Total NLA and Occupancy Rate for Retail and Office 248,925 92 95 95
Hilton Pattaya (Hotel) 18 Yr & 4 M 302 rooms 98 91 93
CPNCG Office PropertyRemaining Life
Leasable Area(1) (sq.m.)Occupancy Rate (%) (2)
(years) 1Q18 4Q18 1Q19
CentralWorld (Office) 14 Yr & 6 M 81,490 99 99 98
DASHBOARD
Page 38
APPENDICES
STRATEGY
UPDATES
GLAND
OVERVIEW
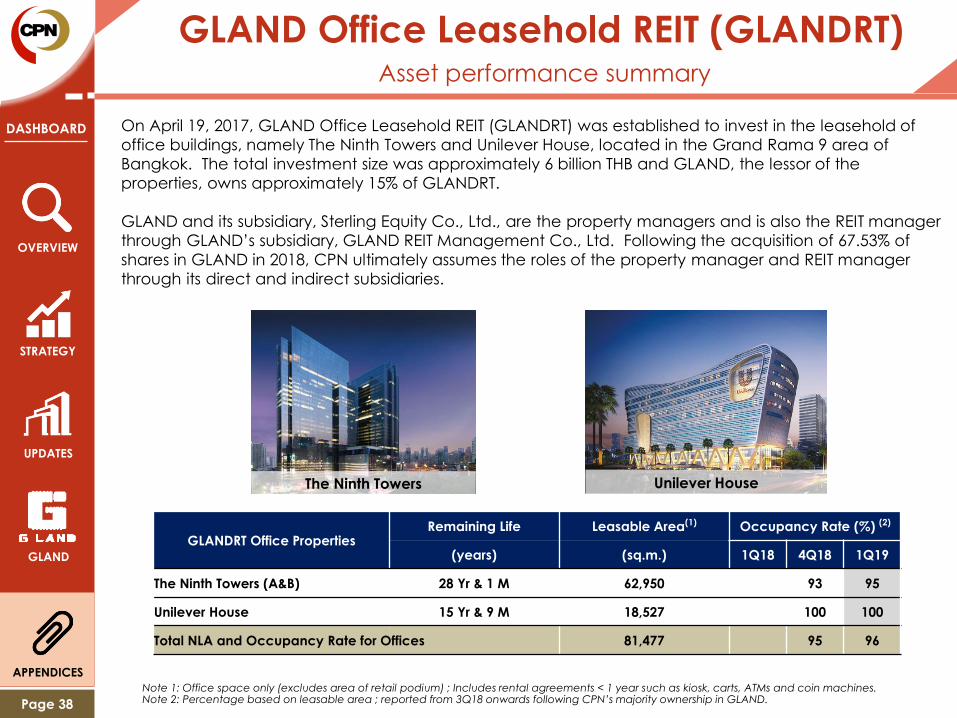
GLAND Office Leasehold REIT (GLANDRT)Asset performance summary
Note 1: Office space only (excludes area of retail podium) ; Includes rental agreements < 1 year such as kiosk, carts, ATMs and coin machines.Note 2: Percentage based on leasable area ; reported from 3Q18 onwards following CPN’s majority ownership in GLAND.
On April 19, 2017, GLAND Office Leasehold REIT (GLANDRT) was established to invest in the leasehold of
office buildings, namely The Ninth Towers and Unilever House, located in the Grand Rama 9 area of
Bangkok. The total investment size was approximately 6 billion THB and GLAND, the lessor of the
properties, owns approximately 15% of GLANDRT.
GLAND and its subsidiary, Sterling Equity Co., Ltd., are the property managers and is also the REIT manager
through GLAND’s subsidiary, GLAND REIT Management Co., Ltd. Following the acquisition of 67.53% of
shares in GLAND in 2018, CPN ultimately assumes the roles of the property manager and REIT manager
through its direct and indirect subsidiaries.
GLANDRT Office PropertiesRemaining Life Leasable Area(1) Occupancy Rate (%) (2)
(years) (sq.m.) 1Q18 4Q18 1Q19
The Ninth Towers (A&B) 28 Yr & 1 M 62,950 93 95
Unilever House 15 Yr & 9 M 18,527 100 100
Total NLA and Occupancy Rate for Offices 81,477 95 96
The Ninth Towers Unilever House