2017-18 budget paper 1 - chapter 4 - 2017-18 budget and ... · web view0.6 0.6 0.6 .... ... 1.5...
TRANSCRIPT

4 2017-18 BUDGET AND FORWARD ESTIMATES
Key Issues
The Net Operating Balance is expected to be in surplus throughout the 2017-18 Budget and Forward Estimates period, with an estimated surplus of $54.3 million for 2017-18.
The Fiscal Balance is estimated to be a deficit of $253.9 million for 2017-18, with a projected improvement over the Forward Estimates period to achieve surpluses of $2.8 million in 2019-20 and $71.1 million in 2020-21.
In relation to Net Debt, whilst reducing in 2018-19, Net Cash and Investments remains positive reaching a level of $339.6 million as at 30 June 2021. This reflects the impact of estimated Net Operating Balance outcomes and infrastructure expenditure levels.
This chapter includes the Policy and Parameter Statement which provides a reconciliation of the major movements in the Net Operating Balance and the Fiscal Balance between the Budget and Forward Estimates presented in the 2016-17 Budget Papers and those in these Budget Papers.
2017-18 Budget and Forward Estimates 45

OVERVIEWThis chapter includes the General Government Sector Financial Statements for the 2017-18 Budget and Forward Estimates period and the Policy and Parameter Statement which reflects changes between the Budget and Forward Estimates reported in the 2016-17 Budget Papers and the 2017-18 Budget Papers.
The financial statements in this chapter have been prepared in accordance with the Uniform Presentation Framework (UPF). The statements present information for the 2016-17 Budget and for the 2017-18 Budget and Forward Estimates. Taxation information, required under the UPF, is provided in chapter 5 of this Budget Paper.
In accordance with the UPF, the final end of year results for the General Government Sector will be available in the Treasurer's Annual Financial Report 2016-17, which will be publicly released by no later than 31 October 2017.
46 2017-18 Budget and Forward Estimates

GOVERNMENT FINANCIAL ESTIMATESTables 4.1 to 4.3 detail the Income Statement, Balance Sheet and Cash Flow Statement for the General Government Sector.
Table 4.1: General Government Income Statement2016-17)
)Budget)
2017-18))
Budget)
2018-19)Forward)Estimate)
2019-20)Forward)Estimate)
2020-21)Forward)Estimate)
$m) $m) $m) $m) $m)
Revenue from Transactions1
Grants 3 634.6) 3 682.9) 3 673.5) 3 735.4) 3 748.3)
Taxation 1 055.6) 1 128.5) 1 147.4) 1 173.0) 1 198.9)
Sales of Goods and Services 352.9) 408.0) 417.0) 424.8) 428.7)
Fines and Regulatory Fees 96.5) 98.9) 99.3) 100.3) 101.6)
Interest Income 16.5) 19.6) 17.6) 16.0) 17.2)
Dividend, Tax and Rate Equivalent Income 263.8) 358.4) 338.2) 370.1) 390.4)
Other Revenue 153.8) 177.7) 170.1) 165.2) 163.5)
5 573.7) 5 874.0) 5 863.0) 5 984.8) 6 048.7)
Less Expenses from TransactionsEmployee Expenses2 2 311.0) 2 400.4) 2 430.4) 2 461.6) 2 533.0)
Superannuation3 284.6) 273.5) 269.7) 270.0) 271.0)
Depreciation 264.6) 268.6) 263.7) 322.8) 337.6)
Supplies and Consumables4 1 105.9) 1 227.8) 1 186.1) 1 187.2) 1 206.8)
Nominal Superannuation Interest Expense5 288.2) 285.6) 289.7) 293.3) 296.2)
Borrowing Costs 10.3) 9.8) 9.5) 9.0) 8.2)
Grant Expenses6 1 206.2) 1 314.3) 1 333.4) 1 362.4) 1 322.8)
Other Expenses 25.4) 39.7) 29.8) 27.3) 27.8)
5 496.3) 5 819.8) 5 812.3) 5 933.6) 6 003.4)
Equals NET OPERATING BALANCE 77.3) 54.3) 50.7) 51.3) 45.3)
Plus Other Economic Flows - Included in Operating Result
Gain/(Loss) on Disposal of Non-Financial Assets 10.5) 15.3) 12.2) 12.7) 12.8)
Movement in Investments in GBEs and SOCs7 19.5) (104.2) 11.2) 37.4) 50.2)
Other Gains/(Losses) (21.2) 9.8) (11.4) (7.0) (8.2)
8.8) (79.0) 12.1) 43.0) 54.8)
Equals Operating Result 86.1) (24.8) 62.8) 94.3) 100.0)
2017-18 Budget and Forward Estimates 47

Table 4.1: General Government Income Statement (continued)2016-17)
)Budget)
2017-18))
Budget)
2018-19)Forward)Estimate)
2019-20)Forward)Estimate)
2020-21)Forward)Estimate)
$m) $m) $m) $m) $m)
Plus Other Economic Flows - Other Movements in Equity
Revaluations of Non-Financial Assets 252.3) 250.8) 268.4) 288.5) 294.9)
Other Non-Owner Movements in Equity 3.3) 3.8) 3.8) 3.8) 3.8)
255.5) 254.6) 272.2) 292.3) 298.7)
Equals Comprehensive Result 341.6) 229.8) 335.0) 386.6) 398.7)
KEY FISCAL AGGREGATES
NET OPERATING BALANCE 77.3) 54.3) 50.7) 51.3) 45.3)
Less Net Acquisition of Non-Financial AssetsPurchases of Non-Financial Assets8 530.8) 609.9) 574.0) 402.1) 342.7)
Less Sale of Non-Financial Assets 28.3) 33.2) 30.4) 30.8) 30.9)
Less Depreciation 264.6) 268.6) 263.7) 322.8) 337.6)
237.9) 308.2) 279.9) 48.5) (25.8)
Equals FISCAL BALANCE (160.6) (253.9) (229.2) 2.8) 71.1)
Notes:1. Detailed information on revenue estimates is provided in chapter 5 of this Budget Paper.2. The increase in Employee Expenses in 2017-18 primarily relates to the Department of Education; the Tasmanian
Health Service and the Department of Justice for increases associated with the delivery of 2017-18 Budget initiatives. Further information in relation to agency initiatives is contained in the relevant agency chapter in Government Services, Budget Paper No 2. The increase in 2020-21 primarily reflects the impact of the proposed voluntary earlier school starting age resulting from the new Education Act (which is contingent on a Ministerial Order being approved by Parliament by no later than 1 September 2017) and the Tasmanian Health Service for updates to Block and Activity Based Funding.
3. The movement in Superannuation reflects an actuarial assessment of the defined benefit schemes and agency expenditure estimates for accumulation scheme members.
4. The increase in Supplies and Consumables in 2017-18 and over the Forward Estimates primarily reflects the listing of Hepatitis C medications on the Pharmaceutical Benefits Scheme and revised Activity Based Funding (ABF) and Block funding estimates. In addition, the increase in expenditure in 2017-18 also reflects increased costs for the Tasmanian Risk Management Fund due to higher medical and property claims expenditure.
5. The decrease in Nominal Superannuation Interest Expense in 2017-18 reflects a revised actuarial assessment of the defined benefit schemes.
6. The increase in Grant Expenses from 2017-18 primarily reflects increased funding to non-government schools under the Students First education reforms; an updated funding profile for the Northern Cities Major Development Initiative and the implementation of the Bilateral Agreement for the Transition to the NDIS with the Australian Government.
7. The decrease in Movement in Investments in GBEs and SOCs in 2017-18 of $123.7 million reflects changes in the net assets of the Public Non-Financial Corporations and Public Financial Corporations Sectors.
8. Additional information on agency 2017-18 Budget Infrastructure Investment is provided in chapter 6 of this Budget Paper.
48 2017-18 Budget and Forward Estimates

Table 4.2: General Government Balance Sheet as at 30 June2017)
Budget)
2018)
Budget)
2019)Forward)Estimate)
2020)Forward)Estimate)
2021)Forward)Estimate)
$m) $m) $m) $m) $m)
AssetsFinancial Assets
Cash and Deposits1 880.8) 1 117.2) 1 056.7) 1 075.5) 1 092.3)
Investments 54.2) 46.4) 48.6) 50.8) 53.0)
Equity Investment in PNFC & PFC Sectors2 4 482.8) 5 654.0) 5 715.6) 5 757.5) 5 807.6)
Other Equity Investments 27.4) 27.2) 31.3) 35.4) 38.1)
Receivables 316.6) 315.4) 312.2) 307.0) 303.0)
Other Financial Assets 847.0) 815.4) 868.0) 904.5) 918.7)
6 608.9) 7 975.7) 8 032.4) 8 130.7) 8 212.7)
Non-Financial AssetsLand and Buildings 6 098.6) 6 265.3) 6 535.8) 6 644.9) 6 705.4)
Infrastructure 4 779.3) 4 816.5) 5 108.1) 5 343.5) 5 553.0)
Plant and Equipment 224.6) 229.0) 218.3) 213.9) 217.6)
Heritage and Cultural Assets 502.4) 484.0) 496.1) 508.3) 520.5)
Investment Property 3.0) 3.5) 3.8) 4.0) 4.4)
Intangibles 51.8) 47.7) 45.8) 42.0) 37.8)
Assets Held for Sale 4.7) 4.8) 4.1) 3.9) 2.9)
Other Non-Financial Assets 31.5) 37.4) 37.5) 37.5) 33.9)
11 696.0) 11 888.1) 12 449.5) 12 798.0) 13 075.5)
Total Assets 18 304.9) 19 863.8) 20 481.9) 20 928.8) 21 288.2)
LiabilitiesBorrowings3 633.7) 711.8) 905.2) 913.4) 805.7)
Superannuation4 6 345.5) 6 266.3) 6 345.7) 6 412.6) 6 465.3)
Employee Entitlements 583.0) 618.8) 627.8) 610.5) 623.6)
Payables 134.9) 133.7) 133.3) 135.2) 137.1)
Other Liabilities 358.7) 409.7) 411.3) 412.0) 412.7)
Total Liabilities 8 055.7) 8 140.3) 8 423.4) 8 483.7) 8 444.4)
NET ASSETS 10 249.2) 11 723.5) 12 058.5) 12 445.0) 12 843.8)
2017-18 Budget and Forward Estimates 49

Table 4.2: General Government Balance Sheet as at 30 June (continued)
2017)
Budget)
2018)
Budget)
2019)Forward)Estimate)
2020)Forward)Estimate)
2021)Forward)Estimate)
$m) $m) $m) $m) $m)
EquityAccumulated Funds 5 293.3) 6 761.4) 6 828.0) 6 926.0) 7 029.9)
Asset Revaluation Reserve 4 955.9) 4 962.1) 5 230.5) 5 519.0) 5 813.9)
Total Equity 10 249.2) 11 723.5) 12 058.5) 12 445.0) 12 843.8)
NET WORTH5 10 249.2) 11 723.5) 12 058.5) 12 445.0) 12 843.8)
NET FINANCIAL WORTH6 (1 446.7) (164.6) (391.0) (353.0) (231.7)
NET FINANCIAL LIABILITIES7 5 929.6) 5 818.6) 6 106.6) 6 110.5) 6 039.4)
NET DEBT8 (301.3) (451.8) (200.0) (212.9) (339.6)
Notes:1. The increase in Cash and Deposits in 2018 primarily reflects a change in timing of Australian Government Funding
together with higher estimated cash balances at the end of 2017.2. The increase in Equity Investment in PNFC and PFC Sectors in 2018 primarily reflects an increase in Net Assets for
the Tasmanian Public Finance Corporation (following the transfer of the Australian Government Mersey Community Hospital payment to the Tasmanian Public Finance Corporation as a one-off equity contribution to be invested by the Tasmanian Public Finance Corporation with any returns to be retained in the Mersey Community Hospital Fund (payment expected to occur by 30 June 2017)), Hydro Tasmania, and Motor Accidents Insurance Board.
3. Borrowings of $711.8 million as at 30 June 2018 includes an estimated end of year borrowing of $499.1 million to be undertaken on 30 June 2018. The end of year borrowing has no impact on the Government’s Net Debt as the same amount will be borrowed and invested overnight on 30 June 2018 with the Tasmanian Public Finance Corporation, grossing-up the amount of cash held and borrowings. The change in Borrowings since the 2016-17 Budget is primarily due to changes in the estimated Consolidated Fund position.
4. The decrease in Superannuation in 2018 reflects the latest actuarial assessment of the liability related to the defined benefit schemes.
5. Net Worth represents Total Assets less Total Liabilities.6. Net Financial Worth represents Financial Assets less Total Liabilities.7. Net Financial Liabilities represents Total Liabilities less Financial Assets, excluding Equity Investment in PNFC &
PFC Sectors.8. Net Debt represents Borrowings less the sum of Cash and Deposits and Investments.
50 2017-18 Budget and Forward Estimates

Table 4.3: General Government Cash Flow Statement2016-17)
)Budget)
2017-18))
Budget)
2018-19)Forward)Estimate)
2019-20)Forward)Estimate)
2020-21)Forward)Estimate)
$m) $m) $m) $m) $m)
Cash Flows from Operating ActivitiesCash Receipts from Operating Activities
Grants Received 3 634.6) 3 682.9) 3 673.5) 3 735.4) 3 748.3)
Taxation 1 045.9) 1 127.3) 1 144.5) 1 171.3) 1 196.4)
Sales of Goods and Services 353.7) 408.0) 415.3) 423.1) 427.2)
Fines and Regulatory Fees 96.5) 98.9) 99.3) 100.3) 101.6)
Interest Received 16.6) 19.6) 17.5) 16.1) 17.2)
Dividend, Tax and Rate Equivalents 234.2) 372.4) 288.6) 338.7) 380.7)
Other Receipts 331.9) 365.3) 360.9) 338.7) 332.5)
5 713.5) 6 074.3) 5 999.5) 6 123.6) 6 203.9)
Cash Payments from Operating ActivitiesEmployee Entitlements (2 298.5) (2 393.0) (2 420.2) (2 474.9) (2 518.1)
Superannuation (442.6) (468.1) (478.7) (498.0) (513.9)
Supplies and Consumables (1 117.6) (1 239.9) (1 200.0) (1 199.1) (1 215.5)
Borrowing Costs (10.4) (9.8) (9.5) (9.1) (8.3)
Grants and Subsidies Paid (1 206.1) (1 314.2) (1 333.3) (1 362.3) (1 322.8)
Other Payments (205.9) (229.1) (221.4) (199.7) (196.9)
(5 281.2) (5 654.1) (5 663.2) (5 743.1) (5 775.4)
Net Cash Flows from Operating Activities 432.3) 420.3) 336.3) 380.5) 428.6)
Cash Flows from Investing ActivitiesNet Cash Flows from Non-Financial Assets
Purchases of Non-Financial Assets (524.8) (603.1) (564.8) (390.5) (330.8)
Sales of Non-Financial Assets 28.3) 33.0) 30.4) 30.8) 30.9)
(496.5) (570.1) (534.4) (359.8) (299.9)
Net Cash Flows from Financial Assets (Policy Purposes)
Equity Injections (63.2) (58.8) (54.4) (8.6) (2.7)
Net Advances Paid ....) (2.1) (2.2) (2.2) (2.2)
Equity Disposals 0.7) 0.7) 0.7) 0.7) 0.7)
(62.5) (60.3) (55.9) (10.0) (4.2)
2017-18 Budget and Forward Estimates 51

Table 4.3: General Government Cash Flow Statement (continued)2016-17)
)Budget)
2017-18))
Budget)
2018-19)Forward)Estimate)
2019-20)Forward)Estimate)
2020-21)Forward)Estimate)
$m) $m) $m) $m) $m)
Net Cash Flows from Investing Activities (559.0) (630.3) (590.3) (369.8) (304.1)
Net Cash Flows from Financing ActivitiesNet Borrowing (35.7) 147.8) 193.4) 8.2) (107.8)
(35.7) 147.8) 193.4) 8.2) (107.8)
Net Increase/(Decrease) in Cash Held (162.5) (62.3) (60.6) 18.9) 16.8)
Cash at Beginning of the Year 1 043.3) 1 179.6) 1 117.2) 1 056.7) 1 075.5)Cash at End of the Year 880.8) 1 117.2) 1 056.7) 1 075.5) 1 092.3)
KEY FISCAL AGGREGATES
Net Cash Flows from Operating Activities 432.3) 420.3) 336.3) 380.5) 428.6)
Plus Net Cash Flows from Non-Financial Assets (496.5) (570.1) (534.4) (359.8) (299.9)
Equals CASH SURPLUS/(DEFICIT) (64.2) (149.8) (198.1) 20.7) 128.7)
52 2017-18 Budget and Forward Estimates

POLICY AND PARAMETER STATEMENT
Introduction
The Policy and Parameter Statement (PPS) is a reconciliation of the major movements in the Net Operating Balance and the Fiscal Balance between two points in time. The movements reflect changes between the Budget and Forward Estimates reported in the 2016-17 Budget Papers and the 2017-18 Budget Papers.
The movements in the PPS are classified as revenue, expenses or net acquisition of non-financial assets and then further categorised as a policy or parameter change. The classification of a variation as a policy or parameter change is a matter of judgement and it is recognised that there may be some instances where part of a Government initiative may have both policy and parameter components. In exercising judgement, Treasury aims to ensure that Government decisions are made transparent.
Policy VariationFor the purpose of the PPS, a policy variation reflects a specific decision by the Government that has an impact on the Budget and Forward Estimates and is related to a new policy or represents a change in the Government's existing policy position since the previous Budget. A decision to change a Budget or Forward Estimate aggregate, which is consistent with an existing policy, is not a policy decision.
Parameter VariationA parameter variation reflects changes to the Budget and Forward Estimates due to the economic environment, the agency operating environment or the timing of a transaction.
Parameter variations will reflect the impact of changes in taxes, grants or other income that do not arise because of a Government decision and demand and cost variations in agency service delivery, including the provision of indexation. Variations resulting from the rollover of a new Forward Estimate year and changes in accounting policies, such as a change in an agency depreciation policy or the impact on estimates of a change in an Australian Accounting Standard are classified as parameter variations.
Table 4.4 provides a summary of the policy and parameter changes detailed in Table 4.5 that have impacted on the formulation of the 2017-18 Budget since the 2016-17 Budget.
Further InformationAdditional information on revenue estimates is provided in chapter 5 of this Budget Paper. Additional information on agency expenditure estimates is included in the relevant agency chapters in Government Services Budget Paper No 2.
It should be noted that the estimates presented in the Policy and Parameter Statement were finalised prior to the release of the Australian Government's 2017-18 Budget. Therefore, the movements included for Specific Purpose Payments and some National Partnership payments may differ from those calculated using published Australian Government 2017-18 Budget estimates.
2017-18 Budget and Forward Estimates 53

Table 4.4: Summary Policy and Parameter Statement, 2016-17 to 2020-21
2016-17)Estimated)Outcome)
2017-18))
Budget)
2018-19)Forward)Estimate)
2019-20)Forward)Estimate)
2020-21 Forward
Estimate1
$m) $m) $m) $m) $mForward Estimates (Net Operating Balance) as per
the 2016-17 Budget (A) 77.3 7.9 (61.0) 18.4 …. Forward Estimates (Fiscal Balance) as per the
2016-17 Budget (B) (160.6) (196.9) (165.0) 17.4 ….
REVENUEPolicy Decisions …. …. 40.0 40.0 ….
Parameter Adjustments 926.0 376.7 337.8 359.8 …. TOTAL REVENUE VARIATIONS (C) 926.0 376.7 377.8 399.8 ….
EXPENSESPolicy Decisions 41.2 202.3 188.0 186.4 204.2
Parameter Adjustments 150.1 128.0 78.1 180.6 …. TOTAL EXPENSE VARIATIONS (D) 191.3 330.3 266.1 367.0 ….
NET OPERATING BALANCE (A+C-D) 812.0 54.3 50.7 51.3 45.3
Less NET ACQUISITION OF NON-FINANCIAL ASSETSPurchases of Non-Financial Assets
Policy Decisions 21.1 74.6 69.7 58.5 57.4
Parameter Adjustments (56.6) 32.1 109.1 42.0 …. (35.5) 106.7 178.8 100.6 ….
Less Sale of Non-Financial AssetsPolicy Decisions …. 2.5 …. …. ….
Parameter Adjustments 1.0 2.2 1.6 2.0 …. 1.0 4.7 1.6 2.0 ….
Less Depreciation - Total Parameter Adjustments 2.5 (1.4) 1.3 51.1 …. NET ACQUISITION OF NON-FINANCIAL ASSETS
VARIATIONS (E) (39.0) 103.4 175.8 47.4 ….
FISCAL BALANCE (B+C-D-E) 613.1 (253.9) (229.2) 2.8 71.1
Note:1. Parameter adjustments for 2020-21 are not reflected in the Table as the 2020-21 Forward Estimate was not
published in the 2016-17 Budget. However, policy adjustments are reflected to show their full impact on the Budget and Forward Estimates.
54 2017-18 Budget and Forward Estimates

2017-18 Budget and Forward Estimates 55

Table 4.5: Policy and Parameter Statement, 2016-17 to 2020-212016-17)
Estimated)Outcome)
2017-18))
Budget)
2018-19)Forward)Estimate)
2019-20)Forward)Estimate)
2020-21 Forward
Estimate1
$m) $m) $m) $m) $m)Forward Estimates (Net Operating Balance) as per
the 2016-17 Budget (A) 77.3 7.9 (61.0) 18.4 …. Forward Estimates (Fiscal Balance) as per the
2016-17 Budget (B) (160.6) (196.9) (165.0) 17.4 ….
Revenue from TransactionsPolicy Decisions
Special Dividend .... .... 40.0 40.0 ....
Total Policy Decisions .... .... 40.0 40.0 ....
Parameter AdjustmentsTaxation
Betting Exchange Taxes and Levies2 (3.0) (3.5) (3.6) (3.7) ....
Casino Tax and Licence Fees (2.0) (1.7) (1.7) (1.9) ....
Duties3 37.0 59.4 49.6 47.4 ....
Guarantee Fees (0.9) (3.1) (2.7) (4.6) ....
Land Tax4 8.3 8.7 8.6 9.2 ....
Lottery Tax (0.7) (0.8) (0.9) (0.9) ....
Motor Taxation 0.7 0.3 0.3 0.4 ....
Payroll Tax5 .... (5.1) (7.8) (10.3) ....
State Fire Commission Operating Account (1.4) (1.8) (1.8) (1.8) ....
Totalizator Wagering Levy (0.1) (0.1) (0.1) (0.1) ....
Vehicle Registration Fees 0.5 0.5 0.5 0.5 ....
Total Taxation 38.4 52.6 40.6 34.3 ....
56 2017-18 Budget and Forward Estimates

Table 4.5: Policy and Parameter Statement, 2016-17 to 2020-21 (continued)
2016-17)Estimated)Outcome)
2017-18))
Budget)
2018-19)Forward)Estimate)
2019-20)Forward)Estimate)
2020-21 Forward
Estimate1
$m) $m) $m) $m) $m)Dividend, Tax and Rate Equivalent Income
Dividend incomeAurora Energy Pty Ltd 6.1 1.7 5.5 5.4 ....
Hydro Tasmania .... .... 12.0 16.5 ....
Motor Accidents Insurance Board 5.9 14.2 15.0 15.6 ....
Tasmanian Networks Pty Ltd 13.1 (10.0) (20.0) (7.1) ....
Tasmanian Ports Corporation Pty Ltd 1.4 0.3 (5.3) (1.1) ....
Tasmanian Public Finance Corporation (0.3) 77.5 79.2 82.0 ....
26.2 83.8 86.4 111.3 ....
Income Tax EquivalentsAurora Energy Pty Ltd 0.7 2.6 2.5 3.4 ....
Hydro Tasmania 4.6 14.7 11.9 24.7 ....
Metro Tasmania Pty Ltd .... .... .... .... ....
Motor Accidents Insurance Board 23.4 11.0 10.4 11.8 ....
Tasmanian Networks Pty Ltd (3.7) (10.0) (5.6) (2.7) ....
Tasmanian Ports Corporation Pty Ltd 0.1 (2.8) (1.8) (1.7) ....
Tasmanian Public Finance Corporation 1.5 1.7 1.7 0.9 ....
TT-Line Company Pty Ltd (0.4) (4.2) 1.5 0.1 ....
26.1 13.1 20.7 36.5 ....
Total Dividend, Tax and Rate Equivalent Income 52.3 96.9 107.1 147.8 ....
Interest Income 5.6 3.5 4.8 3.1 ....
Australian Government GrantsGeneral Purpose Payments
GST Revenue (44.2) 55.9 131.0 114.5 ....
(44.2) 55.9 131.0 114.5 ....
2017-18 Budget and Forward Estimates 57

Table 4.5: Policy and Parameter Statement, 2016-17 to 2020-21 (continued)
2016-17)Estimated)Outcome)
2017-18))
Budget)
2018-19)Forward)Estimate)
2019-20)Forward)Estimate)
2020-21 Forward
Estimate1
$m) $m) $m) $m) $m)National Partnership Payments
Community Services (including Disability) 0.1 .... .... .... ....
Education 0.7 0.4 .... .... ....
Environment 3.5 0.5 (4.6) .... ....
Healthcare 11.8 2.7 0.2 4.9 ....
Infrastructure (18.1) 108.2 10.5 2.1 ....
Mersey Community Hospital 730.4 .... .... .... ....
Natural Disaster Relief and Recovery
Arrangements 21.1 21.7 5.4 …. ….
Other Services (0.5) (0.1) (1.7) (2.0) ....
Skills and Workforce Development 1.1 .... .... .... ....
750.1 133.4 9.8 4.9 .... Specific Purpose Payments
Students First 2.4 13.4 25.7 33.0 ....
National Affordable Housing 0.2 0.2 0.2 0.3 ....
National Health Reform 17.9 11.4 11.7 12.0 ....
20.4 25.0 37.6 45.3 ....
Other Australian Government Grants 10.9 (69.1) (68.4) (68.3) ....
Total Australian Government Grants 737.2 145.2 110.0 96.4 ....
Agency RevenueEducation 0.5 0.7 0.9 1.3 ....
Finance-General 1.5 6.6 .... .... ....
Health and Human Services (2.8) (2.5) (3.9) (2.9) ....
Inland Fisheries Service (0.3) (0.5) (0.2) (0.2) ....
Justice 1.2 0.6 0.6 0.6 ....
Marine and Safety Tasmania 0.7 0.5 (0.2) (0.3) ....
Ministerial and Parliamentary Support 0.8 0.8 0.8 0.8 ....
Police, Fire and Emergency Management (0.5) 1.0 0.8 0.2 ....
Premier and Cabinet 3.0 0.6 (1.3) (1.4) ....
Primary Industries, Parks, Water and Environment 0.5 5.0 5.1 5.2 ....
Royal Tasmanian Botanical Gardens 0.3 0.4 0.2 0.2 ....
State Growth 20.7 25.3 27.5 25.3 ....
58 2017-18 Budget and Forward Estimates

Table 4.5: Policy and Parameter Statement, 2016-17 to 2020-21 (continued)
2016-17)Estimated)Outcome)
2017-18))
Budget)
2018-19)Forward)Estimate)
2019-20)Forward)Estimate)
2020-21 Forward
Estimate1
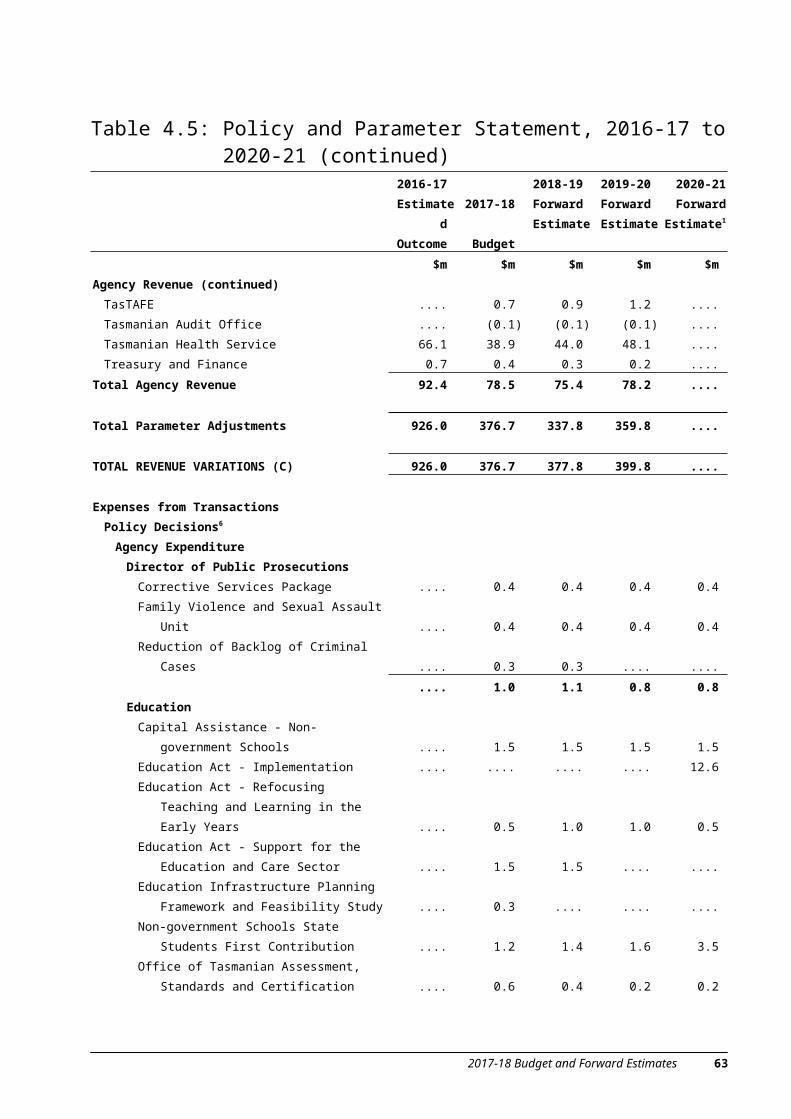
$m) $m) $m) $m) $m)Agency Revenue (continued)
TasTAFE .... 0.7 0.9 1.2 ....
Tasmanian Audit Office .... (0.1) (0.1) (0.1) ....
Tasmanian Health Service 66.1 38.9 44.0 48.1 ....
Treasury and Finance 0.7 0.4 0.3 0.2 ....
Total Agency Revenue 92.4 78.5 75.4 78.2 ....
Total Parameter Adjustments 926.0 376.7 337.8 359.8 ....
TOTAL REVENUE VARIATIONS (C) 926.0 376.7 377.8 399.8 ....
Expenses from TransactionsPolicy Decisions6
Agency ExpenditureDirector of Public Prosecutions
Corrective Services Package .... 0.4 0.4 0.4 0.4
Family Violence and Sexual Assault Unit .... 0.4 0.4 0.4 0.4
Reduction of Backlog of Criminal Cases .... 0.3 0.3 .... ....
.... 1.0 1.1 0.8 0.8 Education
Capital Assistance - Non-government Schools .... 1.5 1.5 1.5 1.5
Education Act - Implementation .... .... .... .... 12.6
Education Act - Refocusing Teaching and
Learning in the Early Years .... 0.5 1.0 1.0 0.5
Education Act - Support for the Education and
Care Sector .... 1.5 1.5 .... ....
Education Infrastructure Planning Framework
and Feasibility Study .... 0.3 .... .... ....
Non-government Schools State Students First
Contribution .... 1.2 1.4 1.6 3.5
Office of Tasmanian Assessment, Standards
and Certification .... 0.6 0.4 0.2 0.2
2017-18 Budget and Forward Estimates 59

Table 4.5: Policy and Parameter Statement, 2016-17 to 2020-21 (continued)
2016-17)Estimated)Outcome)
2017-18))
Budget)
2018-19)Forward)Estimate)
2019-20)Forward)Estimate)
2020-21 Forward
Estimate1
$m) $m) $m) $m) $m)Education (continued)
Primary Schools to Primary Industries .... 0.2 0.2 .... ....
Review of the School Improvement
Framework and Improved Assessment
and Reporting .... 0.4 .... .... ....
Supporting Student Learning - Stay ChatTY
Grant …. 0.3 …. …. ….
Supporting Student Learning - Child and
Student Wellbeing .... 0.4 0.4 0.4 0.4
Supporting Student Learning - Additional
School Health Nurses .... 1.0 1.0 1.0 1.0
Supporting Student Learning - School Support
Workers .... 1.7 1.7 1.7 1.7
Supporting Student Learning - Student
Engagement and Flexible Learning .... 0.7 1.4 1.4 1.4
Tasmanian Youth Orchestra .... 0.1 0.1 0.1 ....
.... 10.3 10.6 8.9 22.9 Finance-General
Accelerated Local Government Capital
Program 0.1 3.0 3.5 3.4 3.4
City Deal Launceston7,8 .... 1.3 2.0 1.8 1.8
Copper Mines of Tasmania Support9 .... 6.0 3.5 .... ....
Digital Transformation - CYS Client
Information System10 .... 0.3 .... .... ....
Digital Transformation - Justice Connect11 .... 0.2 .... .... ....
Digital Transformation Program Review
Strategy .... 0.3 .... .... ....
Digital Transformation Program Review
Strategy - Program Management .... .... 0.1 0.1 0.1
Digital Transformation - Project Unify12 .... .... 0.4 0.4 0.4
Energy Rebates for Business9 .... 20.0 …. .... ....
Fire Fighting Costs 0.8 .... .... .... ....
First Home Builder Assistance8 .... 6.8 3.6 .... ....
Health Funding Provision10 .... 20.0 20.0 30.0 30.0
Launceston Flood Risk Management Project .... 1.0 .... .... ....
Local Government Flood Costs 10.0 12.2 .... .... ....
60 2017-18 Budget and Forward Estimates

Table 4.5: Policy and Parameter Statement, 2016-17 to 2020-21 (continued)
2016-17)Estimated)Outcome)
2017-18))
Budget)
2018-19)Forward)Estimate)
2019-20)Forward)Estimate)
2020-21 Forward
Estimate1
$m) $m) $m) $m) $m)
2017-18 Budget and Forward Estimates 61

Finance-General (continued)Payroll Tax Rebate (Trainees, Apprentices
and Youth)8 .... 2.8 6.8 5.7 1.8
State Fire Commission Debt Retirement 5.0 .... .... .... ....
Structural Reviews .... 1.0 1.0 .... ....
Tasmanian Cycling Tourism Strategy …. 3.0 3.0 …. ….
TasWater - Payment to Councils8 .... .... 20.0 20.0 20.0
15.8 77.9 63.9 61.4 57.5 Health and Human Services and Tasmanian
Health ServiceBuilding a Joined Up Human Services Support
System .... 0.6 0.4 .... ....
Commissioner for Children and Young People .... 0.5 0.5 0.5 0.5
Elder Abuse .... 0.2 .... .... ....
Equal Remuneration Order (ERO) Costs .... .... .... .... 2.5
Frontline Staffing Costs - Supplementation .... 3.6 3.6 3.6 3.6
Housing Tasmania Property Modification
Program .... 2.0 .... .... ....
Investing in Ambulance Tasmania .... 2.1 2.5 2.5 2.5
Medical Cannabis Controlled Access Scheme
- Paediatric Epilepsy .... 0.9 0.9 0.9 0.9
Mental Health Service Delivery Priorities -
2017-18 Budget .... 3.4 4.2 4.2 4.2
Moonah Youth Facility .... 0.8 0.8 0.8 0.8
Out of Home Care - Additional Support .... 6.1 6.3 6.6 6.6
Patients First - Stage 2 - New Hospital Beds
and Staff 4.0 18.1 16.4 16.4 16.4
Securing a Second Medical and Police Search
and Rescue Helicopter .... 1.8 2.4 2.4 2.4
Streets Ahead and Homeshare - Additional
Investment13 .... (0.5) (0.5) (0.5) (0.5)
Youth Justice - Save the Children Bail
Program and Post-Detention Transition
Program .... 0.6 0.6 0.6 0.6
4.0 40.1 38.0 38.0 40.5 House of Assembly
House of Assembly Education Office .... 0.2 0.2 0.2 0.2
…. 0.2 0.2 0.2 0.2
Table 4.5: Policy and Parameter Statement, 2016-17 to 2020-21 (continued)
2016-17)Estimated)Outcome)
2017-18))
Budget)
2018-19)Forward)Estimate)
2019-20)Forward)Estimate)
2020-21 Forward
Estimate1
62 2017-18 Budget and Forward Estimates
$m) $m) $m) $m) $m)
Integrity CommissionRemuneration of the Integrity Commission
Board and the Chief Commissioner .... 0.1 0.1 0.1 0.1
…. 0.1 0.1 0.1 0.1 Justice
Community Education - Shared Economy .... 0.1 .... .... ....
Corrective Services Package - Suspended
Sentences .... 2.4 2.4 2.4 2.4
Corrective Services Package - Recurrent
Demand Analysis Specialist Resources .... 0.3 0.3 0.3 0.3
Corrective Services Package - Throughcare
and Reintegration .... 0.4 0.4 0.4 0.4
Eligible Persons Register .... 0.2 0.2 .... ....
Extension of Prison Infrastructure .... 0.3 1.1 1.1 1.2
Legal Assistance Services .... 1.3 1.3 .... ....
Local Provision Schedules .... 0.3 .... .... ....
Supreme Court Acting Judges 0.2 1.0 1.0 .... ….
Tasmanian Civil and Administrative Tribunal
(TASCAT) .... 0.1 .... .... ....
Tasmanian Prison Service - Current Cost and
Demand Pressure .... 4.0 4.0 4.0 4.0
0.2 10.4 10.7 8.2 8.3 Legislature-General
Heat, Light and Power .... 0.1 0.1 0.1 0.1
Joint Select Committee Enquiry - Future
Gaming Markets in Tasmania 0.1 0.1 .... .... ....
Public Accounts Committee Enquiry -
Government Owned Energy Entities 0.1 .... .... .... ....
Rent for Parliamentary Offices .... 0.1 0.1 0.1 0.1
Security Services 0.1 0.1 0.1 0.1 0.1
0.2 0.3 0.3 0.3 0.3 Office of the Governor
Security Arrangements .... 0.1 0.1 0.1 0.1
Upgrade Security Equipment .... 0.1 .... .... ....
…. 0.2 0.1 0.1 0.1
2017-18 Budget and Forward Estimates 63

Table 4.5: Policy and Parameter Statement, 2016-17 to 2020-21 (continued)
2016-17)Estimated)Outcome)
2017-18))
Budget)
2018-19)Forward)Estimate)
2019-20)Forward)Estimate)
2020-21 Forward
Estimate1
$m) $m) $m) $m) $m)Police, Fire and Emergency Management
2016 Tasmanian Flood Review 0.4 .... .... .... ....
Aerial Fire Appliances .... 3.8 .... .... ....
Body Worn Video .... 0.8 0.7 0.7 0.7
Emergency Services Computer Aided
Dispatch System .... 1.8 2.0 2.0 2.0
Flood Taskforce 1.0 .... .... .... ....
Fuel Reduction Program .... .... 9.0 9.0 9.0
Health and Wellbeing Program .... 1.5 1.5 1.5 1.5
Shoplifting Prevention Awareness Campaign .... 0.1 .... .... ....
1.4 7.9 13.2 13.2 13.2 Premier and Cabinet
20th Anniversary of the Port Arthur Massacre
Event14 .... .... .... .... ....
Aboriginal Land Council of Tasmania -
wukalina Cultural Walk 0.3 0.3 .... .... ....
Aboriginal People and Young Tasmanians
(State Service Employment) .... 0.3 0.3 0.3 0.3
Basketball Tasmania .... 0.3 .... .... ....
Beaconsfield Hart Shaft Rectification Works 1.1 .... .... .... ....
Circular Head Community Wellbeing Centre .... .... .... .... 3.5
City Mission: E-Waste Recycling Facility .... 0.1 .... .... ....
Climate Action 21: Tasmania's Climate
Change Action Plan 2017-2021 .... 0.8 0.8 0.8 0.8
Community Participation and Appeals Fund .... 0.1 0.1 .... ....
Cyber Security Program .... 0.3 0.3 0.3 0.3
Devonport Golf Club .... 1.4 1.4 0.7 ....
Dial Regional Sports Complex Upgrade .... .... .... .... 3.5
Elphin Sports Centre .... 0.2 .... .... ....
Enhancing the Tasmanian Brand .... 0.5 .... .... ....
Federation of Ethnic Communities' Councils of
Australia Congress .... .... 0.1 .... ....
Food Vans - Additional Support .... 0.1 .... .... ....
Foodbank .... 0.1 0.1 0.1 0.1
Football Federation of Tasmania .... 0.3 0.3 0.3 0.3
Local Government Boards of Inquiry 0.3 .... .... .... ....
Local Government Governance .... 0.2 0.1 .... ....
64 2017-18 Budget and Forward Estimates

Table 4.5: Policy and Parameter Statement, 2016-17 to 2020-21 (continued)
2016-17)Estimated)Outcome)
2017-18))
Budget)
2018-19)Forward)Estimate)
2019-20)Forward)Estimate)
2020-21 Forward
Estimate1
$m) $m) $m) $m) $m)Premier and Cabinet (continued)
Northern Stadium Strategy .... 0.1 .... .... ....
Oatlands Swimming Pool .... 0.8 0.8 0.4 ....
Physical Disability Sport .... 0.1 .... .... ....
Premier's Scholarship Fund15 .... 0.3 .... 0.1 0.1
Returned and Services League .... 0.1 .... .... ....
Risdon Vale Bike Collective16 .... 0.1 .... .... ....
Rugby Park .... 0.3 .... .... ....
Seniors and Active Ageing .... 0.3 .... .... ....
Tasmania Brand Skilled Migration Campaign .... 0.5 .... .... ....
Tasmanian Men's Shed Association Inc. .... 0.1 .... .... ....
Volunteering Tasmania - EV CREW 0.1 0.1 0.1 0.1 0.1
Welcome Home to Olympians and
Paralympians in 201617 .... .... .... .... ....
1.8 7.4 4.2 3.0 8.9 Primary Industries, Parks, Water and
EnvironmentAgri-Food Plan: Agricultural Landscapes
Rehabilitation Scheme 1.9 2.1 .... .... ....
Agri-Food Plan: Animal Welfare .... 0.4 0.4 0.4 0.4
Agri-Food Plan: Aquatic Animal Health .... 0.2 0.2 0.2 0.2
Agri-Food Plan: Bee Industry Futures18 .... .... .... .... ....
Agri-Food Plan: Biosecurity - Frontline
Services .... 0.2 0.2 0.2 0.2
Agri-Food Plan: Biosecurity - Invasive Species .... 0.5 0.5 0.5 0.5
Agri-Food Plan: Invasive Species - Cat
Management .... 0.4 0.4 0.4 0.4
Agri-Food Plan: POMS Industry Support .... 0.3 0.3 0.3 ....
Agri-Food Plan: Safe Farming Tasmania .... 0.2 0.2 0.2 0.2
Agri-Food Plan: Stock Underpass Pilot
Program .... 0.3 0.5 .... ....
Agri-Food Plan: Strategic Industry
Partnerships Program .... 0.3 0.3 0.3 0.3
Agri-Food Plan: TARFish .... 0.1 .... .... ....
Agri-Food Plan: Tasmanian Shellfish Quality
Assurance Program .... 0.2 0.2 0.2 0.2
2017-18 Budget and Forward Estimates 65

Table 4.5: Policy and Parameter Statement, 2016-17 to 2020-21 (continued)
2016-17)Estimated)Outcome)
2017-18))
Budget)
2018-19)Forward)Estimate)
2019-20)Forward)Estimate)
2020-21 Forward
Estimate1
$m) $m) $m) $m) $m)Primary Industries, Parks, Water and
Environment (continued)Ben Lomond Ski Patrol19 .... .... .... .... ....
Bushfire Planning, Mitigation and Response .... 0.5 0.5 0.5 0.5
Container Deposit Scheme - Model
Development .... 0.1 .... .... ....
June Floods - Acute Riparian Recovery 0.5 1.7 .... .... ....
June Floods - Assistance Grants 2.8 .... .... .... ....
Lewisham Foreshore Soft Erosion Trial .... 0.1 .... .... ....
Maria Island Rediscovered .... 0.2 .... .... ....
Orange-bellied Parrot .... 0.2 0.2 0.2 0.2
Pacific Oyster Mortality Syndrome Response 1.0 .... .... .... ....
Tamar Estuary and Esk Rivers Program .... 0.1 0.1 0.1 ....
6.2 7.7 3.7 3.2 2.9 State Growth
A Tasmanian Youth Arts Strategy .... 0.4 0.4 0.4 0.4
A Workforce for Now and the Future .... 0.3 0.2 0.2 0.2
Additional Screen Production Grant Funding .... 0.3 .... .... ....
Constellation Netball Cup Launceston 0.2 .... .... .... ....
Continuation of Launceston 10 and Stan
Siejka Cycling Classic20 .... .... .... .... ....
Dark MOFO 1.9 1.9 1.9 1.9 1.9
Digital Ready for Business .... 0.2 0.3 0.3 0.3
Drysdale Centre of Excellence .... 1.1 2.1 .... ....
Employment Partnership: Jobs Action
Package .... 1.8 1.3 0.5 0.5
Enduro World Series 0.1 .... .... .... ....
Enterprize Hubs .... 0.3 0.3 0.3 0.3
Extension of Beacon Foundation Funding .... 0.2 .... .... ....
Forestry CSO (Non-commercial and Roads)21 .... 3.2 8.0 8.0 8.0
Forward Planning for Roads (including
Launceston Traffic Planning) .... 0.5 .... 0.5 0.5
66 2017-18 Budget and Forward Estimates

Table 4.5: Policy and Parameter Statement, 2016-17 to 2020-21 (continued)
2016-17)Estimated)Outcome)
2017-18))
Budget)
2018-19)Forward)Estimate)
2019-20)Forward)Estimate)
2020-21 Forward
Estimate1
$m) $m) $m) $m) $m)State Growth (continued)
Global Education Strategy .... 0.9 0.7 0.7 0.7
India Engagement .... 0.2 0.2 .... ....
International Engagement .... 0.2 0.2 0.2 0.2
Kangaroo Bay International Hospitality
Training College .... 0.2 .... .... ....
Kentish Bus Service .... 0.2 0.2 .... ....
King Island Shipping 1.1 .... .... .... ....
Launceston Chamber of Commerce .... 0.2 .... .... ....
MAST Infrastructure - Woodbridge and Brid
River Jetties .... 0.6 0.6 .... ....
Mersey Forest Road - 2016 Floods 3.3 .... .... .... ....
Mining Sector Innovation .... 0.3 0.3 0.3 0.3
National Netball League Partnership 0.6 0.6 0.6 .... ....
Northern Cities Major Development Initiative -
Project Facilitation .... 0.2 0.2 .... ....
Northern Tasmania Development Corporation
(NTDC) .... 0.1 .... .... ....
Office of the Coordinator-General - Investment
Attraction and Major Projects Facilitation .... 0.6 .... .... ....
Population Growth Strategy .... 0.5 0.6 0.2 0.2
Rail Revitalisation Funding - Tranche Two .... .... .... 15.0 15.0
Small Business Grants to Support Apprentices
and Trainees .... 1.0 1.0 .... ....
Start-up Accelerator .... 0.5 0.5 .... ....
Strategic Growth Plan for Tasmania's Forest
Industries .... 0.5 0.5 0.5 0.5
Tasmanian Hospitality Association .... 0.1 0.1 0.1 ....
Tasmanian Museum and Art Gallery -
Organisational Reform .... 0.3 0.1 0.1 0.1
Tasmanian Small Business Council Support .... 0.1 .... .... ....
2017-18 Budget and Forward Estimates 67

Table 4.5: Policy and Parameter Statement, 2016-17 to 2020-21 (continued)
2016-17)Estimated)Outcome)
2017-18))
Budget)
2018-19)Forward)Estimate)
2019-20)Forward)Estimate)
2020-21 Forward
Estimate1
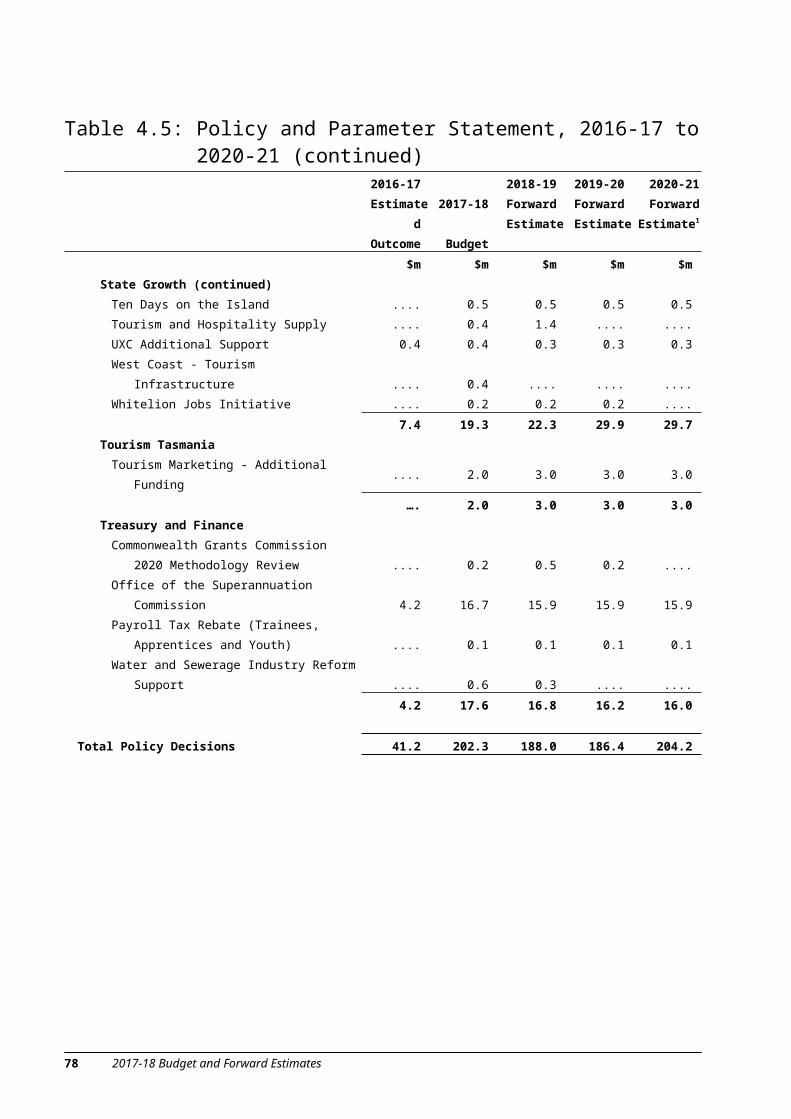
$m) $m) $m) $m) $m)State Growth (continued)
Ten Days on the Island .... 0.5 0.5 0.5 0.5
Tourism and Hospitality Supply .... 0.4 1.4 .... ....
UXC Additional Support 0.4 0.4 0.3 0.3 0.3
West Coast - Tourism Infrastructure .... 0.4 .... .... ....
Whitelion Jobs Initiative .... 0.2 0.2 0.2 ....
7.4 19.3 22.3 29.9 29.7 Tourism Tasmania
Tourism Marketing - Additional Funding .... 2.0 3.0 3.0 3.0
…. 2.0 3.0 3.0 3.0 Treasury and Finance
Commonwealth Grants Commission 2020
Methodology Review .... 0.2 0.5 0.2 ....
Office of the Superannuation Commission 4.2 16.7 15.9 15.9 15.9
Payroll Tax Rebate (Trainees, Apprentices
and Youth) .... 0.1 0.1 0.1 0.1
Water and Sewerage Industry Reform Support .... 0.6 0.3 .... ....
4.2 17.6 16.8 16.2 16.0
Total Policy Decisions 41.2 202.3 188.0 186.4 204.2
68 2017-18 Budget and Forward Estimates

Table 4.5: Policy and Parameter Statement, 2016-17 to 2020-21 (continued)
2016-17)Estimated)Outcome)
2017-18))
Budget)
2018-19)Forward)Estimate)
2019-20)Forward)Estimate)
2020-21 Forward
Estimate1
$m) $m) $m) $m) $m)
Parameter AdjustmentsDepreciation 2.5 (1.4) 1.3 51.1 .... Nominal Superannuation Interest Expense (51.9) (8.4) (9.6) (10.7) .... Borrowing Costs .... (0.3) (0.3) (0.3) ....
Agency ExpenditureDirector of Public Prosecutions 0.3 .... .... .... ....
Education 9.4 14.0 27.7 26.5 ....
Finance-General 28.0 (18.2) (31.8) (25.3) ....
Health and Human Services 17.9 (5.9) (14.5) (12.3) ....
Inland Fisheries Service (0.3) (0.2) 0.2 (0.1) ....
Integrity Commission 0.1 0.1 0.1 0.1 ....
Justice 5.3 2.1 2.0 1.4 ....
Legislative Council 0.2 0.2 0.2 0.2 ....
Marine and Safety Tasmania 2.4 (0.2) 0.1 (0.2) ....
Ministerial and Parliamentary Support 0.8 0.8 0.8 0.9 ....
Office of the Ombudsman (0.1) 0.2 0.1 0.1 ....
Police, Fire and Emergency Management (0.2) 1.0 0.8 0.2 ....
Premier and Cabinet 1.1 4.2 (2.0) (0.4) ....
Primary Industries, Parks, Water and
Environment 3.8 7.1 7.0 4.9 ....
Royal Tasmanian Botanical Gardens 0.5 0.6 0.2 0.2 ....
State Fire Commission 0.9 0.7 9.7 9.6 ....
State Growth 21.5 58.2 13.0 63.0 ....
TasTAFE (0.1) …. 1.1 1.7 ....
Tasmanian Health Service 106.7 75.2 75.5 71.5 ....
Treasury and Finance 1.3 (0.4) (0.4) (0.5) ....
Other22 .... (1.3) (3.1) (1.0) ....
Total Agency Expenditure 199.5 138.2 86.7 140.5 ....
Total Parameter Adjustments 150.1 128.0 78.1 180.6 ....
2017-18 Budget and Forward Estimates 69

Table 4.5: Policy and Parameter Statement, 2016-17 to 2020-21 (continued)
2016-17)Estimated)Outcome)
2017-18))
Budget)
2018-19)Forward)Estimate)
2019-20)Forward)Estimate)
2020-21 Forward
Estimate1
$m) $m) $m) $m) $m)TOTAL EXPENSES FROM TRANSACTIONS
VARIANCE (D) 191.3 330.3 266.1 367.0 ....
NET OPERATING BALANCE (A+C-D) 812.0 54.3 50.7 51.3 45.3
less NET ACQUISITION OF NON-FINANCIAL ASSETS FROM TRANSACTIONS
Purchases of Non-Financial Assets from Transactions
Policy Decisions23
EducationBoat Harbour Primary School .... 0.5 1.4 .... ....
Education Act Implementation - Capital .... .... 6.0 12.0 ....
Illawarra Primary School .... 0.5 2.4 .... ....
Lansdowne Crescent Primary School .... .... .... 1.1 3.6
Molesworth Primary School .... .... .... 0.3 1.6
Northern Economic Stimulus Package 1.0 11.3 (4.2) (8.1) ....
Queechy High School .... 2.0 .... .... ....
Southern Support School .... 0.4 3.9 .... ....
Spreyton Primary School .... .... .... 0.3 1.4
Taroona High School .... 1.1 3.9 .... ....
Year 7-12 Implementation Plan - Capital .... .... 1.5 1.5 1.5
1.0 15.7 14.9 7.1 8.1 Finance-General
Digital Transformation Priority Expenditure
Program8 .... 10.0 10.0 15.0 15.0
Digital Transformation - Project Unify12 .... 7.2 4.7 .... ....
Repatriation Hospital Capital10 …. 7.0 …. …. ….
.... 24.2 14.7 15.0 15.0 Health and Human Services and Tasmanian
Health ServiceCampbell Town Ambulance Station .... .... 0.1 1.2 1.6
Medical Cannabis Controlled Access Scheme -
Paediatric Epilepsy …. 0.1 …. …. ….
Mersey Community Hospital Capital Upgrades .... .... .... 15.0 20.0
Northern Economic Stimulus Package 5.0 (5.0) .... .... ....
Patients First - Stage 2 - New Hospital Beds and
Staff 1.7 …. …. …. ….
70 2017-18 Budget and Forward Estimates

2017-18 Budget and Forward Estimates 71

Table 4.5: Policy and Parameter Statement, 2016-17 to 2020-21 (continued)
2016-17)Estimated)Outcome)
2017-18))
Budget)
2018-19)Forward)Estimate)
2019-20)Forward)Estimate)
2020-21 Forward
Estimate1
$m) $m) $m) $m) $m)Health and Human Services and Tasmanian
Health Service (continued)St Helens Hospital Redevelopment 0.4 .... 3.6 .... ....
Statewide Hospital Critical Facility Upgrades .... 0.7 3.2 6.6 ....
Statewide Rural Health Facility Infrastructure
Upgrades .... .... .... 2.5 2.2
THS Infrastructure Upgrades .... .... .... 0.7 1.2
7.1 (4.2) 6.9 26.0 25.0 Justice
O’Hara Pre-Release Facility - Additional Units .... …. 0.8 0.7 ....
Mary Hutchinson Women's Prison - Mother and
Baby Unit …. …. …. 0.5 ….
Ron Barwick Minimum Security Prison - Cell
Recommissioning …. 1.0 2.0 …. ….
.... 1.0 2.8 1.2 .... Legislative Council
Legislative Council Chamber OH&S Issues and
Disability Access .... 0.7 .... .... ....
.... 0.7 .... .... .... Police, Fire and Emergency Management
Body Worn Video .... .... 0.1 .... 0.7
Large Vessel Replacement Program .... .... .... 1.2 3.5
.... .... 0.1 1.2 4.2 Primary Industries, Parks, Water and
EnvironmentBiotoxin Testing Laboratory .... 1.2 .... .... ....
Cradle Mountain Visitor Experience .... 8.8 10.0 3.0 ....
June 2016 Floods - Parks Infrastructure 9.0 2.9 .... .... ....
Maria Island Rediscovered .... 0.9 0.8 .... ....
Orange-bellied Parrot Facility24 .... 2.5 .... .... ....
Tourism Infrastructure in Parks .... 4.0 4.0 .... ....
9.0 20.3 14.8 3.0 .... State Growth
A Workforce for Now and the Future .... 0.1 0.1 0.1 0.1
Bonnet Hill Road .... 1.4 (1.4) .... ....
Flood Recovery - Roads Funding .... 4.7 .... .... ....
72 2017-18 Budget and Forward Estimates

Table 4.5: Policy and Parameter Statement, 2016-17 to 2020-21 (continued)
2016-17)Estimated)Outcome)
2017-18))
Budget)
2018-19)Forward)Estimate)
2019-20)Forward)Estimate)
2020-21 Forward
Estimate1
$m) $m) $m) $m) $m)State Growth (continued)
Freight Access Bridge Upgrades .... 4.8 5.4 4.4 4.5
Mowbray Connector .... 1.5 5.5 .... ....
Real-Time Traffic Congestion Management in
Hobart .... 1.8 .... .... ....
Roads and Bridges - 2016 Floods 4.0 .... .... .... ....
State funding for Australian Government Election
Commitments for Roads .... 2.1 5.5 .... ....
4.0 16.3 15.0 4.4 4.5 Treasury and Finance
Office of the Superannuation Commission .... 0.6 0.6 0.6 0.6
.... 0.6 0.6 0.6 0.6
Total Policy Decisions 21.1 74.6 69.7 58.5 57.4
Parameter AdjustmentsEducation (7.9) 11.4 .... .... ....
Finance-General 6.2 6.7 6.1 1.9 ....
Health and Human Services (35.6) (41.3) 65.1 31.9 ....
Inland Fisheries Service (0.2) (0.1) (0.2) (0.2) ....
Justice (0.3) 0.4 .... .... ....
Marine and Safety Tasmania 0.8 0.6 0.6 .... ....
Police, Fire and Emergency Management 2.3 .... .... .... ....
Premier and Cabinet 0.5 0.5 0.5 .... ....
Primary Industries, Parks, Water and Environment 1.8 1.6 0.9 0.8 ....
Royal Tasmanian Botanical Gardens 0.2 0.3 .... .... ....
State Fire Commission (1.7) (3.8) (2.2) 0.3 ....
State Growth (41.5) 74.5 19.0 (25.9) ....
TasTAFE 2.6 0.3 3.9 4.3 ....
Tasmanian Health Service 15.7 5.2 0.3 (1.1) ....
Treasury and Finance 0.3 0.9 .... .... ....
Provision for Future Infrastructure Investment .... (25.0) 15.0 30.0 ....
Total Parameter Adjustments (56.6) 32.1 109.1 42.0 ....
2017-18 Budget and Forward Estimates 73
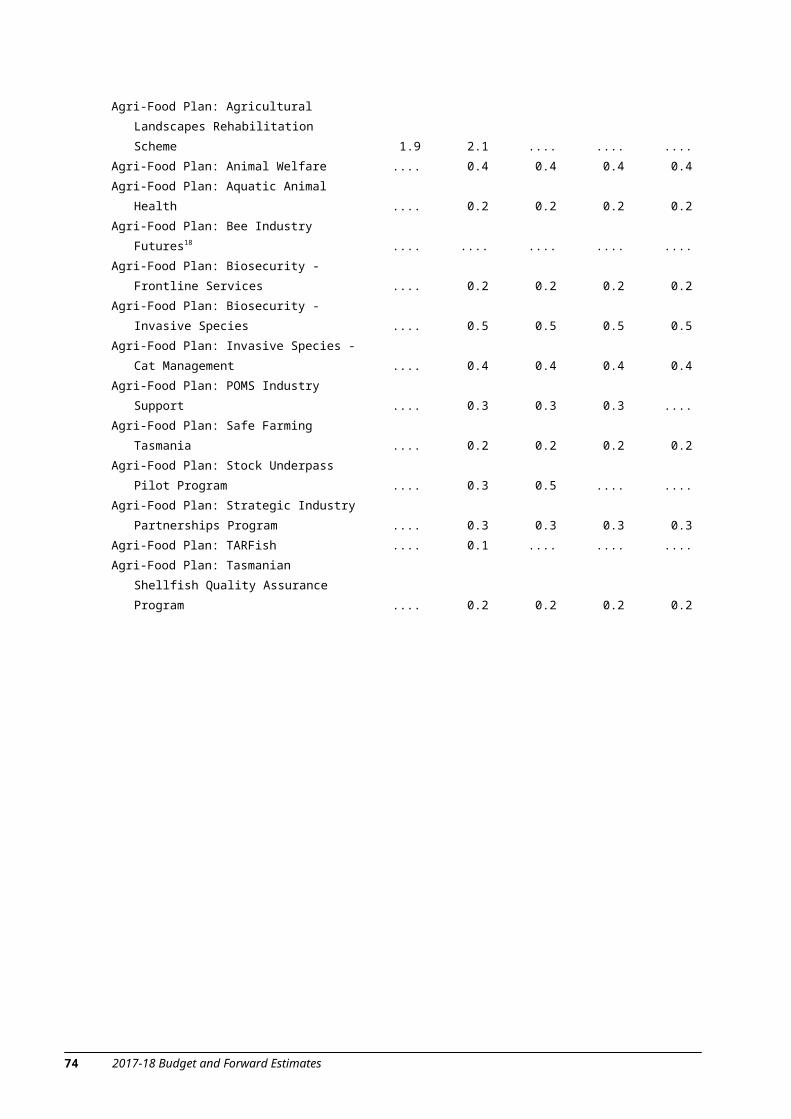
Table 4.5: Policy and Parameter Statement, 2016-17 to 2020-21 (continued)
2016-17)Estimated)Outcome)
2017-18))
Budget)
2018-19)Forward)Estimate)
2019-20)Forward)Estimate)
2020-21 Forward
Estimate1
$m) $m) $m) $m) $m)Total Purchases of Non-Financial Assets from
Transactions (E)(35.5) 106.7 178.8 100.6 ....
Gain/ (Loss) on Sale of Non-Financial AssetsPolicy Decisions
Primary Industries, Parks, Water and Environment
Sale of Orange-bellied Parrot Facility24 .... 2.5 .... .... ....
Total Policy Decisions .... 2.5 .... .... ....
Parameter Adjustments 1.0 2.2 1.6 2.0 ….
Less Total Sale of Non-Financial Assets from Transactions (F)
1.0 4.7 1.6 2.0 ….
Depreciation - Total Parameter Adjustments (G) 2.5 (1.4) 1.3 51.1 ….
TOTAL NET ACQUISITION OF NON-FINANCIAL ASSETS FROM TRANSACTIONS VARIANCE (H) (E - F - G)
(39.0) 103.4 175.8 47.4 ….
FISCAL BALANCE (B + C - D - H) 613.1 (253.9) (229.2) 2.8 71.1
Notes:1. Parameter adjustments for 2020-21 are not reflected in the Table as the 2020-21 Forward Estimate was not
published in the 2016-17 Budget. However, policy adjustments are reflected to show the full impact on the Budget and Forward Estimates.
2. The reduction in Betting Exchange Taxes and Levies in 2016-17 and over the Forward Estimates reflects the surrender by Betfair of its Tasmanian Gaming License.
3. The decrease in Duties in 2018-19 primarily reflects that Conveyance Duty on large commercial property transactions is forecast to reduce towards trend levels, which have been higher than usual in 2016-17 and are forecast to remain at elevated levels in 2017-18.
4. The increase in Land Tax primarily reflects a net increase in land values across the State, system enhancements leading to improvements in debt management and targeted compliance efforts.
5. The decrease in Payroll Tax over the Forward Estimates reflects lower forecasts for growth in average weekly earnings (AWE).
6. For further information on expense related policy decisions, refer to the relevant agency chapter in Government Services Budget Paper No 2.
7. The State contribution for the City Deal Launceston initiative includes funding for the City Heart, Tamar Estuary Management Taskforce and a Jobs Co-ordinator.
8. For further information on the policy, refer to the Department of Treasury and Finance chapter in Government Services Budget Paper No 2.
9. For further information on the policy, refer to the Department of State Growth chapter in Government Services Budget Paper No 2.
74 2017-18 Budget and Forward Estimates

10. For further information on the policy, refer to the Department of Health and Human Services chapter in Government Services Budget Paper No 2.
11. For further information on the policy, refer to the Department of Justice chapter in Government Services Budget Paper No 2.
12. For further information on the policy, refer to the Department of Police, Fire and Emergency Management chapter in Government Services Budget Paper No 2.
13. While the movement recorded in the Policy and Parameter Statement for the Streets Ahead and Homeshare - Additional Investment is a negative amount in each year, this reflects the financial treatment of the redirection of the expenditure from the former Tasmanian Affordable Housing Limited Funding (TAHL) and represents an additional allocation to the Homeshare program.
14. An amount of $25 000 is included in 2016-17 for the 20th Anniversary of the Port Arthur Massacre Event.15. An amount of $30 000 is included in 2018-19 for the Premier's Scholarship Fund.16. An amount of $25 000 is included in 2016-17 for the Risdon Vale Bike Collective.17. An amount of $15 000 is included in 2016-17 for the Welcome Home to Olympians and Paralympians from the Rio
Olympics and Paralympic Games event.18. An amount of $30 000 is included in 2017-18 for the Agri-Food Plan: Bee Industry Futures.19. An amount of $30 000 per annum is included over the Budget and Forward Estimates for the Ben Lomond Ski
Patrol.20. An amount of $35 000 per annum is included over the Budget and Forward Estimates for the Continuation of
Launceston 10 ($10 000 per annum) and Stan Siejka Cycling Classic ($25 000 per annum). 21. This reflects new funding provided in the 2017-18 Budget. Existing funding transferred from Finance-General is
reflected as a parameter variation. For further information see chapter 10 of Government Services Budget Paper No 2.
22. The movement in Other primarily reflects adjustments to eliminations and indexation as well as cost estimates associated with the State's superannuation expense and liability.
23. For further information on Purchases of Non-Financial Assets from Transactions policy decisions refer to chapter 6 of this Budget Paper.
24. The expenditure for the Orange-bellied Parrot Facility will be offset by proceeds from the sale of the existing property.
25.
2017-18 Budget and Forward Estimates 75

MAJOR REVENUE VARIATIONS
Policy Decisions
Special Dividend The TT-Line Vessel Replacement Fund Act 2017 provides for the establishment of an account within the Public Account to accrue funds to assist in meeting costs for the replacement of Spirit of Tasmania I and II. The 2016-17 Budget provided for two $40 million special dividends from TT-Line Company Pty Ltd as initial contributions to the TT-Line Vessel Replacement Fund. A further two $40 million Special Dividends from TT-Line Company Pty Ltd in 2018-19 and 2019-20 and two $10 million contributions from the Consolidated Fund in 2019-20 and 2020-21 are included in this Budget as further contributions to the Fund. At the end of the Forward Estimates period (30 June 2021) the Fund will total $180 million plus accumulated interest.
Parameter Adjustments
DutiesDuties reflects changes in estimates for Conveyance Duty, Motor Vehicle Duty and Insurance Duty. The increase in 2016-17 reflects a higher level of large commercial property transactions. In addition, there has been a general increase to the base forecasts for Conveyance Duty, which is the main driver for the movement in the Budget and Forward Estimates.
Dividend, Tax and Rate Equivalent IncomeThe major movements in Dividends relate to increases from the Motor Accidents Insurance Board, due to favourable claims experience, and Hydro Tasmania in 2018-19 and 2019-20, due to an expected increase in profitability. The 2016-17 Budget estimates reflected the uncertainty at the time as to how long it would take for Hydro Tasmania to rebuild its water storages. These increases are offset by lower dividends from Tasmanian Networks Pty Ltd due to a decrease in profitability as regulated revenues are expected to be lower.
The major increases in Income Tax Equivalents relate to the Motor Accidents Insurance Board and Hydro Tasmania due to increased profitability, as noted above, and therefore also taxable income.
Further information relating to Dividend, Tax and Rate Equivalent Income is provided in chapter 5 of this Budget Paper.
Tasmanian Public Finance Corporation DividendThe one-off National Partnership Payment received from the Australian Government for the transfer of ownership of the Mersey Community Hospital to the State (expected to occur by 30 June 2017), will be transferred to the Tasmanian Public Finance Corporation (Tascorp) as a one-off equity contribution and will be invested by Tascorp with any returns to be retained in the Mersey Community Hospital Fund.
Further information relating to the dividend is provided in chapter 5 of this Budget Paper.
76 2017-18 Budget and Forward Estimates

GST Revenue The movement in GST reflects changes to estimates and assumptions regarding the size of the GST pool, Tasmania's population and its GST relativity.
Estimates of the size of the GST pool for distribution have been reduced, reflecting lower than expected GST receipts, but this is partially offset by a small increase in Tasmania’s share of the national population.
The per capita relativity used for 2017-18 is the relativity recommended by the Commonwealth Grants Commission and determined by the Australian Treasurer. The per capita relativities from 2018-19 onwards are based on modelling by the Department of Treasury and Finance. For more information on GST receipts, refer to chapter 5 of this Budget Paper.
National Partnership Payments Movements in National Partnership payments occur frequently and may reflect either changes to underlying program agreements or the reallocation of funding to different years as advised by the Australian Government.
Information on major movements is provided below.
The increase in Environment in 2016-17 primarily reflects a change in timing of the receipt of funding from the Australian Government for the second tranche of irrigation projects being undertaken by Tasmanian Irrigation Pty Ltd under the Sustainable Rural Water Use and Infrastructure Program.
The increase in Healthcare in 2016-17 primarily reflects the reallocation of cash flows for programs, including the Commonwealth Dental Health Program and Reducing Elective Surgery Waiting Lists in Tasmania.
The decrease in Infrastructure in 2016-17 and significant increase in 2017-18 reflects the reallocation of Roads funding from 2016-17 to 2017-18 together with the Australian Government’s contribution to new road projects announced during the 2016 Federal Election.
The increase in Natural Disaster Relief and Recovery Arrangements funding in 2016-17 and 2017-18 reflects estimated receipts (at the time of finalisation of Budget data) from the Australian Government for costs associated with the 2016 bushfire and flood events.
Specific Purpose Payments National Health Reform funding increases observed each year from the 2016-17 Estimated Outcome to 2019-20 primarily reflect an increase in Australian Government Activity Based Funding due to a revision of Tasmanian Health Services activity profiles. Increases also reflect the impact of other adjustments made by the Administrator of the National Health Funding Pool, such as movements in the National Efficient Price (NEP).
The movement in Students First funding reflects increased Australian Government funding for both the Government and Non-government education sectors. Students First allocations are provisional and subject to change and to the finalisation of enrolments and loadings in each school year.
2017-18 Budget and Forward Estimates 77
Agency Revenue
State Growth
The increase in revenue for the Department of State Growth primarily reflects a rise in mineral royalties due to higher mineral prices and includes the continuation of the Road Safety Levy from 2017-18.
Tasmanian Health Service
The increase in revenue for the Tasmanian Health Service in 2016-17 and across the Forward Estimates is primary driven by increased revenues in relation to the listing of Hepatitis C medications on the Pharmaceutical Benefits Scheme. In addition, the increase in 2016-17 includes a one-off amount of $10 million reflecting the expected transfer of ownership of the Mersey Community Hospital Facility from the Australian Government to the State prior to 30 June 2017. This reflects the appropriate accounting treatment of the transfer under which the asset value is recognised as Contributed Revenue within Other Revenue in the General Government Income Statement. An equivalent value is then reflected in Purchases of Non-Financial Assets within Net Acquisition of Non-Financial Assets. This results in the transfer of the value of the asset to the General Government Balance Sheet.
78 2017-18 Budget and Forward Estimates

MAJOR EXPENSE VARIATIONS
Policy Decisions
For detailed information on policy decisions, refer to agency chapters in Government Services Budget Paper No 2.
Parameter Adjustments
Agency Expenditure
Education
The increase in expenditure for 2016-17 and over the Forward Estimates includes the impact of increased Students First Specific Purpose Payment funding and increased funding associated with the 2014 election commitment to extend high schools to Year 11 and 12.
Finance-General
The increase in 2016-17 includes changes in expenditure for the Tasmanian Risk Management Fund related to the June 2016 flood event and Peacock Centre fire claim and duty related ex gratia payments where there are corporate reconstruction transactions that do not result in a change of ownership. The decrease in expenditure for 2017-18 and over the Forward Estimates reflects a transfer of the Forestry CSO expenditure to the Department of State Growth and a reduction in service administration costs, following the transfer of administration of defined benefit schemes to the Office of the Superannuation Commission within the Department of Treasury and Finance.
Health and Human Services
The increase in expenditure for the Department of Health and Human Services in 2016-17 reflects revised expenditure for a range of Commonwealth Own Purpose Expenditure Agreements and National Partnership payments. The decrease over the Forward Estimates reflects revised estimates for Housing activities and the transfer of the Child Health and Parenting Service to the Tasmanian Health Service.
Justice
The increase in expenditure for the Department of Justice in 2016-17 is associated with Working with Vulnerable Persons registration; the rollout of the new Building Act and Continuing Professional Development for contractors; and additional costs relating to Corrective Services.
Primary Industries, Parks, Water and Environment
The increase in expenditure for the Department of Primary Industries, Parks, Water and Environment reflects the change in classification of Water and Sewerage Licence Fee expenditure of $600 000 per annum from 2016-17; revised Australian Government funding for the Tasmanian Wilderness World Heritage Area Extension funding of $1.7 million in 2017-18 and 2018-19; and revised expenditure associated with the Three Capes Track due to higher than anticipated visitor numbers.
2017-18 Budget and Forward Estimates 79

State Growth
The increase in expenditure in 2016-17 and over the Forward Estimates reflects an updated funding profile for the Northern Cities Major Development Initiative; a reclassification of $16.9 million in Australian Government funding for roads infrastructure from Non-Financial Asset Purchases to Supplies and Consumables Expense; the transfer of Forestry CSO expenditure from Finance-General and includes expenditure associated with the continuation of the Road Safety Levy from 2017-18.
Tasmanian Health Service
The major expense variations for the Tasmanian Health Service in 2016-17 and over the Forward estimates period reflect additional expenditure in relation to the listing of Hepatitis C medication on the Pharmaceutical Benefits Scheme and the expenditure of revised Activity Based Funding (ABF) and Block Funding.
80 2017-18 Budget and Forward Estimates

MAJOR PURCHASES OF NON-FINANCIAL ASSETS VARIATIONS
Policy Decisions
For detailed information on 2017-18 Budget Infrastructure Policy Decisions, refer to chapter 6 of this Budget Paper.
Parameter Adjustments
Education
The movement for the Department of Education primarily reflects the reallocation of funding from 2016-17 to 2017-18 for Capital Investment Program projects to meet changed cashflow requirements including the Parklands High School, East Launceston Primary School, Austins Ferry Primary School, and Windermere Primary School.
Health and Human Services
The movement in Health and Human Services primarily reflects reallocation of cash flow estimates for the Royal Hobart Hospital Redevelopment together with expenditure of funds carried forward from 2015-16 to support initiatives under the Affordable Housing Action Plan.
State Growth
Movements primarily reflect the reallocation of funding from Non-financial Asset Purchases to Grant Expense associated with the Northern Cities Major Development Initiative and the reallocation of cash flow estimates for Australian Government Funded projects.
Tasmanian Health Service
The increase in Purchases of Non-Financial Assets in 2016-17 primarily reflects the transfer of ownership of the Mersey Community Hospital Facility from the Australian Government to the State, and expenditure carried forward from 2015-16.
2017-18 Budget and Forward Estimates 81