towards land cover map updating with ground-level
TRANSCRIPT

HAL Id: hal-01194374https://hal.archives-ouvertes.fr/hal-01194374
Submitted on 13 Nov 2019
HAL is a multi-disciplinary open accessarchive for the deposit and dissemination of sci-entific research documents, whether they are pub-lished or not. The documents may come fromteaching and research institutions in France orabroad, or from public or private research centers.
L’archive ouverte pluridisciplinaire HAL, estdestinée au dépôt et à la diffusion de documentsscientifiques de niveau recherche, publiés ou non,émanant des établissements d’enseignement et derecherche français ou étrangers, des laboratoirespublics ou privés.
Towards land cover map updating with ground-levelpanoramic photos
Nehla Ghouaiel, Nailya Bogrova, Sébastien Lefèvre
To cite this version:Nehla Ghouaiel, Nailya Bogrova, Sébastien Lefèvre. Towards land cover map updating with ground-level panoramic photos. International Symposium on Mobile Mapping Technology, Dec 2015, Sydney,Australia. �hal-01194374�

TOWARDS LAND COVER MAP UPDATING WITH GROUND-LEVEL PANORAMICPHOTOS
Nehla Ghouaiel Nailja Bogrova Sebastien Lefevre
Univ. Bretagne-Sud, UMR 6074 IRISACampus de Tohannic, 56000 Vannes, France
{nehla.ghouaiel,sebastien.lefevre}@univ-ubs.fr
KEY WORDS: Image Analysis, Remote Sensing, Change Detection, Crowdsourcing, Mapping, Mobile Computing
ABSTRACT:
Geographic landscapes in all over the world may be subject to rapid changes induced, for instance, by urban, forest and agriculturalevolutions. Monitoring such kind of changes is usually achieved through remote sensing. However, obtaining regular and up-to-dateaerial or satellite images is found to be a high costly process, thus preventing regular updating of land cover maps. Alternatively,in this paper, we propose a low-cost solution based on the use of ground-level geo-located landscape panoramic photos providinghigh spatial resolution information of the scene. Such photos can be acquired from various sources: digital cameras, smartphone,or even web repositories. Furthermore, since the acquisition is performed at the ground level, the users immediate surroundings, assensed by a devices camera, can provide information at a very high level of precision, enabling to update the land cover type of thegeographic area. In the described herein method, we propose to use inverse perspective mapping (inverse warping) to transform thegeo-tagged ground-level 360◦photo onto a top-down view as if it had been acquired from a nadiral aerial view. Once re-projected,the warped photo is compared to a previously acquired remotely sensed image using standard techniques such as correlation. Widedifferences in orientation, resolution and geographical extent between the top-down view and the aerial image are addressed throughspecific processing steps (e.g., registration). Experiments on publicly available datasets made of both ground-level photos and aerialimages show promising results for updating land cover maps with mobile technologies. The proposed approach contributes to thecrowdsourcing efforts in geo-information processing and mapping, providing hints on the evolution of a landscape.
1. INTRODUCTION
The concept of Volunteered Geographic Information (VGI) refersto involving human volunteers in gathering photo collections thatcan be further used to feed geographical information systems. Infact, every human is able to act as an intelligent sensor, equippedwith such simple aids as GPS and camera or even the meansof taking measurements of environmental variables. As state byGoodchild (2007), “the notion that citizens might be useful andeffective sources of scientifically rigorous observations has a longhistory, and it is only recently that the scientific community hascome to dismiss amateur observation as a legitimate source” .
Over the past few years, VGI has become more available, for in-stance through web services. A range of new applications are be-ing enabled by the georeferenced information contained in “repos-itories” such as blogs, wikis, social networking portals (e.g., Face-book or MySpace), and, more relevant to the presented work,community contributed photo collections (e.g. Flickr 1 or Pano-ramio 2). The advantages of VGI are its temporal coverage, whichis often better both in terms of frequency and latency than tradi-tional sources. However, they come with a loss in data qualitysince user inputs are usually made available without review andwithout metadata (e.g. data source and characteristics). Geo-referenced photo collections are enabling a new form of observa-tional inquiry, which is termed “proximate sensing” by Leung andNewsam (2010). This concept depicts the act of using ground-level images of close-by objects and scenes rather than imagesacquired from airborne or satellite sensors.
While large collections of georeferenced photo collections haverecently been available through the emergence of photo sharing
1https://www.flickr.com/2http://www.panoramio.com/
websites, researchers have already investigated how these collec-tions can help a number of applications. Research works in thiscontext can be classified into two main categories according toLeung and Newsam (2010): i) using location to infer informa-tion about image and, ii) using images to infer information abouta geographical location. In the first category, methods for clus-tering and annotating photos have been proposed Quack et al.(2008); Moxley et al. (2008). Images are labeled based on theirvisual content as depicting events or objects (landmarks). Otherapproaches (e.g., Hays and Efros (2008)) attempted to estimatethe unconstrained location of an image based solely on its visualcharacteristics and on a reference dataset. In the second cate-gory, some researchers tried to address the problem of describ-ing features of the surface of the earth. Examples of works inthis area include: using large collections of georeferenced im-ages to discover interesting properties about popular cities andlandmarks such as the most photographed locations Crandall etal. (2009); creating maps of developed and undeveloped regionsLeung and Newsam (2010), where the problem faced is then re-lated to spatial coverage non-uniformity of images collections;computing country-scale maps of scenicness based on the visualcharacteristics and geographic locations of ground-level imagesXie and Newsam (2011). Although Xie and Newsam (2011)demonstrated the feasibility of geographic discovery from geo-referenced social media, they also reported the noisiness of ob-tained results.
The work presented in this paper is closely related to Leung andNewsam (2010); Xie and Newsam (2011) since we are here ex-ploring content of georeferenced photos to infer geographic in-formation about the locations at which they were taken. Con-versely to existing work, we are not excluding available aerialor satellite images but we propose to use them in conjunctionwith recently available ground level images. The purpose of thiswork is therefore to update and checkup existing maps (built from

standard remote sensing techniques) based on change detectionperformed with available ground level images. We thus investi-gate the application of proximate sensing to the problem of landcover classification. Rather than using only airborne/satellite im-agery to determine the distribution of land cover classes for agiven geographical area, we explore here whether ground levelimages can be used as a complementary data source. To do so,we present some preliminary work aiming to compare recentlyacquired ground level images to a previously acquired remotelysensed image using standard techniques related to computer vi-sion and image analysis.
The remainder of this paper is organized as follows; Sec. 2. de-scribed the study area and the data set considered in the experi-ments. The technical approach is presented in Sec. 3.. We detailcarried out experiments and discuss obtained results in Sec. 4.before providing some conclusions and directions for future re-search.
2. STUDY AREA AND DATA SET
The study area focuses on Vannes city in France, more preciselyon the surroundings of the Tohannic Campus which hosts Univer-site Bretagne Sud and IRISA research institute where are affili-ated the authors. This choice is motivated by: i) the availabilityof ground truth that can be assessed by the in situ, and ii) theappearance of many new buildings over the last few years (withavailability of data acquired both before and after these changes).It covers a 1 km2 area. The geographical extent is provided inFig. 1.
Figure 1: Aerial map from Bing Maps c© with blue rectangleshighlighting zones that have been recently transformed.
Ground level images were grabbed from Google Street View 3
or taken in-situ from people involved in this work equipped withmobile camera. Both kinds of images consist in panoramic viewscovering 360◦(resp. 180◦) field of view horizontally (resp. ver-tically). We assume here the following scenario: given the ac-quired image is georeferenced, it is possible to download an as-sociated map from existing sources (Bing Maps, Google Maps,OpenStreetMap). We consider here maps of 150×150 m2 down-loaded through a Bing Maps 4 request according to measuredGPS position.
For the sake of clarity, we denote the images with the followingterms in the sequel:
• A: Aerial image, or high flying UAV image (dimensionsm× n).
• P : Panoramic image, or wide field-of-view image from usermobile device or Google Street View (dimensions p× q).
3https://www.google.com/maps/streetview/4https://www.bing.com/maps/
• T : Top-down image, or bird’s eye view of the ground (di-mensions r × r).
Let us note that the proposed method is assessed here only ona single area, for which ground truth, aerial images, and in situobservations are available so to ease experimental validation. Ex-periments at a wider scale will be considered in future work.
3. PROPOSED METHOD
Since the images were taken from 3 different kinds of sensors(Google Street View’s car, user camera and aerial vehicle) sev-eral image pre-processing steps are required before change de-tection can be performed. The flowchart of the proposed methodincluding these different pre-processing steps is given in Fig. 2.
PanoramicImage
Top-down ViewConstruction
Localisation& Registration
Difference (d)& Correlation (c)
Change detection(Computation of z)
AerialMap
Figure 2: Flowchart of the proposed method.
3.1 Top-down View Construction
The panorama images used in this work cover (360◦, 180◦) fieldof view on (horizontal,vertical) dimensions. For a given scene,the panorama image P is warped to obtain a bird’s eye view T(as shown in Fig. 3). To do so, the 3D model of spherical imageis first reconstructed using ground line following the method pro-posed by Xiao et al. (2012). Next, for each pixel in the top-downview, the position of the corresponding pixel in the panorama iscomputed using the inverse warping. The color for the groundlocation is then obtained using bi-linear interpolation from thepanorama pixels.
Figure 3: Example of a top-down view T (right) constructed froma panorama image P (left).
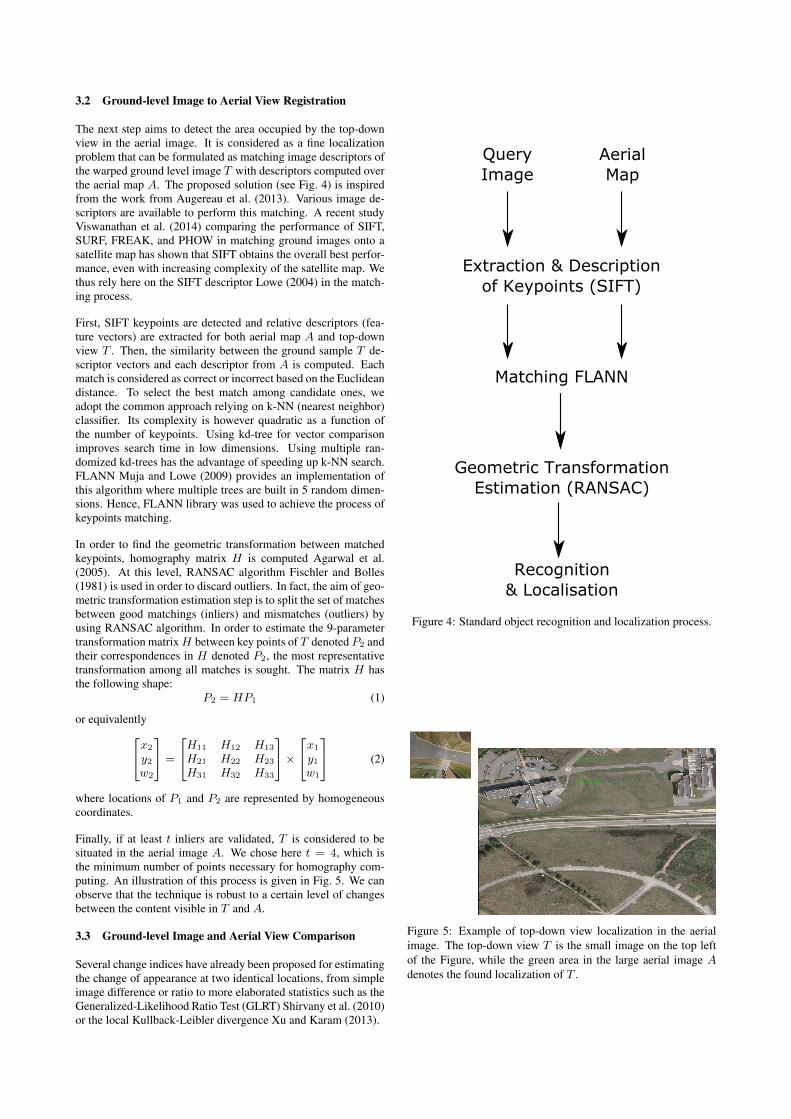
3.2 Ground-level Image to Aerial View Registration
The next step aims to detect the area occupied by the top-downview in the aerial image. It is considered as a fine localizationproblem that can be formulated as matching image descriptors ofthe warped ground level image T with descriptors computed overthe aerial map A. The proposed solution (see Fig. 4) is inspiredfrom the work from Augereau et al. (2013). Various image de-scriptors are available to perform this matching. A recent studyViswanathan et al. (2014) comparing the performance of SIFT,SURF, FREAK, and PHOW in matching ground images onto asatellite map has shown that SIFT obtains the overall best perfor-mance, even with increasing complexity of the satellite map. Wethus rely here on the SIFT descriptor Lowe (2004) in the match-ing process.
First, SIFT keypoints are detected and relative descriptors (fea-ture vectors) are extracted for both aerial map A and top-downview T . Then, the similarity between the ground sample T de-scriptor vectors and each descriptor from A is computed. Eachmatch is considered as correct or incorrect based on the Euclideandistance. To select the best match among candidate ones, weadopt the common approach relying on k-NN (nearest neighbor)classifier. Its complexity is however quadratic as a function ofthe number of keypoints. Using kd-tree for vector comparisonimproves search time in low dimensions. Using multiple ran-domized kd-trees has the advantage of speeding up k-NN search.FLANN Muja and Lowe (2009) provides an implementation ofthis algorithm where multiple trees are built in 5 random dimen-sions. Hence, FLANN library was used to achieve the process ofkeypoints matching.
In order to find the geometric transformation between matchedkeypoints, homography matrix H is computed Agarwal et al.(2005). At this level, RANSAC algorithm Fischler and Bolles(1981) is used in order to discard outliers. In fact, the aim of geo-metric transformation estimation step is to split the set of matchesbetween good matchings (inliers) and mismatches (outliers) byusing RANSAC algorithm. In order to estimate the 9-parametertransformation matrix H between key points of T denoted P2 andtheir correspondences in H denoted P2, the most representativetransformation among all matches is sought. The matrix H hasthe following shape:
P2 = HP1 (1)
or equivalentlyx2
y2w2
=
H11 H12 H13
H21 H22 H23
H31 H32 H33
×x1
y1w1
(2)
where locations of P1 and P2 are represented by homogeneouscoordinates.
Finally, if at least t inliers are validated, T is considered to besituated in the aerial image A. We chose here t = 4, which isthe minimum number of points necessary for homography com-puting. An illustration of this process is given in Fig. 5. We canobserve that the technique is robust to a certain level of changesbetween the content visible in T and A.
3.3 Ground-level Image and Aerial View Comparison
Several change indices have already been proposed for estimatingthe change of appearance at two identical locations, from simpleimage difference or ratio to more elaborated statistics such as theGeneralized-Likelihood Ratio Test (GLRT) Shirvany et al. (2010)or the local Kullback-Leibler divergence Xu and Karam (2013).
QueryImage
AerialMap
Extraction & Descriptionof Keypoints (SIFT)
Matching FLANN
Geometric TransformationEstimation (RANSAC)
Recognition & Localisation
Figure 4: Standard object recognition and localization process.
Figure 5: Example of top-down view localization in the aerialimage. The top-down view T is the small image on the top leftof the Figure, while the green area in the large aerial image Adenotes the found localization of T .

For the sake of illustration, we have chosen here to rely on thewell-known correlation index between the top-down view and theportion of the aerial map corresponding to it (see Sec. 3.2). Thecorrelation coefficient r between two images a and b of size N iscomputed as follows:
r =
NN∑i=1
IaiIbi −N∑i=1
IaiN∑i=1
Ibi√(N
N∑i=1
I2ai − (N∑i=1
Iai)2)·(N
N∑i=1
I2bi − (N∑i=1
Ibi)2)(3)
where i is the pixel index, Iai and Ibi are the intensities of thetwo images for pixel position i. In the correlation image, a lowcorrelation value means a change. However, Liu and Yamazaki(2011) pointed that even if there was no change, some areas mightbe characterized by a very low correlation value. In this respect,they propose a new factor z used to represent changes, whichcombines the correlation coefficient r with the image differenced. The latter is defined by:
d = Iai − Ibi (4)
where Iai and Ibi are the corresponding averaged values over aM = k× k pixels window surrounding the i-th pixel. We followhere a standard setting, where the window size is set as 9 × 9pixels.
The factor z is then expressed by:
z =|d|
maxi(|d|)− c · r (5)
where maxi(|d|) is the maximum absolute value of difference damong all pixel coordinates i, and c is the weight between thedifference and the correlation coefficient. Following Liu and Ya-mazaki (2011), we weight the difference as 4 times the correlationin order to omit subtle changes, which means that c is set to 0.25.
A high value of z means high possibility of change. We adopthere the threshold value used by Liu and Yamazaki (2011) andconsider the areas with z > 0.2 as changed areas.
4. EXPERIMENTS AND RESULTS
We recall that our method was evaluated with preliminary experi-ments on Vannes, France (see Sec. 2.). Aerial maps have been ex-tracted from Bing Maps. Ground-based imagery have been eitherdownloaded from Google Street View or captured in situ by somevolunteers involved in these experiments. Aerial data date from2011 while ground-level data were taken either in 2013 (GoogleStreet View) or in 2015 (Google Street View or in situ observa-tions). 22 significant locations were selected in the study siteand therefore related ground-level P and aerial A images wereincluded in the experiments. Figure 6 shows the 22 panoramicimages used in our study.
To evaluate our approach, we distinguish between three differ-ent zones categories: unchanged unstructured (i.e. without build-ing but possibly including roads), unchanged urban and new con-structed areas. Each ground-level image is manually assigned toone of these categories based on its visual content and the infor-mation brought by the older aerial data. Obtained z values forthese 22 images yield a variation between 0.10 and 0.34, witha change threshold set equals to 0.20 as in Liu and Yamazaki(2011).
Experimental results were analyzed through standard statisticalmeasures and the confusion matrix is provided in Tab. 1. We canobserve that the proposed method detect changed areas with a re-call and precision scores of 72% and 45%, respectively. The F1-measure for this class is 55% (75% for unchanged unstructuredareas and 46% for unchanged urban areas). Let us underline thatrecall is here more important than precision, since it is alwayspossible to proceed with further manual inspection of potentialchanges. This emphasizes the feasibility of change detection bycomparing ground level to aerial views. Most omission errorshappen chiefly when only a few parts of buildings are appearingin the top-down view. To deal with this issue, another compari-son step based on image features could be added. False positivesare either still unbuilt areas or still built areas. Errors actually be-longing to this first category are caused by the presence of cars orpanels in the ground based image. Since buildings are seen fromtheir roofs in the aerial view and from their sides or facades in theground-level images, a lot of unchanged built areas are classifiedas changed by the proposed method. In the future work, this kindof errors would be removed by considering methods for aerial toground building matching Bansal et al. (2011).
5. CONCLUSION
In the herein presented work, land changes are detected fromcomparing new acquired ground level images to less recent aerialimages. To do so, we propose to transform the geo-tagged pano-ramic photo onto a top-down view as if it had been acquired froma nadiral aerial view. Once re-projected, the warped photo iscompared to a previously acquired remotely sensed image usinga technique combining correlation coefficient and image differ-ence. The obtained results confirm the efficiency of the describedmethod in addressing the presented issue, with a specific use casebeing the detection of new built areas.
In the aim of enhancing current results, we will consider moreadvanced images comparison methods and will complete our pre-processing pipeline by other steps such as photometric correc-tion. Other future works include enlarging geographic extent ofthe study area and increasing the volume of test data and met-rics. The final goal would be to perform land cover updatingwith our method, to illustrate the strength of crowdsourcing as anancillary but important information source for geo-informationmanagement.
References
Agarwal, A., Jawahar, C. V. and Narayanan, P. J., 2005. A sur-vey of planar homography estimation techniques. TechnicalReport IIIT/TR/2005/12.2005, Centre for Visual InformationTechnology, International Institute of Information Technology.
Augereau, O., Journet, N. and Domenger, J.-P., 2013. Semi-structured document image matching and recognition. In:SPIE Conference on Document Recognition and Retrieval,Vol. 8658, pp. 1–12.
Bansal, M., Sawhney, H. S., Cheng, H. and Daniilidis, K., 2011.Geo-localization of street views with aerial image databases.In: ACM International Conference on Multimedia, pp. 1125–1128.
Crandall, D. J., Backstrom, L., Huttenlocher, D. and Kleinberg,J., 2009. Mapping the world’s photos. In: International Con-ference on World Wide Web, pp. 761–770.
Fischler, M. A. and Bolles, R. C., 1981. Random sample consen-sus: A paradigm for model fitting with applications to image

Figure 6: Panorama images used in experimental evaluation. Images from the 6 top rows were grabbed from Google Street View whilethe 2 bottom rows correspond to images acquired through crowdsourcing with mobile camera.

unchanged unstructured unchanged urban new constructed areas total labeledunchanged unstructured 6 0 2 8
unchanged urban 0 3 4 7new constructed areas 2 0 5 7
total classified 8 3 11 22
Table 1: Confusion matrix
analysis and automated cartography. Communications of theACM 24(6), pp. 381–395.
Goodchild, M. F., 2007. Citizens as sensors: web 2.0 and thevolunteering of geographic information. International Reviewof Geographical Information Science and Technology 7, pp. 8–10.
Hays, J. and Efros, A. A., 2008. Im2gps: estimating geographicinformation from a single image. In: IEEE Conference onComputer Vision and Pattern Recognition, pp. 1–8.
Leung, D. and Newsam, S., 2010. Proximate sensing: Infer-ring what-is-where from georeferenced photo collections. In:IEEE Conference on Computer Vision and Pattern Recogni-tion, pp. 2955–2962.
Liu, W. and Yamazaki, F., 2011. Urban monitoring and changedetection of central Tokyo using high-resolution X-band SARimages. In: IEEE International Geoscience and Remote Sens-ing Symposium, pp. 2133–2136.
Lowe, D. G., 2004. Distinctive image features from scale-invariant keypoints. International Journal of Computer Vision60, pp. 91–110.
Moxley, E., Kleban, J. and Manjunath, B. S., 2008. Spirit-tagger: a geo-aware tag suggestion tool mined from flickr.In: ACM International Conference on Multimedia InformationRetrieval, pp. 23–30.
Muja, M. and Lowe, D. G., 2009. Fast approximate nearestneighbors with automatic algorithm configuration. In: Inter-national Conference on Computer Vision Theory and Applica-tions, pp. 331–340.
Quack, T., Leibe, B. and Van Gool, L., 2008. World-scale miningof objects and events from community photo collections. In:International Conference on Content-based Image and VideoRetrieval, pp. 47–56.
Shirvany, R., Chabert, M., Chatelain, F. and Tourneret, J.-Y.,2010. Maximum likelihood estimation of the polarization de-gree from two multi-look intensity images. In: IEEE Interna-tional Conference on Acoustics, Speech, and Signal Process-ing, pp. 1198–1201.
Viswanathan, A., Pires, B. R. and Huber, D., 2014. Visionbased robot localization by ground to satellite matching in gps-denied situations. In: IEEE/RSJ International Conference onIntelligent Robots and Systems, pp. 192–198.
Xiao, J., Ehinger, K., Oliva, A. and Torralba, A., 2012. Recog-nizing scene viewpoint using panoramic place representation.In: IEEE Conference on Computer Vision and Pattern Recog-nition, pp. 2695–2702.
Xie, L. and Newsam, S., 2011. Im2map: Deriving mapsfrom georeferenced community contributed photo collections.In: ACM SIGMM International Workshop on Social Media,pp. 29–34.
Xu, Q. and Karam, L. J., 2013. Change detection on SAR im-ages by a parametric estimation of the KL-divergence betweengaussian mixture models. In: IEEE International Conferenceon Acoustics, Speech and Signal Processing, pp. 1109–1113.