towards ground-truthing of spaceborne estimates of above
TRANSCRIPT

Biogeosciences, 7, 2531–2543, 2010www.biogeosciences.net/7/2531/2010/doi:10.5194/bg-7-2531-2010© Author(s) 2010. CC Attribution 3.0 License.
Biogeosciences
Towards ground-truthing of spaceborne estimates of above-groundlife biomass and leaf area index in tropical rain forests
P. Kohler1 and A. Huth2
1Alfred Wegener Institute for Polar and Marine Research, P.O. Box 120161, 27515 Bremerhaven, Germany2UFZ – Helmholtz Centre for Environmental Research, Department of Ecological Modelling, Permoserstr. 15,04318 Leipzig, Germany
Received: 26 April 2010 – Published in Biogeosciences Discuss.: 5 May 2010Revised: 4 August 2010 – Accepted: 13 August 2010 – Published: 25 August 2010
Abstract. The canopy heighth of forests is a key vari-able which can be obtained using air- or spaceborne remotesensing techniques such as radar interferometry or LIDAR.If new allometric relationships between canopy height andthe biomass stored in the vegetation can be established thiswould offer the possibility for a global monitoring of theabove-ground carbon content on land. In the absence ofadequate field data we use simulation results of a tropicalrain forest growth model to propose what degree of infor-mation might be generated from canopy height and thus toenable ground-truthing of potential future satellite observa-tions. We here analyse the correlation between canopy heightin a tropical rain forest with other structural characteristics,such as above-ground life biomass (AGB) (and thus carboncontent of vegetation) and leaf area index (LAI) and identifyhow correlation and uncertainty vary for two different spatialscales. The process-based forest growth model FORMIND2.0was applied to simulate (a) undisturbed forest growth and(b) a wide range of possible disturbance regimes typicallyfor local tree logging conditions for a tropical rain forest siteon Borneo (Sabah, Malaysia) in South-East Asia. In bothundisturbed and disturbed forests AGB can be expressed asa power-law function of canopy heighth (AGB = a ·hb) withan r2
∼ 60% if data are analysed in a spatial resolution of20 m× 20 m (0.04 ha, also called plot size). The correlationcoefficient of the regression is becoming significant betterin the disturbed forest sites (r2
= 91%) if data are analysedhectare wide. There seems to exist no functional dependencybetween LAI and canopy height, but there is also a linear cor-relation (r2
∼ 60%) between AGB and the area fraction of
Correspondence to:P. Kohler([email protected])
gaps in which the canopy is highly disturbed. A reasonableagreement of our results with observations is obtained froma comparison of the simulations with permanent samplingplot (PSP) data from the same region and with the large-scaleforest inventory in Lambir. We conclude that the spaceborneremote sensing techniques such as LIDAR and radar interfer-ometry have the potential to quantify the carbon contained inthe vegetation, although this calculation contains due to theheterogeneity of the forest landscape structural uncertaintieswhich restrict future applications to spatial averages of aboutone hectare in size. The uncertainties in AGB for a givencanopy height are here 20−40% (95% confidence level) cor-responding to a standard deviation of less than± 10%. Thisuncertainty on the 1 ha-scale is much smaller than in the anal-ysis of 0.04 ha-scale data. At this small scale (0.04 ha) AGBcan only be calculated out of canopy height with an uncer-tainty which is at least of the magnitude of the signal itselfdue to the natural spatial heterogeneity of these forests.
1 Introduction
Tropical forests contain about 50% of the carbon storedin the vegetation worldwide (Sabine et al., 2004). Car-bon emissions from tropical deforestation are with about1.5 Pg C yr−1 (years 2000–2007) responsible for 16% ofthe total anthropogenic carbon emissions (Global-Carbon-Project, 2008). The carbon flux from deforestation in South-East Asia was estimated in 2007 with 0.6 Pg C yr−1 to beas large as that from Latin America (Canadell et al., 2007;Global-Carbon-Project, 2008). These carbon fluxes have es-timated uncertainties of around 50% and they are within theglobal carbon cycle those which are by far the most uncertain
Published by Copernicus Publications on behalf of the European Geosciences Union.

2532 P. Kohler and A. Huth: Ground-truthing of spaceborne AGB estimates in tropical rain forests
ones (Le Quere et al., 2009). For balancing the global car-bon budget in higher accuracy than today, also of interestfor Reducing Emissions from Deforestation and Degrada-tion (REDD) within the United Nations Framework Conven-tion on Climate Change (UNFCCC), it is therefore necessaryto reduce the uncertainties contained in the land-atmospherecarbon fluxes.
Our knowledge of the amount of carbon stored in tropi-cal forests is incomplete, but steadily increasing. From treeallometry it is now known that above-ground life biomassAGB (and thus carbon contained in the vegetation) mightbe calculated best out of trunk diameter or basal area oftrees (Chave et al., 2005; Slik et al., 2010). Other variables,such as wood density, are of minor importance (Chave et al.,2005). However, allometric relations between the integrat-ing variables canopy height and standing above-ground lifebiomass for tropical rain forests are so far missing. Biomassestimates and changes in carbon allocation were calculatedfrom ground measurements for various different areas (e.g.Chave et al., 2003, 2008; Aragao et al., 2009; Lewis et al.,2009; Slik et al., 2010). These estimates are restricted to se-lected research plots and a spatially complete coverage is stilllacking.
To overcome the uncertainty in our knowledge of carbonstored in vegetation and to monitor future changes space-borne remote sensing techniques such as LIDAR or radar in-terferometry seems to be one of the possible solutions. Var-ious studies used remote sensing for forest characterisation(e.g.Garrigues et al., 2008; Anderson et al., 2009; Bergenet al., 2009; Potter et al., 2009; Frolking et al., 2009; Haw-baker et al., 2009; Dubayah et al., 2010) and first approachesto extend the plot data on AGB to larger regions exist forthe Amazon (e.g.Malhi et al., 2006; Saatchi et al., 2007).For a temperate forest a combination of optical remote sens-ing to provide the vegetation type together with LIDAR pro-vides even better estimates of AGB than LIDAR alone (Ni-Meister et al., 2010). The lack of data especially for tropi-cal forests in Africa and South-East Asia might be improvedby future satellite mission for spaceborne remote sensing ofthe environment which are now underway (e.g. TANDEM-L or DESDynI (http://desdyni.jpl.nasa.gov) (Frolking et al.,2009; Moreira et al., 2009; Hurtt et al., 2010)). These mis-sions plan to make frequent remeasuring of standing vegeta-tion feasible. Interpretation of the spaceborne data on landcarbon stocks is needed, not only from the scientific point ofview, but also within practical carbon management optionsmentioned in UNFCCC and REDD.Houghton et al.(2009)laid out the required specifications for these and other fu-ture satellite missions to significantly reduce the nowadaysexisting uncertainties. They claimed, that in order to reducethe uncertainty in the land-atmosphere fluxes to those of thenext uncertain term (which is the net carbon uptake of theocean with an uncertainty of± 18%) a measurement error ofless than 2 Mg C (or an AGB uncertainty of about 4 tons or-ganic dry matter, abbreviatedt in the following) per ha over
25 ha is required. It is furthermore argued, that deforestationis patchy on spatial scales of 100 m and less and only if re-mote sensing is operating on a similar scale, one can clearlyidentify changes in carbon storage over time and minimisesampling errors due to averaging.
One crucial aspect of remote sensing estimates of vegeta-tion parameters, however, is the validation against referencemeasurements, so-called ground-truthing. Remote sensingby LIDAR or radar interferometry nowadays accurately de-scribes, for example, the height of the canopy in various dif-ferent forest types in temperate and tropical regions (e.g.Lef-sky et al., 2002, 2005; Balzter et al., 2007; Hajnsek et al.,2009). To be able to calculate other parameters of the forest(e.g. carbon content) out of the canopy height some well jus-tified assumptions need to be made. In other words some newor modified allometric relationships between canopy heightand other structural parameters need to be established. Itwould therefore be of interest to compare forest inventorydata of plots of similar size as the footprint of the satellitewith results from remote sensing techniques. This attemptis especially difficult in tropical forest with only about tenglobally distributed large research plots of 50 ha in size (Con-dit, 1995), although the amount and distribution of field siteswas significantly increased during the last years, e.g. in theAmazon (Malhi et al., 2006) or on Borneo (Slik et al., 2009,2010).
The attempt of this study is to use in the light of restrictedfield inventories in the tropics the results of a process-basedtropical forest growth model to analyse allometric relation-ships between canopy heighth, a major forest variable mea-surable from spaceborne remote sensing techniques such asLIDAR and radar interferometry, and of AGB and leaf areaindex (LAI), both variables of interest in the research of thecarbon cycle and of vegetation dynamics. Accuracy and un-certainties in the calculation of the canopy height during re-mote sensing are not discussed in detail here, but seeHa-jnsek et al.(2009). We show from simulations covering therange of disturbances typically found in tropical rain forestsin Borneo, how accurate AGB (and thus the carbon con-tent of the vegetation) and LAI can be determined, once thecanopy height is known. One specific objective is to in-vestigate how the accuracy of the correlation of these vari-ables alters if data are analysed on different spatial scales.The analysis is therefore performed on (i) a forest plot levelof 20 m×20 m (0.04 ha), representative of the crown size ofemergent trees in the study area and of the achievable spa-tial resolution of spaceborne remote sensing configurations(Frolking et al., 2009), and (ii) for larger areas of one hectare(1 ha). The ha-wide averages furthermore enable us to calcu-late relationships between the degree of canopy disturbanceand AGB. Simulation results are finally compared with fielddata from disturbed and undisturbed forests in Borneo. Ouranalysis should be understood as a case study for a typicaltropical rain forest site in South-East Asia and should high-light which degree of information on AGB and LAI might be
Biogeosciences, 7, 2531–2543, 2010 www.biogeosciences.net/7/2531/2010/
P. Kohler and A. Huth: Ground-truthing of spaceborne AGB estimates in tropical rain forests 2533
achieved from remote sensing techniques using LIDAR andradar interferometry. While results would certainly differ indetail for other tropical forest sites, the general intrinsic un-certainty of biomass calculations based on canopy height andthe role of the spatial scale of the remote sensing approachhighlighted here are of general importance.
2 Methods
2.1 Description of the model
We used the individual-oriented process-based forest growthmodel FORMIND (Kohler and Huth, 1998) in its updatedversion FORMIND2.0 (Kohler, 2000) to simulate the for-est dynamics of an uneven-aged mixed tropical rain for-est. The model has been proven suitable to simulate awide range of forest sites on Borneo (Sabah) (Kohler et al.,2001), Venezuela (Kammesheidt et al., 2001), French Guiana(Kohler et al., 2003), Mexico (Ruger et al., 2008), Brazil(Groeneveld et al., 2009) and Ecuador (Dislich et al., 2009).The site-specific model adaptation and parametrisation to adipterocarp tropical rain forest in Borneo (Sabah) as usedhere were published elsewhere (Huth et al., 2004, 2005;Kohler and Huth, 2004). Here, the model is used in exactlythe same configuration as in these three applications. Themodel was also used in an extended version for the analysisof tree species richness in Sabah depending on disturbanceand recruitment limitation (Kohler and Huth, 2007).
The model describes forest dynamics as a mosaic of inter-acting forest patches. These patches have the same spatialdimensions as the typical crown size of emergent trees inour observation area (20 m×20 m). This also implies that thespatial resolution possible with FORMIND2.0 is similar tothat of remote sensing estimates (Frolking et al., 2009; Ha-jnsek et al., 2009). Finer spatial-scale features are not cov-ered by the model. Within these patches trees are not spa-tially explicitly distributed, and thus all compete for light andspace following the gap model approach (Botkin, 1993). Al-lometric relationships connect the above-ground life biomassof a tree with its stem diameter, the tree height, the bole vol-ume and the crown dimensions. Using these relationships,the distribution of individual tree crowns and their leaf areain the canopy is calculated in horizontal canopy layers with adiscretisation of 0.5 m. The model operates with the concep-tual time step of one year.
The growth of an individual tree is based on a carbon bal-ance. Calculations include the photosynthesis of the treesand assimilate losses due to respiration, litter-fall and fineroot decay. Within a patch, vertical light attenuation in thecanopy is calculated from light intensity above the canopywith respect to the absorption of tree crowns. The depen-dence of specific photosynthetic productivity on irradianceis modelled using a Michaelis-Menten-type light responsecurve. Photosynthetic production is calculated from the
tree’s leaf area. We assume an increasing limitation effectof water transport deficiencies with increasing tree height.Thus, actual productivity is calculated by applying a size-dependent limitation factor. Assimilation losses are esti-mated in relation to tree biomass. We distinguish betweenbiomass-dependent maintenance respiration and growth res-piration. Tree growth is calculated in annual time steps.Competition is modelled in terms of competition for light andspace, the latter resulting in self-thinning. Mortality is mod-elled as a stochastic event. Trees die with a certain group-specific probability. Of all dying trees 40% collapse andknock down smaller trees in neighbouring patches and cre-ate gaps of a size depending upon their crown size. Recruit-ment takes into account the production and explicit dispersalof individual seeds produced by local mother trees. We as-sume constant seed input rates which is correlated with thereproductive success at minimum diameter of 1 cm. Thus,the seed production rate lumps together several regenera-tion stages: fecundity, seed survival, germination and pos-sible predation upon young seedlings. Incoming seeds up-date a seed pool, taking into account the dormancy variabilityacross functional groups.
We took an undisturbed, primary forest stand (P1) forour stand initialisation from a research inventory in the De-ramakot Forest Reserve (DFR) in Sabah (North Borneo,Malaysia, 117◦30′ E, 5◦25′ N, 130–300 m a.s.l.) (Schlensog,1997). Deramakot has a per-humid climate typical of theinner tropics. The mean annual temperature is 27◦C withlittle seasonal variation. The average annual precipitation isabout 3500 mm, with no pronounced dry season. The ge-ology of Deramakot is characterised by tertiary sediments,mostly sandstone. The soils are low in nutrients and prone toerosion once left devoid of tree cover. The prevailing foresttype is lowland dipterocarp forest.
The shrub and tree species found in DFR (total number:468 species) are assigned to 13 different plant functionaltypes (PFT) based on their successional status and maximumheight at maturity (Kohler et al., 2000). The successionalstatus (early, mid, or late) is determined by their growth ratesunder various light regimes, as well as through a survey ofwood densities, which are good indicators of growth ratesfor most species. In FORMIND2.0 thus the life-cycle of indi-vidual trees belonging to one of the 13 PFT is calculated.
2.2 Simulated scenarios
Besides the simulation of the evolution of the undisturbeddipterocarp forest (P1) for 400 yr as reference case, we sim-ulated a large number of typical logging scenarios for thisregion (in total 24 different scenarios, Table1). The scenar-ios differ in the logging method responsible for the amountof damage caused in the residual forest stand, logging cy-cle (time period between two logging events), and cuttinglimit dmin (only trees with a diameter above the cutting limitare logged). The size of the simulated forest area was kept
www.biogeosciences.net/7/2531/2010/ Biogeosciences, 7, 2531–2543, 2010

2534 P. Kohler and A. Huth: Ground-truthing of spaceborne AGB estimates in tropical rain forests
Table 1. Simulation scenarios. Undisturbed site P1 or different logging scenarios with disturbed forests.
Scenario Logging Logging Cutting Simulation Area Plots runs treemethod cycle limit periodT A n density
(yr) (cm) (yr) (ha) (400 m2) (1/ha)
P1 (undisturbed) – – – 400 100 2500 1 2795Logging (disturbed) RIL, CON 20, 40, 60, 80 40, 50, 60 240 100 2500 24 3202
constant at 100 ha and we assumed the boundary conditionsto be periodic. The length of simulation in the logging sce-narios was 240 yr.
Our modelling of logging methods was motivated by sev-eral studies, but see references and more details inHuth et al.(2004, 2005). We distinguish two methods: highly damag-ing conventional logging (CON), which generally uses heavymachinery and unskilled workers, but little planning, andreduced-impact logging (RIL), where substantial planningfor road construction, felling directions etc. is performed. InRIL, tree removal usually implies the use of winching ca-bles or airborne cable systems. The differences modelledbetween the two methods represent the logging impact onthe residual stand. The time between two logging opera-tions was constant, but differed between the scenarios (20,40, 60, 80 years). All commercial trees of the mid- and late-successional species above the cutting limit (dmin = 40, 50,60 cm) were removed in a logging operation.
The simulated forests were analysed over the whole sim-ulated areaA (in ha) over the whole simulation periodsT(in yr) with outputs produced every year including one initialoutput att = 0 yr. Thus, we can rely for every simulationon (T +1)×A data sets of ha-wide mean averages and on(T + 1)×A× 25 on detailed 0.04 ha plot-related informa-tion. These are 40 100 (ha) and 1 002 500 (0.04 ha) data setsfor the 400 yr runs of undisturbed simulation P1. The 24 log-ging scenarios contain 578 000 (ha) and 14 460 000 (0.04 ha)data sets. On average, the simulated undisturbed and dis-turbed forests contained 2795 and 3202 trees per hectare, re-spectively.
In the simulated forests we analysed at different spatialscales (0.04 or 1 ha) the relationship between (a) canopyheighth and AGB and (b) canopy heighth and LAI. Canopyheight is defined as the height of largest tree on the plot scale(0.04 ha), and as the mean height of the largest trees of the 25individual plots of each ha on the 1 ha-scale. Additionally, atthe 1 ha-scale the relationship between the gap fraction andAGB is analysed. Gap fraction is here defined as the fractionof the simulated forest area with a canopy heighth below25 m.
2.3 Permanent sampling plots data from Sabah andlarge-scale field inventory from Lambir
The data from PSPs, with which we compared our simula-tion results, were collected in five different forest reservesin Sabah, Malaysia between 1973 and 1993. The data aredescribed and analysed inKohler et al.(2001). PSPs arebetween 1 and 11 ha large, contain more than 12 000 trees,which were sampled between 9 and 20 years in intervals of 1to 5 years. All plots were regrowing forests in which duringtheir first inventory the last logging event was 8 to 45 yearsago. The PSP data therefore cover forest regrowth 8 to 54years after disturbance. The data consist of repeated mea-surements of diameter at breast height (dbh). AGB is calcu-lated out of dbh with the allometric relationship and speciesgrouping embedded in FORMIND2.0.
The large-scale (52 ha) field inventory at Lambir coversone initial sampling of biomass per 0.04 ha plot (Yamakuraet al., 1996). This forest is believed to be largely undisturbedby anthropogenic activities and might therefore be a repre-sentative for an undisturbed rain forest site on Borneo. How-ever, please note, that the parametrisation of our model wasnot optimised for Lambir (Sarawak, Borneo), and differencesin detail are therefore expected. The Lambir data set is nev-ertheless the largest forest inventory in South-East Asia com-parable to the undisturbed dipterocarp forest in DFR used forparametrisation and initialisation of our simulation. How-ever, besides the biomass distribution data used here otherraw data were not available to us.
3 Results
3.1 Undisturbed tropical rain forest
In the simulation of undisturbed tropical rain forest only nat-ural gap creation by falling large trees occurs, neither an-thropogenic tree extraction nor external disturbances, suchas storms, are considered. These simulations are potentialrepresentations of forest development (potential natural veg-etation dynamics) in the remote interior of Borneo.
If analysed on the forest plot level (0.04 ha) AGB can bepredicted from canopy heighth using a power-law functionAGB = a · hb (Zianis and Mencuccini, 2004; Chave et al.,
Biogeosciences, 7, 2531–2543, 2010 www.biogeosciences.net/7/2531/2010/

P. Kohler and A. Huth: Ground-truthing of spaceborne AGB estimates in tropical rain forests 2535
Fig. 1. Relation between above-ground life biomass (AGB) and canopy height (h) for the undisturbed forest (site P1).(A) Data on 0.04 ha-scale (grey to black) (red: 1 ha-scale for comparison) are plotted together with a power-law regression function. Due to the huge number ofdata points in the scatter plot of the 0.04 ha-scale (more than 1 000 000) the grey-scale indicates the density of the data points with highestdensities in black. Normalised density of(B) AGB and of(C) h for both spatial scales. Legend in C as in B.(D) Relative uncertainty (4σ /mean) of the 95% confidence interval, dotted horizontal line marks unity.
2005) with an r2= 61.4% (Fig. 1a). Linear or quadratic
function are with a correlation coefficient of 58.9% and60.8%, respectively, only slightly worse than the power-law equation. The frequency maxima in AGB andh are at485 t/ha and 41 m, respectively (Fig.1b, c). The spread inAGB data for a given canopy height is large. The relativeuncertainty on the 95% confidence interval (4σ /mean) islarger than 100% for trees smaller than 26 m and generallylarger than 200% forh smaller than 12 m (Fig.1d). The rela-tive uncertainty is with 80–85% stable for canopy heights be-tween 30 and 45 m and declines towards 20% for plots withcanopy heights of 50 m. The decline in relative uncertaintyfor canopies larger than 45 m might be caused by the low
sample size. Only very few tree species, or PFTs, can grow tosuch heights, thus reducing the variability. To summarise, thevariability of biomass growth underneath the largest growingtree within a plot is in tropical rain forests huge and a simpleback calculation without additional information from canopyheight to standing stock at this scale is ambiguous.
In the 1 ha-scale analysis regressions between AGB andh
are with r2= 58% of similar quality than for the plot-size
(0.04 ha-scale) (Fig.2). However, uncertainties in the pre-diction of AGB as functions ofh are much smaller. Canopyheight, now represented as ha-wide averages, varied only be-tween 35 and 42 m, the relative uncertainty was stable at18–20% throughout the range ofh (95% confidence level).
www.biogeosciences.net/7/2531/2010/ Biogeosciences, 7, 2531–2543, 2010

2536 P. Kohler and A. Huth: Ground-truthing of spaceborne AGB estimates in tropical rain forests
Fig. 2. Relation between above-ground life biomass (AGB) and canopy height (h) in 1 ha-scale analysis for the undisturbed forest (site P1),including power-law regression function. Relative uncertainty (4σ /mean) of the 95% confidence level plotted on right y-axis.
If compared with the plot level the frequency maxima areshifted towards higher AGB (545 t/ha) and smaller canopiesh (39 m) (Fig.1b, c).
As large-scale inventories of undisturbed forest sites arelacking in Sabah we restrict the comparison of simulationresults to the large-scale inventory of the Lambir forest re-serve in the Malaysian province Sarawak on Borneo. In thebiomass distribution of the 1 ha-scale from the 52 ha inven-tory in Lambir (Yamakura et al., 1996) the frequency maximaof 541 t/ha is very close to 545 t/ha of our undisturbed forestsimulations P1 (Fig.3). The distribution is wider for Lam-bir in both spatial scales, probably due to the sampling sizewhich was nearly three orders of magnitude smaller in thefield data (n = 40 100 or 52 ha for simulations and Lambir,respectively). This comparison is therefore restricted, but itshows that the biomass distribution of the simulated rain for-est is within the range seen in real forest inventories, andstrongly depends on the spatial scale.
3.2 Logged (disturbed) tropical rain forest
For the logged forests some interesting patterns emerged.The number of forest plots with large canopy heights isstrongly reduced. The fraction of plots containing emergenttrees with heights above 36 m is nearly halved (from 75% inundisturbed forests to 39% in logged forests). The maximumin the AGB distribution in the plot (0.04 ha) scale is shiftedfrom 500 t/ha in the undisturbed to 300 t/ha in the disturbedforests (Fig.4b). Similarly, canopy height is reduced froma maximum in the distribution at 42 m to 37 m (Fig.4c). In
the PSPs the distribution is shifted to even smaller canopies(maximum at∼30 m height) with less biomass (maximum∼100 t/ha). This indicates, that the PSP data do not coverthe same range as the simulated disturbed forests, but are bi-ased towards smaller, heavier disturbed sites. This bias isbased on the fact, that the PSP data are restricted to 8–54years after tree extraction. They are thus not representativefor disturbed forest dynamics with long cutting cycles (60–80 years), although these conditions are found in 50% of ourlogging scenarios.
On the 0.04 ha-scale regressions are with anr2 of about60% of similar quality for undisturbed and disturbed forestssimulations as well as for the PSP data, although the power-law equations differ in detail (Fig.4a, Table2). The relativeuncertainty on the 95% confidence level is slightly worse forthe disturbed forests and the PSP data than for the undis-turbed site P1, but both repeat the general pattern of theundisturbed forests (Fig.4d).
On the larger spatial scale of ha-averages the power-lawregression equation leads in the disturbed forest simulationsas well as in the PSP data to significantly better agreementwith the underlying data (r2
= 90 and 91%, respectively)than in the undisturbed simulations (58%) (Fig.5a). One canclearly identify in the scatter plot of AGB overh (Fig. 5a),that the undisturbed simulations are only a subsample at theupper end of the disturbed forest simulations. Furthermore,the PSP data represent the lower range of the disturbed for-est simulations. The scatter of disturbed forest data pointsfor AGB<200 t/ha and canopy heighth ∼ 32 m (Fig. 5a)is caused by the appearance of pioneer PFT after logging
Biogeosciences, 7, 2531–2543, 2010 www.biogeosciences.net/7/2531/2010/

P. Kohler and A. Huth: Ground-truthing of spaceborne AGB estimates in tropical rain forests 2537
0 200 400 600 800 1000 1200 1400 1600 1800
above-ground biomass (AGB) [t/ha]
0.0
0.1
0.2
0.3
0.4
dens
ity[-
]
B
1 ha-scale0.04 ha-scale
(AGB) = 100 t/haLambir 52 ha field data 1 yr
0.00.020.040.060.08
0.10.12
dens
ity[-
]A
1 ha-scale0.04 ha-scale
(AGB) = 10 t/haP1 (undisturbed) 100 ha 400 yr
Fig. 3. Comparison of the normalised frequency distribution of above-ground life biomass for(A) undisturbed forests (site P1) with(B)field data from the large-scale inventory of 52 ha in Lambir, Sarawak, Malaysia (Yamakura et al., 1996) for both 0.04 and 1 ha-scale. P1simulations were already plotted in Fig.1b. P1 simulations cover 100 ha with annual output over 400 yr (n = 40100), while the Lambir fielddata cover one inventory over 52 ha (n = 52). The larger data ensemble of the simulations therefore enable a finer discretisation of AGB thanthe Lambir field data (1(AGB) = 10 and 100 t/ha, respectively).
Table 2. Regression functions between above-ground life biomass (per plot or as ha-mean) and maximum height of trees or gap fraction(gap: maximum height of plot<25 m) of site for undisturbed site P1 or average over all 24 logging scenarios. All regressions are significant(P < 0.01).
Relation
y : AGBplot (t/ha) AGBha (t/ha) AGBha (t/ha)x : h (m) h (m) gap (%)
Scenario Function r2 Function r2 Function r2
P1 (undisturbed) y = 0.15·x2.23 61.4% y = 0.52·x1.89 58.1% y = 548-7.13·x 1.7%Logging (disturbed) y = 0.44·x1.89 58.0% y = 0.07·x2.42 90.6% y = 394-4.95·x 58.3%
operations. They dominate the plots for some years, beforein the secondary successions other PFTs take over. How-ever, because of their low wood densities these pioneersare rather unimportant for the calculation of mean above-ground life biomass. The relative uncertainty at the 95%confidence level is larger than 40% in the disturbed forestsfor canopies smaller than 25 m, and between 20 and 40% forlarger canopies and throughout the PSP data set (Fig.5b).
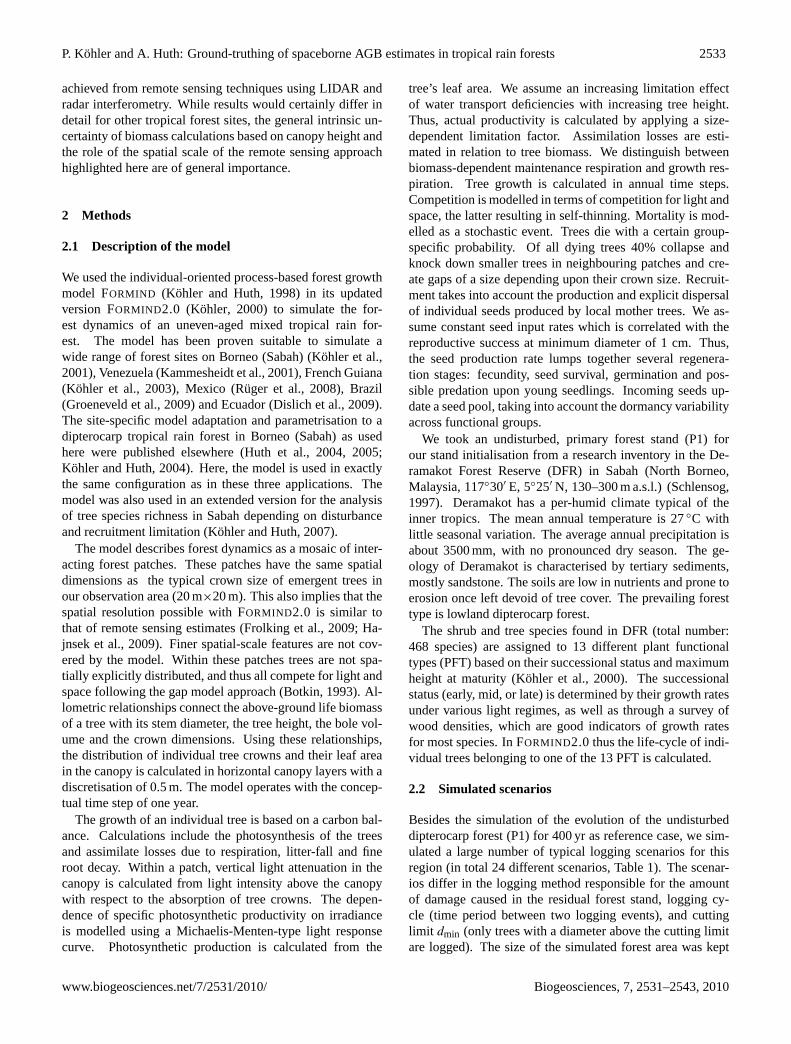
There is no significant correlation between LAI andcanopy height (r2 < 5%), neither in the undisturbed norin the disturbed forest simulations, neither on the smaller0.04 ha-scale (Fig.6a) nor on the large 1 ha-scale (Fig.6b).Again, PSP data are on the lower end of the range of thesimulated data.
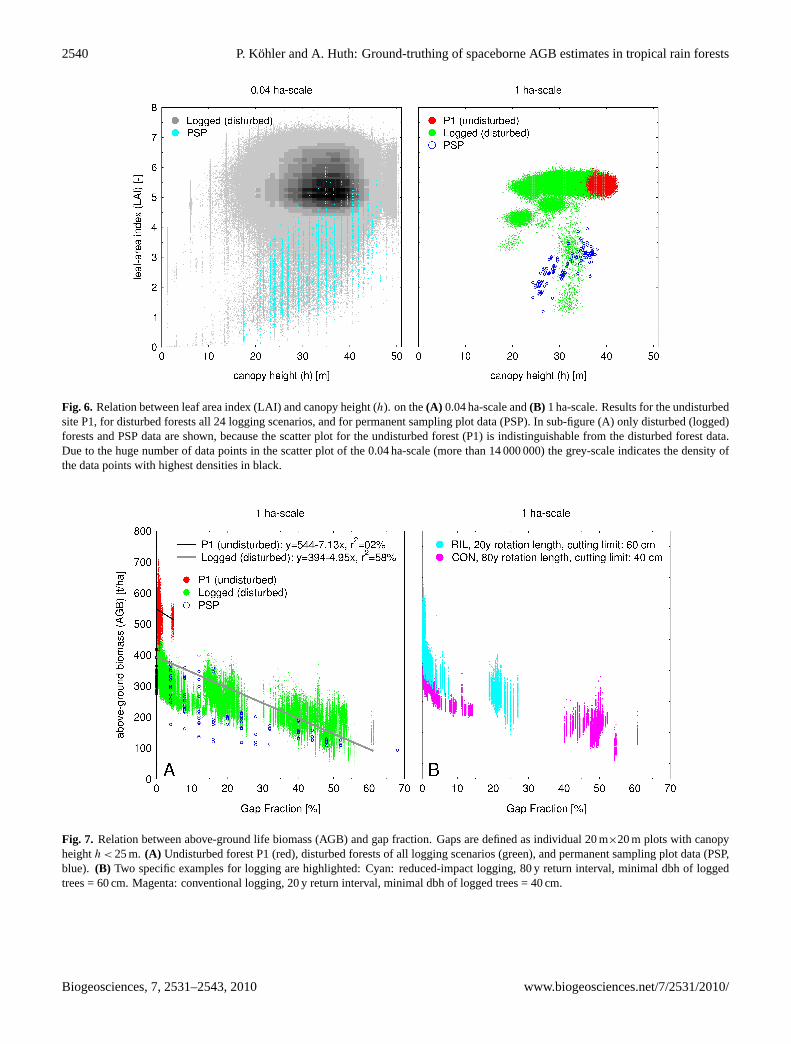
A linear relationship with anr2 of 58% can be obtainedfrom the 1 ha-scale analysis of AGB as function of gap frac-tion (Fig. 7a). Here, gaps are defined as 20 m× 20 m plotswith a canopy height below 25 m. In all logging simulationsthere are areas with low gap fraction (typically< 15%) andwith high gap fraction (around 25% for reduced-impact log-ging RIL, and above 40% for conventional logging CON),the range in-between is somehow not covered at all (Fig.7b).This might be understood as the following: The high gapfractions are a direct result of the logging operations. Di-rectly after logging the fast growing pioneer PFT grow firstin these highly disturbed gap areas, and below them othertrees species get established. Because logging disturbed thewhole simulation area at the same time the closure of the for-est canopy last as long as the growing of these pioneer trees
www.biogeosciences.net/7/2531/2010/ Biogeosciences, 7, 2531–2543, 2010

2538 P. Kohler and A. Huth: Ground-truthing of spaceborne AGB estimates in tropical rain forests
Fig. 4. Regression lines of above-ground life biomass (AGB) and canopy height (h) in 0.04 ha-scale composition for the undisturbed forest(site P1), for disturbed forests (all 24 logging scenarios), and for permanent sampling plot data (PSP). The scatter plot of undisturbed (seeFig. 1) and disturbed forests are indistinguishable due to overlap and the data from the undisturbed site P1 are therefore omitted. Due tothe huge number of data points in the scatter plot of the 0.04 ha-scale (more than 14 000 000) the grey-scale indicates the density of the datapoints with highest densities in black. Normalised density of(B) AGB and of(C) h and relative uncertainty(D) on the 95% confidence level(4σ /mean) are plotted for disturbed and undisturbed forest and PSP data, legend as on(A).
to 25 m height (threshold of the definition of a forest gap),and will thus happen more or less simultaneously in all plotswhich were disturbed by the logging operation. Each distur-bance regime produces its own typical pattern in a AGB-gapfraction diagram (Fig.7b). This is a first indication that suchpatterns might be detectable by remote sensing in the futureto distinguish different disturbance regimes in tropical forestsfrom air- and spaceborne observations.
4 Discussion and conclusions
To reduce the uncertainties in our knowledge of the carboncycle a global coverage of the terrestrial carbon storage is adesirable target, for which spaceborne remote sensing tech-niques have to be applied. Repeated annual measurementscould thus identify large sources and sinks of carbon dueto large-scale deforestation or reforestation programs whichmight be performed within the framework of REDD.
Within this effort a knowledge of the uncertainties andat best their minimisation is crucial to determine whetheror not new approaches might improve our knowledge of
Biogeosciences, 7, 2531–2543, 2010 www.biogeosciences.net/7/2531/2010/

P. Kohler and A. Huth: Ground-truthing of spaceborne AGB estimates in tropical rain forests 2539
Fig. 5. (A) Above-ground life biomass (AGB) and canopy height (h) in 1 ha-scale composition for the undisturbed site P1 (red), for disturbedforests in all 24 logging scenarios) (green), and for permanent sampling plot data (PSP, blue).(B) Relative uncertainty on the 95% confidencelevel (4σ /mean), legend as in (A).
the terrestrial carbon storage and its variability over time.It was already shown, how error propagates in inventory-based biomass estimates in tropical forests, in which AGB istypically derived from allometric relationship with the stemdiameter of individual trees and only seldomly measured di-rectly (Chave et al., 2004). Another huge uncertainty on theway to a complete carbon balance of tropical forests is theamount of carbon bound in dead wood, so-called necromass,above ground (Chao et al., 2009) and in forest soils belowground (Luyssaert et al., 2008). Both pools are largely un-sampled, but might introduce due to their relatively smallsize in the tropics (Bonan, 2008) and due to their linear re-lationship with AGB only a small bias to the overall carbonbudgets (Cairns et al., 1997).
If AGB is calculated not as a function of tree diame-ter known to be the best predictor of AGB (Chave et al.,2005; Slik et al., 2010), but from more aggregated vari-ables such as canopy height, we implicitly pay for such anAGB estimate on the cost of precision. Remote sensing ap-
proaches are one of the solutions for a large-scale systematicvegetation monitoring. There is a need to establish new al-lometric relationships for tropical forests. In the absence offield inventories covering all possible forest situations for-est growth models are useful tools to derive such new rela-tionships. This is especially the case for uneven-aged mixedforest stands in the tropics in which long logging cycles arenecessary for sustainable timber harvesting. The simulationresults can not completely compensate for inventories, butthey can significantly broaden the spectra of possible forestsituations on the plot level.
Another advantage of forest growth modelling is the con-sistency of the analysed set of simulation results. TheFORMIND2.0-model does not account for uncertainties inthe allometric relationships between dbh and AGB and re-duces species-specific differences to the 13 PFT, which wereselected for Borneo’s rain forest. Thus, the uncertainties wehere calculate are structural uncertainties between the aggre-gated variables canopy heighth and AGB and LAI. They
www.biogeosciences.net/7/2531/2010/ Biogeosciences, 7, 2531–2543, 2010
2540 P. Kohler and A. Huth: Ground-truthing of spaceborne AGB estimates in tropical rain forests
Fig. 6. Relation between leaf area index (LAI) and canopy height (h). on the(A) 0.04 ha-scale and(B) 1 ha-scale. Results for the undisturbedsite P1, for disturbed forests all 24 logging scenarios, and for permanent sampling plot data (PSP). In sub-figure (A) only disturbed (logged)forests and PSP data are shown, because the scatter plot for the undisturbed forest (P1) is indistinguishable from the disturbed forest data.Due to the huge number of data points in the scatter plot of the 0.04 ha-scale (more than 14 000 000) the grey-scale indicates the density ofthe data points with highest densities in black.
Fig. 7. Relation between above-ground life biomass (AGB) and gap fraction. Gaps are defined as individual 20 m×20 m plots with canopyheighth < 25 m. (A) Undisturbed forest P1 (red), disturbed forests of all logging scenarios (green), and permanent sampling plot data (PSP,blue). (B) Two specific examples for logging are highlighted: Cyan: reduced-impact logging, 80 y return interval, minimal dbh of loggedtrees = 60 cm. Magenta: conventional logging, 20 y return interval, minimal dbh of logged trees = 40 cm.
Biogeosciences, 7, 2531–2543, 2010 www.biogeosciences.net/7/2531/2010/

P. Kohler and A. Huth: Ground-truthing of spaceborne AGB estimates in tropical rain forests 2541
might in detail differ in field inventories, but they are in prin-ciple contained in the vegetation structure of tropical rainforests.
We therefore conclude that the structural uncertainties inAGB estimates based on given spaceborne canopy heightmeasurements are according to our simulations results (andin agreement with PSP data) on the order of 20–40% if ha-wide averages are investigated (95% confidence level). How-ever, for the calculation of the overall uncertainty of AGB theaccuracy of the canopy height derived from remote sensingtechniques must also be taken into consideration. Canopyheight estimates obtained from airborne polarimetric inter-ferometric synthetic aperture radar (Pol-InSAR) or airborneLIDAR over dipterocarp tropical rain forests have shown,that the mean canopy height of the hundred largest trees onone hectare can be measured with an accuracy of 10% (1σ )(Hajnsek et al., 2009). It therefore seems possible that thesuggested target of maximum uncertainty of±18% for AGBgiven byHoughton et al.(2009), equivalent to an uncertaintyof 36% (95% confidence level), can be reached. Our studyshows that this would apply to tropical rain forest sites ofnearly all disturbance regimes, if the aggregated informationon the 1 ha-scale are used for the analysis. On the plot level(0.04 ha-scale) the uncertainties in AGB as a function ofh
are as large as or larger than the signal itself. The uncertaintycan be reduced if it would be possible to derive informationon the vertical forest structure by remote sensing. Accord-ing to our analysis the LAI can not be predicted from canopyheight, but it should be emphasised that other approaches ex-ist to estimate LAI directly with remote sensing techniquesusing optical and near-infrared sensors (e.g.Turner et al.,1999).
Acknowledgements.Parts of this project received fundingsfrom ESA under the contract RFQ-3-11536/06/I-EC. We thankKostas Papathanassiou, Florian Kugler and Astor Torano Caicoyafor comments on earlier drafts.
Edited by: R. Duursma
References
Anderson, L. O., Malhi, Y., Ladle, R. J., Aragao, L. E. O. C.,Shimabukuro, Y., Phillips, O. L., Baker, T., Costa, A. C. L., Es-pejo, J. S., Higuchi, N., Laurance, W. F., Lopez-Gonzalez, G.,Monteagudo, A., Nunez-Vargas, P., Peacock, J., Quesada, C. A.,and Almeida, S.: Influence of landscape heterogeneity on spatialpatterns of wood productivity, wood specific density and aboveground biomass in Amazonia, Biogeosciences, 6, 1883–1902,doi:10.5194/bg-6-1883-2009, 2009.
Aragao, L. E. O. C., Malhi, Y., Metcalfe, D. B., Silva-Espejo, J. E.,Jimenez, E., Navarrete, D., Almeida, S., Costa, A. C. L., Salinas,N., Phillips, O. L., Anderson, L. O., Alvarez, E., Baker, T. R.,Goncalvez, P. H., Huaman-Ovalle, J., Mamani-Solorzano, M.,Meir, P., Monteagudo, A., Patino, S., Penuela, M. C., Prieto, A.,
Quesada, C. A., Rozas-Davila, A., Rudas, A., Silva Jr., J. A., andVasquez, R.: Above- and below-ground net primary productiv-ity across ten Amazonian forests on contrasting soils, Biogeo-sciences, 6, 2759–2778, doi:10.5194/bg-6-2759-2009, 2009.
Balzter, H., Rowland, C., and Saich, P.: Forest canopy height andcarbon estimation at Monks Wood National Nature Reserve, UK,using dual-wavelength SAR interferometry, Remote Sens. Envi-ron., 108, 224–239, doi:10.1016/j.rse.2006.11.014, 2007.
Bergen, K. M., Goetz, S. J., Dubayah, R. O., Henebry, G. M., Hun-saker, C. T., Imhoff, M. L., Nelson, R. F., Parker, G. G., andRadeloff, V. C.: Remote sensing of vegetation 3-D structure forbiodiversity and habitat: Review and implications for lidar andradar spaceborne missions, J. Geophys. Res., 114, G00E06, doi:doi:10.1029/2008JG000883, 2009.
Bonan, G. B.: Forest and climate change: forcgins, feedbacks,and the climate benefits of forests, Science, 320, 1444–1449,doi:10.1126/science.1155121, 2008.
Botkin, D. B.: Forest Dynamics: An Ecological Model, OxfordUniversity Press, Oxford, 1993.
Cairns, M., Brown, S., Helmer, E., and Baumgardner, G.: Rootbiomass allocation in the world’s upland forests, Oecologia, 111,1–11, 1997.
Canadell, J. G., Le Quere, C., Raupach, M. R., Field, C. B., Buiten-huis, E. T., Ciais, P., Conway, T. J., Gillett, N. P., Houghton,R. A., and Marland, G.: Contributions to accelerating atmo-spheric CO2 growth from economic acitivity, carbon intensity,and efficiency of natural sinks, P. Natl. A. Sci., 104, 18866–18870, doi:10.1073/pnas.0702737104, 2007.
Chao, K.-J., Phillips, O. L., Baker, T. R., Peacock, J., Lopez-Gonzalez, G., Vasquez Martnez, R., Monteagudo, A., andTorres-Lezama, A.: After trees die: quantities and determinantsof necromass across Amazonia, Biogeosciences, 6, 1615–1626,doi:10.5194/bg-6-1615-2009, 2009.
Chave, J., Condit, R., Lao, S., Caspersen, J., Foster, R., andHubbell, S.: Spatial and temporal variation in biomass of a trop-ical forest: results from a large census plot in Panama, J. Ecol.,91, 240–252, 2003.
Chave, J., Condit, R., Aguilar, S., Hernandez, A., Lao, S., andPerez, R.: Error propagation and scaling for tropical forestbiomass estimates, Philos. T. Roy. Soc. B., 359, 409–420, doi:10.1098/rstb.2003.1425, 2004.
Chave, J., Andalo, C., Brown, S., Cairns, M., Chambers, J., Eamus,D., Folster, H., Fromard, F., Higuchi, N., Kira, T., Lescure, J.-P., Nelson, B., Ogawa, H., Puig, H., Riera, B., and Yamakura,T.: Tree allometry and improved estimation of carbon stocks andbalance in tropical forests, Oecologia, 145, 87–99, doi:doi:10.1007/s00442-005-0100-x, 2005.
Chave, J., Condit, R., Muller-Landau, H. C., T., S. C., Ashton, P. S.,Bunyavejchewin, S., Co, L. L., Dattaraja, H. S., Davies, S. J.,Esufali, S., Ewango, C. E. N., Feeley, K. J., Foster, R. B., Gu-natilleke, N., Gunatilleke, S., Hall, P., Hart, T. B., Hernandez,C., Hubbell, S. P., Itoh, A., Kiratiprayoon, S., LaFrankie, J. V.,de Lao, S. L., Makana, J.-R., Nur Supardi Noor, M., Kassim,A. R., Samper, C., Sukumar, R., Suresh, H. S., Tan, S., Thomp-son, J., Tongco, M. D. C., Valencia, R., Vallejo, M., Villa, G.,Yamakura, T., Zimmerman, J. K., and Losos, E. C.: Assessingevidence for a pervasive alteration in tropical tree communities,PLoS Biology, 6, e45, doi:10.1371/journal.pbio.0060045, 2008.
Condit, R.: Research in large long-term tropical forest plots, Trends
www.biogeosciences.net/7/2531/2010/ Biogeosciences, 7, 2531–2543, 2010

2542 P. Kohler and A. Huth: Ground-truthing of spaceborne AGB estimates in tropical rain forests
in Ecology and Evolution, 10, 18–21, 1995.Dislich, C., Gunter, S., Homeier, J., Schroder, B., and Huth, A.:
Simulating forest dynamics of a tropical montane forest in SouthEcuador, Erdkunde, 63, 347–364, doi:10.3112/erdkunde.2009.04.05, 2009.
Dubayah, R. O., Sheldon, S. L., Clark, D. B., Hofton, M. A., Blair,J. B., Hurtt, G. C., and Chazdon, R. L.: Estimation of tropicalforest height and biomass dynamics using lidar remote sensingat La Selva, Costa Rica, J. Geophys. Res., 115, G00E09, doi:10.1029/2009JG000933, 2010.
Frolking, S., Palace, M. W., Clark, D. B., Chambers, J. Q., Shugart,H. H., and Hurtt, G. C.: Forest disturbance and recovery: A gen-eral review in the context of spaceborne remote sensing of im-pacts on aboveground biomass and canopy structure, J. Geophys.Res., 114, G00E02, doi:10.1029/2008JG000911, 2009.
Garrigues, S., Lacaze, R., Baret, F., Morisette, J. T., WQeiss, M.,Nickeson, J. E., Fernandes, R., Plummer, S., Shabanov, N. V.,Myneni, R. B., Knyazikhin, Y., and Yang, W.: Validation andintercomparison of global Leaf Area Index products derivedfrom remote sensing data, J. Geophys. Res., 113, G02028, doi:10.1029/2007JG000635, 2008.
Global-Carbon-Project: Carbon budget and trends 2007, (www.globalcarbonproject.org, last access: 26 September 2008), 2008.
Groeneveld, J., Alves, L., Bernacci, L., Catharino, E., Knogge, C.,Metzger, J., Putz, S., and Huth, A.: The impact of fragmentationand density regulation on forest succession in the Atlantic rainforest, Ecol. Model., 220, 2450–2459, doi:10.1016/j.ecolmodel.2009.06.015, 2009.
Hajnsek, I., Kugler, F., Lee, S.-K., and Papathanassiou, K. P.:Tropical-Forest-Parameter Estimation by Means of Pol-InSAR:The INDREX-II Campaign, Ieee transactions on geoscience andremote sensing, 47, 481–493, doi:10.1109/TGRS.2008.2009437,2009.
Hawbaker, T. J., Keuler, N. S., Lesak, A. A., Gobakken, T.,Contrucci, K., and Radeloff, V. C.: Improved estimatesof forest vegetation structure and biomass with a LiDAR-optimized sampling design, J. Geophys. Res., 114, G00E04,doi:10.1029/2008JG000870, 2009.
Houghton, R. A., Hall, F., and Goetz, S. J.: Importance of biomassin the global carbon cycle, J. Geophys. Res., 114, G00E03,doi:10.1029/2009JG000935, 2009.
Hurtt, G. C., Fisk, J., Thomas, R. Q., Dubayah, R., Moor-croft, P. R., and Shugart, H. H.: Linking models and dataon vegetation structure, J. Geophys. Res., 115, G00E10,doi:10.1029/2009JG000937, 2010.
Huth, A., Drechsler, M., and Kohler, P.: Multicriteria evaluationof simulated logging scenarios in a tropical rain forest, J. Envi-ron. Manage., 71, 321–333, doi:10.1016/ j.envman.2004.03.008,2004.
Huth, A., Drechsler, M., and Kohler, P.: Using multicriteria deci-sion analysis and a forest growth model to assess impacts of treeharvesting in Dipterocarp lowland rain forests, Forest Ecol. Man-age., 207, 251–232, doi:10.1016/j.foreco.2004.10.028, 2005.
Kammesheidt, L., Kohler, P., and Huth, A.: Sustainable timber har-vesting in Venezuela: a modelling approach, J. Appl. Ecol., 38,756–770, doi:10.1046/j.1365–2664.2001.00 629.x, 2001.
Kohler, P.: Modelling anthropogenic impacts on the growth oftropical rain forests – using an individual-oriented forest growthmodel for analyses of logging and fragmentation in three case
studies, online at:http://hdl.handle.net/10013/epic.15101, lastaccess: August 2010, PhD thesis, University of Kassel, Der An-dere Verlag, Osnabruck, Germany, 2000.
Kohler, P. and Huth, A.: The effect of tree species groupingin tropical rain forest modelling - Simulation with the indi-vidual based model FORMIND, Ecol. Model., 109, 301–321,doi:10.1016/S0304–3800(98)00 066–0, 1998.
Kohler, P. and Huth, A.: Simulating growth dynamics in a South-East Asian rain forest threatened by recruitment shortage and treeharvesting, Climatic Change, 67, 95–117, doi:10.1007/s10584–004–0713–9, 2004.
Kohler, P. and Huth, A.: Impacts of recruitment limitation andcanopy disturbances on tropical tree species richness, Ecol.Model., 203, 511–517, doi:10.1016/j.ecolmodel.2006.11.023,2007.
Kohler, P., Ditzer, T., and Huth, A.: Concepts for the ag-gregation of tropical tree species into functional types andthe application on Sabah’s lowland rain forests, species listused for the article athttp://www.usf.uni-kassel.de/usf/archiv/dokumente/specieslists/sabah/sabah.html, last access: August2010, J. Trop. Ecol., 16, 591–602, 2000.
Kohler, P., Ditzer, T., Ong, R. C., and Huth, A.: Compar-ison of measured and modelled growth on permanent plotsin Sabahs rain forests, Forest Ecol. Manage., 144, 101–111,doi:10.1016/S0378–1127(00)00364–9, 2001.
Kohler, P., Chave, J., Riera, B., and Huth, A.: Simulating long-termresponse of tropical wet forests to fragmentation, Ecosystems, 6,129–143, doi:10.1007/s10021–002–0121–9., 2003.
Le Quere, C., Raupach, M. R., Canadell, J. G., Marland, G., Bopp,L., Ciais, P., Conway, T. J., Doney, S. C., Feely, R. A., Foster,P., Friedlingstein, P., Gurney, K., Houghton, R. A., House, J. I.,Huntingford, C., Levy, P. E., Lomas, M. R., Majku, J., Metz,N., Ometto, J. P., Peters, G. P., Prentice, I. C., Randerson, J. T.,Running, S. W., Sarmiento, J. L., Schuster, U., Sitch, S., Taka-hashi, T., Viovy, N., van der Werf, G. R., and Woodward, F. I.:Trends in the sources and sinks of carbon dioxide, Nat. Geosci.,2, 831–836, doi:10.1038/ngeo689, 2009.
Lefsky, M. A., Cohen, W. B., Parker, G. G., and Harding, D. J.:Lidar Remote Sensing for Ecosystem Studies, BioScience, 52,19–30, 2002.
Lefsky, M. A., Harding, D. J., Keller, M., Cohen, W. B., Caraba-jal, C. C., Del Bom Espirito-Santo, F., Hunter, M. O., andde Oliveira, Raimundo, J.: Estimates of forest canopy heightand aboveground biomass using ICESat, Geophys. Res. Lett., 32,L22S02, doi:10.1029/2005GL023971, 2005.
Lewis, S. L., Lopez-Gonzalez, G., Sonke, B., Affum-Baffoe, K.,Baker, T. R., Ojo, L. O., Phillips, O. L., Reitsma, J. M.,White, L., Comiskey, J. A., Djuikouo-K., M.-N., Ewango, C.E. N., Feldpausch, T. R., Hamilton, A. C., Gloor, M., Hart, T.,Hladik, A., Lloyd, J., Lovett, J. C., Makana, J.-R., Malhi, Y.,Mbago, F. M., Ndangalasi, H. J., Peacock, J., Peh, K. S.-H.,Sheil, D., Sunderland, T., Swaine, M. D., Taplin, J., Taylor, D.,Thomas, S. C., Votere, R., and Woll, H.: Increasing carbon stor-age in intact African tropical forests, Nature, 457, 1003–1006,doi:10.1038/nature07771, 2009.
Luyssaert, S., Schulze, E.-D., Borner, A., Knohl, A., Hes-senmoller, D., Law, B. E., Ciais, P., and Grace, J.: Old-growth forests as global carbon sinks, Nature, 455, 213–215,doi:10.1038/nature07276, 2008.
Biogeosciences, 7, 2531–2543, 2010 www.biogeosciences.net/7/2531/2010/

P. Kohler and A. Huth: Ground-truthing of spaceborne AGB estimates in tropical rain forests 2543
Malhi, Y., Wood, D., Baker, T. R., Wright, J., Phillips, O. L.,Cochrane, T., Meir, P., Chave, J., Almeida, S., Arroyo, L.,Higuchi, N., Killeen, T. J., Lauranc, e. S. G., Laurance, W. F.,Lewis, S. L., Monteagudo, A., Neill, D. A., Vargas, P. N., Pitman,N. C. A., Quesada, C. A., Salomao, R., Silva, J. N. M., Lezama,A. T., Terborgh, J., Martinez, R. V., and Vinceti, B.: The regionalvariation of aboveground live biomass in old-growth Amazonianforests, Glob. Change Biol., 12, 1107–1138, doi:10.1111/j.1365-2486.2006.01120.x, 2006.
Moreira, A., Hajnsek, I., Krieger, G., Papathanassiou, K., Eineder,M., Zan, F. D., Younis, M., and Werner, M.: Tandem-L: Moni-toring the Earth’s dynamic with INSAR and PoL-INSAR, Proc.of 4th Int. Workshop on Science and Applications of SAR Po-larimetry and Polarimetric Interferometry – PolInSAR 2009, 26–30 January 2009, Frascati, Italy (ESA SP-668, April 2009), 2009.
Ni-Meister, W., Lee, S., Strahler, A. H., Woodcock, C. E., Schaaf,C., Yao, T., Ranson, K. J., Sun, G., and Blair, J. B.: As-sessing general relationships between aboveground biomass andvegetation structure parameters for improved carbon estimatefrom lidar remote sensing, J. Geophys. Res., 115, G00E11,doi:10.1029/2009JG000936, 2010.
Potter, C., Klooster, S., Huete, A., Genovese, V., Bustamante, M.,Guimaraes Ferreira, L., R. C. de Oliveira Jr., and Zepp, R.: Ter-restrial carbon sinks in the Brazilian Amazon and Cerrado regionpredicted from MODIS satellite data and ecosystem modeling,Biogeosciences, 6, 937–945, doi:10.5194/bg-6-937-2009, 2009.
Ruger, N., Williams-Linera, G., Kissling, W., and Huth, A.: Long-Term Impacts of Fuelwood Extraction on a Tropical MontaneCloud Forest, Ecosystems, 11, 868–881, 2008.
Saatchi, S. S., Houghton, R. A., Alvala, R. C. D. S., Soares,J. V., and Yu, Y.: Distribution of aboveground live biomassin the Amazon basin, Glob. Change Biol., 13, 816–837,doi:10.1111/j.1365-2486.2007.01323.x, 2007.
Sabine, C. L., Heimann, M., Artaxo, P., Bakker, D. C. E., Arthur,C.-T., Field, C. B., Gruber, N., Le Quere, C., Prinn, R. G.,Richey, J. E., Lankao, P. R., Sathaye, J. A., and Valentini, R.:Current status and past trends of the global carbon cycle, in: Theglobal carbon cycle: integrating humans, climate, and the natu-ral world, edited by Field, C. B. and Raupach, M. R., pp. 17–44,Island Press, Washington, Covelo, London, 2004.
Schlensog, M.: Experimentelle Untersuchungen des Lichtklimas inUrwaldparzellen Nordborneos, no. 117 in Gottinger Beitrage zurLand- und Forstwirtschaft in den Tropen und Subtropen, Goltze,Gottingen, 1997.
Slik, J. W. F., Raes, N., Aiba, S.-I., Brearley, F. Q., Cannon, C. H.,Meijaard, E., Nagamasu, H., Nilus, R., Paoli, G., Poulsen, A. D.,Sheil, D., Suzuki, E., van Valkenburg, J. L. C. H., Webb, C. O.,Wilkie, P., and Wulffraat, S.: Environmental correlates for trop-ical tree diversity and distribution patterns in Borneo, Diversityand Distributions, 15, 523–532, 2009.
Slik, J. W. F., Aiba, S.-I., Brearley, F. Q., Cannon, C. H., Forshed,O., Kitayama, K., Nagamasu, H., Nilus, R., Payne, J., Paoli, G.,Poulsen, A. D., Raes, N., Sheil, D., Sidiyasa, K., Suzuki, E., andvan Valkenburg, J. L. C. H.: Environmental correlates of treebiomass, basal area, wood specific gravity and stem density gra-dients in Borneo’s tropical forests, Global Ecology and Biogeog-raphy, 19, 50–60, doi:10.1111/j.1466-8238.2009.00489.x, 2010.
Turner, D. P., Cohen, W. B., Kennedy, R. E., Fassnacht, K. S.,and Briggs, J. M.: Relationships between Leaf Area Index andLandsat TM Spectral Vegetation Indices across Three Temper-ate Zone Sites, Remote Sens. Environ., 70, 52–68, doi:10.1016/S0034-4257(99)00057-7, 1999.
Yamakura, T., Kanzaki, M., Itoh, A., Ohkubo, T., Ogino, K., K.,E. C. O., Lee, H. S., and Ashton, P. S.: Forest structure of atropical rain forest at Lambir, Sarawak with special reference tothe dependency of its physionomic dimensions on topography,Tropics, 6, 1–8, 1996.
Zianis, D. and Mencuccini, M.: On simplifying allometric analysesof forest biomass, Forest Ecol. Manage., 187, 311–332, doi:10.1016/j.foreco.2003.07.007, 2004.
www.biogeosciences.net/7/2531/2010/ Biogeosciences, 7, 2531–2543, 2010