towards institution-and investigator- specific self...
TRANSCRIPT
1
Towards institution- and investigator-specific self-updating risk calculators for prostate cancer
Donna Pauler AnkerstMathematics, Technische Universitaet Muenchen,Urology and Epidemiology/Biostatistics, University of Texas Health Science Center at San Antonio, San Antonio, Texas
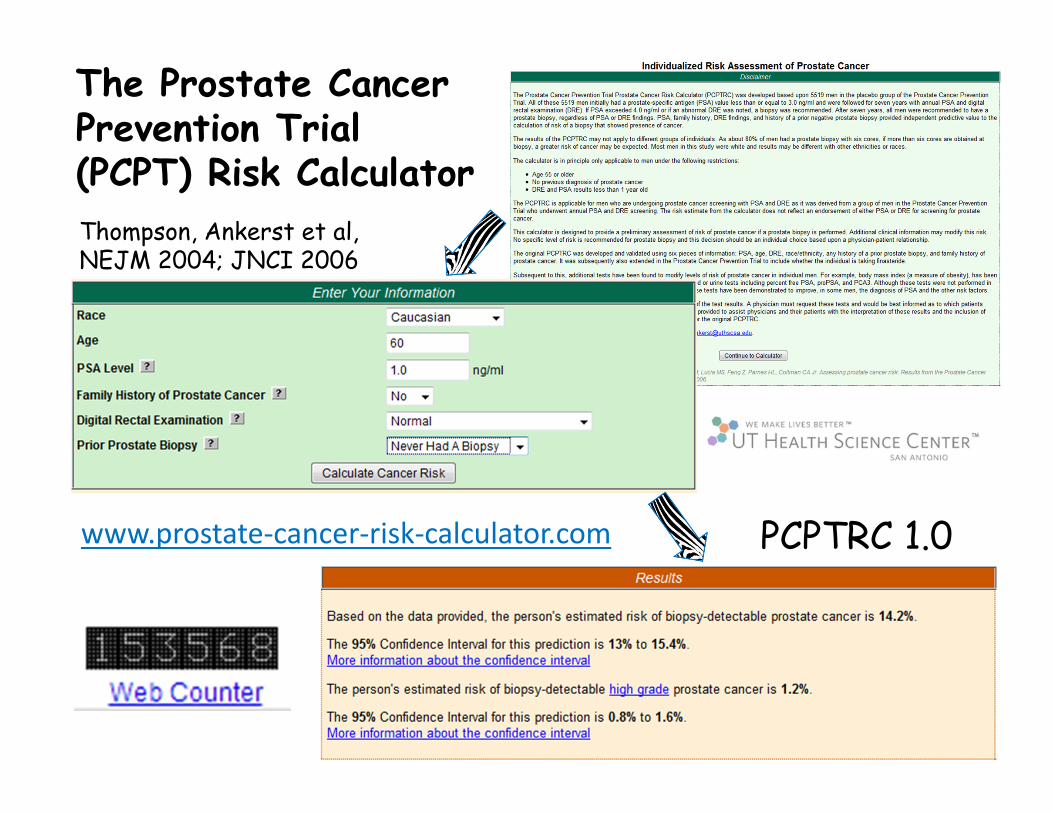
www.prostate-cancer-risk-calculator.com
The Prostate Cancer Prevention Trial (PCPT) Risk Calculator
Thompson, Ankerst et al, NEJM 2004; JNCI 2006
PCPTRC 1.0
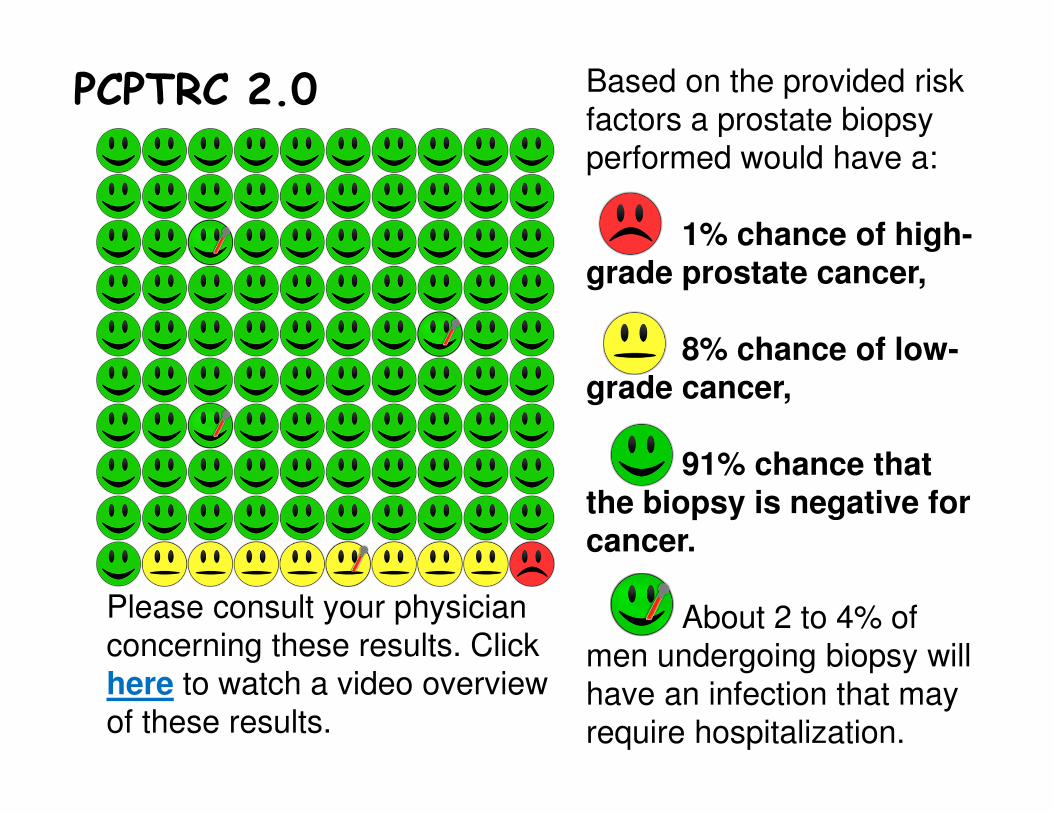
Based on the provided risk
factors a prostate biopsy
performed would have a:
1% chance of high-
grade prostate cancer,
8% chance of low-
grade cancer,
91% chance that
the biopsy is negative for
cancer.
About 2 to 4% of
men undergoing biopsy will
have an infection that may
require hospitalization.
Please consult your physician
concerning these results. Click
here to watch a video overview
of these results.
PCPTRC 2.0
4
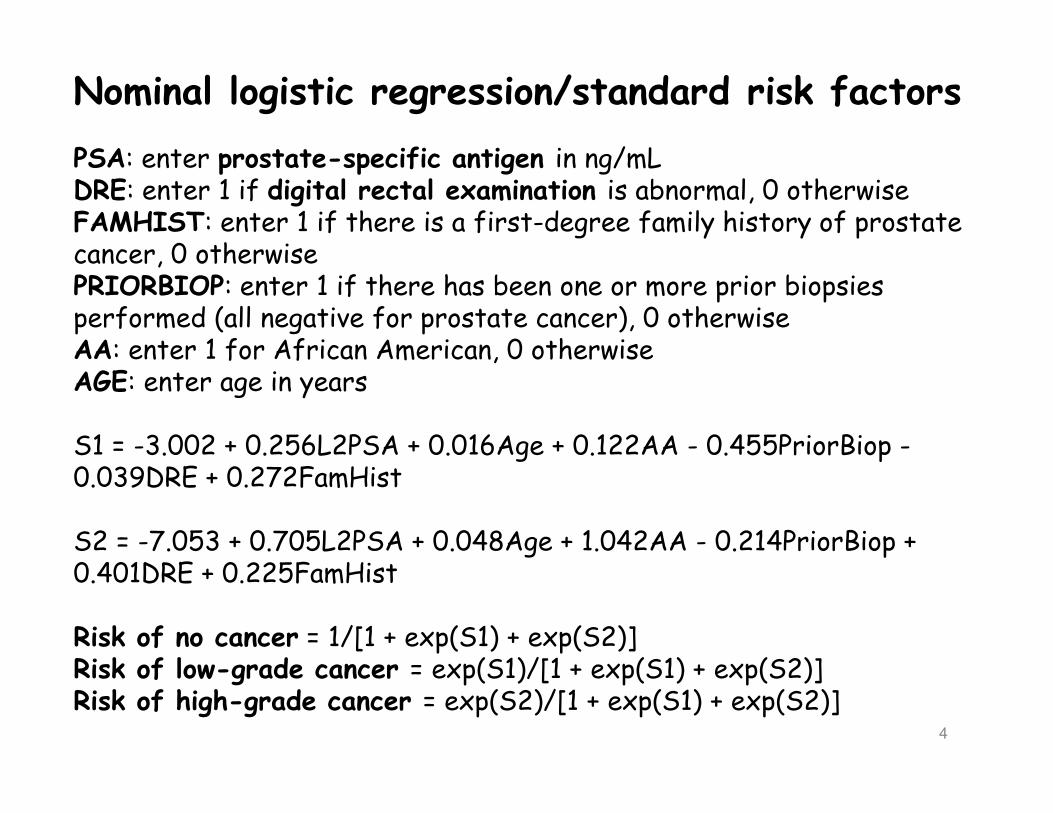
Nominal logistic regression/standard risk factors
PSA: enter prostate-specific antigen in ng/mLDRE: enter 1 if digital rectal examination is abnormal, 0 otherwiseFAMHIST: enter 1 if there is a first-degree family history of prostate cancer, 0 otherwisePRIORBIOP: enter 1 if there has been one or more prior biopsies performed (all negative for prostate cancer), 0 otherwiseAA: enter 1 for African American, 0 otherwiseAGE: enter age in years
S1 = -3.002 + 0.256L2PSA + 0.016Age + 0.122AA - 0.455PriorBiop -0.039DRE + 0.272FamHist
S2 = -7.053 + 0.705L2PSA + 0.048Age + 1.042AA - 0.214PriorBiop + 0.401DRE + 0.225FamHist
Risk of no cancer = 1/[1 + exp(S1) + exp(S2)]Risk of low-grade cancer = exp(S1)/[1 + exp(S1) + exp(S2)]Risk of high-grade cancer = exp(S2)/[1 + exp(S1) + exp(S2)]
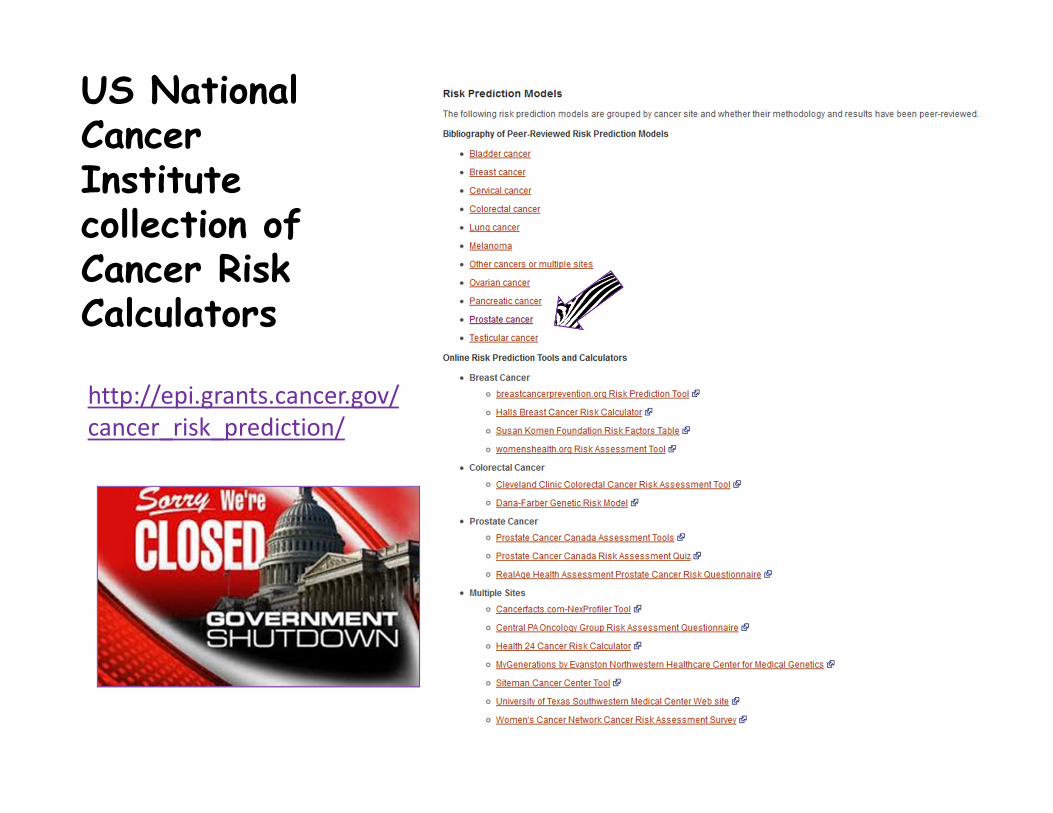
US National Cancer Institute collection of Cancer Risk Calculators
http://epi.grants.cancer.gov/
cancer_risk_prediction/
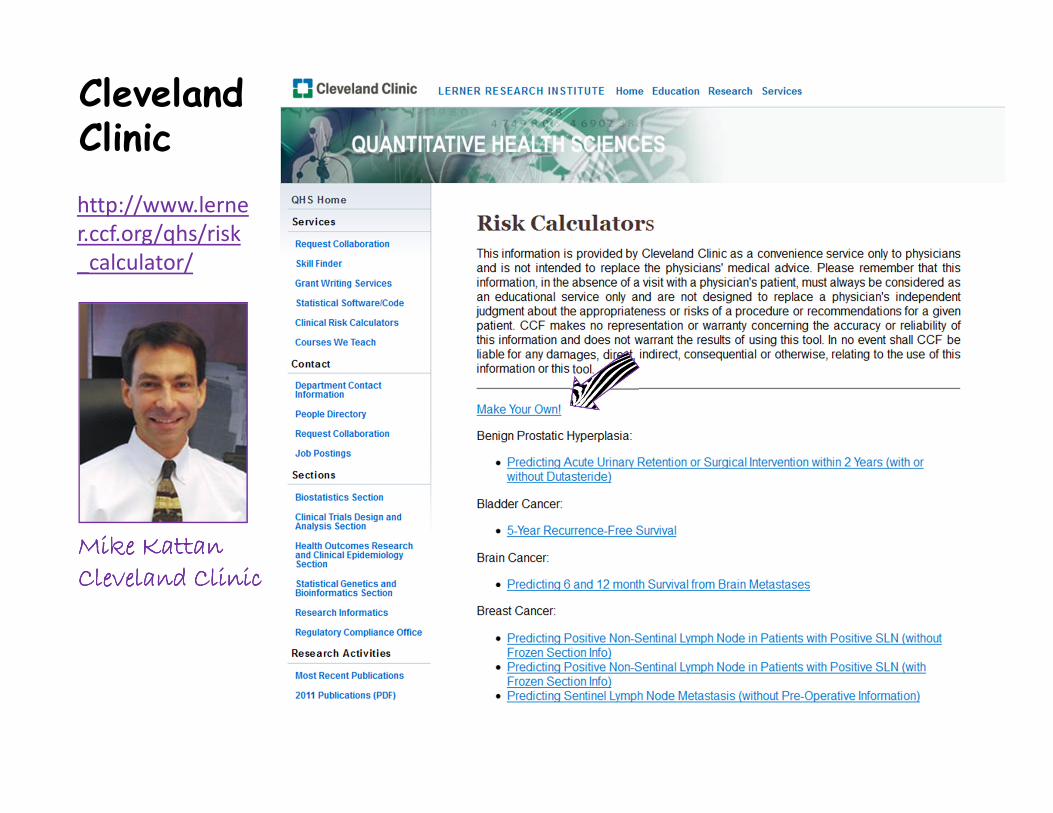
Cleveland Clinic
http://www.lerne
r.ccf.org/qhs/risk
_calculator/
Mike Mike Mike Mike KattanKattanKattanKattanCleveland ClinicCleveland ClinicCleveland ClinicCleveland Clinic
7
Completion of randomized trials and studies have brought about a change in the clinical landscape since 2006
Different case-mixes of hospital settings + changes in clinical practice imply constant updates to calculators are necessary (like iphones).
Ongoing discovery, validation and FDA-approval of new biomarkers for clinical practice imply a need to incorporate them into existing calculators rather than collect a new cohort from scratch (like adding a room to a house rather than building a whole new house).
8
Completion of randomized trials and studies have brought about a change in the clinical landscape since 2006
Different case-mixes of hospital settings + changes in clinical practice imply constant updates to calculators are necessary (like iphones).
Ongoing discovery, validation and FDA-approval of new biomarkers for clinical practice imply a need to incorporate them into existing calculators rather than collect a new cohort from scratch (like adding a room to a house rather than building a whole new house).
9
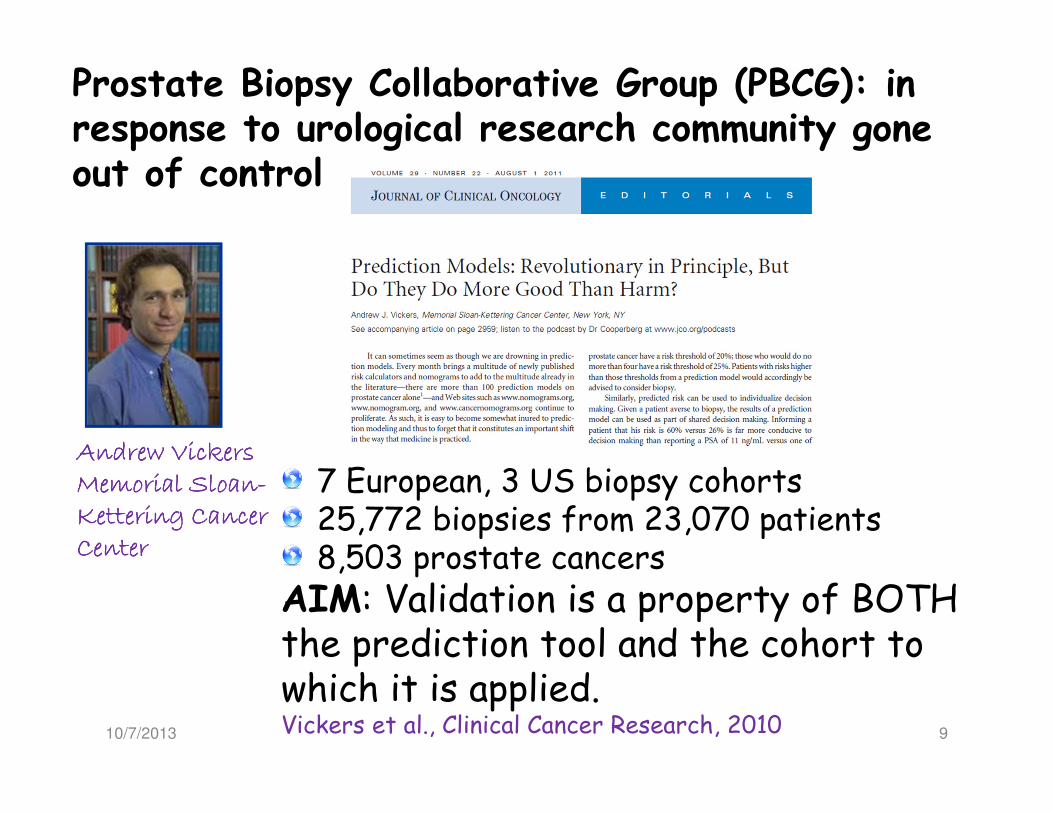
Andrew Vickers Andrew Vickers Andrew Vickers Andrew Vickers Memorial SloanMemorial SloanMemorial SloanMemorial Sloan----Kettering Cancer Kettering Cancer Kettering Cancer Kettering Cancer CenterCenterCenterCenter
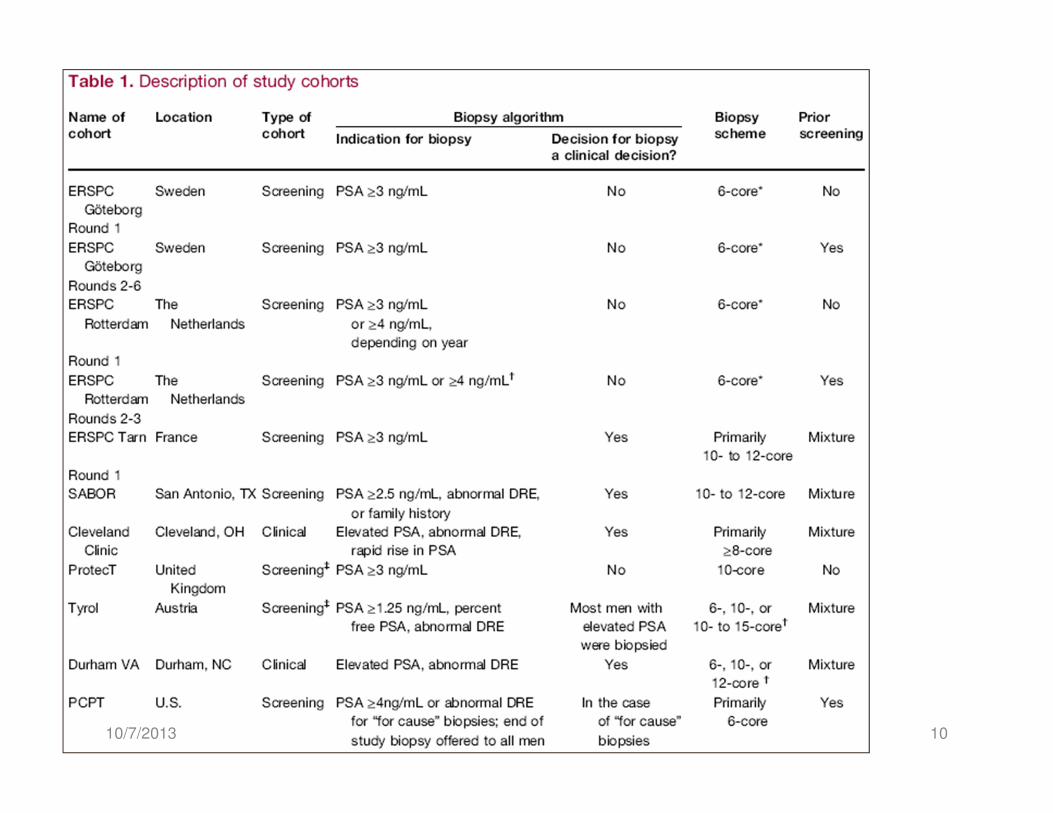
7 European, 3 US biopsy cohorts25,772 biopsies from 23,070 patients8,503 prostate cancers
AIM: Validation is a property of BOTH the prediction tool and the cohort to which it is applied.Vickers et al., Clinical Cancer Research, 2010
Prostate Biopsy Collaborative Group (PBCG): in response to urological research community gone out of control
10/7/2013
1010/7/2013
11
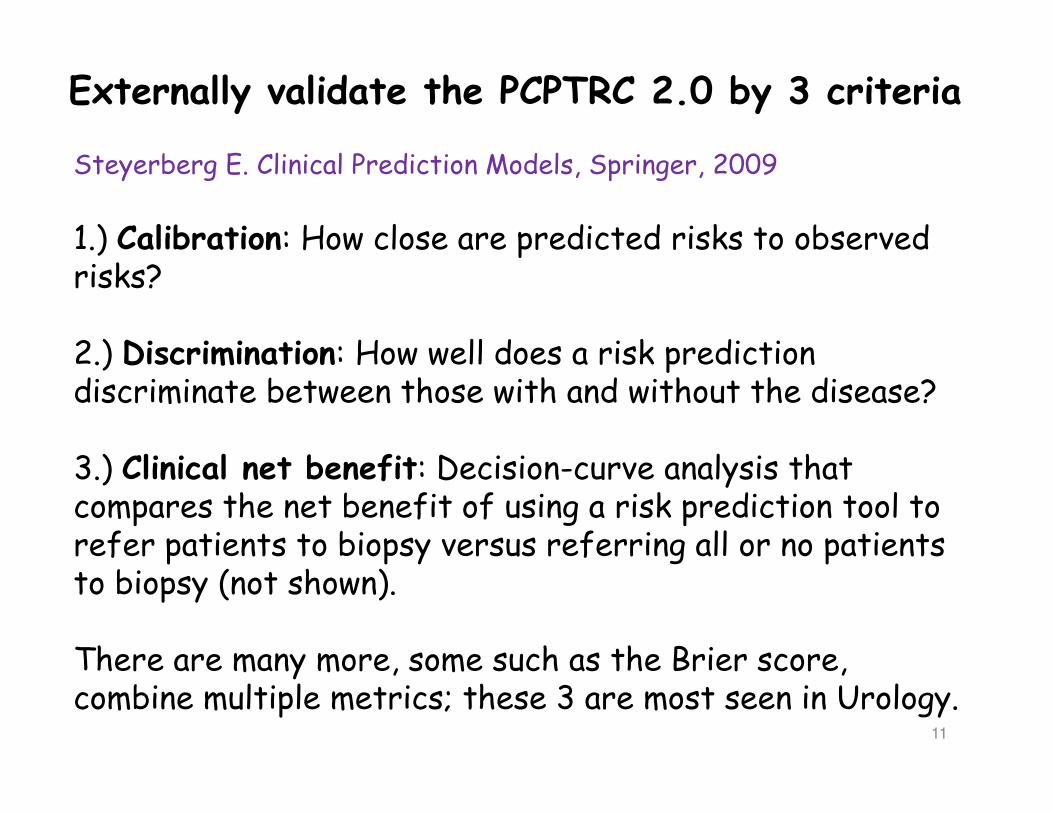
Steyerberg E. Clinical Prediction Models, Springer, 2009
1.) Calibration: How close are predicted risks to observed risks?
2.) Discrimination: How well does a risk prediction discriminate between those with and without the disease?
3.) Clinical net benefit: Decision-curve analysis that compares the net benefit of using a risk prediction tool to refer patients to biopsy versus referring all or no patients to biopsy (not shown).
There are many more, some such as the Brier score, combine multiple metrics; these 3 are most seen in Urology.
Externally validate the PCPTRC 2.0 by 3 criteria
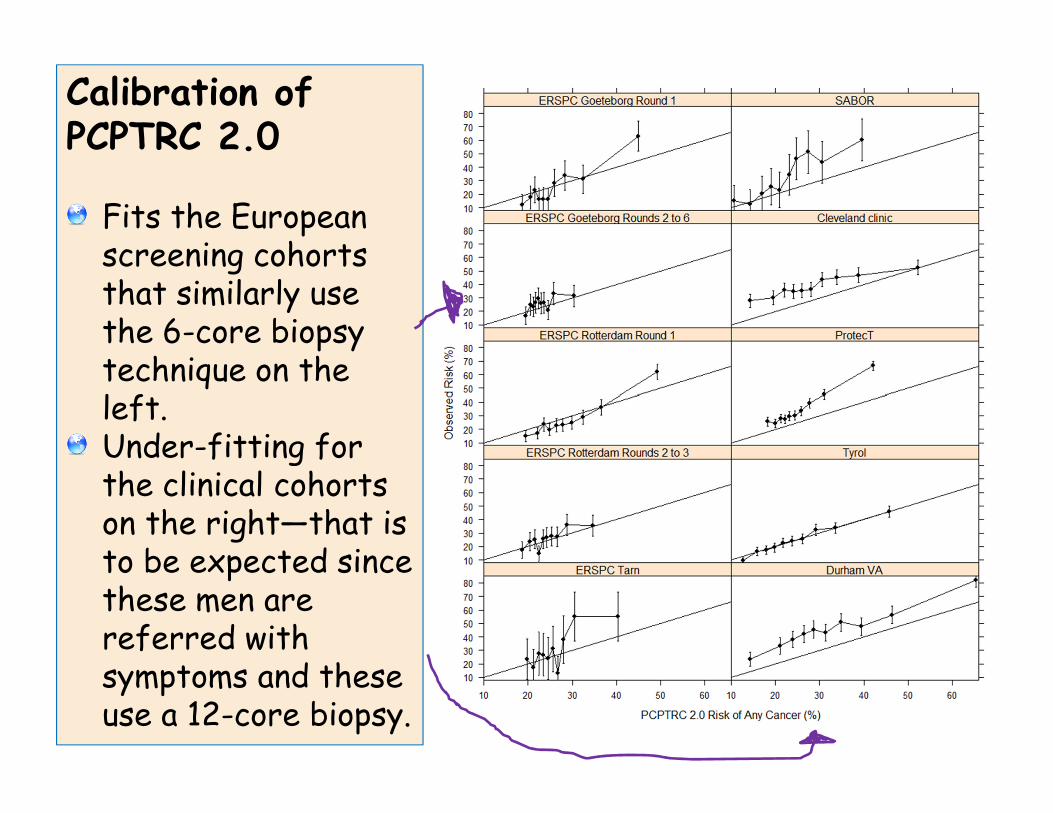
Calibration of PCPTRC 2.0
Fits the European screening cohorts that similarly use the 6-core biopsy technique on the left.Under-fitting for the clinical cohorts on the right—that is to be expected since these men are referred with symptoms and these use a 12-core biopsy.
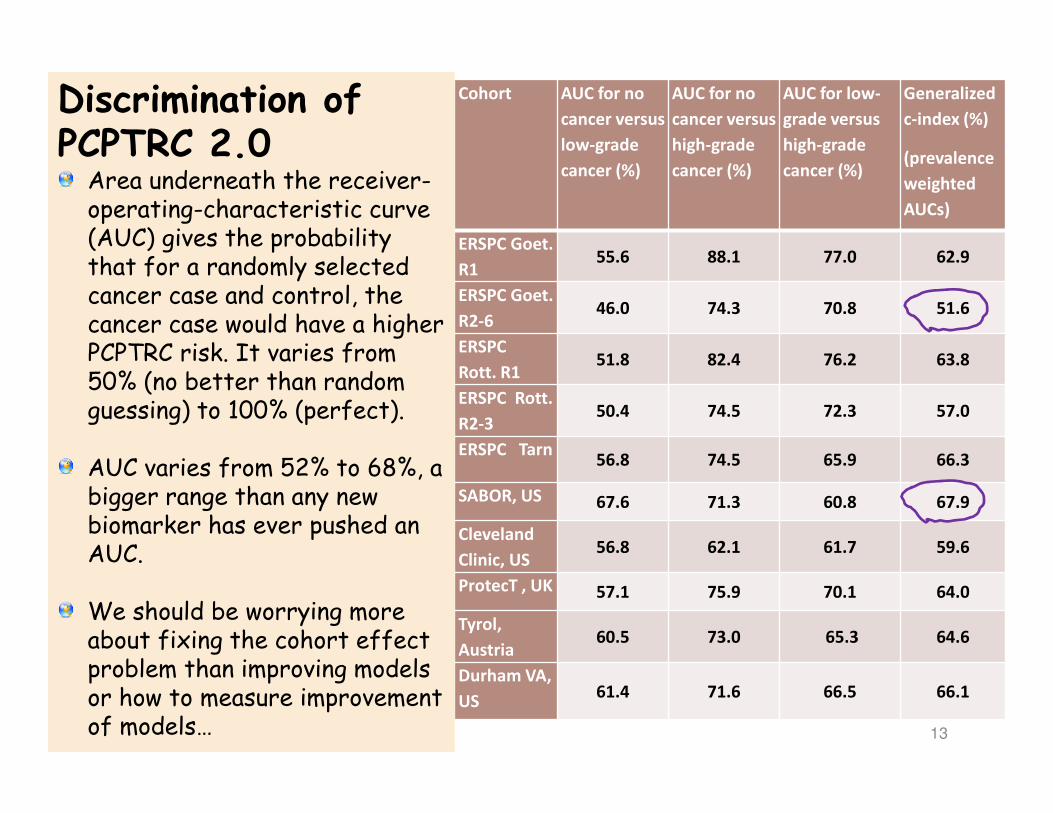
1310/7/2013
Cohort AUC for no
cancer versus
low-grade
cancer (%)
AUC for no
cancer versus
high-grade
cancer (%)
AUC for low-
grade versus
high-grade
cancer (%)
Generalized
c-index (%)
(prevalence
weighted
AUCs)
ERSPC Goet.
R155.6 88.1 77.0 62.9
ERSPC Goet.
R2-646.0 74.3 70.8 51.6
ERSPC
Rott. R151.8 82.4 76.2 63.8
ERSPC Rott.
R2-350.4 74.5 72.3 57.0
ERSPC Tarn56.8 74.5 65.9 66.3
SABOR, US 67.6 71.3 60.8 67.9
Cleveland
Clinic, US 56.8 62.1 61.7 59.6
ProtecT , UK 57.1 75.9 70.1 64.0
Tyrol,
Austria 60.5 73.0 65.3 64.6
Durham VA,
US 61.4 71.6 66.5 66.1
Discrimination of PCPTRC 2.0Area underneath the receiver-operating-characteristic curve (AUC) gives the probability that for a randomly selected cancer case and control, the cancer case would have a higher PCPTRC risk. It varies from 50% (no better than random guessing) to 100% (perfect).
AUC varies from 52% to 68%, a bigger range than any new biomarker has ever pushed an AUC.
We should be worrying more about fixing the cohort effect problem than improving models or how to measure improvement of models…
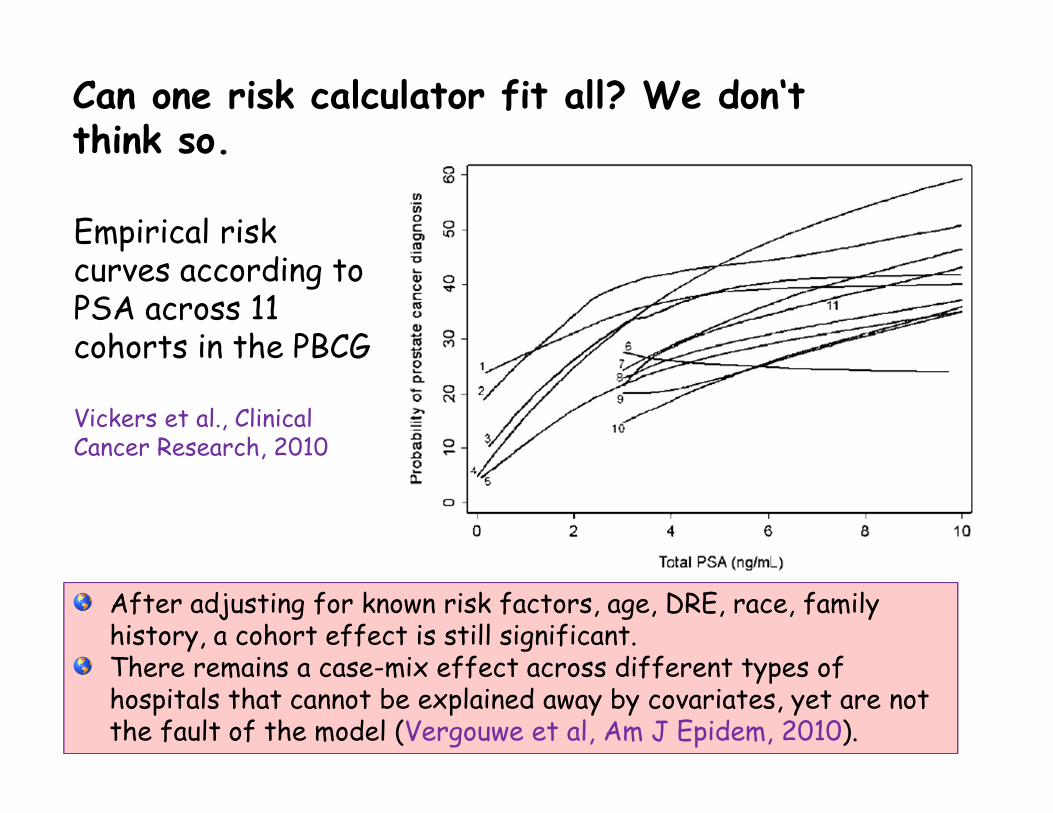
Can one risk calculator fit all? We don‘t think so.
14
After adjusting for known risk factors, age, DRE, race, family history, a cohort effect is still significant.There remains a case-mix effect across different types of hospitals that cannot be explained away by covariates, yet are not the fault of the model (Vergouwe et al, Am J Epidem, 2010).
Empirical risk curves according to PSA across 11 cohorts in the PBCG
Vickers et al., Clinical Cancer Research, 2010
15
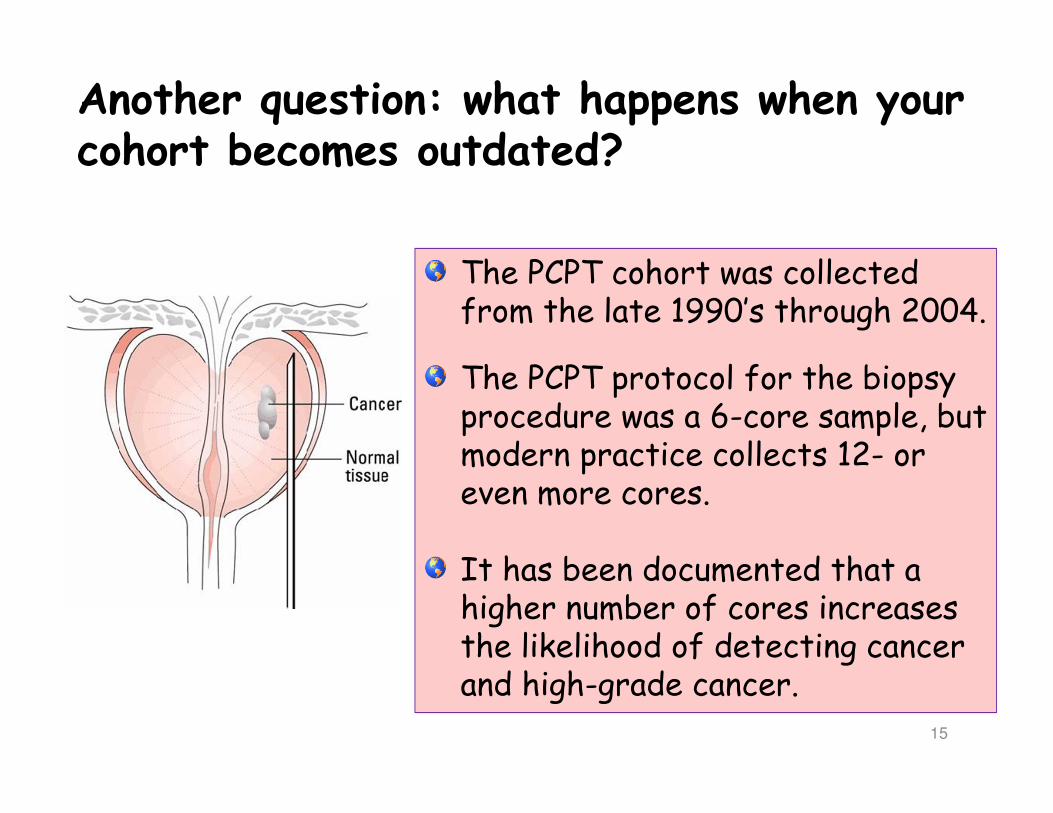
Another question: what happens when your cohort becomes outdated?
The PCPT cohort was collected from the late 1990’s through 2004.
The PCPT protocol for the biopsy procedure was a 6-core sample, but modern practice collects 12- or even more cores.
It has been documented that a higher number of cores increases the likelihood of detecting cancer and high-grade cancer.
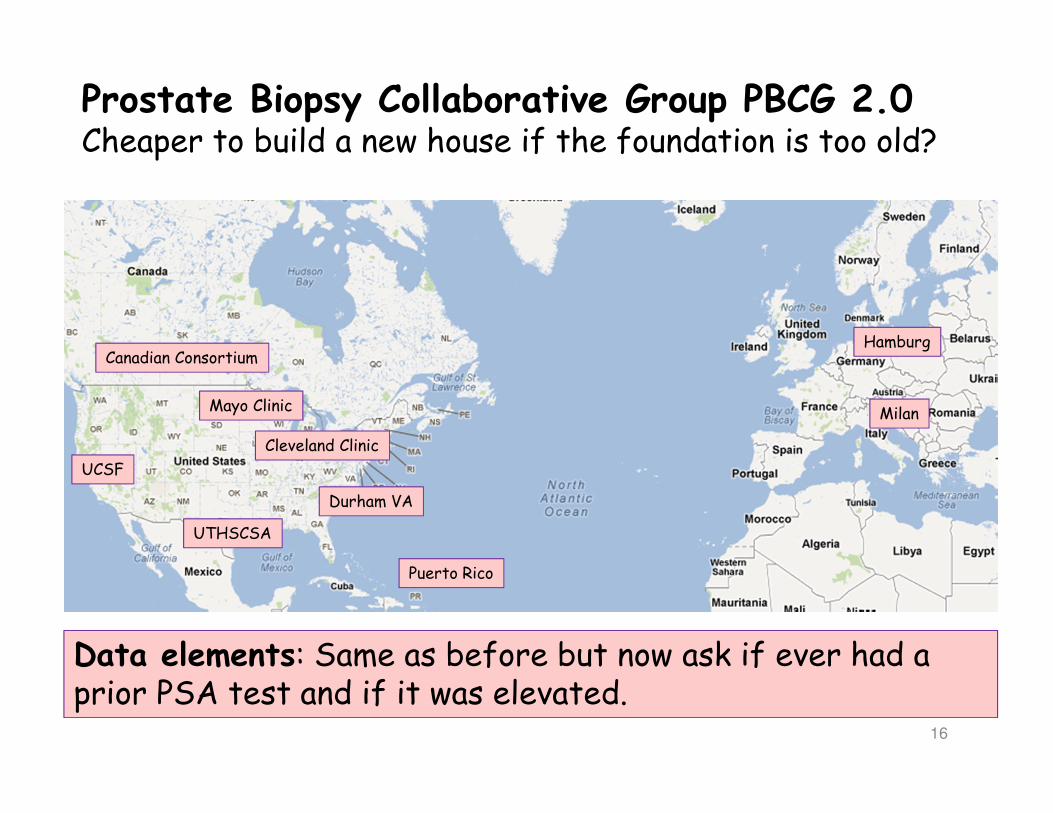
Prostate Biopsy Collaborative Group PBCG 2.0 Cheaper to build a new house if the foundation is too old?
16
Cleveland Clinic
Durham VA
Puerto Rico
Mayo Clinic
Hamburg
Milan
Canadian Consortium
UTHSCSA
UCSF
Data elements: Same as before but now ask if ever had a prior PSA test and if it was elevated.
17
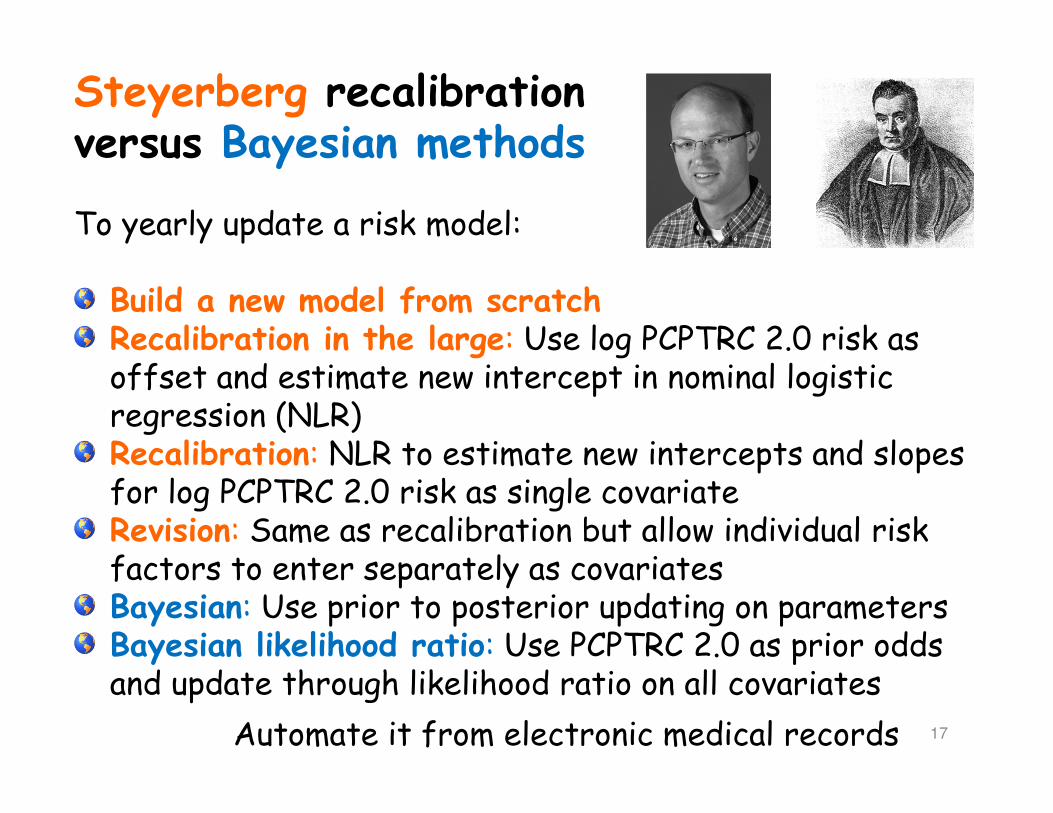
Steyerberg recalibration versus Bayesian methods
To yearly update a risk model:
Build a new model from scratchRecalibration in the large: Use log PCPTRC 2.0 risk as offset and estimate new intercept in nominal logistic regression (NLR)Recalibration: NLR to estimate new intercepts and slopes for log PCPTRC 2.0 risk as single covariateRevision: Same as recalibration but allow individual risk factors to enter separately as covariatesBayesian: Use prior to posterior updating on parametersBayesian likelihood ratio: Use PCPTRC 2.0 as prior odds and update through likelihood ratio on all covariates
Automate it from electronic medical records

18
Completion of randomized trials and studies have brought about a change in the clinical landscape since 2006
Different case-mixes of hospital settings + changes in clinical practice imply constant updates to calculators are necessary (like iphones).
Ongoing discovery, validation and FDA-approval of new biomarkers for clinical practice imply a need to incorporate them into existing calculators rather than collect a new cohort from scratch (like adding a room to a house rather than building a whole new house).
19
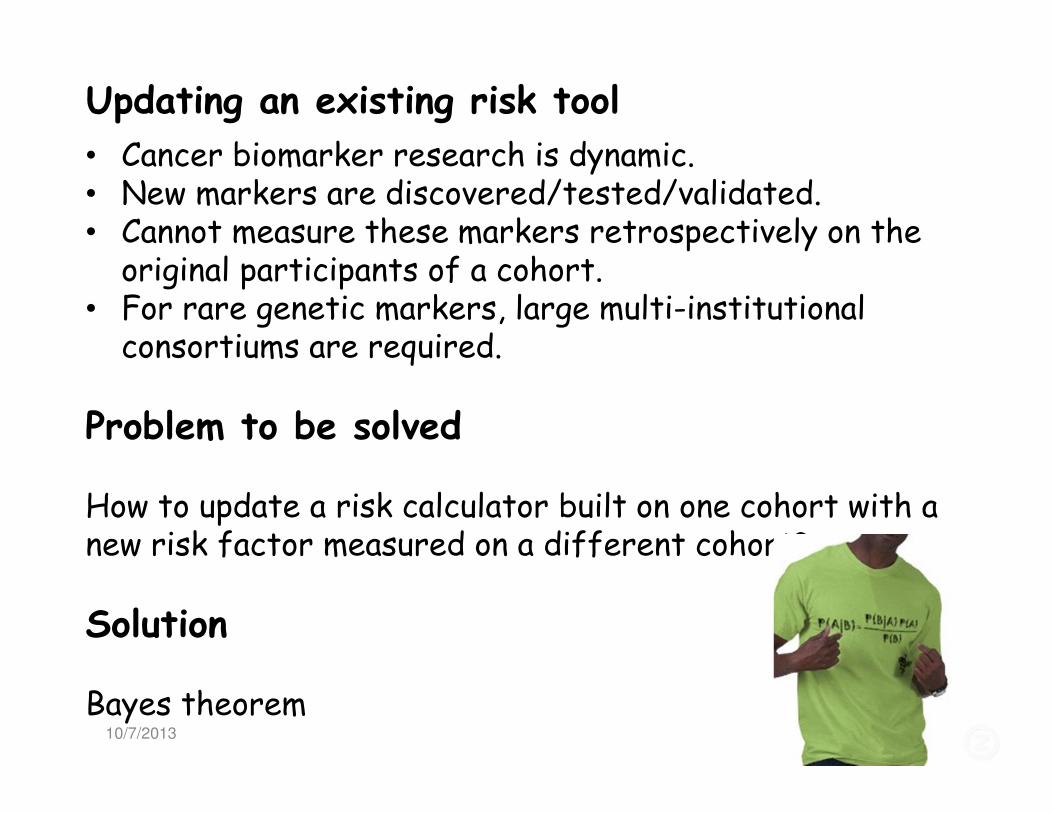
• Cancer biomarker research is dynamic.• New markers are discovered/tested/validated.• Cannot measure these markers retrospectively on the original participants of a cohort.
• For rare genetic markers, large multi-institutional consortiums are required.
Problem to be solved
How to update a risk calculator built on one cohort with a new risk factor measured on a different cohort?
Solution
Bayes theorem
Updating an existing risk tool
10/7/2013
20
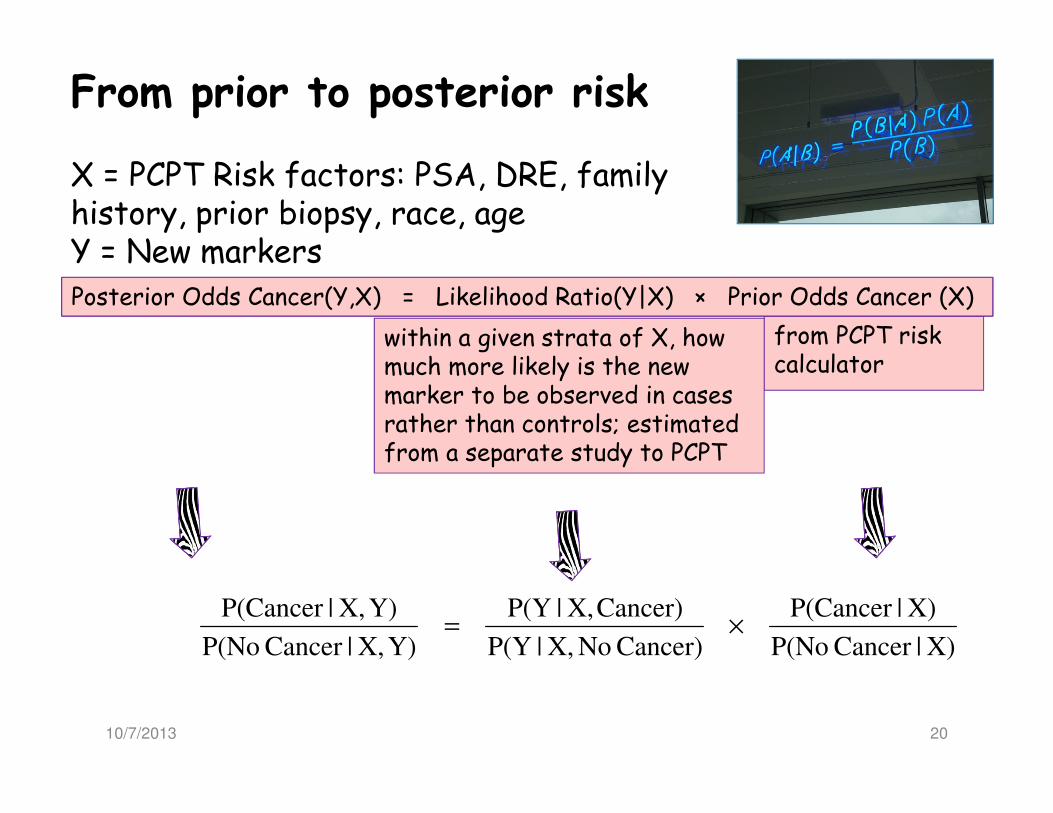
From prior to posterior risk
X = PCPT Risk factors: PSA, DRE, family history, prior biopsy, race, ageY = New markers
from PCPT risk calculator
within a given strata of X, how much more likely is the new marker to be observed in cases rather than controls; estimated from a separate study to PCPT
X)|Cancer P(No
X)|P(Cancer
Cancer) NoX,|P(Y
Cancer)X,|P(Y
Y)X,|Cancer P(No
Y)X,|P(Cancer ×=
Posterior Odds Cancer(Y,X) = Likelihood Ratio(Y|X) × Prior Odds Cancer (X)
10/7/2013

21
Single continuous marker Ankerst et al J Urol 2009
X = PCPT Risk factors: PSA, DRE, family history, prior biopsyY = log(PCA3)
X)|Cancer P(No
X)|P(Cancer
Cancer) NoX,|P(Y
Cancer)X,|P(Y
Y)X,|Cancer P(No
Y)X,|P(Cancer×=
( )
( )
1.0191
1.0366
biop.1260prior+.3345dre-.0577age+sa).1137log(p-.6915-
biop.0658prior+.1055dre+.0376age+sa).0836log(p-1.1926
2
1exp
1
2
1exp
1
2
22
2
22
=
=
=
−−
−−
cancerno
cancer
cancerno
cancer
cancerno
cancernocancerno
cancer
cancercancer
σ
σ
Y
Y
µ
µ
µσσ
µσσ
PCPTRC 1.0 logistic regression
Linear regressions of Y on X in cancer cases and controls separately.
rbiop0.4483prio–
0.9054dre ist 0.2693famh
log(psa) 0.8488 -1.7968
)exp(
++
+=′
′
X
X
β
β
10/7/2013
Confidence,prediction intervals for posterior risk by delta rule.
22
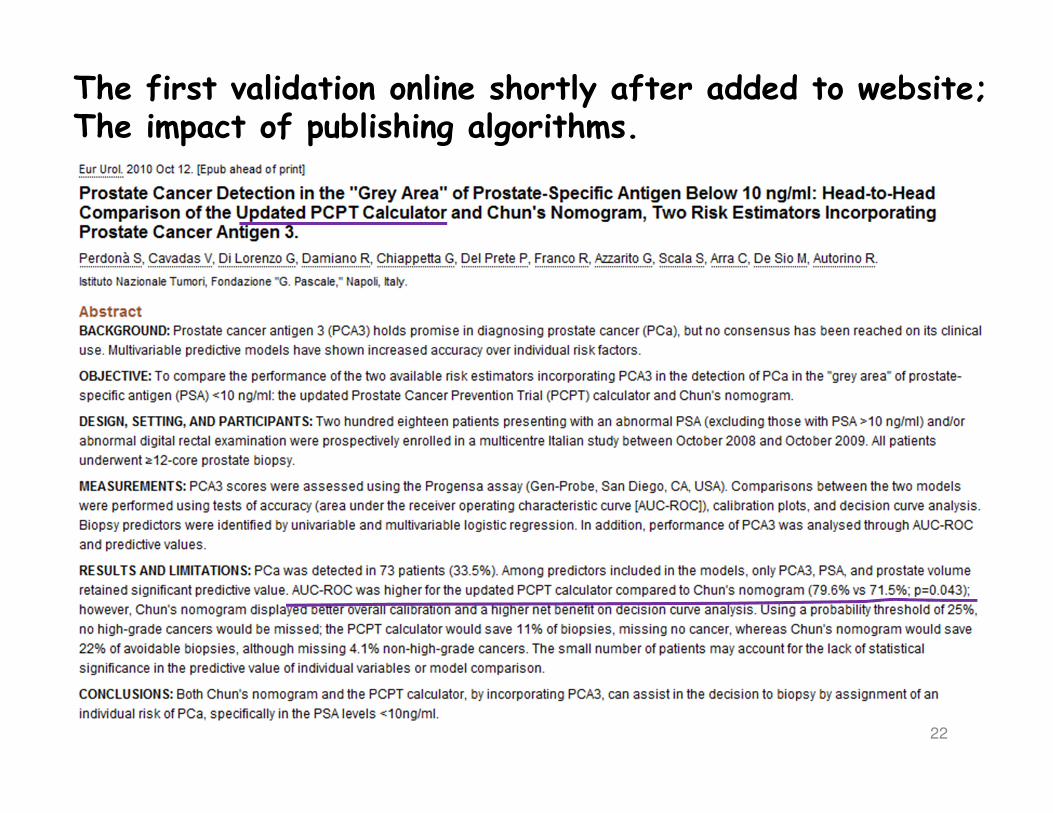
The first validation online shortly after added to website;The impact of publishing algorithms.
23
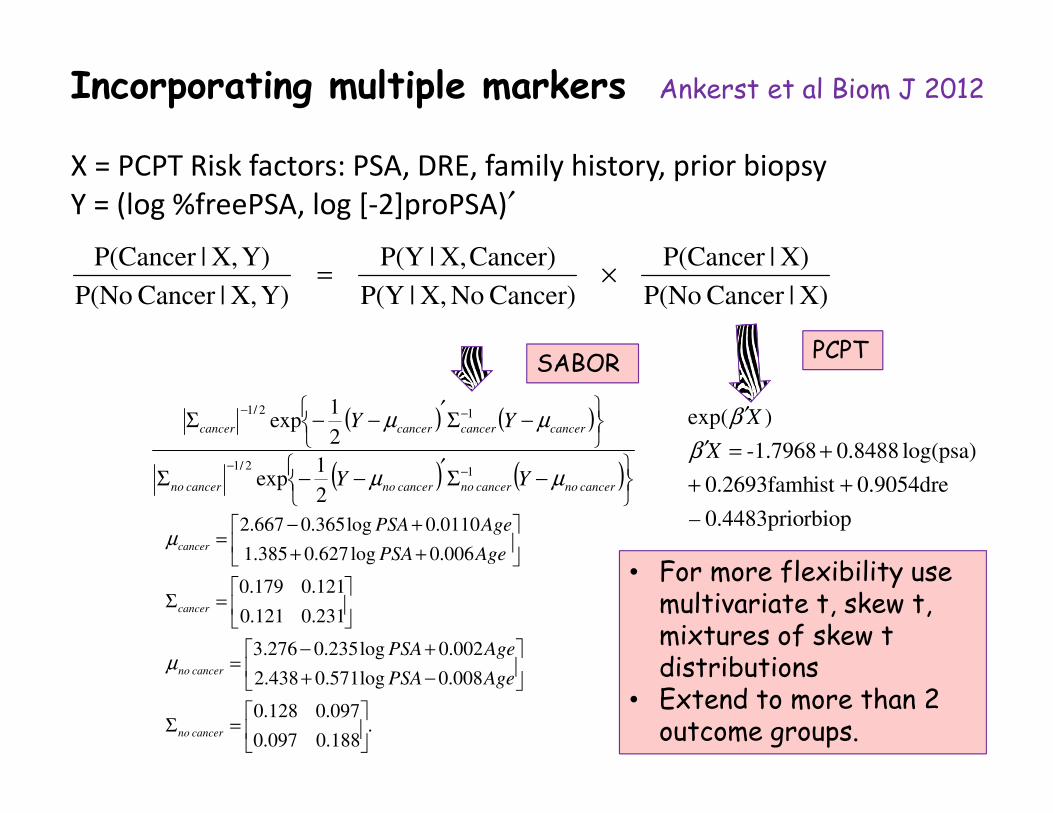
Incorporating multiple markers Ankerst et al Biom J 2012
X = PCPT Risk factors: PSA, DRE, family history, prior biopsy
Y = (log %freePSA, log [-2]proPSA)′
X)|Cancer P(No
X)|P(Cancer
Cancer) NoX,|P(Y
Cancer)X,|P(Y
Y)X,|Cancer P(No
Y)X,|P(Cancer×=
( ) ( )
( ) ( )
−Σ′
−−Σ
−Σ′
−−Σ
−−
−−
cancernocancernocancernocancerno
cancercancercancercancer
YY
YY
µµ
µµ
12/1
12/1
2
1exp
2
1exp
.188.0097.0
097.0128.0
008.0log571.0438.2
002.0log235.0276.3
231.0121.0
121.0179.0
006.0log627.0385.1
0110.0log365.0667.2
=Σ
−+
+−=
=Σ
++
+−=
cancerno
cancerno
cancer
cancer
AgePSA
AgePSA
AgePSA
AgePSA
µ
µ
PCPTSABOR
rbiop0.4483prio–
0.9054dre ist 0.2693famh
log(psa) 0.8488 -1.7968
)exp(
++
+=′
′
X
X
β
β
• For more flexibility use multivariate t, skew t, mixtures of skew t distributions
• Extend to more than 2 outcome groups.
24
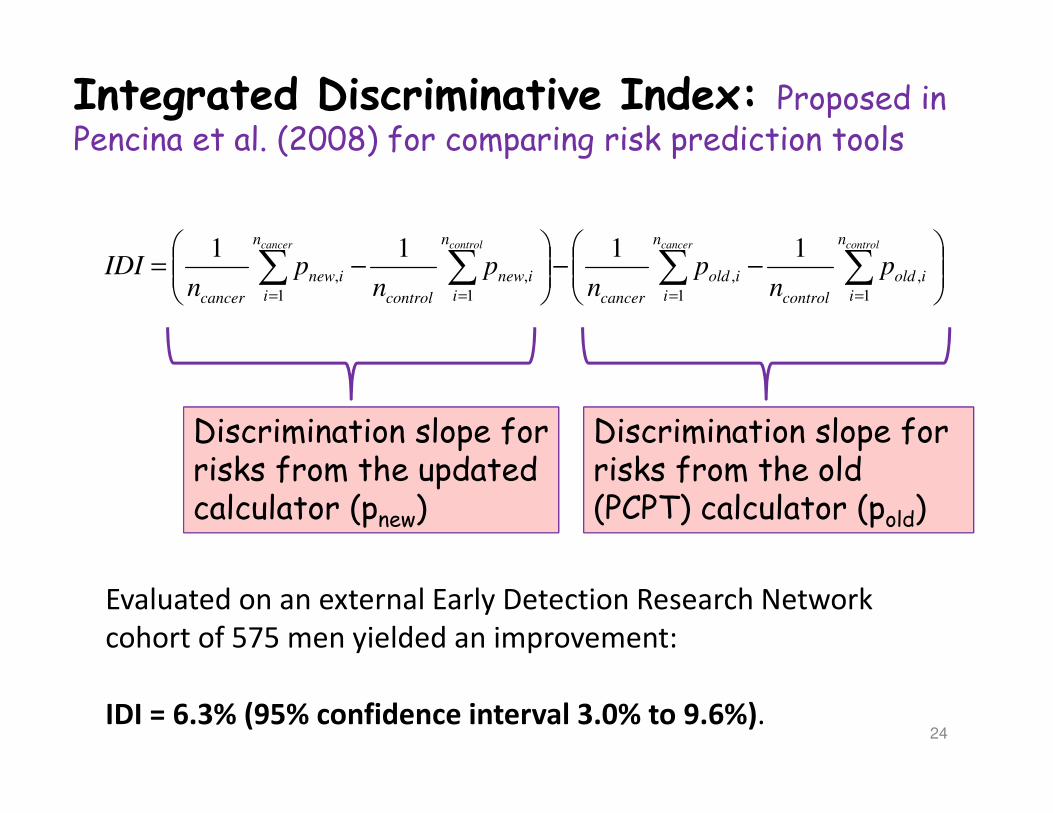
Integrated Discriminative Index: Proposed in Pencina et al. (2008) for comparing risk prediction tools
−−
−= ∑∑∑∑
====
controlcancercontrolcancer n
i
iold
control
n
i
iold
cancer
n
i
inew
control
n
i
inew
cancer
pn
pn
pn
pn
IDI1
,
1
,
1
,
1
,
1111
Discrimination slope for Discrimination slope for risks from the updated calculator (pnew)
Discrimination slope for Discrimination slope for risks from the old (PCPT) calculator (pold)
Evaluated on an external Early Detection Research Network
cohort of 575 men yielded an improvement:
IDI = 6.3% (95% confidence interval 3.0% to 9.6%).
25
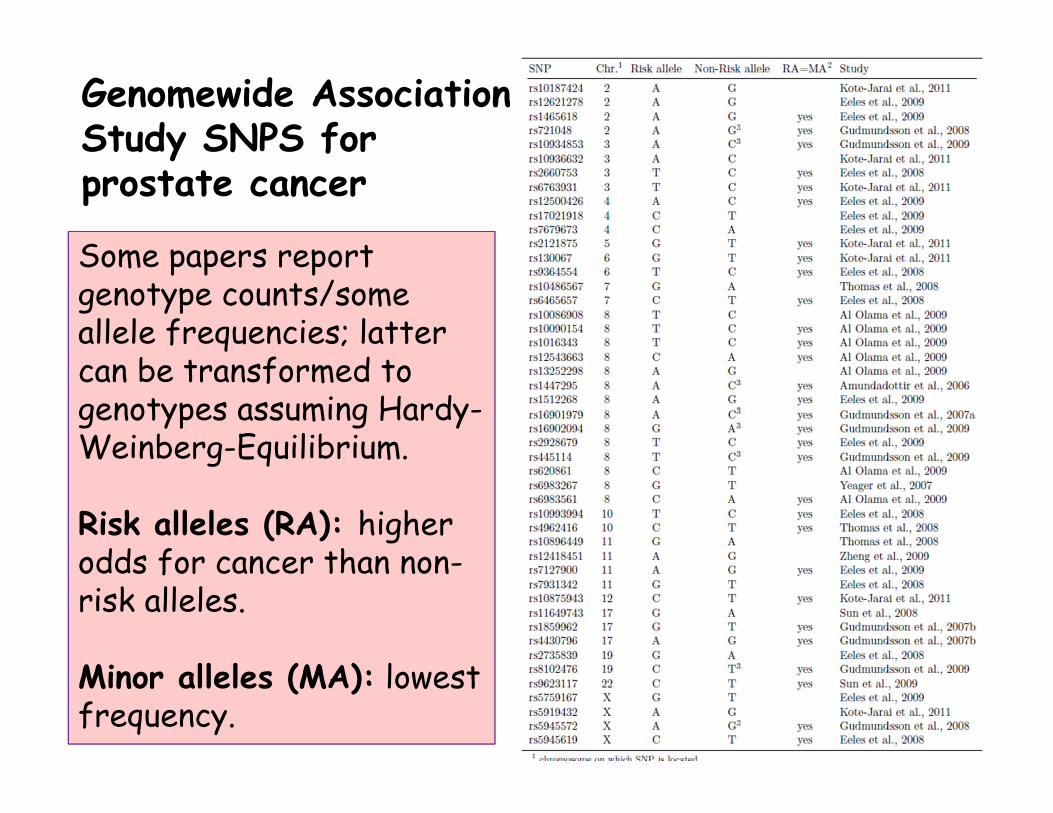
Genomewide Association Study SNPS for prostate cancer
Some papers report Some papers report genotype counts/some allele frequencies; latter can be transformed to genotypes assuming Hardy-Weinberg-Equilibrium.
Risk alleles (RA): higher odds for cancer than non-risk alleles.
Minor alleles (MA): lowest frequency.
26
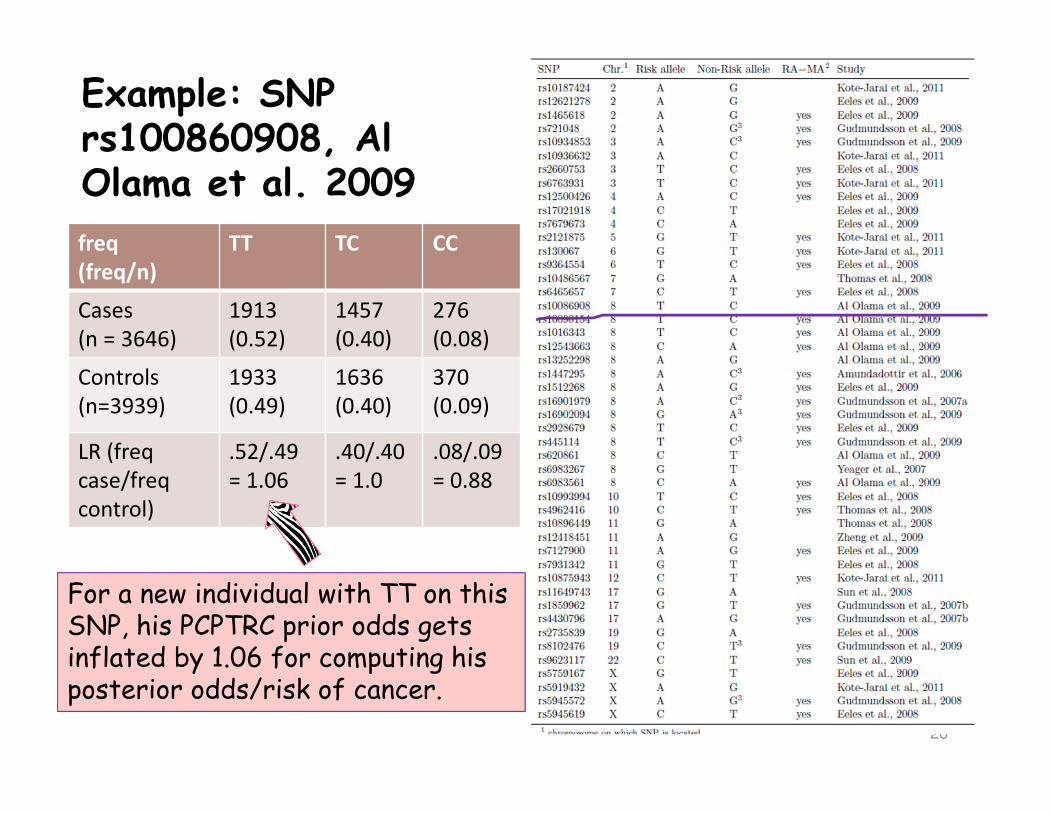
Example: SNP rs100860908, Al Olama et al. 2009
freq
(freq/n)
TT TC CC
Cases
(n = 3646)
1913
(0.52)
1457
(0.40)
276
(0.08)
Controls
(n=3939)
1933
(0.49)
1636
(0.40)
370
(0.09)
LR (freq
case/freq
control)
.52/.49
= 1.06
.40/.40
= 1.0
.08/.09
= 0.88
For a new individual with TT on this SNP, his PCPTRC prior odds gets inflated by 1.06 for computing his posterior odds/risk of cancer.
27
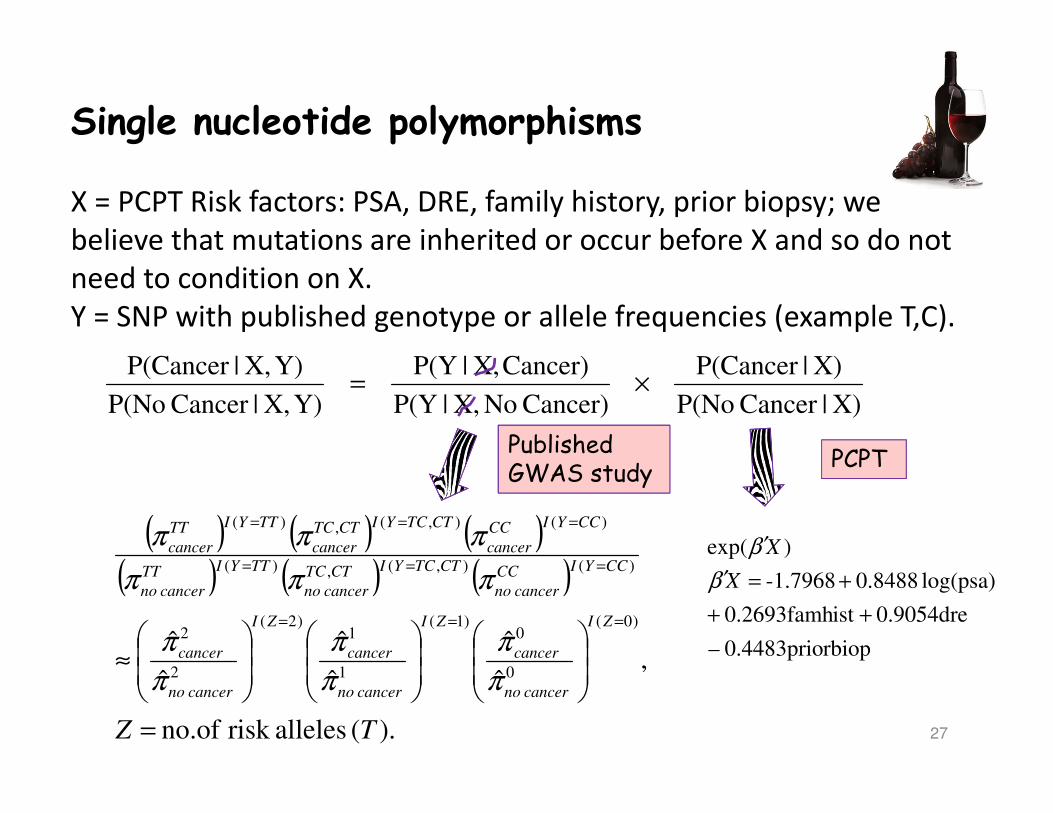
Single nucleotide polymorphisms
X = PCPT Risk factors: PSA, DRE, family history, prior biopsy; we
believe that mutations are inherited or occur before X and so do not
need to condition on X.
Y = SNP with published genotype or allele frequencies (example T,C).
X)|Cancer P(No
X)|P(Cancer
Cancer) NoX,|P(Y
Cancer)X,|P(Y
Y)X,|Cancer P(No
Y)X,|P(Cancer×=
( ) ( ) ( )( ) ( ) ( )
).( allelesrisk no.of
,ˆ
ˆ
ˆ
ˆ
ˆ
ˆ)0(
0
0)1(
1
1)2(
2
2
)(),(,)(
)(),(,)(
TZ
ZI
cancerno
cancer
ZI
cancerno
cancer
ZI
cancerno
cancer
CCYICC
cancerno
CTTCYICTTC
cancerno
TTYITT
cancerno
CCYICC
cancer
CTTCYICTTC
cancer
TTYITT
cancer
=
≈
===
===
===
π
π
π
π
π
π
πππ
πππ
PCPTPublished GWAS study
rbiop0.4483prio–
0.9054dre ist 0.2693famh
log(psa) 0.8488 -1.7968
)exp(
++
+=′
′
X
X
β
β
28
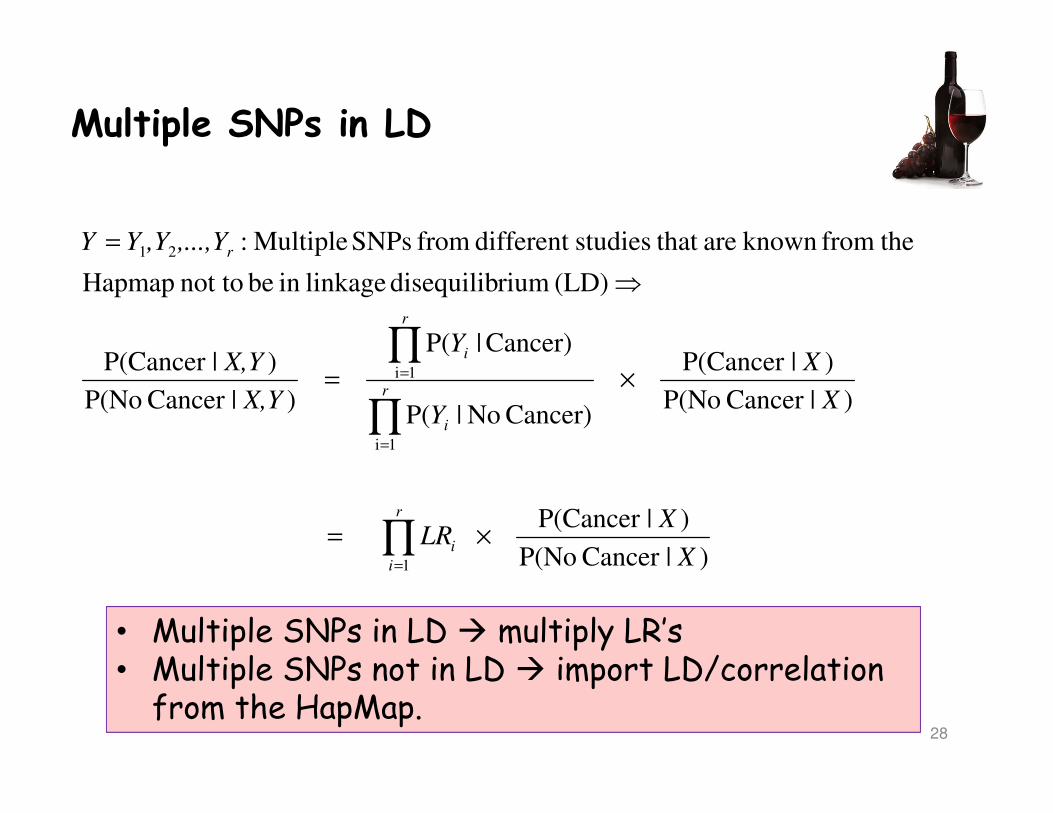
Multiple SNPs in LD
)|Cancer P(No
)|P(Cancer
)|Cancer P(No
)|P(Cancer
Cancer) No|P(
Cancer)|P(
)|Cancer P(No
)|P(Cancer
(LD) riumdisequilib linkage in be not to Hapmap
thefrom known are that studiesdifferent from SNPs Multiple:
1
1i
1i
21
X
XLR
X
X
Y
Y
X,Y
X,Y
,...,Y,YYY
r
i
i
r
i
r
i
r
×=
×=
⇒
=
∏
∏
∏
=
=
=
• Multiple SNPs in LD � multiply LR’s• Multiple SNPs not in LD � import LD/correlation from the HapMap.
29
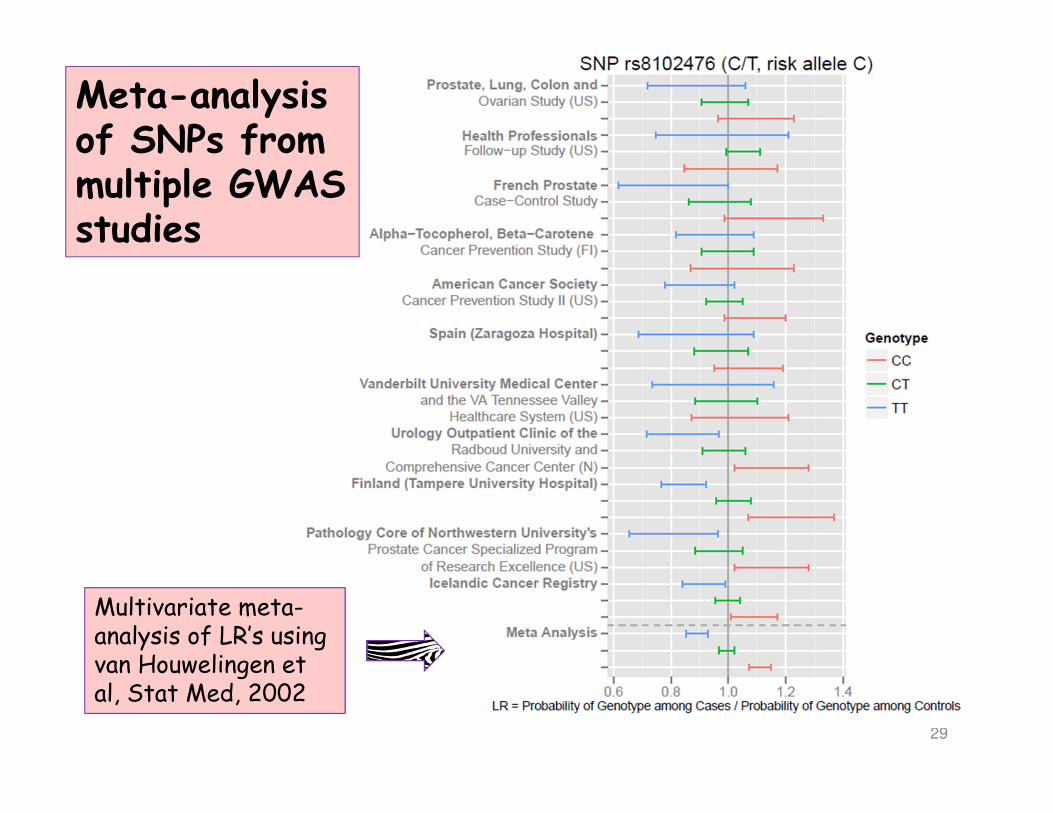
Meta-analysis of SNPs from multiple GWAS studies
Multivariate meta-analysis of LR’s using van Houwelingen et al, Stat Med, 2002
30
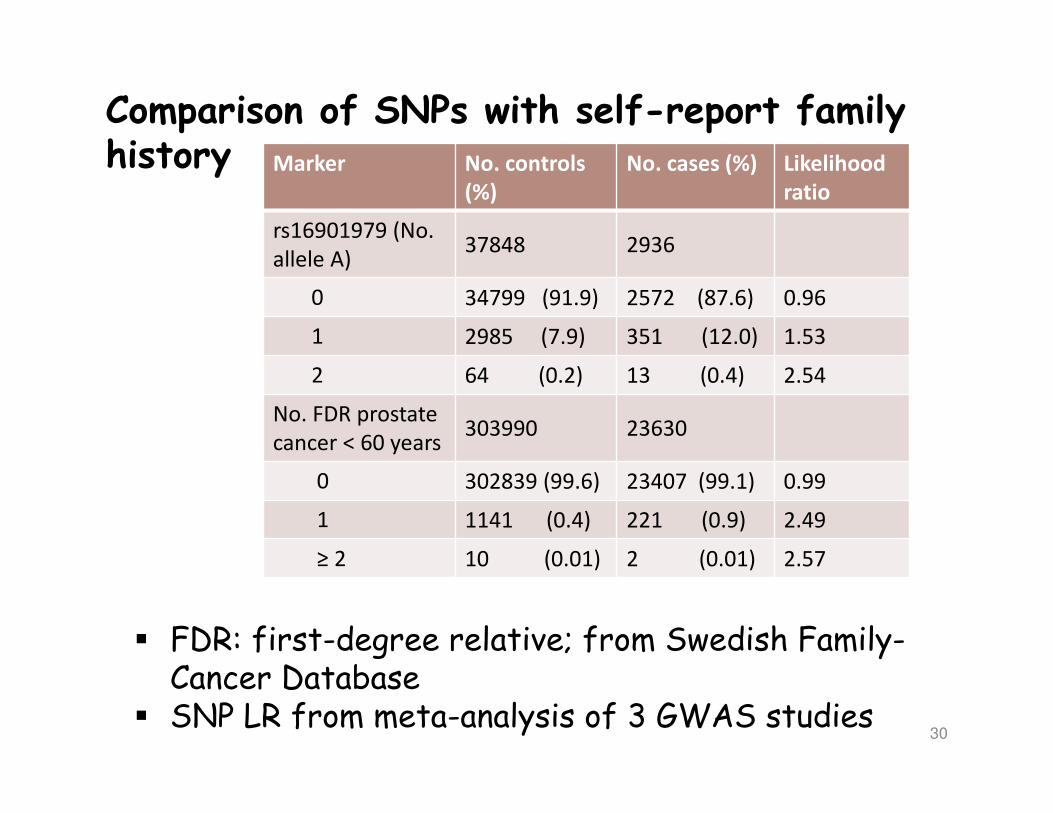
Comparison of SNPs with self-report family history Marker No. controls
(%)
No. cases (%) Likelihood
ratio
rs16901979 (No.
allele A)37848 2936
0 34799 (91.9) 2572 (87.6) 0.96
1 2985 (7.9) 351 (12.0) 1.53
2 64 (0.2) 13 (0.4) 2.54
No. FDR prostate
cancer < 60 years303990 23630
0 302839 (99.6) 23407 (99.1) 0.99
1 1141 (0.4) 221 (0.9) 2.49
≥ 2 10 (0.01) 2 (0.01) 2.57
� FDR: first-degree relative; from Swedish Family-Cancer Database
� SNP LR from meta-analysis of 3 GWAS studies
31
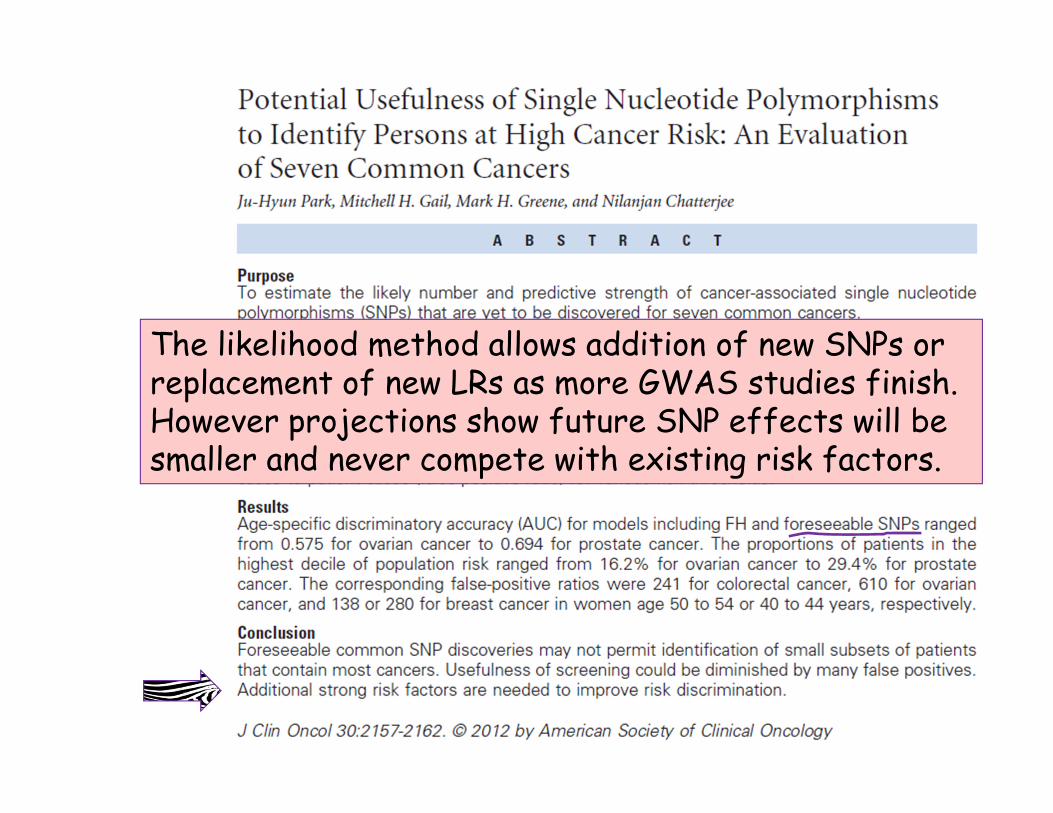
The likelihood method allows addition of new SNPs or replacement of new LRs as more GWAS studies finish. However projections show future SNP effects will be smaller and never compete with existing risk factors.
32
Closing remarks
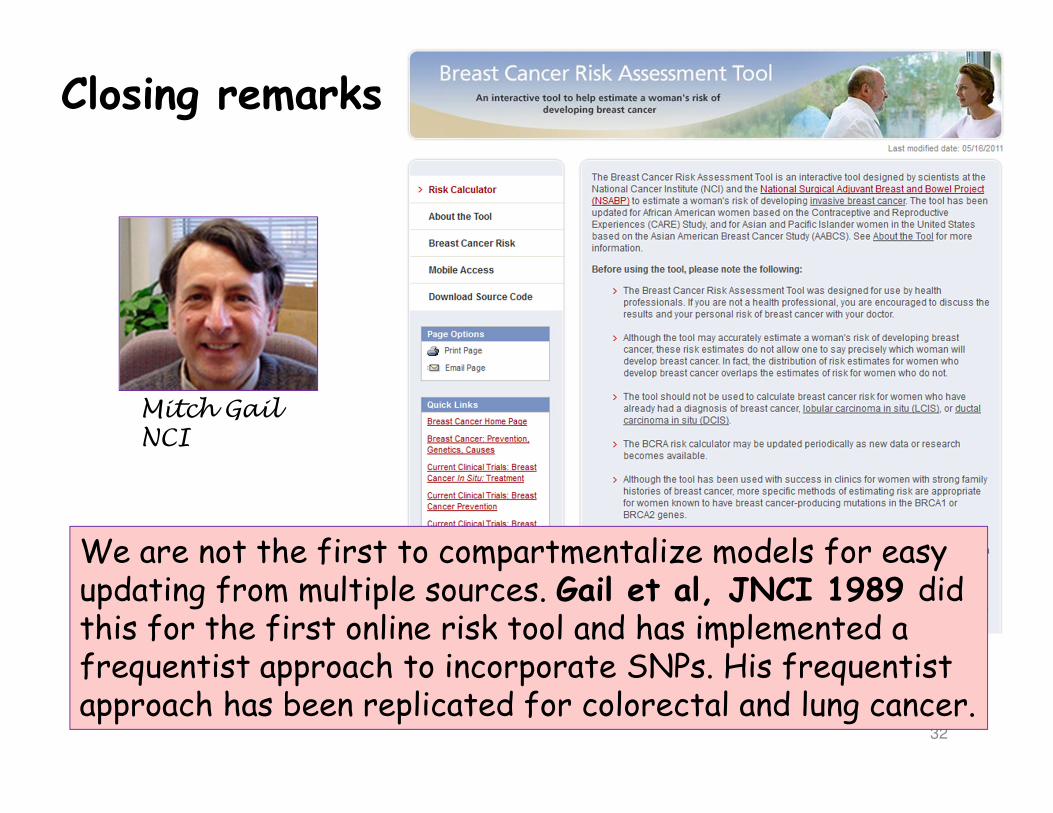
Mitch Gail NCI
We are not the first to compartmentalize models for easy updating from multiple sources. Gail et al, JNCI 1989 did this for the first online risk tool and has implemented a frequentist approach to incorporate SNPs. His frequentist approach has been replicated for colorectal and lung cancer.

33
Acknowledgements Acknowledgements Acknowledgements Acknowledgements
TUM: Josef Hoefler, Sonja GrillUTHSCSA: Russell MacShane, Robin Leach, Ian M. Thompson
Bordeaux