towards flash disk use in databases— keeping...
TRANSCRIPT

Towards Flash Disk Use in Databases—Keeping Performance While Saving Energy?
Theo Härder, Karsten Schmidt,Yi Ou, and Sebastian Bächle
Databases and Information Systems GroupDepartment of Computer Science
University of KaiserslauternD-67653 Kaiserslautern, Germany
{haerder,kschmidt,ou,baechle}@cs.uni-kl.de
Abstract: Green computing or energy saving when processing information is primar-ily considered a task of processor development. We, however, advocate that a holisticapproach is necessary to reduce power consumption to a minimum. We explore thepotential of NAND flash memory in comparison to magnetic disks for DBMS-basedarchitectures. For this reason, we attempt to identify the IO performance of both stor-age types at the device level and file system interface, before we approach the mostimportant question how DBMS applications can take advantage of the flash perfor-mance characteristics. Furthermore, based on an analysis of storage structures andrelated benchmark runs in our XTC system, we discuss how IO-intensive DBMS algo-rithms have to be adjusted to take most out of the flash technology which is entering theserver area with dramatic pace. The ultimate goal is to substantially improve energyefficiency while comparable performance as in disk-based DB servers is maintained.
1 Introduction
Recently, green computing gained a lot of attention and visibility also triggered by pub-lic discussion concerning global warming due to increased CO2 emissions. It primarilyaddresses efforts to reduce power usage, heat transmission, and, in turn, cooling needsof hardware devices. Thus, research and development primarily focus on processor chipsusing extensive hardware controls. Thermal management, however, is a holistic challenge.It includes not only simultaneous optimizations in the materials, devices, circuits, cores,and chips areas, but also combined efforts regarding system architecture (e.g., energy-efficient storage) and system software (e.g., energy-optimal algorithms). Moreover, vir-tualization of all system resources enables an energy-aware system management, e.g., bylaunching a control center which monitors workload changes and may respond by allo-cating/deactivation entire server machines. Even supply chains are considered from thisperspective to minimize their “carbon footprint”1.
Up to now, research has hardly contributed to this important overall goal in the databasemanagement system (DBMS) domain. But, NAND flash memory (also called solid state
1“SAP optimizes CO2 balance of supply chains”, Computer Zeitung, Sept. 2008
167
disk or flash, for short) has the potential to become the future store for permanent databasedata [4]; it promises—compared to magnetic disks (disk, for short)—breakthroughs inbandwidth (IOps), energy saving, reliability, and volumetric capacity [6].
So far, flash storage was considered ideal for keeping permanent data in embedded de-vices, because it is energy efficient, small, light-weight, noiseless, and shock resistant. So,it is used in personal digital assistants (PDAs), pocket PCs, or digital cameras and providesthe great advantage of zero-energy needs, when idle or turned off. In these cases, flash usecould be optimally configured to specific single-user workloads known in advance.
Because NAND flash memory is non-volatile, allows for sequential and random blockreads/writes, and keeps its state even without energy supply, it can be compared to disksand can possibly take over the role of disks in server environments. However, not allaspects important for single-use devices count for DB servers and not all out-of-the-boxDBMS algorithms can be directly applied and guarantee adequate performance when pro-cessing data stored on flash.
In this paper, we want to explore whether flash disks—from a performance point ofview—can take over the role of or even replace magnetic disks in DB server environ-ments. In Section 2, we summarize the potential of flash storage as a competitor of disksin such environments. While decades ago the device-related IO performance completelydetermined the cost of application IOs, nowadays a variety of built-in optimization mecha-nisms in the IO path of DBMS applications may relieve the real IO overhead and improvethe related IO cost suchlike that the plain device characteristics may only play a minorrole. For this reason, we evaluate in Section 3 the device-related IO performance of bothcompetitors, where the influence of the OS file system is avoided as far as possible. InSection 4, more detailed IO performance tests are conducted at the file level to identifythe influence of the OS and the file system. To figure out the discrepancy of flash and diskefficiency at the DBMS level in Section 5, we outline three native storage mappings ofXML documents available in XTC, our native XML DBMS [12]. These storage mappingsserve to discriminate the number of IO requests needed when processing XML workloadsand help to reveal in Section 6 the DBMS-related IO performance for the storage devicescompared. Finally, we throw a glance at the question of energy saving, before we concludeour findings in Section 7.
2 Flash Usage in DB Servers?
Usually, fixed-size blocks are mapped to external storage and are the units of IO (data trans-fer of a byte sequence) from an external device to the OS. Such blocks, in turn, are storedon disk as a consecutive sequence of smaller units, called segments typically consisting of512 B. Storage representation is organized differently on flash. The entire storage spaceis divided into m equal flash blocks typically much larger than disk blocks. A flash blocknormally contains k (32–128) fixed-size flash segments, where a segment ranges between512 B and 2 KB. Because of the NAND logic, an individual segment cannot be directlyupdated, but needs erasure (reset) of the flash block it is contained in (automatically doneby the flash device), before it is rewritten. The flash segment is the smallest and the flashblock the largest unit of read, whereas the flash segment is the unit of write; using chained
168

IO, the DBMS, however, can write 1<i≤k flash segments into a block at a time. Note,whenever a flash segment is written in-place, wear leveling [1] automatically allocates anew flash block and moves to it all segments from the old flash block together with theupdated segment (keeping an existing cluster property). Restricted write endurance, re-ferring to the maximum possible erase cycles—between 100,000 (older references) and5,000,000 (most recent references)—, would contradict general server usage. However,plenty of mapping tricks are provided [16] or it even seems to be a non-problem2.
2.1 Read/Write Models
Disks are devices enabling fast sequential block reads and, at the same time, equally fastwrites, whereas random block read/writes are much slower (requiring substantial “me-chanical time”). The block size can be configured to the needs of the DBMS applicationwith page sizes typically ranging between 4 KB and 64 KB. To hide the access gap be-tween memory and disk, a DBMS manages a large DB cache in memory (RAM) whereeach cache frame keeps a DB page which, in turn, is mapped to a disk block. In mostDBMSs, page propagation uses update-in-place applying WAL [8].
2.2 Flash vs Disk Performance
In the literature, there is a unanimous agreement on the following facts [4, 6, 15]: Disksare excellent sequential stores, whereas random access is only improving for larger pagesizes. On the other hand, flash offers generally better sequential/random read (SR/RR) andcomparable sequential write (SW), but terrible random write (RW) performance:
• SR and SW having a bandwidth of more than 60 MBps for page sizes≤ 128 KB aresuperior, but remain comparable to those on fast disks.
• RR is spectacularly faster for typical DB page sizes (4–32 KB) by a factor of 10–15(≥3000 to <200 IOps).
• RW performs worst with∼50 IOps, opening a huge advantage for RR, and is slowerby a factor of 2–4 compared to disks (for the page size range considered).
Technology forecast is even more optimistic: J. Gray [7] claimed a flash read band-width of up to 5000 random reads per second or an equivalent of ∼ 200 μsec per 8KBpage. Furthermore, an internal Microsoft report [6] predicts that about 1,100 random 8KBwrites per second seem possible with some flash disk re-engineering.
This picture is complemented by the energy consumption: The power needed to drivea flash read/write is ∼ 0.9 Watt (in our case) and, hence, by a factor of >15 lower thanfor a disk. Using the figures for IOps, we can compute IOps/Watt as another indicator forenergy-saving potential. Hence, 3,100 flash-reads or 55 flash-writes can be achieved perWatt, whereas a disk only reaches 13 operations per Watt ([6], [18]).
2A worst-case thought experiment [14] with repetitive sequential block overwrites on a flash indicates that 51years are needed to reach the wear leveling limit.
169

For more than a decade, NAND flash chips doubled their densities each year and cur-rently provide 64 Gbit. This growth will continue or accelerate such that 256 GB per chipare available in 2012 [13]. Because several of these chips can be packaged as a “disk”, weshould be prepared for flash drives with a capacity of several Terabytes in this near future.Of course, flash is still quite expensive. A GB of a flash device amounts to >3$ (but only<0.2$ for disk), but technology forecast predicts rapid market growth for it and, in turn, adramatic decrease in the near future that it will roughly reach the disk3 [5, 15].
3 Device-Related IO Performance
In contrast to impressive flash behavior, performance gains to be anticipated when integrat-ing flash devices into a DBMS are not easy to obtain. After a long period of experimentsunder DBMS control—painful because of results which could not be interpreted at all—,we started from the scratch to explore step-by-step the influences of built-in optimizationmechanisms in the IO paths of blocks read from or written to external storage.
3.1 Historical Note
40 years ago, timings of disk access from the file interface was more or less (very closeto) those of raw-disk access, because all block transfers from the plain disk were directlydone via a channel to some address space in RAM. There was no disk cache available andfurther abstractions (such as file buffers) achieved by the OS file system were not present.Therefore, it was rather simple to compute disk access times for various kinds of blocktransfers. Technology, device, and usage parameters, provided by the disk manufacturer,were sufficient to calculate for given access requests the expected block access times. Forthis purpose, the disk access time td of a block of size b, where x specified the number ofcylinders to be crossed from the current access arm position to the cylinder carrying theblock requested, was computed by
td(x,b) = tSIO+ ts(x)+ tr + ttr(b).
Here, tSIO is typically in the range of μsec and stands for the CPU overhead (OS supervisorcall, device activation, etc.) until device-related activities can begin. The lion share of theaccess time was the disk seek time (access motion time) ts(x), which was specified by themanufacturer as a non-linear increasing function. Furthermore, the rotational delay andthe data transfer were captured by the remaining variables.
To obtain a sufficiently accurate approximation, tSIO could be skipped in practicalcases. Moreover, the calculation of ts(x) can be facilitated by approximating the course ofthe seek time using linearization in sections. The specific distances x (for sequences of con-secutive requests) could be derived from the file-to-cylinder allocation and the applicationrequests. To enable access time calculation for a particular sequentially allocated file, cer-tain device constants are given for each disk type: tsmin (for x = 1) and tsmax (for x = Ndev).
3We observed for a 64GB flash a dramatic reduction of ∼ 70% within 90 days down to ∼ 3.5 $/GB, whereasa 750 GB SATA only reached ∼ 7%/GB down to ∼ 0.15 $/GB.
170

tsavg(x) assumes random access to blocks uniformly distributed over N consecutive cylin-ders of the device for which x = N/3 is obtained as the average distance. The expectedrotational delay tr was half a revolution (trev/2) of the disk platter. And, finally, the disktransfer rate Fd was dependent on the track capacity Tcap in KB (and, in turn, bit density)and revolution speed (e.g., R = 7,200 rpm), which resulted in ttr = b/(Tcap ∗R) = b/Fd secfor a block size of b in KB. An often used approximation formula [9] for td was
td(x,b)≈ tsavg(x)+ tr +b/Fd .
Because the avg. travel distance of the disk arm is hard (or even impossible) to deter-mine in a multi-user environment, the avg. seek value—specified as tsavg = ts(Ndev/3) bythe manufacturer—was used instead. Hence,
td(b)≈ tsavg + trev/2+b/Fd
where besides the application-specific variable b only device characteristics occur.4
3.2 Device-related Experiments
Today, such simple access scenarios do not exist anymore for disks, because many opti-mization features were added along the IO path from disk to the application address spacein RAM. A typical mechanism at the disk level is the existence of a (RAM) cache—inour case 8 MB—which cannot be controlled by the application. In fact, depending on thecurrent workload, it automatically adjusts the sizes reserved for read and write caching.
Flash memory is now available for more than 20 years. So far, it was not consideredas a serious competitor for the disk because of size and cost. However, these aspects havedramatically changed in recent years. Because flash consists of electronic memory, “me-chanical movements” do not stretch the device access times, which are therefore muchsimpler to calculate. Furthermore, a flash is not equipped with a volatile cache, whichwould speed-up IO while significantly consuming more energy due to the permanent re-fresh cycles. However, the caching and prefetching options for the OS file system remainthe same as for disks. Hence, if we could minimize the file caching effects as far as pos-sible, we should be able to approximate raw-flash timings in a controlled measurementexperiment. Because “mechanical time” is not present, when a block is read, flash accesstime t f (b) for a block of size b (b given in KB and independent of its location) can beapproximated by
t f (b)≈ tSIO+b/Ff
where tSIO is roughly the same as for disks. But, it cannot be neglected here because of itsrelative magnitude compared to the data transfer time b/Ff from the flash device.
To gain a deeper and more complete comparative picture of flash and magnetic disk, weperformed dedicated throughput tests. While sequential read/write performance of flash
4For example, disk IBM 3330 rotating at 3,600 rpm was characterized by tsavg = 30 ms, trev = 16.7 ms andtrack capacity of 13 KB, resulting in Fd = 690 KB/sec, which enabled the calculation of the avg. block accesstime with sufficient precision, e.g., ∼ 43.9 ms for a 4KB block.
171

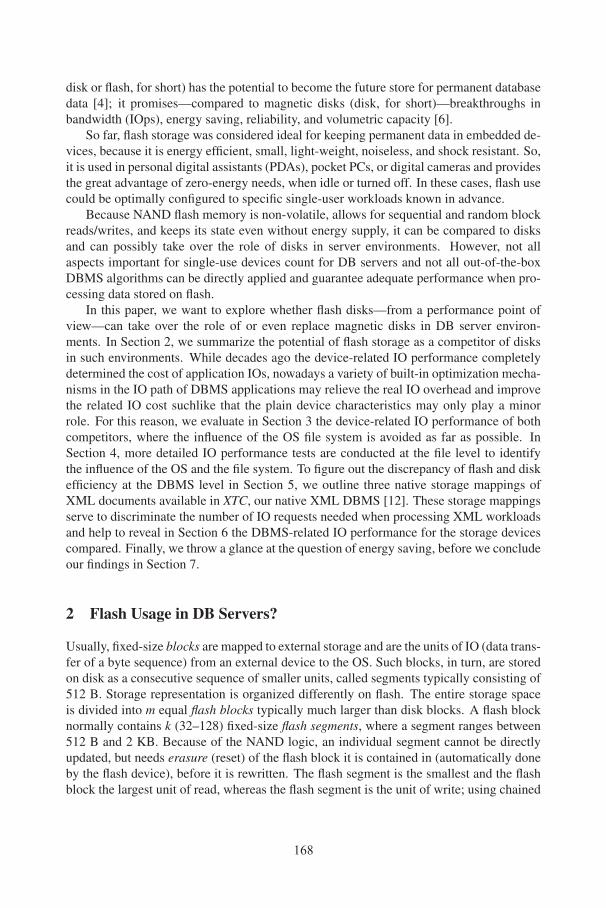
Figure 1: Flash and disk throughput for random reads/writes
and disk is comparable, we focused on random read/write operations at the device levelwhere flash promises the biggest gain for reads, but also the strongest penalty for writes.
Figure 1 summarizes the throughput results (MB/s) of our tests at the LINUX fileinterface (using iozone5), where the OS caching effects were eliminated (to the extentpossible) and no buffer pool was explicitly allocated. We varied the file size from 128 MBto 2 GB and the block size as the unit of access from 4 KB to 256 KB. All experimentsstarted with a cold RAM and cold disk cache. In all cases, dividing the file size by the blocksize delivered a range of integers where random numbers for block reads/writes were takenfrom. The number of accesses were computed by file size/block size which guaranteedthat (almost) the entire file content was fetched to or written from RAM. Our performancefigures are gained for mid-range devices (SSD [21] and SATA 7,200 rpm). Although manydesign parameters can be optimized [6], the relative IO performance characteristics to beanticipated from both device types remain stable and are also valid for high-end devices.Therefore, the results contained in Figure 1 and the cross-comparisons can be consideredindicative for the device-related throughput performance.
Referring to the measured results for flash random read in Figure 1, we can derive thevalues for the system-specific tSIO and the device-specific Ff (65 MB/sec sequential readrate) to obtain an analytic approximation by
t f (b)≈ (230+b/0.065)μsec.
Hence, a 4KB block can be read from flash in < 300 μsec whereas read/write access todisk needs td < 10 ms for a 4KB block. Here this is due to the ratio of file size (≤ 2 GB)and disk size (80 GB) where frequent track-to-track seeks accounted only for 2 ms and anavg. latency of 4.2 ms.6 As expected, a flash write with 4 KB costs ≥ 20 ms.
5http://www.iozone.org6An experiment with 80GB file size would consume tsavg = 15 ms for the disk and result in td ≈ 20 ms.
172

While the overall IO performance of flash and plain disk confirm our statements inSection 2 and correspond to our expectations, closer inspection of Figure 1, however, re-veals that, even for the device-related IO performance, cross-comparison and performanceassessment in detail is not that easy. For example, the slight decrease of the read through-put for both device types with growing file size is not obvious. This effect is caused by theindirect addressing which provokes some additional block transfers for address informa-tion (see Section 4). Furthermore, larger files imply longer arm movements for the disk,however, in our case, to very limited degree.
The access behavior of disks with on-drive cache may substantially deviate from theplain case. Because we started with cold caches, random read could not profit. But,sequential write or random write throughput could be considerably improved, becauseblocks are buffered in the 8MB cache and asynchronously propagated to disk. Althoughwe did not explicitly measure sequential IO performance, it is approached for random read(∼ 65 MB/s) and random write (∼ 10 MB/s) on flash using large block sizes (e.g., 256KB). As per device specification, sequential read/write disk IO delivers ∼ 60 MB/s.
4 File-System-Related IO Performance
The file system embodies a major part of the IO path and presents a substantial deviationwhen application programs such as a DBMS invoke IO requests. Thus, a certain over-head and fuzziness—as far as interpretation of the IO cost is concerned—is induced by theoptimization options of the OS kernel (i.e., IO clustering, prefetching, and kernel-relatedcaches). To assess flash and disk access, we need to figure out how the additional abstrac-tion level of the file system affects reachability and appearance of the underlying storagedevice for the program. Therefore, we try to disclose the cache hierarchy thread.
All our benchmarks and experiments were performed on an AMD Athlon X2 4450e(2.3 GHz, 1MB L2 cache) processor using 1 GB of main memory (RAM) and a separatedisk for the operating system. As hard disk, we use a WD800AAJS (Western Digital)having an 8MB Cache, NCQ, and 7,200 rpm. The flash device is a DuraDrive AT series(SuperTalent) having a capacity of 32 GB. The operating system is a minimal Ubuntu 8.04installation using kernel version 2.6.24 and the Java Virtual Machine is version 1.6.0_06.
Because all layers in the cache hierarchy have well-known interfaces, they may beseparately substituted, but normally they are not elided. Figure 2 illustrates the OS- anddevice-controlled caches. As described in Section 3.2, disks benefit from integrated cachesin case of sequential reads/writes or random writes, as opposed to flash devices whichdo not have such a cache. At the lower OS kernel interface, a kernel cache is allocatedthat allows for buffering entire blocks (as delivered by the device) using an LRU-basedpropagation strategy. It is automatically resized depending on available main memory.Cache filling is optimized for sequential accesses by prefetching. In the layer above, avirtual file system (VFS) maintains several caches for inodes, directories, and (application-formatted) pages. As these caches are solely controlled by the kernel, flushing them is theonly functionality provided for the application. Typically, page cache and kernel cachehold actual, but not explicitly and currently requested data in RAM. In contrast, the inodecache and directory cache speed-up file resolution, block addressing, and navigation.
173

4.1 Caching Hierarchy
.*'% %$#"!.==:
74'240 -*-+4
='$(4'
&A?
$<4< 9631
/2,%4 -*-+4
=$'4-),'C -*-+4
B#4' 04(40
74'240 04(40
@>>0$-*)$,2
A0*#+ %$#" !??=:
?),'*;4 %4($-4
=4($-4-*-+4
8*;4 *--4##
50,-" *--4##
8*;4 -*-+4
Figure 2: Caching hierarchy
At the OS level, room for file caching maybe reserved in such a way that all RAM cur-rently not needed by the OS and the appli-cations is used for caching block reads andwrites. The file system may use this cache toprefetch blocks from disk in a way not visibleand controllable by the applications. This kindof prefetching is often heuristically performeddepending on the locality or sequentiality ofcurrent block accesses to disk. For example,Linux offers the following options:
• The first file access conservatively decides on prefetching. Only when the first blockis read, sequential access is anticipated and some minimal prefetching takes place.
• Synchronous prefetching can be enabled to lower seek costs for larger reads.
• Read access pattern recognition may dynamically trigger synchronous and/or asyn-chronous prefetching.
To enable greater flexibility, storage access optimization is further separated into raw-block caching and file-structure caching (for inodes, indirect block references, etc.). More-over, some access options (direct, sync) are provided at the file system interface. However,not all OS versions (in our case Linux) observe such application directives, e.g., even if theraw-disk option is enforced, the OS does not respond to it. As a result, great indeterminismmay be caused for all kinds of disk IO timings in real application environments.
4.2 File Structure Mapping
In Linux systems, the dominating file systems are EXT2 and its journal-enabled versionEXT3, respectively. EXT2/3 divides the disk partitions in equal-length groups containingdescriptors and bitmaps for inodes and block allocation. An inode is a special data struc-ture describing a file’s size, length, block allocation, etc. Because an inode only references12 data blocks directly, the remaining data blocks for files larger than 12 blocks need tobe referenced indirectly. This indirection of one, two, or even three levels can lead to anoverhead of one-tenth of a percent for large files. Certain access patterns may suffer fromsuch “long” block reads when several indirect block references have to be resolved before.
4.3 File/Device Caching Effects
Prior work in [3] has shown that caching effects may closely interfere with the kernel’sprefetching and replacement strategy. In all our experiments, we used the default LRUreplacement and the default prefetching of the Linux kernel, because we want to compare
174
(a) Random read, cold buffer
3@ 2/ ,@: @52 5,@ ,'@/@'/:
,
,'
,''
,'''
,''''"%#9
1+$#4
&%+; #%); .0!(
0!*#/-! ?+>=9 <;$8#
(b) Hot buffer effect
(c) Random write, async
3@ 2/ ,@: @52 5,@ ,'@/ @'/:
'
'),
')@
')3
')/
')5
+2"1
,*-"(
.2*6 "2$6 /!'5
!'#"/4' 3*&01 %7266"
(d) Sync effect
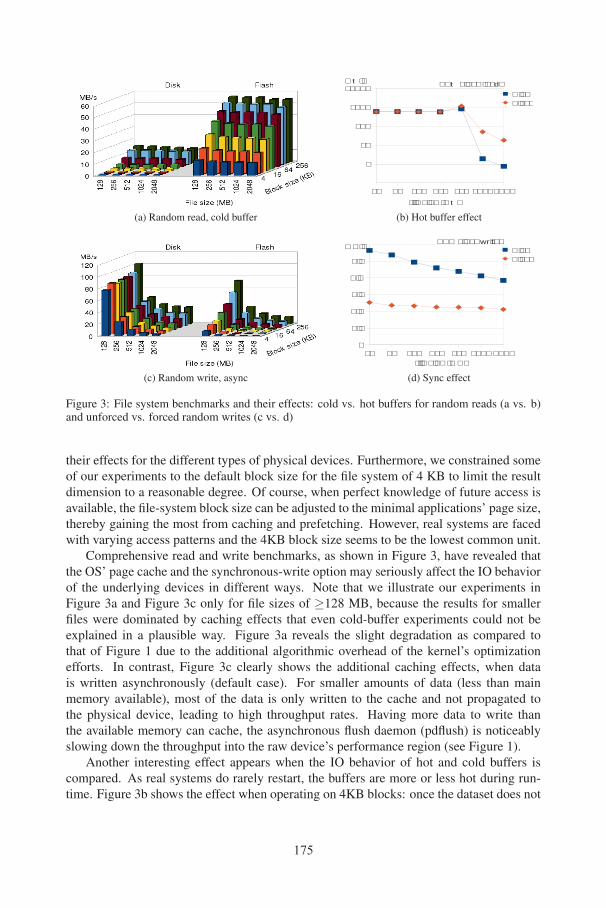
Figure 3: File system benchmarks and their effects: cold vs. hot buffers for random reads (a vs. b)and unforced vs. forced random writes (c vs. d)
their effects for the different types of physical devices. Furthermore, we constrained someof our experiments to the default block size for the file system of 4 KB to limit the resultdimension to a reasonable degree. Of course, when perfect knowledge of future access isavailable, the file-system block size can be adjusted to the minimal applications’ page size,thereby gaining the most from caching and prefetching. However, real systems are facedwith varying access patterns and the 4KB block size seems to be the lowest common unit.
Comprehensive read and write benchmarks, as shown in Figure 3, have revealed thatthe OS’ page cache and the synchronous-write option may seriously affect the IO behaviorof the underlying devices in different ways. Note that we illustrate our experiments inFigure 3a and Figure 3c only for file sizes of ≥128 MB, because the results for smallerfiles were dominated by caching effects that even cold-buffer experiments could not beexplained in a plausible way. Figure 3a reveals the slight degradation as compared tothat of Figure 1 due to the additional algorithmic overhead of the kernel’s optimizationefforts. In contrast, Figure 3c clearly shows the additional caching effects, when datais written asynchronously (default case). For smaller amounts of data (less than mainmemory available), most of the data is only written to the cache and not propagated tothe physical device, leading to high throughput rates. Having more data to write thanthe available memory can cache, the asynchronous flush daemon (pdflush) is noticeablyslowing down the throughput into the raw device’s performance region (see Figure 1).
Another interesting effect appears when the IO behavior of hot and cold buffers iscompared. As real systems do rarely restart, the buffers are more or less hot during run-time. Figure 3b shows the effect when operating on 4KB blocks: once the dataset does not
175

fit into main memory, the throughput drastically drops to the cold buffer rates. It furtherreveals that the throughput for small datasets is completely decoupled from the underlyingstorage, because the disk and flash throughput rates are equal up to a file size of 512 MB.
Because our primary application is database-based, the distinction between synchronousand asynchronous write is essential. The default file system behavior, shown in Figure 3c,does not enforce immediate write propagation at all. When using the sync flag or callingthe system function sync—mandatory for some specific writes within transactions to guar-antee the ACID paradigm—substantial throughput reduction has to be taken into account(compare Figure 3d and Figure 3c for 4KB block writes). Figure 3d shows for 4KB blockwrites that the throughput rates are independent of the file size. The slight decrease isexplained by the file structure overhead discussed in Section 4.2 and the additional seekoverhead for large files in case of a disk.
The simple and often constant throughput rates of the raw devices are markedly af-fected by the file system and the kernel’s caching efforts. Thus, an application (i.e., ourdatabase) needs to be aware of that when using access paths or building cost models.
4.4 Non-influenceable Caches and Other Magics
Keeping instructions and data close to the CPU(s) in the processor caches can significantlychange the anticipated IO behavior. Whenever physical access is not needed at all, certainOS-internal optimizations are effective to improve (or at least to influence) the read/writethroughput. In some situations, where definitely no physical IO occurred anymore, readthroughput reached an extraordinary level. In Figure 3b, it is up to three orders of magni-tude (∼ 600 MB/s) higher for file sizes less than the available main memory. A peak (of≥1000 MB/s) occurs in this measurement series when processing a file of 512 MB, beforethe throughput dramatically decreases. For this “magic” behavior which is independent ofthe flash/disk distinction, we found the following explanations:
• The CPU has small, but really fast processor caches (so-called L1 and L2). Theytypically range from KBs to several MBs, enough to keep frequently referenceddata (sometimes entire files) as close to the CPU as possible avoiding MMU and IOaccess. Unfortunately, parallel processes on multiple cores or operating on GB-sizeddata volumes cannot exploit it.
• In the identified peak situation, the kernel cache does not need to be accessed any-more, because the requested pages reside in the page cache and the processor caches.In particular, the processor caches have reached a state where at least the addressinginformation is steadily available, which may explain why the throughput is almostdoubling, although already at a high level.
• Cached entries (pages, blocks) have a state (e.g., clean, locked, dirty) and can beaccessed in isolation or shared among several processes. Different states involvedifferent access control operations leading to more or less computational overhead.
There are further “peculiar” situations which affect pure throughput tests. However, deal-ing with large files or data volumes (i.e., much larger than the available main memory—typically several GB or TB nowadays), all of them are nearly smoothed to negligibility.
176
5 IO-Relevant DBMS Processing Concepts
The IO characteristics of flash indicate that disk-based DB performance cannot be ob-tained in an easy way, not to mention by simple replacement. Substantial bandwidth gainsare possible for random reads, while random writes are problematic and have to be algo-rithmically addressed at the DBMS side. If frequent writes are necessary, the adjustmentof (logical) DB pages to the device’s block sizes may relieve the performance bottleneck.In mixed read/write workloads, write caching will play a major role to realize write avoid-ance. Further, the potential of sequential writes should be consequently exploited. Hence,DBMS processing should be adapted such that the drawbacks are avoided and, at the sametime, the strengths of flash are used to full capacity.
5.1 Prime Optimization Principles
In several respects, performance and energy efficiency in DBMSs are not conflicting de-sign goals and should be jointly approached, where appropriate. It is always a good idea tooptimize at a logical or algorithmic level and not to purely rely on device-based improve-ments. When using external storage, the most important design principles are:
• Design compact and fine-grained storage structures to minimize IO for allocating,fetching, and rewriting DB objects.
• Use processing concepts which maximize memory-resident operations and min-imize random read/write access to external storage—in particular, avoid randomwrites to flash to the extent possible.
We discuss these principles for native XML DBMSs and outline various XML stor-age structures, which help to reveal critical aspects of DBMS-related IO performance. Ingeneral, saving IO is the major key to performance improvements and, in turn, energy ef-ficiency in DBMSs. Thus, both goals are approached by using compact storage formats,because plain XML documents contain substantial redundancy in the structure part, i.e.,the inner nodes and paths of the document tree (see Figure 4a)7. However, the tree structureshould be preserved to support fine-grained document processing. Despite IO minimiza-tion, storage mapping should be flexible enough to enable dynamic modifications.
5.2 Structure Encodings
Natively storing XML documents requires identification of the resulting tree nodes, i.e.,the assignment of node labels. Because performance, flexibility, and effectivity of manyXDBMS-internal operations critically depend on them, the appropriate label scheme de-sign is a key issue for the system implementation. Early implementations, primarily op-timizing static XML documents, mostly voted for range-based labeling schemes. They
7The Computer Science Index dblp currently contains almost 106 instances for path class /bib/paper/authorand even more for element name author.
177

bib
publication
book
year id type title author
book
1.3.3.1 1.3.3.3 1.3.3.5 1.3.3.7
1.3.5
1
1.3
1.3.3
1.3.3.9
19941.3.3.1.3
11.3.3.3.3
xy1.3.3.5.3
TCP/IP1.3.3.7.3
. . .
. . .
author1.3.3.11
price1.3.3.13
bib
publication
book
year id type title author price4 5 6 7 9
PCRs 1
2
3
8
a) b)
Figure 4: Labeled document (DOM tree) and its path synopsis
provide satisfactory query evaluation support: all axis relationships can be directly de-cided by comparing node labels. However, dynamic insertion of subtrees would cause arelabeling of the document (or a fraction of it) triggering a bulk IO operation. Moreover,they fail to provide the ancestor IDs when the ID of the context node is known, which ismost important for setting intention locks when fine-grained multi-granularity locking isapplied [12]. But, prefix-based labeling, derived from the concept of DeweyIDs, remainsstable also in dynamic documents and enables all operations mentioned without documentaccess—only by checking node labels [11]. Such labels as shown in Figure 4a support alloptimization principles; we denote them SPLIDs (Stable Path Labeling IDentifiers).
A path synopsis represents equal path instances, i.e., those having the same sequenceof element and/or attribute nodes, in an XML document only once as a so-called path class.PCRs (path class references) are added to the nodes of the path synopsis to identify thepath classes, as illustrated in Figure 4b for a cut-out of the dblp document [17]. Typically,a small memory-resident data structure is sufficient to it during XML processing.
5.3 Structure Virtualization and Storage Mappings
Because of the typically huge repetition of element and attribute names, getting rid ofthe structure part in a lossless way helps to drastically save storage space and, in turn,document IO. As a consequence, log space and log IO may be greatly reduced, too. Thecombined use of SPLIDs as node labels and a path synopsis makes it possible to virtualizethe entire structure part and to reconstruct it or selected paths completely on demand.When, e.g., SPLID=1.3.3.5.3 together with PCR=7 is delivered as a reference (e.g., froman index) for value TCP/IP, the entire path instance together with the individual labels ofthe ancestor nodes can be built: bib/publication/book/title.
B*-trees—made up by the document index and document container—and SPLIDs arethe most valuable features of physical XML representation. B*-trees enable logarithmicaccess time under arbitrary scalability and their split mechanism takes care of storage man-agement and dynamic reorganization. As illustrated in Figure 5, we provide an implemen-tation based on B*-trees which cares about structural balancing and which maintains thenodes stored in variable-length format (SPLID+element/attribute (dark&white boxes) orSPLID+value (dark&grey boxes)) in document order. In the following, this XML storagemapping is denoted as full document representation.
178

1.3.3.13.3
1 bib 1.3
1.3.3.3type1.3.3.5
title1.3.3.7. . .
author1.3.3.11 author
price1.3.5
. . .. . .
. . .
1.3.3.7.3 1.9
1 1.3.3.9 1.9.1 . . .
elem.&attrib.content(uncompr.) SPLIDs
Documentindex
Document container
publicationyear 1.3.3.1.3id 1.3.3.3.3
1.3.3.9
book. . .
1.3.3book 1.3.3.1
1.3.3.7.3
1.3.3.13
1.3.5.9.3TCP/IP
19941
65.95
Figure 5: Storage mapping to a B*-tree
As signified in Figure 4a, a SPLIDis composed of so-called divisions andits length is dependent on the positionof the corresponding node in the docu-ment. The value of a division identify-ing a node at the given level increaseswith the breadth of the document treeand, because it is inherited to the SPLIDsof all descendants, it affects the relateddescendent SPLIDs at all lower docu-ment levels. Although we use efficient Huffman encodings for the division values [11],they may reach substantial lengths in large documents. Note, the TPoX documents [19]consist of several million subtrees rooted at the second level in our 10GB experiments.Because the nodes in all storage mappings occur in document order (see Figure 5), theirlabels lend itself to prefix compression. Therefore, quite some storage space per documentcan be saved on external devices. On each page of the document container, only the firstSPLID is completely stored. By storing the difference to the preceding SPLID and encod-ing the length of the SPLID prefix (in terms of divisions), which can be derived from thesequence of preceding node labels in a page, we obtain an effective compression mech-anism (e.g., instead of storing 1.3.3.7.3, the encoded difference to the previous SPLID isenough). As a result, we gain the prefix-compressed (pc) storage mapping where in caseof dense labels the avg. size needed for SPLID storage is reduced to ∼ 20–30 % [10].
A virtualized structure only stores content (leaf) nodes in the container pages whereeach node is made up of a prefix-compressed SPLID, the PCR, and the text value. Hence,when storing or reconstructing the entire document or when accessing an individual root-to-leaf path, even more IO is saved as compared to the pc storage representation. Wedenote this kind of mapping as elementless XML storage mapping (eless for short).
In the following, we use all three storage mappings of XML documents in comparativemeasurements.8 We applied the TPoX tools [19] to generate the various documents in theexternal text format, called the plain format, from which the differing storage mappingswere created. To assess their storage effectivity, we cannot refer to absolute numbers,because the sizes of our sample documents vary from 10 MB to 10 GB. Therefore, wehave normalized the space figures w.r.t. to plain (100%). Hence, the storage footprintsof full, pc, and eless obtained quite some reduction and reached ∼ 95 %, ∼ 70 %, and∼ 65 %, respectively; these figures directly characterize the IO saving when storing orreconstructing the entire document.
To later enable interpretion of query evaluation, we summarize in Table 1 the storagespace needed for the TPoX-generated plain documents9 when mapped to the full storagerepresentation. For the corresponding footprints of pc and eless, we obtained roughly 75%and 70% of the pages numbers given. In particular, the growing sets of index pages and,in turn, the increasing heights of the document index hdocind , which together imply lessbuffer locality in our benchmarks, will affect the scalability results.
8Here, we do not consider content compression. It would further decrease IO overhead, but increase CPUtime for additional compression/decompression tasks.
9We adjusted the TPoX generation parameters to roughly obtain plain documents of the given sizes.
179

Table 1: Footprints for full storage mapping of the TPoX documents.
Documents Number of index / container pages (4 KB) [index height]10 MB 100 MB 1 GB 10 GB
customer 7 / 967 [2] 78 / 9,317 [2] 964 / 121,026 [3] 10,794 / 1,219,099 [3]order 7 / 871 [2] 87 / 10,650 [2] 728 / 101,641 [3] 9,501 / 1,118,463 [3]
security 7 / 982 [2] 85 / 10,493 [2] 220 / 40,385 [3] 3,382 / 407,604 [3]
6 DBMS-Related IO Performance
The flash characteristics highlighted in Section 2 promise quite some gain in performanceand energy saving when considered in isolation. The interesting question is whether andto what degree their potential can be exploited in an XDBMS context? Furthermore, howcan the optimization principles (see Section 5.1) assist our objectives?
A recent contribution [2] made us aware that “it is amazingly easy to get meaninglessresults when measuring a flash device because of the non-uniform nature of writes” even atthe device level. For the interpretation of DBMS-related measurements, we have to copewith indeterminism provoked by uncontrollable OS caching and influence of DBMS bufferlocality (which together fooled our initial complex measurements for quite some time).Therefore, we designed simple experiments which enabled meaningful result interpreta-tion in the first place. Of course, they should reveal some (not all) important performancedifferences of flash- vs. disk-based DB systems.
To get an initial answer, we used XTC and implemented—by varying our options con-cerning external storage (disk and flash) and document representation (unoptimized (full),prefix-compressed (pc), and elementless, i.e., virtualized (eless))—six configurations of it.Furthermore, we designed a simple benchmark consisting of reader and writer transactionsand ran it in single-user mode. Because we are solely interested in the relative performancebehavior of the workload on the different system configurations, the processing details forthe documents and transactions are only roughly sketched.
6.1 Workload Description
The performance analysis at the DB level is based on the well-known TPoX [22] bench-mark to achieve a mixture of random/sequential access and a varying data distribution.Because most of the TPoX queries are quite complex and their detailed analysis would gobeyond the scope of this paper, we chose the following queries supporting our objectives:
RQ1 report an account summary RQ5 search for a specific securityRQ2 resolve a customer WQ1 create a new accountRQ3 return a security price value WQ2 place an orderRQ4 return an order WQ3 update a price value
The RQ* queries are read-only and the WQ* queries include a share of updates orinserts. To reflect the indeterminism of real environments, all queries are supplied with
180

random parameters. By changing the weights of the queries, the share of the write load forthe benchmarks is scaled from 10 % to 30 %.
Each benchmark run accesses the three XML documents customer, order, and secu-rity with almost uniform frequency. In all cases, a query selects some random target ina document with a given SPLID delivered from an element index—the only additionalindex used for these benchmarks. After having traversed the document index and locatedits context node, each query locally navigates in the document (see Figure 5) thereby ac-cessing a number of records. Because the subtrees are small, these operations remain local(restricted to one or two container pages). Hence, the set of queries—each executed as atransaction—causes fine-grained and randomly distributed IOs on the XML database.
A major aspect of our analysis includes scalability properties. Each setup consisted ofseparate databases for the configurations disk/full, disk/pc, disk/eless, flash/full, flash/pc,and flash/eless. Choosing setups with 10 MB to 10 GB for the documents (in plain format),the system behavior is explored across three orders of magnitude. Therefore, the documentfootprint on a storage device (especially affecting the seek times on disk) and, in turn, theheight of the document index considerably affect the length of a traversal path.
To gain some insight into the flash-disk dichotomy, we modeled two different process-ing situations where IO activities resp. complex computations in memory dominate thebenchmark. Thus, we ran each benchmark in two versions. IO-intensive means that queryevaluation query is the main transactional activity and that each transaction is started assoon as the preceding transaction committed. In contrast, in the CPU-intensive version weprolonged each transaction by 50 ms to account for complex main-memory computations.
6.2 Performance Measurements
There are literally infinite combinations of benchmarks, document configurations andother parameters. Here, we cannot provide area-wide and exhaustive empirical perfor-mance measurements. Instead, we intend to present some indicative results which focuson the cross-comparison of the differing configurations. For the different storage mappingsand the considered devices, our measurement settings enable to highlight the influence ofthe OS- and device-related caches, to reveal some scalability aspects, and to figure out theflash benefits under different workload types.
The benchmarked workloads (consisting of 1K and 10K transactions10) were randomlyassembled from the set of pre-defined queries and executed on the four DB sizes (setups).Within each setup consisting of 6 configurations, exactly the same queries were chosen,such that the differences in the IO behavior are only caused by the different storage map-pings and the device type. To account for DB growth, only the query parameters wereadjusted in the different setups to address document paths randomly spread over the entiredocument. While the IO activities on container pages remained rather unaffected by ourscaling measures, the traversals through the document indexes were not. See Table 1 forthe page numbers of the indexes, which determine their heights hdocind .
10Fewer transactions in a benchmark lead to lower tps rates, because they can—only to a lesser extent—takeadvantage of the increasing caching effects caused by index locality. But, on the other hand, their results areaffected by singular and initialization effects. Therefore, such benchmark results are not reported here.
181

0
20
40
60
80
100
disk flash
full
eles
spc
10 MB
full
eles
spc
disk flash100 MB
TPS
disk flash1 GB
disk flash10 GB
Storage mappings: full, prefix-compressed (pc), virtualized (eless) structure
0
4
8
12
16
20
disk flash
full el
ess
pc
10 MB
full el
ess
pc
disk flash100 MB
TPS
disk flash1 GB
disk flash10 GB
IO-intensive workload CPU-intensive workload
Figure 6: Reader transaction throughput (1,000 TAs)
As runtime parameters, we always used 4KB database pages, 4096 4KB buffer framesin XTC, and cold buffers.11 Hence, the results of all read-only benchmarks were gainedwith the same workload (only adjusted to the DB sizes) in the same system environment.
Figure 6 summarizes the results of our empirical experiments for read-only bench-marks running 1K transactions, which behaved in the anticipated way, at least in principle.They confirm that there is a substantial rise in transaction performance (tps from diskto flash configurations (configs). The results of the disk/flash configs@10MB should beexcluded from this comparison, because their differences are strongly overloaded withcaching effects. In this case (see Table 1), all index pages are in the XTC buffer after∼ 20queries, whereas obviously less index locality occurs for larger DB sizes and, for con-figs@10GB, index locality primarily occurs at higher index levels, because not all indexpages reach the buffer during the benchmark runs. On the other hand, longer search pathshave to be traversed, because hdocind grows with the document size, and longer seeks areneeded, because the storage footprint covers a larger disk area.
To illustrate the growing IO overhead, e.g. for full storage mapping, the 1K-transactionbenchmark needed ∼ 1200, ∼ 2400, ∼ 3430, and ∼ 4550 page fetches for the 10MB,100MB, 1GB, and 10GB sizes, respectively. Because the same set of transactions wasexecuted and ≥ (hdocind +1) logical page references were required in each of them, thesenumbers of XTC buffer faults reflect the locality achieved. As particularly visible forthe IO-intensive workload at the tps level, scalability has suffered from the considerablygrowing sets of index pages and, in turn, the increasing index heights (2 ≤ hdocind ≤ 3 inTable 1). However, it affects to a much larger degree disk than flash configurations.
In contrast to the benchmarks with dominating IO-related activities, the CPU-intensiveworkloads only weakly exhibit the overall characteristics, because the IO influence withonly ∼ 15% of total time is almost leveled out. Of course, if hardly any IO is executed ina benchmark, flash cannot play its advantage off against disk.
11The effects of the kernel cache on transaction throughput could not be controlled. We observed that, when a4KB page was requested, frequently a 64KB block was prefetched into the kernel cache.
182

Storage mappings: full, prefix-compressed (pc), virtualized (eless) structure
IO-intensive workload
0
40
80
120
160
200
disk flash
full eles
spc
10 MB
full
eles
spc
disk flash100 MB
TPS
disk flash1 GB
disk flash10 GB
240
0
4
8
12
16
disk flash
full
eles
spc
10 MB
full
eles
spc
disk flash100 MB
TPS
disk flash1 GB
disk flash10 GB
CPU-intensive workload
20
24
Figure 7: Reader transaction throughput (10,000 TAs)
Figure 7 summarizes the results for the benchmarks with 10K transactions, where thecaching effects clearly increase on all setups and the IO-intensive tps rates more thandouble for the 10MB DB on flash as well on disk because of substantial locality on indexand container pages. But also the larger DB sizes up to the configs@10GB are stronglyinfluenced by index locality. While in the 1K-transaction, IO-intensive case the flash tpsrates for configs@100MB and larger are ∼ 150 % – ∼ 200 % higher than for disks, theyare reduced in the respective 10K cases down to ∼ 75 % – ∼ 150 %—a definite examplethat caching may level out the flash performance superiority.
The result representation in Figure 6 and Figure 7 allows for some differential interpre-tations. What are the gross effects of eless and pc as compared to full? The eless mappinghaving the smallest storage footprint (only∼ 70% of full) proved its superiority in terms oftps throughput among the disk cases and among the flash cases. The picture is not so clearwith pc despite a footprint of ∼ 75% of full. This may be caused by the decompressionefforts needed to reconstruct the SPLIDs in the structure part. But, in general, the built-inIO saving of a storage mapping pays off and is, in particular, visible in Figure 7 for theeless flash-configs@100MB and larger. While disk seeks take longer, flash access timesare independent of DB sizes.
To gain some insight into application-level effects of the flash’s “bad” write perfor-mance, we extended our benchmark with writer transactions. Figure 8 illustrates theresults obtained for an increasing write share—again separated for the IO-intensive andCPU-intensive cases. As expected, the flash write performance continuously decreaseswith a growing share of writer transactions. In our experiments, the tps ratio steadilyshrinks with an increasing writer share (from 10% write to 30% write). Comparing themto the read-only 1K transaction, IO-intensive case, the flash tps rates are clearly lower andreach∼ 80 % –∼ 90 % for mix 10 and only∼ 30 % –∼ 35 % for mix 30. The performancegap to the disk closes with a growing writer share as well.
Our experiments definitely reveal the importance of the eless storage mapping—evenmore for write transactions. It enabled the highest tps rates in more or less all flash con-figurations and DB sizes.
183

disk flash10 MB
disk flash100 MB
disk flash1 GB
disk flash10 GB
disk flash10 MB
disk flash100 MB
disk flash1 GB
disk flash10 MB
disk flash100 MB
disk flash1 GB
disk flash10 GB
disk flash10 GB
Storage mappings: full, prefix-compressed (pc), virtualized (eless) structure
0
4
8
12
16
TPS
mix 20 mix 30
IO-intensive workload
mix 10
full el
ess
pcfu
ll eles
spc
20
40
60
80
TPS
mix 20 mix 30
CPU-intensive workload
mix 10
full
eless
pc full ele
sspc
0
Figure 8: Transaction throughput for mixed workloads (1,000 TAs)
6.3 Energy Efficiency
So far, we have shown that at least IO-intensive (read-only) DB applications may sub-stantially improve their transaction throughput when flash devices are used as DB store.To obtain some hints concerning the energy efficiency in our flash/disk comparison, wehave started some initial measurements to figure out the overall energy consumption ofour computer system (including processor, memory, cooling, and separate OS disk) whenrunning with a flash or a disk as DB store. Table 2 summarizes the results of controlled60-minute runs in idle mode and under the CPU-intensive and IO-intensive benchmarkson the 10GB DB (read-only, pc storage mapping).
The relative flash/disk power consumption in idle mode yields Pf = ρ ∗Pd (with ρ∼ 0.96in our case)12. To derive a formula for the same DB work, the runtimes for flash and diskcan be set to t f = (tpsd/tps f ) ∗ td . Hence, we can compute the energy W needed for thesame DB load and obtain W f = Pf ∗ t f = ρ ∗ (tpsd/tps f )∗ td ∗Wd . If we define the flash’senergy efficiency (w.r.t. disk) as E f =Wd/Wf , we are able to pinpoint the essence of our
12Although the power continuously varies between Pmin and Pmax, we simplify our considerations by assumingconstant consumption over time.
184

Table 2: Energy consumption of a computer system with flash and disk database.
Device Workload Throughput Power (Watt) Energy No. of TAstps min max KWh per Joule
Flashidle 0 52.1 55.0 0.053 0
CPU-intensive 12,530 49.5 84.6 0.071 0.176IO-intensive 72,240 48.8 92.8 0.085 0.850
Diskidle 0 53.9 65.0 0.055 0
CPU-intensive 10,470 53.7 87.9 0.063 0.166IO-intensive 22.810 53.7 94.7 0.062 0.368
findings summarized in Table 2. For the IO-intensive case, we yield a surprisingly largefactor E f ≤ 3.3, whereas with E f > 1 (in our case E f @ 1.25) only moderate improve-ments can be gained for CPU-intensive cases.
In general, there are several possibilities to specify “efficiency”, and a well-suited def-inition seems the (application-specific) #TAs/Joule ratio of a system (see Table 2). Asshown in this paper, the plain IO characteristics cannot serve to choose a device for anapplication-level use case. Hence, the #TAs/Joule ratio should be addressed when thinkingabout efficiency. Here, flash devices have selectively shown their superiority over tradi-tional disk storage.
7 Conclusions
The DB community will be confronted in the near future with the use of flash storage notonly in embedded devices, e.g., PDAs, because it is energy efficient, small, light-weight,noiseless, and shock resistant. Expected breakthroughs in bandwidth (IO/s), energy sav-ing, reliability, and volumetric capacity, will certainly shift this technology into high-endDB server environments. If data volumes in enterprises further grow (to the PB range), itszero-energy needs—when idle or turned off—will become a strong sales argument.
From this perspective, we started to explore the integration of flash storage into databases.We delivered a kind of “existence proof” for simple use cases where “flash beats the disk”.There are definitely (read-only) scenarios where substantial performance gains and, at thesame time, energy savings can be achieved. For write scenarios—as expected—, algorith-mic adjustments are necessary in various DBMS components, in particular, in the areas ofcache management and logging. But we could show for the flash that performance can bekept or even improved while energy is saved.
On the other hand, we are just at the beginning of flash-aware improvements in DBMSs.But, we believe that it is not sufficient to just develop new algorithms (e.g., for sort or join[20]) focusing on the device characteristics alone. While probably no general flash supe-riority is possible, there exist specific application areas which could profit from its use.Therefore, our future research will attempt to disclose these potentials and to bring flashtechnology to the core of database management.
185

References
[1] Ban, A.: Wear leveling of static areas in flash memory. US patent, (6732221); Assigned toM-Systems (2004).
[2] Bouganim, L., Jonsson, B., and Bonnet, P.: uFLIP: Understanding Flash IO Patterns. Proc. Int.Conf. on Innovative Data Systems Research (CIDR), Asilomar 2009.
[3] Butt, A. R., Gniady, C., and Hu, Y.C.: The Performance Impact of Kernel Prefetching onBuffer Cache Replacement Algorithms. Proc. SIGMETRICS Conf., 157–168 (2005).
[4] Graefe, G.: Database Servers Tailored to Improve Energy Efficiency. Proc. Int. Workshop onSoftware Engineering for Tailor-made Data Management, 24–28, Nantes, France (2008).
[5] Graefe, G.: The Five-minute Rule: 20 Years Later and How Flash Memory Changes the Rules.Proc. Third Int. Workshop on Data Management on New Hardware (DaMoN), Beijing, China(2007).
[6] Gray, J., and Fitzgerald, B.: FLASH Disk Opportunity for Server-Applications. http://research.microsoft.com/~Gray/papers/FlashDiskPublic.doc (Jan. 2007).
[7] Gray, J.: Tape is Dead, Disk is Tape, Flash is Disk, RAM Locality is King, powerpoint talk,Microsoft, Dec. 2006.
[8] Gray, J. and Reuter, A.: Transaction Processing: Concepts and Techniques. M. KaufmannPublisher (1993).
[9] Härder, T. and Rahm, E.: Database Systems – Concepts and Implementation Techniques (inGerman). 2nd edition, Springer (2001).
[10] Härder, T., Mathis, C., and Schmidt, K. Comparison of Complete and Elementless NativeStorage of XML Documents. Proc. 11th Int. Database Engineering & Applications Sympo-sium (IDEAS), 102–113, Banff, Canada, (2007).
[11] Härder, T., Haustein, M. P., Mathis, C., and Wagner, M.: Node Labeling Schemes for Dy-namic XML Documents Reconsidered. Data&Knowledge Engineering 60:1, 126–149, Else-vier (2007).
[12] Haustein, M. P., and Härder, T. An Efficient Infrastructure for Native Transactional XMLProcessing. Data&Knowledge Engineering 61:3, 500–523, Elsevier (2007).
[13] Hwang, C.: Chip memory to keep doubling annually for 10 year. http://www.korea.net/News/news/LangView.asp?serial_no=20060526020&lang_no=5&part=106 (2006).
[14] Kerekes, Z. (editor of STORAGEsearch.com): SSD Myths and Legends – write endurance.http://www.storagesearch.com/ssdmyths-endurance.html (2007).
[15] Leventhal, A: Flash Storage Today. ACM Queue 6:4, 24–30 (2008).[16] MFT: Managed Flash Technology. http://www.easyco.com/mft/index.htm (2008).[17] Miklau, G.: XML Data Repository. http://www.cs.washington.edu/research/xmldatasets.[18] Nath, S. and Kansal, A.: FlashDB: Dynamic Self-tuning Database for NAND Flash. ftp://ftp.
research.microsoft.com/pub/tr/TR-2006-168.pdf (2007).[19] Nicola, M., Kogan, I., and Schiefer, B.: An XML transaction processing benchmark. Proc.
ACM SIGMOD Conf., 937–948, Beijing, China (2007).[20] Shah, M. A., Harizopoulos, S., Wiener, J. L., and Graefe, G.: Fast Scans and Joins using Flash
Drives. Proc. 4th Int. Workshop on Data Management on New Hardware(DaMoN), 17–24,Vancouver, Canada (2008).
[21] SSD White Paper. http://www.supertalent.com/datasheets/SSD_WHITEPAPER.pdf[22] XML Database Benchmark: Transaction Processing over XML (TPoX). http://tpox.
sourceforge.net/ (January 2007).
186