tornado deaths in the united states - national …nws.noaa.gov/oh/hdsc/technical_papers/tp30.pdfu....
TRANSCRIPT

U. S. DEPARTMENT OF COMMERCE SINCLAIR WEEKS, Secretary
WEATHER BUREAU F. W. REICHELDERFER, Chief
TECHNICAL PAPER NO. 30
Tornado Deaths in the United States
URBAN J. LINEHAN
WASHINGTON, D. C.
March 1957
For sale by the Superintendent of Documents, U. S. Government Printing Office, Washington 25, D. C. • • • • - • • • • • • • • • Price 50 cents

ACKNOWLEDGMENTS
To Dr. S. VanValkenburg, Clark University for helpful criticism; to Mr. John Baldwin and Mrs. Laura V. Wolford of the Office of Climatology, U.S. Weather Bureau for access to unpublished data; to Mr. Chester H. Welden of the American National Red Cross for permission to consult disaster records, and to Mrs. Mildred S. Todd for access to them; to Dr. Morris Tepper of the U. S. Weather Bureau whose suggestion and encouragement led to preparation of this publication.
II

CONTENTS Page
Acknowledgments____________________________________________________________________________________ II
Introduction----------------------------------------------------------------------------------------- 1 Scope and sources of the data______________________________________________________________________ 1 The body of data_________________________________________________________________________________ 2 Reliability of the data __________ --- ________________ --_____________________________________________ 2 Treatment of data________________________________________________________________________________ 3
Chapter I. Temporal distribution of tornado deaths______________________________________________________ 5 Monthly variation in number of deaths_____________________________________________________________ 5
MarchthroughJune__________________________________________________________________________ 5 July through February________________________________________________________________________ 7
Mont.hly shifts in areal distribution of deaths ____ _,--------------------------------------------------- 9 MarchthroughJune__________________________________________________________________________ 9 July through February________________________________________________________________________ 9
Fluctuations and trend in annual tornado-death totals________________________________________________ 10 Hourly distribution of tornado deaths __________________________________ '""'____________________________ 13
Chapter II. Areal distribution of tornado deaths _________ ---_____________________________________________ 15 Areas having few tornado deaths ___ _, ______________ .,.---_____________________________________________ 15 Delimitation of tornado-death regions __________________________________________________________ ""'-___ 16
Regioni----------------------------------------------~----------------------------------------- 17 Tornado-death characteristics of Region L _____ --- _ ____ _ _ __ _ _ __ _ _ ___ _ __ __ _ _ _ _ _ _ _ _ __ _ _ ___ _ __ _ _ ___ 17 Pattern of deaths in Region L ______ .,. ___________ --- _ _ _ _ _ _ _ __ _ _ ___ _ _ _ _ _ __ _ _ _ _ _ _ _ _ _ _ __ _ _ _ _ __ _ _ _ _ _ 18
The largest groups of deaths_______________________________________________________________ 18 The Murphysboro tornado'---- ________________________ ,--___________________________________ 18 The Tupelo and Gainesville tornadoes_______________________________________________________ 19 The Waco disaster________________________________________________________________________ 20 Large death groups in small towns ______________________________________________ _;___________ 20 Large death groups in rural areas___________________________________________________________ 20 Individual deaths and smaller groups_______________________________________________________ 21 A typical areas in Region L _ _ _ _ _ _ _ _ _ _ _ _ _ _ _ _ _ _ _ _ _ _ _ _ _ _ _ _ _ _ _ _ _ _ _ _ _ _ _ _ _ _ _ _ _ _ _ _ _ _ _ _ _ _ _ _ _ _ _ _ _ _ _ _ 21
Region II ________________________________________________ '- _ _ _ _ _ _ _ _ _ _ _ _ _ _ _ _ _ _ _ _ _ _ _ _ _ _ _ _ _ _ _ _ _ _ _ _ _ _ 22
Tornado-death characteristics of Region IL ----------------------------------------------------- 22 Pattern of deaths in Region II_________________________________________________________________ 22
Large groups of deaths____________________________________________________________________ 23 The Flint disaster_ _ _ _ _ _ _ _ _ _ _ _ _ _ _ _ _ _ _ _ _ _ _ _ _ _ _ _ _ _ _ _ _ _ _ _ _ _ _ _ _ _ _ _ _ _ _ _ _ _ _ _ _ _ _ _ _ _ _ _ _ _ _ _ _ _ _ _ _ _ _ _ 23
The St. Louis tornado of 1927-------------------------------------------------------------- 23 The Mattoon tornadO--------------------------------------------------------------------- 23 The Hennepin County, Minn., tornadoes ________________________________________ '--__________ 23
Tornado deaths in peripheral areas ___ -----_________________________________________________________ 24 Regioniii___________________________________________________________________________________ 24
The ~ortheast___________________________________________________________________________ 24
The Southeast--------------------------------------------------------------------------- 24 The Gulf Coast-------------------------------------------------------------------------- 25
Region IV----------------------------------------------------------------------------------- 25 Chapter III. Conclusions______________________________________________________________________________ 27
References--------------------------------------------------------------------------~---------------- 29
III

LIST OF TABLES Page
TABLE I.-Discrepancies between tornado deaths used in this study and previously published Weather Bureau figures for the same years_________________________________________________________________________ 2
TABLE 2.-General summary: Number of tornado-death days and tornado deaths, 1916-53____________________ 5 TABLE 3.-Tornado deaths by seasons, 1916-53_ __ __ _ ___ ___ ___ __ _ __ _ __ __ __ __ __ __ ___ ___ ___ _ _ _ __ _ __ _ __ _ _ __ _ 5 TABLE 4.-Days with 25 or more deaths vs. days with fewer than 25 deaths, by seasons, 1916-53___ ___________ 5 TABLE 5.-Days with 100 or more deaths, by months, 1916-53_ _ _ _ _ ____ _ _ __ _ _ __ _ _ ___ ___ __ _ _ __ __ __ _ _ _ _ _ _ _ _ _ 6 TABLE 6.-Number of tornado deaths on individual days having 100 or more deaths, 1916-53__________________ 6 TABLE 7.-Tornadoes reported in the United States, 1916-53, by months (compiled from official Weather Bureau
figures)----------------------------------------------------------------------------------------- 7 TABLE 8.-Tornado deaths and tornado-death days, by months, 1916-53____________________________________ 7 TABLE 9.-High-total vs. low-total death days, by months, 1916-53---------------------------------------- 8 TABLE 10.-Days in September having 25 or more tornado deaths, 1916-53__________________________________ 8 TABLE 11.-All tornado strikes of record accounting for 25 or more deaths between July 1 and September 21.
(Compiled from official Weather Bureau figures) ___ -------------------------------------------------- 10 TABLE 12.-Tornado deaths, tornado-death days, tornadoes, and tornado days: Annual totals 1916-53. (Tor-
nadoes and tornado days compiled from official Weather Bureau figu~es.)________________________________ 11 TABLE 13.-Number of tornado deaths, number of tornado-death days, and average number of deaths per death
day in high-death-total years vs. low-death-total years, 1916-53________________________________________ 11 TABLE 14.-Tornado deaths and tornado-death days, first 19 years vs. the second 19 years, 1916-53____________ 11 TABLE 15.-Tornado-death strikes, causing 25 or more fatalities in urban areas, 1916-53--------------~-------- 12 TABLE 16.-Tornado deaths, by groups of hours, 1916-53------------------------------------------------- 13 TABLE 17.-Tornado deaths (1916-53), area, and population (1950), by regions_-'---------------------------- 17 TABLE 18.-Tornado deaths (1916-53) per unit area and population (1950)---------------------------------- 17 TABLE 19.-Tornado-death days, average number of deaths per death day, and largest total on any day, by regions,
1916-53-----------------------------------------------------------------------~----------------- 17 TABLE 20.-Counties having 2 or more, 3 or more, 4 or more, and 5 or more tornado-death days, by regions, 1916-53_ 17 TABLE 21.-Tornado deaths in March and April, Regions I and II, 1916-53_ -------------------------------- 18 TABLE 22.-Localized death groupsin Region I consisting of 50 or more persons, 1916-53_____________________ 19 TABLE 23.-Tornado deaths in May and June, Regions I and II, 1916-53----------------------------------- 22 TABLE 24.-Localized death groups in Region II consisting of 25 or more persons, 1916-53 ___________________ . 23 TABLE 25.-Months having greatest concentration of tornado deaths, Gulf Coast section of Region III, 1916-53__ 25
LIST OF FIGURES AND CHARTS Page
FIGURE I.-Tornado deaths and tornado-death days, 1916-53---------------------------------------'------- 7 FIGURE 2.-Tornado deaths by hours (LST), 1916-53------------------------------------------------------ 13 CHART !.-Movement of center of tornado deaths, by months_____________________________________________ 30 CHART 2.-Tornado deaths in January, 1916-53____ _ __ ___ _ __ ________ __ _ _ __ __ __ ___ ___ ______ __ ________ ____ _ 31
CHART 3.-Tornado deaths in February, 1916-53---------------------------.,.------------------·----------- 32 CHART 4.-Tornado deaths in March, 1916-53 ______________________ "'"--- __ __ __ ____ __ __ __ __ ____ ______ ___ _ _ 33
CHART 5.-Tornado deaths in April, 1916-53------------------------------------------------------------- 34 CHART 6.-Tornado deaths in May, 1916-53__ _ ___ __ __ __ ____ __ ____ ___ _ __ ____ ________ __ __ __ _ _ ________ ____ _ 35 CHART 7.-Tornado deaths in June, 1916-53__ __ __ _ _ __ ____ ___ _ ________ _ __ ___ __ __ __ __ _ _ __ ___ ___ ______ __ ___ 36
CHART 8.-Tornado deaths in July, 1916-53------------------------------------------------------------- 37 CHART 9.-Tornado deaths in August, 1916-53----------------------------------------------------------- 38 CHART 10.-Tornado deaths in September, 1916-53-------------------------------,------------------------ 39 CHART 11.-Tornado deaths in October, 1916-53 ______________ .,.- _ ___ _ __ _ ___ _ _ _ __ __ __ _ __ ___ ___ ___ _ ___ __ ___ 40 CHART 12.-Tornado deaths in November, 1916-53 _____ .,. ____________________________________________ -:- ___ 41
CHART 13.-Tornado deaths in December, 1916-53------------------------------------------------------- 42 CHART 14.-Tornado deaths, tornado-death days, tornadoes, and tornado days: annual totals, 1916-53__________ 43 CHART 15.-Tornado deaths: annual and monthly totals, 1916-53__________________________________________ 43 CHART 16.-Tornado deaths in all months, 1916-53------------------------------------------------------- 44 CHART 17.-General areas from which tornado deaths were reported, 1916-53________________________________ 45 CHART 18.-Counties having two or more reported tornado-death days, 1916-53______________________________ 46 CHART 19.-Population map of United States as of 1950--------------------------------------------------- 47 CHART 20.-Tracks of all tornadoes, 1916-50 _________________________________________________________ Facing 48
IV

TORNADO DEATHS IN THE UNITED STATES 1
URBAN J. LINEHAN Catholic University of America, Washington, D. C.
[Manuscript received October 8, 1956]
INTRODUCTION
The purpose of this paper is to analyze and present the temporal and areal distribution of tornado deaths in the United States. It is hoped that such information will be useful to tornado researchers and forecasters, to disaster agencies such as Civil Defense and the Red Cross, to business concerns such as insurance companies, and, more generally, to an increasingly interested and well-informed public.
In examining the results of the . analysis, the reader undoubtedly will discern certain patterns in the hourly, monthly, seasonal, and arealdistributions of tornado-death activity that appa,rently can be explained in terms of an obviously important variable, the temporal and areal changes in atmospheric conditions affecting the number, severity, and distribution of tornadoes. 2 Indeed, al-
though the ultimate cause for the origin and development of these storms is too imperfectly understood at present to attempt a definitive meteorological explanation of the distributions, enough is known concerning the general physical characteristics of tornadoes and concerning general synoptic and dynamic conditions with which they are connected (see for example 3 [1, 6, 10, 12, 19, 21, 26, 27 and 35']) to infer general meteorological explanations. These will be left to the reader, however, as they are beyond the scope of this paper. For the present purpose it suffices to suggest briefly in the following sections a reasoned association of the outstanding contrasts in tornado-death activity with certain features of tornado frequencies and regional factors.
SCOPE AND SOURCES OF THE DATA
Data used cover the 38 years from 1916 to 1953. Thus the investigative period begins with the year the Weather Bureau commenced the systematic recording of tornado statistics; it concludes with the last calendar year for which information was available when the compilation was completed. The resulting span of years is long enough to provide data not only representative of the broader features of tornado-death distribution, but indicative of many details as well.
1 This abridgment and substantial revision of a copyrighted work by Dr. Linehan was prepared by the author for the Weather Bureau. Reproduction in whole or in part, with or without alteration if necessary, is permitted for any purpose of the United States Government and for any scientific purposes.
2 Population becomes a factor of m.rnor significance, however, because of contrasts in population density and arrangement in the chief areas of tornado activity, as they shift from region to region during the year.
1
Basic source of information is the annual tornado summaries con1piled by the vVeather Bureau.4 These summaries not only identify those storms officially recognized as having been deathdealing tornadoes, but they also specify the total number of deaths attributed to each such disturbance.5 In relatively few instances, however, does this source indicate where along the path of
3 Numbers in brackets identify references listed on p. 29. 4 For 1916-1934 .• these summaries are to be found in the ap
propriate Report of .the. Ohief of the Weather Bureau. For 1935-1949, they are published in the pertinent volume of the United States Meteorolog·loal Yearbook. Since 1950 they have appeared in the Annual issue, No. 13, of Climatological Data, National Summary. ·
5 In this study, wherein storm-by-storm death totaJs are essentially the same as those previously compiled by the Weather Bureau, the definition of what constitutes a tornado death is precisely the same, namely, any death caused directly or indirectly by a tornado.

a given storm or at what time of day the individual deaths took place. It has, therefore, been necessary to supplement basic facts in the annual summaries with a very substantial amount of additional detail gathered from numerous official and unofficial sources.
Most important an1ong supplementary sources are other Weather Bureau publications, particu-
larly Climatological Data, by Sections and the Monthly Weather Review. Among unofficial sources, and second only to Climatological Data, by Sections in quantity and quality of information, are reports in regional newspapers. Disaster statistics of the American National Red Cross likewise provide some valuable data, particularly in more recent years.
THE BODY OF DATA
Though no attmnpt has been 1nade to verify and correct storm-by-storm death totals as recorded in the annual summaries, there is a small discrepancy between figures used in this investigation and those previously published by theW eather Bureau for the san1e period of years (table 1) . It will be observed that whereas the net difference is but 1 death, the absolute difference is 139.6 An analysis of these changes reveals that 18 of the 139 consist of death reports believed to have been demonstrably erroneous, and that only the remaining 121 constitute a difference requiring further ex~ planation. Of the latter, 51 were incapable of being located even within the county where they were presumed to have occurred and were, therefore, rejected.7 The other 70 deaths, all of which were added, resulted from use of alternative storm totals larger than those officially adopted pre viously by the vVeather Bureau. In the several cases involved, the alternative total was adopted pri-
TABLE 1.-Discrepancies between tornado deaths used in this study and previously published Weather Bureau figures tor the same years
Percent of preNumber Number vious Weather
Bureau total
Total used herein _____________________ ---------- 8, 742 8, 741
1 139
100.01 100.00
.01 1.59
Previous Weather Bureau totaL _____ ----------Net difference------------------------ ----------Absolute difference ___________________ ----------
Of which the following were: Rejected as erroneous ____________ _ 18 ---------- ----------------Rejected; could not locate ac-
curately enough ___ .----------- 51 ---------- ----------------Additional deaths _______________ _ 70
TotaL-----~------"------------ 139 ---------- ----------------
marily because it facilitated the spot location of deaths.8 It should be emphasized, however, that no such changes were justified merely on the basis of cartographic convenience; it was also essential that data used in· any revision come from a source judged to be reliable, and that the new total itself seem plausible.
RELIABILITY OF THE DATA
Since death totals previously published by the \¥ eather Bureau have been accepted as essentially complete and correct, it is appropriate to examine potential sources of error in their compilation, and to justify use of these storm-by-storm totals in this study. Although at first reflection, the death of a person might seem to be an incontrovertible and easily accountable statistic, it does not necessarily follow that the recording and summation of fatalities can be accomplished with unerring accuracy.
6 The absolute difference is a numerical count of all deaths added to or subtracted from storm totals in the annual summaries.
1 Most deaths, approximately 96 percent of the total, were located with definite reference to some place. Of those remaining, all but about 20 were placed with reference to the known path of a given tornado.
2
For example, some victims die instantly whereas others linger for weeks. Duplication is another problem; the same person may be listed, sometimes in slightly different ways, both from his home town and from the place where he was killed, if not at home. The reconciliation of two overlap-
8 It is worth pointing out that 48 of these 70 additional deaths resulted from use, for the tri-State tornado of March 18, 1925, of an alternative, larger total reported by two Weather Bureau meteorologists, who made an officially-sponsored one-week field investigation of the storm area. This more detailed compilation of fatalities was published by Root and Barron [2·5]. In view of the magnitude of the death total for this storm; more than 700 persons, it would indeed be a remarkable coincidence if either total were precisely correct. Moreover, there is some doubt that the smaller total, compiled by the American National Red Cross, and finally adopted by the Weather Bureau [33], possesses greater accuracy than the total used herein.

ping partial reports can be very unrewarding, and may admit of only an arbitrary decision. Then, too, complete and accurate death counts simply cannot be obtained from some remote areas, a situation especially common in the rural South a generation ago. Moreover, it is only in recent years that it is becoming possible to obtain reliable figures for number of Negroes killed in parts of the South. In the past, reports from these areas too frequently consisted of two lists, a detailed one of white casualties and a lump total or indefinite number for Negroes killed. These, then, are but a few examples of complications that conspire to make some death totals, particularly those involving numerous or widely scattered fatalities, approximations at best.
In spite of these and other potential causes of error, storm-by-storm death totals recorded in the annual tornado summaries published by the Weather Bureau seem to be remarkably complete and correct. The impression of correctness derives from repeated agree1nent between Weather
Bureau totals and those reported by other apparently reliable sources, as revealed in the course of a thoroughgoing search for additional details of tornado-death occurrence. The completeness, at least of the roster of death-dealing tornadoes, is suggested by the pattern of annual tornadodeath-day totals during the 38-year period (chart 14) .9 It will be observed that in spite of a progressive rise in number of tornadoes reported and in number of tornado days, there is no significant
· change in the number of tornado-death days. Thus, although n1any tornadoes have, in the past, obviously been unreported, and although the number of tornadoes reported has increased remarkably in recent years in response to concerted efforts to detect their occurrence, there has been no corresponding increase in the number of tornadodeath days. It would appear, then, that throughout the 38-year period death -dealing tornadoes have always attracted sufficient attention to become a matter of record.
TREATMENT OF DATA
Since this paper attempts, above all else, to present to readers a vivid and reasoned picture of where and when tornado fatalities occur in the Unit~d States, empha:;is is placed on a relatively few, simple features of tornado-death distribution. Moreover, the analysis of them is essentially tangible and statistically unsophisticated. N un1erical counts and frequency distributions are the tools 1nost frequently employed. Use of the latter is further encouraged by the sporadic 1nanner in which tornado deaths occur. Under such circumstances some other statistical concepts commonly used, such as the mean, have very limited utility.
In analyzing the temporal distribution of tornado deaths, with the exception of their hourly occurrence, four phenomena are selected, namely, tornado deaths, tornado-death days, days with 25 or more deaths, and days with 100 or 1nore deaths. That tornado deaths should be chosen is implicit in the title of this study. The concept of the tornado-death day is introduced to differentiate those
9 A tornado-death day may be regarded as a 24-hour period, between an instant after midnight on one day and midnight the same day, during which one or more deaths occurred and/or during which one or more persons received tornado-induced injuries that subsequently proved fatal. Unless specified otherwise, directly or by the context, the area involved in each instance is understood to be the entire United States.
3
comparatively few days on which deaths are causea by tornadoes from the large majority of all days when no such fatalities take place. The sepa.rate analysis of days with 25 or more deaths and 100 or more deaths carries this selective technique a step farther; it focuses special attention on the still fewer disastrous days which make a contribution to the death total out of all proportion to their limited frequency. Choice of the number 25 was determined chiefly by the fact that there is a distinct break in frequency of days with 25 or more deaths, on the one hand, and those with fewer than 25 on the other.10 It also happens, incidentally, that days with 25 or more deaths constitute almost exactly the upper 10 percent of all tornado-death days, based on number of persons killed. Then, too, 25 tornado deaths on one day is certainly a total large enough to merit classification as "disastrous" or some other special a ppelation. The number 100 was chosen as a n1inimum total to define days marked by what might be called extraordinary high death totals, because some round number of approximately this minimum size was needed, and because the best break in the array of
1° Frequencies of days with less than 25 deaths were, with but 1 exception, 3 or more; days with 25 or more deaths occurred, with 2 exceptions, only once or twice.

daily death totals was betwoon 96 deaths ( 1 day) and 112 deaths ( 1 day).
Hourly distribution of tornado deaths is also analyzed by means of the frequency distribution. In this instance, however, the number of deaths is too small to justify breaking down the hourly intervals by months or by years.
Analysis of the areal distribution of tornado deaths is organized primarily on the basis of tornado-death regions.11 Though boundaries are sometimes diffuse and arbitrarily placed, particu-
11 A tornado-death region may be regarded as any part of the earth's surface within which tornado-death characteristics are (a) relatively homogeneous, and! (b) sufficiently distinctive to impart to that area a tornado-death attribute which justifies setting it apart from contiguous, contrasted areas.
4
larly where data are scanty, obvious contrasts in tornado-death attributes in various parts of the country suggest at once the utility of regional organization. Moreover, this approach lends itself particularly well to a comparative examination of tornado-death characteristics, one of the most interesting and effective means of demonstrating their areal distribution. Though the area and extent of regions thus delimited are not to be regarded as definitively settled, they do represent broad-scale contrasts in tornado-death characteristics of a rather enduring nature, since contrasts on which they are based depend on significant areal differences in physical and cultural factors which control the occurrence of tornado fatalities.

CHAPTER I
TEMPORAL DISTRIBUTION OF TORNADO DEATHS
Tornado deaths occur on relatively few days during the year. 0£ the total of 8,742 fatalities from 1916 through 1953, the 8,734 fatalities capable of being assigned to some specific calendar day took /place on but 669 days, a little less than five percent of all days during the period covered by the investigation (table 2) .1 Tornado-death days thus averaged less than 18 per year. It will also be noted that during the same period, the average annual number·of tornado deaths was approximately 230 persons. Though it will be shown subsequently that the latter figure fluctuates great-
ly from year to year, these annual means serve to convey a general impression of the frequency of days on which people are killed by tornadoes and the order of magnitude of the resulting deaths.
TABLE 2.-General summary: number of tornado-death days and tornado deaths, 1916-53
Tornado-death days
Number ____ ---------------~ Percent of all days ________ _ Average per year __________ _
Tornado deaths
669 Number ----------------1 4. 8 Annual average-------~-17.6
8, 742 230.1
MONTHLY VARIATION IN NUMBER OF DEATHS
Among the 12 months of the year, there was a large and systematic variation in number of tornado fatalities. Even a casual inspection of the record reveals that most deaths took place from ~1arch through June (fig. 1) . Indeed, nearly 83 percent of the total occurred in these 4 months, the other 8 months accounting for only about 17 percent (table 3) .
MARCH THROUGH JUNE
Days with 25 or more deaths, though limited in number, play an especially significant role in the accumulation of tornado fatalities in the United States. For the 38 years covered in this study, more than two-thirds of all deaths occurred on 66 such days (table 4) . It is therefore interesting to determine to what extent these high-total days contributed to the exceptionally numerous fatalities from March through June.
Table 4 reveals that 52 of these 66 high-total days occurred from March through June, and that
1 Eight deaths, whose place, month, and year of occurrence were known, could not be assigned to a specific calendar day. Therefore data concerning daily tornado-death totals and frequencies, and most other tornado-death-day information are based on these 8,734 fatalities. On the other hand, data relating to monthly and. aimual occurrence of tornado deaths are based on ail 8,742 fatalities.
420320-57--2
TABLE 3.-Tornado deaths by seasons, 1916-53
Tornado deaths
Season Number Percent
of total
March-June·------------------------------------------ 7, 245 82.9 July-February---------------------------------------- 1, 497 17. 1
these 52 days accounted for approximately 75 percent of that 4-month death total. In contrast, comparable figures for the other 8 months were 14 days and slightly over 39 percent of the fatalities. Furthermore, between l\tfarch and June, days with 25 or more deaths averaged 104 fatalities; similar days in the other 8 months averaged just under 42.
TABLE 4.-Days with 25 or more deaths vs. days with fewer than 25 deaths, by seasons, 1916-53
Days with 25 or more deaths Days with fewer than 25 deaths
Per- Average Average Months Num- Num· cent of number Num- Num- number
ber ber of season deaths ber ber of deaths deaths total per such deaths per such
day day ------- -------
Mar.-June _____ 52 '5,406 74.8 104 391 1,831 4. 7 July-Feb ______ 14 587 39.2 41.9 212 910 4.3 All months ____ 66 5,993 68.6 90.8 603 2, 741 4.5

TABLE 5.-Days with 100 or more deaths, by months, 1916-53
Deaths Month Number ---.--
of days Number Percent
--------------1---------March _____________________________________ _ ApriL __ ---- __ ------_----- ____ --------------May _____________________________ ------- ___ _ June _______________________________________ _ March-June _______________________________ _
5 6 4 2
17
1, 601 67.9 1,084 48.4
595 36.8 294 28.7
3,574 49.4
On the other hand, there was very little difference in average number of persons killed on days with less than 25 deaths, whether in March-June or July-February. It is therefore apparent 'that the remarkable disparity between the total number of deaths in each of these two periods resulted chiefly from the greater frequency and more deadly nature of high-total death days from March through June.
The size of the daily death average, 104 persons, on the 52 high-total days in months from March through June prompts further anlaysis. It is apparent that days having 100 or more fatalities must have played an important role in the accumulation of deaths in 1 or more of these 4 months.
During the 38-year period there were 17 exceptional days on which tornadoes claimed 100 or more lives, and all.17 occurred in March, April, May, or June (table 5) .2 Moreover, these relatively few days accounted for virtually half of all deaths in these four months.
There was, however, a considerable contrast in the significance of these exceptional days in the accumulation of deaths within individual months. Thus more than two-thirds of all deaths in March took place on just five such days; in April nearly half on six days. On the other hand, four days with more than 100 deaths accounted for less than two-fifths of the May total, and two such days for less than one-third of all fatalities in June.3
2 For all years of record there is at least one exception, possibly two, to this pattern established in mQre recent years. On February 19, 1884, an historic series of tornadQes killed several hundred persons in Alabama, Georgia, and the Carolinas. Authorities differ on the number of deaths caused by these storms ; Brooks [3} says about 1,200, Finley [8] "about 800", the Weather Bureau [34], 420 persons. The other possible exception is July 26, 1875, when, according to Weather Bureau [34] records, a storm thought to have been a tornado struck Erie, Pa., and killed 134 persons.
3 If days with 90 to 99 deaths were also included, figures for June, the only month with daily totals in this interval, would rise to a more impressive 4 days with 480 deaths, comprising approximately 47 percent of the monthly total. It is apparent that with respect to days having exceptionally high tornado casualties June is not to be regarded too lightly.
6
TABLE 6.-Number of tornado deaths on individual days having 100 or more deaths, 1916-53
Date
Mar. 18, 1925 ____________ _ Mar. 21, 1932 ____________ _ Apr. 5, 1936 _____________ _ Apr. 20, 1920 ____________ _ May 9, 1927-------------Apr. 6, 1936_ -------------Mar. 21, 1952 ____________ _ Apr. 9, 1947 _ -------------June 23, 1944 ____________ _
Number of deaths
788 317 248 216 206 204 201 169 152
Date
May 27, 1917-------------Mar. 28, 1920 ____________ _ Mar. 16, 1942 ____________ _ June 8, 1953 _____________ _ Apr. 12, 1945_ ------------May 11, 1953 ____________ _ May 26, 1917 ____________ _ Apr. 30, 1924 ____________ _
Number of deaths
151 148 147 142 135 125 113 112
An examination o£ individual days having 100 or more deaths reveals additional interesting detail (table 6). It will be observed that the four days having highest totals occurred in March or April, as did seven of the first eight such days. ~foreover, with the single exception of May 9, 1927, days on which substantially more than 150 persons were killed also took place in March or April.4
Unquestionably, tornado-death activity is highest in this country between March and June. However, observations comparing the level of death activity in each of the four months need to be expressed more guardedly. Yet there is every indication that the peak is reached early in the season, probably in March, and that although the level remains fairly high through June, there is a progressive decline after the early season maximum.
The high death totals from March through June are to be attributed primarily to the great frequency and unusual severity of tornadoes during these months. That tornadoes are more frequent at this time of year is borne out by monthly totals of all such storms reported in the United Stat~s from 1916 through 1953 (table 7) .5 That they produce more severe effects as well, is already suggested strongly by the unusual frequency and deadliness of early-season tornado-death strikes. It is also substantiated by numerous published ac-
4 For all years of record there are two departures from thi~;~
pattern: February 19, 1884, previously noted, and May 2.7, 1896, when according to Weather Bureau [34] figures the St. Louis tornado claimed 306 lives.
5 Though the roster of death-dealing tornadoes is believed to be substantially complete, it should be understood that the same is not true of the roster of all tornadoes, at least not during most years covered by this investigation. Furthermore, because of more complete records for certain States, like Kansas and Iowa, which lie within the chief areas of tornado activity from May to October, it is probable that the record of all tornadoes is biased in favor of more nearly complete totals for the months indicated. It is believed, however, that the magnitude of such bias is insufficient to invalidate the broad generalizations employed herein.

TABLE 7.-Tornadoeg reported in the United State8, 1916-53, by month8 (compiled from official Weathe1· Bureau jig'lt,re8)
Month Number Month Number
Mar_______________________ 610 JulY--------------------- 427 Apr________________________ 836 Aug _______ ~------------- 273 May_______________________ 1,144 Sept_ ____________ ------ 259 June_______________________ 917 Oct_ _____________ ------- 144
Nov_____________________ 166 Dec_____________________ 116 Jan_____________________ 145 Feb_____________________ 167
counts o:£ the utter devastation caused by vortices during these months.
Though gradually decreasing severity and, finally, :frequency o:£ ton1ado activity seem unquestionably to be the most important factors accounting for trends in tornado-death activity :from March through June, regional contrasts in other :factors certainly contribute in a minor way to the changes noted. Most obvious is the contrast between the dispersed rural settlement typical of the Midwest, where tornado activity is centered by May and June, and the m.ore clustered pattern of population in similar areas in the Southeast, where it is centered in March and April. Other factors o:£ lesser significance will be enumerated and discussed briefly in connection with the :four tornadodeath regions.
JULY THROUGH FEBRUARY
Though there were detailed contrasts in the tornado-death attributes o:£ individual1nonths :from July through February, there was one characteristic common to all, namely, the relatively small proportion o:£ all deaths compared with that :for the other 4 months (fig. 1). In these remaining 8 months, deaths were 1nost numerous in February, which, in spite of fewer calendar days, contributed between 3 and 4 percent of all fatalities for the 38-year period (table 8). Comparable figures :for the other 7 months ranged down to 1 percent in July.
Not only in number but also in structure, deaths in these remaining 8 months differ widely from those in the period :frmn March through June. It will be recalled that the number o:£ high-total clays in these 8 n1onths was but 14, less than one-third as many as in the other 4 (table 4). Furthermore the average number o:£ deaths per such day in July-February was less than hal:£ that :for MarchJune. Then, too, the absolute daily maximun1 in
7
TABLE 8.-Tornado death8 and tornado-death day8, by month8, 1916-53
Deaths Average 1-day Number number of death
Month of death deaths per maxi-Number Percent days death day mum
of total
Jan __________________ 242 2.8 32 7.6 59 Feb. ______ ---------- 304 3. 5 33 9.2 41 Mar ____ -------- _____ 2, 361 27.0 88 26.8 788 Apr_---------------- 2,238 25.7 126 17.8 248 May---------------- 1, 620 18.5 131 12.4 206 June __ ---------- ____ 1,026 11.7 98 10.5 152 July----------------- 88 1.0 34 2. 6 10 Aug _________________ 108 1.2 27 4.0 36 Sept_ ____ ------------ 216 2. 5 22 9.8 81 Oct. ___ --------- ____ 121 1.4 20 6.1 29 NOV----------------- 232 2.6 29 8.0 76 Dec. ______ ---------- 186 2.1 29 6.4 38 All months __________ 8, 742 100.0 669 13.1 788
each o:£ these 8 months was less than 100 deaths; :for 5 of them it was under 50 (table 8).
~Vithin individual months the number o:£ cases as well as deaths involved is so limited that it may not be representative of long-term trends. However, :for the period studied, July had not only :fewest deaths, but also the lowest death-day average, less than 3 persons, and the lowest daily maximum, 10. Though the number o:£ death days declined in
30
25
20
10
5
0
• Tornado deaths
D Tornado-death days
c-
c-
- 1- -·
IIJl r- 1-
r-r-
I I I ~I I J FM AM J J AS 0 N D
Month
l
-
FIGURE 1.-Tornado deaths and tornado-death days, expres.sed as percent of all tornado deaths and tornadodeath days, respectively, for the years 1916-1953.

TABLE 9.-H'igh-total vs. low-total death days, by months, 1916-53
Days with 25 or more deaths Days with fewer than 25 deaths
Percent of Average Month Number Number monthly Number Number number
of days of deaths death of days of deaths deaths per total such day
------ ---------Jan _______ 2 89 36.8 30 153 5.1 Feb ________ 5 170 55.9 28 134 4.8 Mar _______ 12 1,901 80.5 76 457 6.0
tf:.y======= 16 1,641 73.3 110 597 5.4 15 1,131 69.8 116 486 4.2 June _______ 9 733 71.5 89 291 3.3
July------- 0 0 0.0 34 88 2.6 Aug __ ----- 1 36 33.4 26 72 2.8 Sept _______ 3 149 69.0 19 67 3.5 Oct.------- 1 29 24.0 19 92 4.8 Nov _______ 1 76 32.8 28 156 5.6 Dec ________ 1 38 20.4 28 148 5.3 All
months __ 66 5,993 68.6 603 2, 741 4.5
August and still further in September, each of these latter months registered an increase in total deaths and in the 1-day maximum. In September the margin of increase was especially noteworthy. October experienced still fewer death days, and the increase in other phases of death activity noted in August and September was emphatically reversed. On the other hand, figures expressing all phases of tornado-death act~vity increased again in November, when they almost matched those in September. Following another slight decline in December, there was a general increase in most aspects of death activity thereafter.
In spite of the small body of data, a few cautious generalizations may be made concerning the monthly trend of tornado deaths for July-February, at least for the 38 years covered in this study. Most certain of all is the indication that tornadodeath activity experiences a precipitous drop soon after the arrival of summer, probably reaching a minimum in July. There is also a relatively abrupt change between February and March. I-Iowever, between July and February the general increase seems to be unsteady, with, perhaps, a secondary minimum in October.
The low death totals fl'om July through February obviously result from fewer tornadoes and less violent effects than in the remaining 4 months of the year. The precipitous drop in tornado deaths and the substantial decrease in number of all tornadoes from June to July coincides with the arrival of summer. Though tornadoes are more numerous in July than in any month until March, it is not at all certain that the same is true of their severity.
The general, if somewhat irregular, increase in number of tornado deaths-after July probably cor-
8
TABLE 10.-Days in September having 25 or more tornado deaths, 1916-53
Date Number of deaths
Sept. 21, 1924---------------------------------------------------- 36 Sept. 29, 1927--------------------------------------------------- 81 Sept. 29, 1938--------------------------------------------------- 32
responds at first to a gradual increase in the incidence of severe tornadoes, because the number· of vortices reported does not reach a minimum until December (table 7).
In view of the small sample, one can scarcely say that there is evidence of much change in the severity of tornadoes in Angust. However, by September there is a substantial increase in the number of fatalities, an increase that results chiefly from a sharp jump in deaths on high-total days (table 9). It is certainly interesting, and it may be significant, to note that between 1916 and 1953 all such high-total days occurred late in the 1nonth, when summer is essentially over (table 10). Indeed, there is just one instance between July 1 and September 20 in the 38-year period studied when as many as 25 deaths took place on one day.6
The secondary death minimum in October is probably no accident. It will be recalled that there is a sharp drop in number of all tornadoes reported in October, which has fewer than any month save December (table 7). Moreover, no month has fewer tornado-death days than October (table 8).
The decrease in number of tornado deaths again in December is neither as abrupt nor as suggestive of a long-tenn trend as that in October. Yet it coincides with the lowest monthly total of all tornadoes reported. One probable factor is the ever smaller area subject to tornadoes with the arrival of winter. -
The increase of tornado deaths in January and again in February c9rresponds with similar increases in the number of all tornadoes reported. The increase in number of tornado deaths, however, results chiefly frmn an increase in number of high-total days and in deaths on such days (table 9). It seems likely therefore that the incidence of severe tornadoes increases in January; it cert-ainly does in February. However, the abrupt increase in number of all tornadoes, as well as in severity of tornadoes, is reserved until the ap-. proach of spring, in March.
6 On August 21, 1918, 36 persons lost their lives when a tornado· struck Tyler, Minn. ·

MONTHLY SHIFTS IN AREAL DISTRIBUTION OF DEATHS
Not only number but also areal distribution of tornado deaths varies from month to month. In a general way, monthly changes in the distribution of· deaths are reflected in corresponding shifts in the geographical center of deaths. For the 38 years studied, the center moved from east-central Mississippi in February, to central Iowa in July and August (chart 1) . 7 In fall and winter months, it returned southward, and, in general, eastward to reach Mississippi again in January.
MARCH THROUGH JUNE
During March and April, a large majority of all fatalities took place between the latitudes of southern Illinois and south-central Mississippi, and between the meridians o:£ west-central Texas and east-central South Carolina (charts 4 and 5). 8 In March, however, deaths in this general area were concentrated in the central and east-central portion. On the contrary, in April they were more widespread, longitudinally speaking, with marked increases in Oklahoma, Texas, and western Arkansas, as well as in eastern Georgia and South Carolina.
7 The manner in which the center of deaths is calculated for each month and for all months is similar to that described by Murphy and Spittal [22]. A pair of axes, consisting in this case of a conveniently situated meridian and parallel, were drawn on a piece of tracing paper. The latter was then placed on the dot map (charts 2-13) for the particular month being analyzed, in such a manner that the axes on the tracing paper coincided with their counterparts on the map. In order to adjust the position of the. parallel so as to have it pass through the actual center of gravity of deaths for that month, the distance of. the center of each dot, cluster of dots, or circle on the map north of the assumed position of the parallel was measured, and then multiplied by the number of deaths represented. Products thus obtained for all deaths north of the assumed position of the parallel were added. Next, distances were measured and products computed and added for all dots and circles south of the assumed position of the parallel. The smaller of these two sums was then subtracted from the larger, and the difference divided by the number of deaths represented; on the map in question. The resulting quotient indicated the number of units distance the assumed position of the parallel had to be moved north or south, as the case may have been, so as to pass through the center of gravity of deaths for the month under consideration. The initial, assumed position of the meridian was adjusted in a similar manner so that it, too, passed through the center of gravity for that month. The intersection of the relocated axes represented the sought-for death center for the month or period being considered.
s The size of circles used to represent 10 or more deaths is graduated so that the area covered by a given circle 1s in proportion to the number of deaths being represented. Scale of the circles is based on the area covered by one dot, which represents one death.
9
In May deaths were more widely dispersed, having reached northwestward to the Dakotas, and Wyoming, and westward to New Mexico (chart 6). The northwestward movement was attended by a notable increase in the number of deaths in Iowa, Missouri, Kansas, and Nebraska. At the same time, there was a marked decrease in tornadodeath activity in the Southeast, in States from Mississippi to South Carolina.
Positive changes in J nne included a farther northwestward penetration to Idaho and Montana, and a spreading northeastward to Massachusetts (chart 7). On the negative side, there was a virtual cessation of tornado-death activity in the Southeast and a marked decline in Louisiana and Texas as well. Most striking change compared with May was the appearance of a few exceptionally large death groups in the northeastern quarter of the country.
The four exceptionally large death groups in Michigan, Ohio, \Vest Virginia, and Massachusetts in J nne immediately suggest the probable ilnportance of large and locally .dense population. Indirectly but unmistakably they also testify to the violence of the storms that caused them; a death group of this size always represents the work of a mighty storm. That catastrophes of . comparable magnitude seem not to be typical of tornado-death activity farther west in these same latitudes, as far as the Rockies, may be explained, aside from meteorological considerations, by the larger and more clustered population of many areas in the East.
JuLY THROUGH FEBRUARY
Broadly speaking, the areal distribution of deaths in July, August, and September displayed 1nore similarities than differences. Though widespread, a 1najority of them were concentrated in the North Central States, both east and west of the Mississippi River (charts 8, 9, and 10) .. In July the extent of death distribution was not unlike that of June, but the number of deaths represented was less than one-tenth as many. Most conspicuous, in contrast to June, was the complete absence of any large death groups. In August and Sep-

TABLE 11.-All tornado strikes· of record accounting fot· 25 or more deaths between July 1 and Sept. 21 (compiled from official Weather Bureau figures)
Date
July 26, 1875 __________________________ _
Aug, 9, 1878---------------------------Aug. 21, 1883-------------------------Aug. 21, 1918--------------------------
Number deaths
Place
134 Erie, Pa. 30 Wallingford, Conn. 31 Rochester, Minn. 36 Tyler, Minn.
tember, a few apparently significant deaths appeared in the Southeast, particularly along the Atlantic slope from Florida northward.
The geographical distribution of all recorded death strikes accounting for 25 or more fatalities between July 1 and September 21, is interesting and suggestive (table 11) ; all 4 such death strikes took place near the northern limit of tornadodeath activity.
The appearance, in August and September of tornado deaths along the Atlantic Seaboard and Gul£ Coast is related in part to the onset of the hurricane season. Though at least a few deathdealing tornadoes have been associated with tropical storms, the contribution of such vortices to death totals, even in an absolute sense, is exceedingly small. 9
October and November were clearly transition months (charts 11 and 12) . In October there was
a marked southward shift in the center of death activity; in November the most conspicuous development was a concentration of deaths in lower Mississippi Valley States and those adjacent to them. Most notable exception to the latter generalization was 1'7 deaths in Charles County, 1\-Iaryland in November. Incidentally, these deaths did not happen in connection with a tropical storm (see Brooks [ 4] ) .
By December the transition period was essentially completed, and from .then through February there were few important changes in the areal pattern of deaths (charts 13, 2, and 3). In general, the distribution of deaths in December was localized in the immediate vicinity of the lower Mississippi River Valley. During January and February deaths were somewhat more widespread, there having been a small but emphatic shift eastward in the center of death activity in each of these two months.
It is interesting to note that the few deaths outside the South from December through February all took place in central United States. That such tornadoes are rare as far north as Illinois in December is noted by Fulks and Smith [11] in their analysis of the tornadoes of December 2, 1950. Three of the latter four storms were in Illinois, and 2 of the 3 accounted for 3 of the 4 December deaths in that State.
FLUCTUATIONS AND TREND IN ANNUAL TORNADO-DEATH TOTALS
The number of tornado fatalities varies 1narkedly from year to year as well as from month to month. During the period covered by this investigation the annual total fluctuated between a low of 29 in 193'7 and a high of 842 in 1925 (chart 14, table 12). On the other hand, fluctuation in the annual number of tornado-death days varied much less, from 10 in 1916 and 1919 to a high of 28 in 1953 (chart 14, table 12). In 29 of the 38 years, however, the annual total fluctuated only between 13 and .22. There was, moreover, no necessarily direct relationship between number of tornadodeath days and number of deaths. In the year 1928, for example, 91 deaths were spread over 2'7 days, whereas in the previous year 532 deaths occurred on only 21 days. Even more striking in this respect was 1925, a year in which 842 fatalities
9 The tornadoes which claimed 32 lives at Charleston, S. C., in September 1938 were not associated with a hurricane.
10
took place on just 15 days. In general, nevertheless, years with highest death totals also had somewhat more death days (table 13). It is also apparent from data in this table, however, that the great preponderance of deaths in high-total years resulted more importantly from larger death-day totals than from the moderate excess of death days
. themselves. This latter situation is one reminiscent of a
similar relationship between high monthly death totals and high-total death days. It is, therefore, appropriate to examine in greater detail the monthly structure of death distribution within individual years. Chart 15 reveals that between 1916 and 1953 each of 13 years had more than the average annual number of fatalities for the period as a whole. In each of these 13 years it is also evident that there were one or more months with an unusually large number, say 100 or more, of deaths. Moreover, in every one of these 13 cases,

TABLE 12.-Tornado deaths, tornado-death days, tornadoes and tornado days: annual totals 1916-53 (tornadoes and tornado days compiled from official Weather Bureau figures)
Number of Number of Number of Number of Year tornado tornado- all all tornado
deaths death days tornadoes days
1916 ___ ------------------- 150 10 90 36 1917---------------------- 520 22 121 38 1918 _____ ----------------- 135 16 81 45 1919 ____ ------------------ 206 10 65 35 1920 ________ -- ------------ 479 14 87 49 1921_ __ ------- ------------ 198 15 106 55 1922 ____ ------------------ 137 23 108 65 1923 ____ ------------------ 107 16 102 59 1924 _______ --------------- 373 27 130 58 1925 ___ ------------------- 842 15 119 64
1926 ____ ------------------ 144 14 111 56 1927---------------------- 532 21 164 63 1928 ___ ------------------- 91 27 203 79 1929 ___ --- ---------------- 269 21 197 73 1930 ____ ------------------ 175 16 192 72 193L ___ - ----------------- 36 13 94 57 1932 ___ ------------------- 394 14 152 67 1933 ___ ------------------- 361 26 260 96 1934 ___ ------------------- 47 13 147 77 1935 ___ ------------------- 70 21 182 77
1936 ___ -- ----------------- 551 17 159 73 1937---------------------- 29 13 148 76 1938 ________ - ------------- 183 18 220 78
1939- ·----- --------------- 86 22 155 75 1940 ___ ------------------- 65 11 128 65 1941_ _____ -- -------------- 52 13 118 57 1942 _____ ----------------- 379 21 170 68 1943 ____ ------------------ 58 18 155 63 1944 ____ ------------------ 275 18 173 67 1945 _______ --------------- 210 18 126 68
1946 ___ ------------------- 77 16 109 66 1947---------------------- 313 22 171 80 1948 ___ ----- -------------- 140 19 190 74 1949 _____ ----------------- 211 23 262 84 1950 _____ --------------- "- 70 13 210 92 1951_ ____ ----------------- 34 14 300 1111 1952 ___ ------------------- 229 11 270 104 1953 ______ -------- -------- 514 28 532 151
TotaL------------- 8, 742 669 6,307 2,681
TABLE 13.-Number of tornado deaths, number of tornadodeath days, and average number of deaths per death day in high-death-total years vs. low-death-total years, 1916-53
Number of Average Number of tornado- number of
deaths death deaths per days tornado-
death day
19 years with highest death totals _____ 7,039 361 19.5 19 years with lowest death totals ______ 1, 703 308 5.6
the months having more than 100 deaths occurred in the period from March through June. Incidentally, most, though not all, high-total months thus involved included days on which tornado fatalities exceeded 100 persons (table 6). In contrast, it is interesting to note that out of 7 years in which the month of maximum deaths did not fall between March and June, only 1 (1926) had an annual total of over 100 deaths.
Considering the 38-year period as a whole, the trend in number of deaths has been downward.
11
TABLE 14.-Tornado deaths and tornado-death days, fi.rst 19 years vs. the second 19 years, 1916-53
Days with 25 or more Days with All death days deaths fewer than
25 deaths
Years Percent of Average Average
Number 38-year Number number number total deaths deaths
per day per day
1916-34_ _________ 333 59.4 38 96.4 5.2 1935-53 __________ 336 40.6 28 83.2 3.9
Thus, half the 8,742 deaths had accumulated by September 1931, in the 16th year of the investigative period; it required slightly more than 22 years to amass the other half (chart 15) . Stated in a different way, nearly 60 percent of all deaths occurred in the first 19 years and only slightly over 40 percent in the second 19 years (table 14) .
That this difference was not due to the occurrence o:f a larger number of tornado-death days in the first 19 years is demonstrated by the remarkably even division in number of death days between the two periods ( tahle 14). In fact the second 19 years had three more. Rather, the difference in question resulted from a larger number of deaths per death day in the first 1'9 years, both on days with 25 or more deaths and on those with less than 25 deaths. This higher average number of fatalities per death day during the first 19 years was also reflected in the more frequent occurrence of days having 25 or more deaths.
The decrease in deaths during the second 19 years could have.been caused by reduced tornadic activity, by less violent tornadoes, by tornadoes
. striking in less densely settled areas, by better tornado detection and warning services, or by a whole host of chance circumstances which virtually defy analysis and testing. It will presently be shown that the most plausible explanation for the modest decline in annual number of tornado deaths is the use of improved tornado detection and warning services by a better-informed public.
There is, for example, no evidence to suggest that tornadoes are becoming less frequent in recent years. Indeed, the number reported annually has grown steadily; since 1951 the increase has been phenomenal.10 However, as Harris [13] points' out, much of the increase probably results from
10 From a previous high of 300 tornadoes in 1951, the annual total shot up to 870 in 1955, according to Weather Bureau [31] figures.

more complete reports. Since 1951 utilization by theW eather Bureau of data obtained from private press-clipping services has definitely done much to appreciate the annual total. In any event, the question, if any, seems to be whether there are more, not fewer, tornadoes.
There is also doubt that tornadoes struck consistently in less densely populated areas during the second 19 years. Indeed, the general increase of population in the country suggests the opposite possibility. If individual death strikes causing 25 or more fatalities in urban areas are considered, there is remarkably little difference either in number of cases or number of deaths between the first and second 19 years (table 15). Though 2 fewer communities were struck by devastating tornadoes in the second 19 years, the number of persons killed was even greater than in the first 19 years.
Whether or not tornadoes were generally less violent in the second 19 years than in the first cannot be determined conclusively on the basis of any available evidence. Yet there certainly is no obvious reason to suspect any significant decrease in their intensity. There likewise seems to be no reason to believe that the numerous fortuitous circumstances which may affect the number of deaths were, on the whole, likely to be either decidedly more or less favorable in the first 19 years than in the second. Moreover, with such a large number of cases covering so many years and such diverse conditions, it seems not unreasonable to expect that chance variations might, at least approximately, have compensated for each other in both halves of the 38-year period.
Though it is obviously impossible to prove it, the decline in number of deaths seems most likely to have resulted from improved storm warnings and better use of these warnings by the public. This factor can operate through (a) better tornado forecasting, (b) better detection and tracking of tornadoes already in progress, (c) more adequate dissemination of such information among people in the affected areas, (d) more effective use of warnings by a better-informed public.
Though specific tornado forecasts for limited areas are generally credited, since their inception in 1952, with reducing somewhat the potential number of deaths, and though better detection and tracking of tornadoes in progress, especially by use of radar, is beginning to he available in some areas, these most promising developments are ob-
12
TABLE 15.-Tornado-death strikes causing 25 or more fatalities in urban areas, 1916-53
Years
1916-34_-----------------------------------------1935-53.--------~--------------------------------
Number of large towns Number of
or cities deaths struck*
18 16
1,197 1,267
*Towns aud cities with population of 2,500 or greater.
viously too recent to have affected substantially the number of deaths during the period under investigation. However, to the limited extent the more specific forecasts may have been effective, it is clear that they operated at the close of the second 19 years.
Somewhat more significant because of their longer standing, are the volunteer tornado-warning networks established during World War II to provide at least a few minutes' warning for vital military and manufacturing establishments in the tornado belt. Flora [9] observes that these proved so effective that after the war they were increased in number. Though these rudimentary warning systems can scarcely be considered a satisfactory solution to the problem of protecting the public at large, there are several documented cases where they functioned with great effectiveness. It is clear that to whatever limited extent these networks were effective, they tended to reduce tornado deaths in the second, not the first, 19 years.
Means for adequate dissmnination of warnings and for education of the public go hand in hand. Thus better education of the public, not merely in a formal sense but also through the tremendous broadening of know ledge and experience of the average citizen as a result of modern developments in communications and transportation~ has enabled people to utilize in an increasingly effective manner whatever severe storm indications may have been available, whether warnings issued by the Weather Bureau or signs based on local observations. This greatly increased comprehension has characterized successive periods within the years studied, but the rate of increase has certainly been most n1arked during the last 20 or 25 years, since the widespread use of radio, the auto, and mass education 1nedia like motion pictures and, more recently, television. At the same time

the tremendous increase in telephone subscribers and in use o:f the telephone, radio, and television have greatly augmented means :for disseminating warnings o:f tornado-breeding weather situations
or o:f tornadoes already in progress. In all these respects, too, the benefitsto be derived in reducing tornado casualties have been either more decidedly or exclusively identified with the second 19 years.
HOURLY DISTRIBUTION OF TORNADO DEATHS
Tornado deaths occur at all hours o:f the day or night, but their hourly distribution is quite uneven. For the years 1916 through 1953, a large majority took place in afternoon and early evening (table 16). Thus the 8 hourly intervals, beginning at 1331 LST and ending at 2130 LST include nearly three-fourths o:f all deaths tabulated; the remaining 16 hours account :for but slightly more than one-quarter o:f the total. Incidentally, every one o:f the 8 leading hours accounted :for more than 4.17 percent, the mean hourly proportion o:f all deaths tabulated, and every 1 o:f the other 16 hours accounted :for less than this mean proportion (fig. 2).
Within the 8 leading hours, 3 consecutive ones in the afternoon had an outstandingly large proportion o:f deaths, namely, those beginning at 1431, 1531, and 1631 LST, in order o:f decreasing magnitude. It is apparent :from the chronological arrangement o:f hourly variations that there was a rather abrupt onset o:f tornado-death activity in early afternoon, culminating rather quickly in a maximum during the second o:f the 8leading hours. The subsequent decline was much slower and it was punctuated at the end o:f the 8-hour interval, between 2031 and 2130, by a substantial secondary maximum.
Following this secondary maximum, there was a sharp drop in number o:f deaths during the first o:f the remaining 16 hourly intervals. Thereafter the decline was general, but slow, reaching a mini-
TABLE 16.-Tornado deaths, by groups or hours, 1916-53*
Hours (LST)
1331-2130.-----------------------------------------2131-1330.-----------------------------------------
All hours------------------------------------------
Number of deaths
5,874 2,114
7,988
Percent of all deaths tabulated
73.6 26.4
100.0
*This analysis of hourly distribution is based on a total of 7,988 fatalities, consisting of those among the 8,742 deaths for which time of the tornado strike could either be established from reliable reports or estimated with reasonable certainty within 1 hour of the probable time of occurrence. Each tornado death is assigned to the hour at which the tornado struck whether the death was immediate or occurred at some later time.
420320-57--3 13
mum value between 0531 and 0630 LST. Following the minimum, the hourly death total increased slowly at first, with one notable irregularity, and then more rapidly as early afternoon approached.
The reason :for the primary maximum between 1431 and 1530 LST, as well as :for the preponderance o:f deaths in it and the succeeding hourly intervals is obvious. In general, this hourly regime o:f deaths results :from a marked increase in tornadic activity as a result o:f the trigger action o:f thermal convection during the warmest hours of the day.
There is another circumstance, not primarily meteorological, which should tend to reduce the
-~--~~~------~---~--------=~------~--~-~-~-----~ TIME OF DAY
FIGURE 2.-Hour of tornado deaths, expressed as a percent of all tornado deaths capable of being timed within one hour of their occurrence. Data for years 1916-1953.

incidence of deaths subsequent to such a sharp onset of tornadic activity. As individual storms are born and observed, and as their apparent course of movement becomes established, those which are destined to be long-lived and unusually violent should claim an ever-decreasing proportion of potential casualties as cmnmunities in their projected paths become alerted. However, some of the all but incredible records of storms that have struck important population centers without warning, after having traveled toward them steadily for hours, lend a considerable measure of doubt concerning the success with which this inherent advantage has been exploited prior to the quite recent past.
The secondary maxinmm from 2031 to 2130 LST
undoubtedly results from the tendency of fatalities to increase somewhat during evening hours, when darkness obscures approaching funnels, and when increasing numbers of people are grouped together in homes, and some are already asleep. This opinion is based on numerous instances in which accounts of casualties reveal the significance of these circumstances in augmenting the number of deaths. Such, for example, was the case on April 29, 1942, when a tornado demolished 6
14
houses and killed 15 persons in the shallow valley of Sappa Creek, east of Oberlin, Kans., at about 2230 LST. According to the Topeka Daily Oapital [28], all victims were in their nightclothes, indicating that they had already retired. These deaths were confined to 4 families, 2 of which were wiped out. Even when most people are not in bed asleep, deaths may be increased by darkness. Thus, in discussing the early evening storm that struck in Jay and Adams Counties, Ind., on March 28, 1920, Holcomb [18] states flatly that loss of life was increased because, in the gathering darkness, few realized that a tornado was approaching.
The small proportion of deaths in each of the remaining 16 hourly intervals results most importantly from fewer tornadoes because of greater stability in the lower atmosphere during these hours. The wide departure from regularity exhibited by the bar for the hourly interval from 0831-0930 LST
(fig. 2) is largely, but not entirely, explained by one exceptional disaster during hours when tornado deaths are generally few. The deaths at Gainesville, Ga., shortly after 0830 LST on April6, 1936, comprise 203 of 303 deaths represented in that hourly interval.

CHAPTER II
AREAL DISTRIBUTION OF TORNADO DEATHS
Since paths of tornadoes are generally rather short and narrow, it is to be expected that the effects of any given storm are usually felt only over a very limited area. Even :for a considerable period o:f years, tornadoes sweep over but a small :fraction o:f the area o:f any one State, including those in regions most :frequented by such storms.1
Localized as these tornado tracks are, the areal distribution o:f tornado deaths is even more restricted. Not only do a mere :fraction o:f all tornadoes cause :fatalities, but it is customarily only
here and there along their paths that death-dealing tornadoes kill people. At least between 1916 and 1953 there were several States within whose borders tornado fatalities were not reported.2
Moreover, every State, including those· in the major tornado-death region, has a number of counties without reported deaths in the same period. Unquestionably, too, there are extensive areas in this country where no one has ever been killed by a tornado.
AREAS HAVING FEW TORNADO DEATHS
The most distinctive broad-scale :feature o:f tornado-death distribution in the United States. is the :fact that deaths are almost entirely confined to that part of the country lying east o:f the Rocky Mountains (chart 16). O:f the 8,742 deaths represented on this map, only 6 took place in theW estern Highland.3 Moreover, none o:f the six occurred in any ·State bordering the Pacific Ocean. 4
1 Day [5] divided the United States into equal areas of 10,000 square miles each and, using data for the years 1916 through 1928, computed the frequency with which tornadoes were· observed in any part of each square. Values obtained ranged from zero to between two and three, the latter in northeastern Kansas and nearby· parts of Nebraska, and in central Arkansas and most of Iowa.
· 2 Eleven States, Washington, Oregon, California, Nevada, Utah, and Arizona in the West, andJ Delaware, Connecticut, Rhode Island, Vermont, and Maine in the Northeast reported no tornado deaths between 1916 and 1953. Maine, however, reported one fatality in 1954.
3 The six: two in Idaho; .three in .Montana, and one in New Mexico.
4 There are, however, records of one, and possibly two, death strikes by tornadoes in Pacific Coast States. Henry [16] lists a tornado, that occurred at Long Creek, Grant County, Oreg., on June 3, 1894, and killed "several" persons. It is to be noted, incidentally, that Long Creek is east of the Cascades, not on the Pacific slope. More recently, on April 8, 1926, one of a series of hundreds of whirlwinds triggered off by an oil tank-farm fire, killed two persons near San Luis Obispo, Calif. Hissong [17] refers to these disturbances as "whirls" and "tornadoes." Yet, whether by design or by chance, in writing of the one that caused the two fatalities he never specifically calls it a tornado. In one instance, however, he refers to it as a funnel, and he remarks concerning the orientation of debris about the destroyed place as indicative of counterclockwise rotation. Accompanying the article are five photographs showing funnel clouds, but data
15
The virtual absence o:f tornado deaths west o:f the Great Plains is primarily a result o:f meteorological :factors and settlement patterns. That the wide areas with :few or no people between the Great Plains and Pacific Coast valleys contribute not only to the :fewness o:f deaths but also to the small number o:f tornadoes reported cannot be questioned. It is extremely doubtful however, that population distribution is the more important :factor. In the Western Highland there are several areas, such as the Columbia Plateau o:f Washington, the Snake River Valley, and the piedmont at the western base o:f theW asatch Mountains which have more and larger clusters o:f population than those o:f the northern Great Plains. Yet not 1 death was reported :from the areas just mentioned between 1916 and 1953, and only 5 deaths were reported during these years in the whole northern part of the Western Highland (chart 16) .
Even more striking is the absence o:f any reported tornado deaths :from the entire area west of the crest o:f the Sierra Nevada and Cascades. In these Pacific Coast Valleys-the Puget-Willa-
relating to . them suggest that they were all taken after the fatalities occurred and, hence, do not constitute a record of the death-dealing whirlwind. Whatever the reason, neither any of these whirlwinds nor the two deaths caused by one of them is included in the Weather Bureau log of tornadoes for 1926. Therefore these two deaths have not been included in the 8,742 fatalities used in this study.

mette, the Central Valley and coastal valleys o:f California, and in the Los Angeles basin-are population centers the equal to those east of the Rockies, yet not one tornado death was officially recorded in these moderately to densely settled regions over a period of 38 years. The factor more important than population. distribution is lack of frequent or violent tornadoes.
East of the Cascades, in the northern part of the intermontane region, neither frequent nor particularly devastating tornadoes occur. In the southern part of the intermontane region tornadoes are few, and in spite of some clustering of people around oases, but one death was reported from this large area between 1916-53. It is interesting to note that Arizona, Nevada, and Utah reported no deaths at all during the 38 years covered by this investigation.
Not so striking as the virtual absence of tornado deaths in the Far West is lack of fatalities in areas
adjacent to the Canadian border, in the Great Lakes region and the northern parts. of States farther east (chart 16) . 5
Chief reasons for the general absence of deaths along this section of the Canadian border are the decrease in population compared with areas farther south, and a waning in the frequency and intensity of tornadoes. The latter factor appears to be the more important of the two, however, since there are some parts of this area within which population is large enough and dense enough so that some deaths could be expected if tornadoes were frequent or severe. Though tornadoes are .not unknown in this northern border area, they are few in number, have paths of no great length or width, and are apparently weakly developed. Not one of two dozen or more to rna~ does reported from representative parts of the area between 1916 and 1950 caused any deaths, and only one has since.
DELIMITATION OF TORNADO-DEATH REGIONS
South of the border area just discussed, and east of the western margin of the Great Plains, tornado deaths are widespread. A glance at the dot map (chart 16) reveals, however, that the distribution of deaths is quite uneven. In order to organize these widespread but areally contrasted death clusters into groups whose characteristics possess some measure of homogeneity, this part of the country has been divided into a number of tornado-death regions.
In determining regional boundaries it is assumed that two characteristics of tornado-death occurrence merit special emphasis, namely, the number of deaths and the manner of their distribution. The number and localized concentration of deaths are shown in detail on the dot· map (chart 16). The map of death areas summarizes contrasts in the areal continuity of death distribution (chart 17) .6 In fixing the detailed con-
G It may be interesting to note that according to the Weather Bureau [30] one person was reported to have been killed by· a small tornado north of Caribou, in Aroostook County, Maine, on August 11, 1954.
6 To construct this map a piece of tracing paper was placed over the dot map on a light table. Lines were then drawn so as to enclose those portions of counties in which tornado deaths occurred, and, conversely, so as to exclude all counties or parts thereof from which no fatalities were reported. However, death groups within the same or contiguous counties were connected by attenuated links.
16
figuration of parts of some boundaries, however, some consideration is given to distribution of counties . experiencing repeated death strikes as well as to seasonal contrasts in the regime of tornado deaths and tornado-death days. Where data are virtually lacking, most notably in eastern Kentucky, West Virginia, and much of western Virginia, the precise position of boundaries is frankly speculative, and rests primarily on a subjective estimate of tornado-death potentialities in the area concerned.
Preparatory to delimitation of the tornadodeath regions, the map of death areas was superimposed on the dot map (chart 16), and a sheet of tracing paper was placed over both on a light table. First, heavy dotted lines were drawn so as to generalize the utmost extent of territory from which tornado deaths were reported. Then, within that part of the country which experienced death-deal· ing tornadoes, boundaries were drawn so as to include within one and the same region contiguous areas having similar attributes with respect to number, concentration, and continuity in distribution of tornado fatalities. The resulting pattern (superimposed on chart 17) shows the affected part of the United States divided into four large tornado-death regions.

REGION I
TORNADO-DEATH CHARACTERISTICS OF REGION I
Compared with all others, Region I is characterized in superlatives. In every tornado-death attribute selected, Region I outranks each o£ the other three, usually by a very wide 1nargin.
Region I has the n1ost deaths, 6,563 (table 17). These deaths constitute slightly more than threefourths o£ the national total, in an area covering less than one-:fifth o£ continental United States ~nd s~pporting less than one-fifth o£ the country's Inhabitants. Moreover, the fact that it outranks each o£ the other regions in number o£ tornado :fatalities cannot be ascribed primarily to differences in area or population. Region I has nearly 12 deaths per 1,000 square miles, more than 3 times the comparable figure :for the next ranking region· its 23 deaths per 100,000 inhabitants is over 5 time~ greater (table 18).
Continuity in pattern o£ death distribution in Region I is likewise unmatched elsewhere in the country (chart 17). The compact heart o£ the region is completely enclosed by a cordon o£ counties, each o£ which reported one or more deaths. Within the area thus enclosed, a majority of counties, but by no means all, reported some tornado
TABLE 17.-Tornado deaths (1916-53), area and population (1950), by regions
Region
I ___ ------------------------
~k== = ==== ========= == = == = = = IV_------------------------Other United States ______ _
Deaths Area Po pula· tion
Percent of Percent of Percent of Number United United United
6,563 1, 702
352 125
0
States States States total total total
75.1 19.5 4.0 1.4 .0
18.4 15.6 9.6
19.2 37.2
18.7 26.6 32.2 3.2
19.3
TotaL_______________ 8, 742 100.0 100.0 100.0
. TABLE 18.-Tornado deaths (1916-53), per unit area and population (1950)
Region
I ___ ----------------------II .. _____________________ _ III ______________________ _
IV-----------------------Other U. 8---------------
Area Deaths per Population Deaths per (thousand thousand (hundred hundred
square square thousand) thousand miles) miles
554.3 470.2 291.3 577.6
1, 129.0
11.8 3.6 1.2 .2 .0
281.9 400.8 487.4 47.7
289.2
23.2 4.2 .7
2.6 .o
17
:fatalities. Even within the transitional eastern and western sections o£ Region I, tornado deaths are about as continuous and the pattern o:f death areas about as dense as they are in any area o£ comparable size outside the region.
In ~umber o£ tornado-death days, that is, days on which one or more tornado fatalities were reported within its boundaries, Region I with 406 . l ' ' IS a so outstanding (table 19). This notable fre-quency o£ death days is likewise reflected in the ~igh prop_ortion: nearly hal£, o£ its death-reportIng counties whiCh recorded fatalities on two or more days (table 20). Even more conspicuous is the _position of Region I in higher death-day categories; o£ 54 counties in the United States which experienced 4 or more death days, all but 3 are situated in Region I. This heavy concentration of multiple-death-day counties in Region I is strikin~ly depicted on the county map (chart 18), whiCh shows the geographical distribution of all counties reporting tornado fatalities on two or more days.
Region I also stands flrst in number o£ fatalities per tornado-death day, 16 persons (table 19). Even more commanding, however, is the margin
TABLE 19.-Tornado-death days, average number of deaths per death day and largest total on any day by regions 1916-53 , '
Region
Number of Average Highest tornado- number death total
death of deaths any calen-days per tornado- dar day
406 190 86 48
death day
16.2 9.0 4.1 2.6
788 150 90 17
TABLE 20.-0ounties having 2 or more, 3 or more, .q or more, and 5 or more tornado-death days by regions 1916-53 , ,
2 or more 3 or more 4 or more 5 or more
Region Percent Percent Percent Percent No. ofre- No. ofre- No. ofre- No. ofre-
gional gional gional gional total total total total --------------
I ___ ----------- 247 47.3 125 23.9 51 9.8 19 3.6 II _____________ 68 22.6 13 4.3 2 .7 1 .3 IIL ___________ 16 18.8 2 2.4 1 1.2 1 1.2 IV------------ 3 5.5 0 0 0 0 0 0

TABLE 21.-Tornado deaths in March and April, Regions I and II, 1916-53
Deaths on all days Deaths on days with 25 or more deaths
Region Percent of Percent of
Number regional Number March-total April total
I.--------------------------- 4,117 62.7 3,312 80.4 II.-----~--- __ --------------- 385 22.6 206 53.5
by which Region I leads all others in maxi1num number of deaths reported on any calendar day. On March 18, 1925, within Region I, tornadoes killed or fatally injured the staggering total of 788 persons (table 19) .
Widespread tornado deaths are most peculiarly identified with areas in Region I in March and April (charts 4 and 5). Indeed, more than threefifths of all tornado deaths in this region occurred in March and April, and days with 25 or more :fatalities accounted for slightly over :four-fifths of the 2-month regional total (table 21).
Region I is subjected to violent tornadoes with a :frequency exceeding that of any other part of the country, but this important :factor alone could not guarantee a single :fatality. To have tornado deaths there must be people. With a population exceeding 28 million (table 18) , Region I has plenty of inhabitants to serve as potential tornado victims. Moreover, though much of the region is still dominantly rural, in many sections the clustering of people in places such as small hamlets, around industrial plants, and in workers' quarters on large landholdings has contributed to some remarkably high spot death totals outside urban communities.
In addition to the :foregoing basic :factors, there are several others that tend to augment the nunlber of tornado deaths in Region I. Among them is the prevalence of lightly constructed houses, sometimes insecurely anchored to :foundations and often without basements that could provide adequate storm refuge. The proportion of this type of housing, typical also of other parts of the warmer South, is certainly higher than in the North where a colder climate demands more substantial dwellings. · The hazard during violent storms in Region I
has been :further increased by the crowding of some of the underprivileged into mere shanties. In storm reports, repeated comments have been made . concerning the disproportionately large
18
number of such unfortunate people who have been killed in 1 or 2 houses, in workers' quarters on plantations, or in congested residential sections of towns and cities. In more than one report it is noted that up to 10 or 15 deaths have resulted when just a couple of buildings were demolished by a small tornado. To say that there has been marked improvement in the quality of housing in recent years does not obviate the :fact that such conditions were more widespread during much of the period under investigation. Moreover, the relative isolation of the underprivileged, a :factor that must have been of much greater importance in :former years when contacts were fewer, education meager, and communications and transportation more limited, has contributed to tornado casualties by putting these people at a disadvantage in diagnosing and getting reports on impending danger.
PATTERN OF DEATHS IN REGION I
vVithin Region I the pattern of deaths is characterized by the presence of many large spot totals, each represented by a good-sized circle, between which there is a :fairly dense scattering of deaths, individually and in small clusters. As befits the definition of a tornado-death region, this arrangement of :fatalities is typical of most areas within this part of the country.
The Largest Groups of Deaths.-Even the larger, more conspicuous death clusters owe their size and prominence primarily to the effects of single notable storms. Of 17 localized areas in Region I that accumulated 50 or more tornado deaths between 1916 and 1953, the large size of only one, the group at Heber Springs, Ark., depends on increments :from as many as 2 days (table 22). In 11 of the 17 cases, all deaths resulted :from just 1 exceptionally deadly tornado strike; in 5 of the remaining 6, more than :four-fifths of the deaths occurred under similar circumstances.
Most large death groups. mark the place where a mighty vortex passed across a village, town, or city. In Region I, all 5 death clusters numbering more than 100 victims were situated in urban areas, as were 4 of those totaling between 50 and 99 (table 22). O:f the remaining 8, only 1 took place in what might be called strictly rural territory; the other 7 were in small towns and villages of less than 2,500 inhabitants.
The Jl,furphysboro Tornado.-Some of the larger

TABLE 22.-LocaUzed death gro'Ups in Region I consisting of 50 or more persons, 1916-53
Number Number of deaths Date(s) of of deaths, Popu-
Place repre- major death major lation* sen ted strike(s) death
by circle strike --
Murphysboro, Ill. area ________ 240 Mar. 18, 1925 240 8,182 Tupelo, Miss. area ____________ 223 Apr. 5,1936 216 8,212 Gainesville, Ga. area __________ 205 Apr. 6, 1936 203 10,243 West Frankfort, Ill ___________ 127 Mar. 18, 1925 127 14,683 Waco, Tex ____________________ 114 May 11,1953 114 84,706 Woodward, Okla _____________ 95 Apr. 9,1947 95 5, 915 Poplar Bluff, Mo., area _______ 92 May 9,1927 86 7, 551 DeSoto (town and township),
Mar. 18,1925 76 { 673 IlL------------------------- 76 1,454
Rocksprings, Tex _____________ 72 Apr. 12,1927 72 998 Antlers, Okla _________________ 69 Apr. 12,1945 69 2, 506 Peggs, Okla ___________________ 60 May 2,1920 60 157 Judsonia-Bald Knob area,
Mar. 21,1952 49 { 1,122 Ark _________ ---------------- 59 2,022 Warren, Ark __________________ 55 Jan. 3,1949 55 2, 615 Chilton County, Ala __________ 53 Mar. 21, 1932 51 Rural Griffin, Ind ___________________ 52 Mar. 18, 1925 52 208 Higgins, Tex __________________ 51 Apr. 9,1947 51 675 Heber Springs, Ark ___________ 50 {Nov. 25,1926
June 5, 1916 22} 20 1,401
*Population of chief village, town, or city struck, at census nearest day of highest death total.
death clusters are constituent parts of a whole strinO' of deaths which mark the path of an historic ~torm. Most conspicuous among them is the row of dots and circles across southeastern Missouri, southern Illinois, and southwestern Indiana delineating the path of the storm of March 18, 1925 (charts 16 and 4). The 737 lives claimed by this huge vortex constitute more than 8 percent of all tornado deaths in the entire country between 1916 and 1'953. Included in this astounding total were 234 deaths in the city of Murphysboro, IlL, the largest spot death total in the 38-year period, 127 in \Vest Frankfort, Ill., and 76 in DeSoto town and township, Illinois.7
Henry [15] points out that the tremendous destruction caused by this storm derived in part from the exceptionally large area it swept in view of its width (from 1;4 to 1 mile), and its length (over 200 miles). Granting that this was a vortex of recordbreaking proportions, number and distribution of people were the most important factors determining the number and arrangement of fatalities. Thus in the first three Illinois counties, in which the storm passed over several towns and villages., fatalities numbered 565 over a distance of approximately 48 miles. Conversely, in the last two Illinois counties, in which the storm passed through open countryside, only 66 deaths were reported in a distance of about 44 miles. Moreover, had this storm followed a course across Illinois
1 For all years of record, the Murphysboro total was. exceeded just once, by the 306 deaths at St. Louis on May 27, 1896.
19
but a few miles farther south, the number of deaths would probably have numbered in the tens rather than the hundreds. Indeed, in Missouri where its path, though somewhat narrower, passed through rural territory, fatalities totaled just 13 over a distance of approximately 85 miles.
This storm also illustrates, even if in a negative way, the importance of receiving some warning of the approaching danger, and the need for some safe shelter. In the paper previously referred to, Henry added that the general absence of storm cellars and of houses with basements in this area left few satisfactory refuges. Moreover, he continues, in western Illinois, where casualties were heaviest, few people reported having seen a funnel cloud; when they went into their homes for shelter, many believed that only a severe thunderstonn was approaching.
The Tupelo and Gainesville Tornadoes.-The other two localized death totals exceeding 200 persons are situated in the Southeastern States, and reca.ll the tornado disasters of early April 1936. The laTger of the two consists of 223 fatalities in Lee and Itawamba Counties, Miss. (charts 16 and 5). Of these, 216 were killed in Tupelo on April5, 1936 by a tornado that cut a swath averaging 400 yards in width from southwest to northeast acros.s residential areas of this small city. It is significant to note that this vortex struck at about 2100 LST on a Sunday, when darkness obscured the approaching storm, and many families were probably gathered together in their homes.
A little less than 12 hours later, on the morning of April 6, two funnels, whose paths joined t~mporarily, swept a 4-block-wide path of destru~twn across business and residential sections of Gainesville, Ga. The resulting 203 deaths comprise all but two of those represented by the large circle in northern Georgia (charts 16 and 5).
These two extraordinary death strikes, born of the same atmospheric disturbance and closely related in time, were responsible for one of the most concentrated doses of death ever meted out by tornadoes. In just over 20 hours, between 1400 LST on April 5 and approximately 1000 LST on April 6, 1936, these and other tornadoes claimed the appalling total of 452' live~, chiefly in Mississippi, Georgia, Alabama, and Tennessee. Though split between two calendar days, this is the seco~dhighest 24-hour tornado-death total for the period covered by'this investigation. It is interesting to note that the four largest death clusters, which in:.

elude all those comprising more than 200 :fatalities, occurred in connection with this and the March 18, 1925, series o:f tornadoes. Conversely, it is to this grim harvest o:f deaths by large and violent vortices in urban areas that these two record-breaking tornadic episodes owe their noteworthy rank.
The Waco Disaster.-In contrast to the :four biggest death groups, all o£ which occurred in large towns or in small cities having less than 15,000 inhabitants, the disaster in the city o£ Waco, Tex., on May 11, 1953, accounted £or the fifthlargest group o£ :fatalities in Region I (table 22, charts 16 and 6) .8 Brooks [2] remarks that the tornado responsible :for this catastrophe was the first to strike the downtown section of a large city during business hours. The 114 fatalities which resulted :from this unhappy coincidence are anything but reassuring to those who 1nust live and work in the many rapidly growing urban centers o£ our Southern States.
It is only a matter o:f chance that any o:f the £our largest spot death totals did not happen in a big city rather than in one o:£ the smaller urban settlen1ents. That tornado casualties in the latter areas can equal or exceed those in the former is understandable, however, in view o:f limitations placed on the area subject to tornadic winds by the relatively small diameter o£ even the larger vortices. It is evident therefore that any good-sized town presents a target o£ sufficient dimensions to enable a tornado o:f notable size and development to amass a death toll ranking among the largest.
Large Death Groups in Snwll Towns.-Smaller towns and villages, on the other hand, do not present comparable death possibilities, even when almost completely demolished. There is, for example, the case o:f Rocksprings, Tex., seat o:f Edwards County, a small town with a population o£ about 1,000. On April12, 1927 a tornado, which passed directly overhead, virtually wiped out the settlement and left but 12 standing buildings, o:f which 6 were badly damaged. Jarboe [20] ren1arks that no town was ever more nearly destroyed by a tornado, an observation that seems credible in view o:f the extreme violence o£ the storm and the :fact that the width o£ its destructive path across the 1-square-mile townsite varied between o/8 and 1 Ys miles. The resulting death
8 The 115 fatalities at Flint, Mich., in Region II, constitute the fifth-largest localized group of deaths in the country, as well as the largest total in a big city between 1916 and 1953.
20
toll, one o:f the largest for any· town under 2,500 population between 1916 and 1953, was 72 person~ (charts 16 and 5).
Among still smaller communities, the disaster at Peggs, Okla. on May 2, 1920 may well serve as an example of the most inexorably deadly tornado strike ever recorded in this country. In a town occupied by less than 200 persons, fatalities ultimately reached a total o:f 60 (charts 16 and 6). Reihle [24] notes that :few except those who sought the protection o:f storm cellars escaped injury. Ironically the only undamaged structure left in town is said to have been a :frame building used as a jail. The malicious caprice o:f this violent storm is :further illustrated by its brief but devastating contact with the ground. The vortex hopped a range o:f hills to the west of town before descending into the valley, where it carved a 1nile-wide path o:f utter desolation just 3 miles long, and then lifted without leaving :further traces.
This sa1ne calamity also illustrates the distressing delay in aid that has sometimes followed such complete destruction in an isolated community, especially a generation ago. Reihle relates that during the evening o:f that day many people west o£ Peggs watched the tremendous cumulus cloud with which the tornado was subsequently known to have been associated, and had observed the bright rays o:f the setting sun on its top as well as the intermittent glow o:f lightning from within. Yet it was 6 hours before news o£ the disaster reached the nearest town :from which calls :for aid could be dispatched.
Though death possibilities are more limited in villages such as these, it is clear nevertheless that a square hit by an unusually well-developed vortex can result in fairly high casualties even in small communities.
Large Death Groups in Rural Areas.-The 53 deaths in Chilton County, Ala., constitute the only instance among the 17 largest death clusters· in Region I where fatalities did not occur chiefly or exclusively in a village or larger node o:f settlement (table 22). Fifty-one o£ these fatalities occurred on March 2'1, 1932, in rural areas northwest o£ Clanton. On this memorable March afternoon and evening, a series o£ at least 10 tornadoes scourged widespread areas in central and northeastern Alabama, leaving in their wake a total o£ 268 dead and dying victims in 13 counties (charts 16 and 4). This series o:f storms is remarkable

because of the large number of deaths amassed in rural areas. Not more than a few tens of the victims lost their lives in good-sized towns; well over half of the death total took place in farming districts.
I ndividuaZ Deaths and Smaller Gro1JJps.Though the very large death clusters to which reference has been made constitute prominent features of tornado-death distribution as portrayed on the maps, individual deaths together with those in medium-sized and smaller clusters comprise a majority of all fatalities in Region I. Such deaths represent either the work of small tornadoes, or instances where well-developed vortices passed through farming country, or failed to cut squarely across a compact settlement. It is these much more numerous but less spectacular death strikes, spread over many different days and affecting many different districts which serve to fill out the pattern of deaths in Region I and impart to that pattern its notably continuous distribution of deaths.
Atypical Areas in Region /.-Though the pattern of deaths within Region I possesses a considerable measure of uniformity, there are some systematic departures fron1 the prevailing mode of distribution. Most striking is the absence of deaths in southern vV est Virginia, and in many parts of eastern Kentucky and Tennessee (chart 16). Though people are few in some localities within these areas, which lie in the Appalachian Plateau, the overall density of population is actually greater here than in many other parts of Region I where tornado deaths are far more numerous (chart 19) . On the other hand, there is a very close correlation in these areas between lack of deaths and lack of reported tornadoes (charts 16 and 20). Though there is little doubt that the seemingly complete absence of tornadoes over such wide areas is but a reflection of incomplete reports from these remote and uncommunicative districts, it is probable that the number of all tornadoes is far less, and it is certain that the incidence of exceptionally destructive ones is much lower than in the heart of the tornado country farther south and west.
This waning tornado activity is probably the
420320-57-4 21
joint result of topography and increasing distance from the center of the chief tornado belt. The probable significance of topography is suggested by the manner in which the belt of substantial tornado-death activity is projected far out across the Atlantic slope, around the southern end of the Blue Ridge (chart 16).
Despite the apparent influence of topography on tornado activity in the Appalachian Plateau section of Region I, it is significant to notice that neither altitude nor topographic barriers seem to preclude the occurrence, at least occasionally, of extremely violent tornadoes. Within Region I, the series of vicious storms that claimed a total of 29 lives in northeastern Tennessee on March 14, 1933, bears witness to this fact. This situation is even 1nore emphatically demonstrated by the historic series of storms that killed 150 persons on June 23, 1944, a little farther north, in the Region II section of the Appalachian Plateau. Indeed, it is primarily because of its apparent notable, if infrequently realized, tornado-death potential that this doubtful area is included with Region I.
The other obvious large-scale departure from the pattern of death distribution generally prevalent in Region I is in central and southern Texas. The Inarked decline in density of deaths in this area (chart 16) is 1natched by a similar decline in density of population (chart 19) and in number of tornadoes reported (chart 20). Undoubtedly the chief factor in this instance is declining population. It is to be doubted that there is anywhrte near a commensurate dEcrease in the frequency or severity of tornadoes. In any event, the obvious relationship between areal distribution of reported tornadoes and of population, especially around Austin and Abilene, seems to corroborate the assumption that previous reports '£rom less densely settled areas are probably not representative.
In spite of a decline in density of deaths, these parts of Texas have many more tornado fatalities and an obviously higher death potential than peripheral areas farther south and. west. In these and most other respects this transitional area resembles more closely adjacent parts of Region 1 and, hence, is included with them.

:R.EGION IT
ToRNADO-DEATH CHARACTERISTICS oF REGION· II
Though Region II includes many Midwestern areas closely identified with tornadoes, and though it ranks secondin.every chosen category of statistics, the general level o:f tornado-death activity therein is far below that of Region I.
The 1702 tornado fatalities reported from Region II (table 17) comprise scarcely more than one-quarter the total for Region I, in spite of the fact that Region . II has an area but slightly smaller and a population substantially larger than those of the former region (table 18) . Then, too, the number of tornado-death days for Region II is less than half the comparable figure for Region I, and the average number of fatalities per death day; 9, is only a little more than half as many (table 19). The absolute daily death maximum in Region II, 150 persons on June 23, 1944, marks an even wider departure fron1 the comparable total of 788 deaths reported in Region I on that fateful March day nearly 20 years earlier.
The marked disparity between Regions I and II in number and geographical distribution of multiple-death-day counties has already been noted (chart 18). In fact, fewer than one-quarter of all death-reporting counties in Region II experienced two or n1ore death days, and a negligible· fraction of 1 percent had four or more (table20). "
Region II also lacks the conspicuous continuity in distribution of death areas characteristic of Region I (chart 17). Whereas death areas predominate in the heart of the. latter region, in Region II the arrangement of death areas is chiefly elongate or isolated, and most are embedded in large expanses of no-death territory.
It is not until May and June that tornado deaths become widespread in this part of the country (charts 6 and 7). Indeed, deaths in these 2 months constitute nearly three-fifths of the annual total in Region II (table 23), a very nearly complete reversal of the comparable figures in Region I (table 21). Thus the :r,eak of the tornado-death activity in Region II occurs later in the season.
Most important cause for the sharp drop noted in tornado-death activity in Region II, compared with Region I, is the lesser frequency of extremely violent tornadoes, especially those occurring 1n
groups or families. But there are other factors. Thus in the Midwest the prevailing pattern of rtiral·settlement is dispersed, with each farmhouse set apart froi:nthose nearby. Moreover, the generally well-informed, weather-wise farmers possess a considerable awareness of local. signs that presage. the possibility of tornadoes. In the western part of Region II in particular, storm cellars are cmmnon, and they are used with great effectiveness during. periods of threatening weather. Under such conditions, . and with fewer exceptionally violent tornadoes, the size of casualty lists resulting from death strikes in farming areas is much smaller than in Region I.
In the central and eastern part of Region II, on the other hand, the high degree of urbanization tends to. counteract somewhat the advantages deriving from the generally dispersed character of rural settlement. Here, if it were not for a marked decrease in tornado activity, much more numerous deaths in urban areas would raise substantially the level of tornado-death activity in the region as a whole.
PATTERN OF DEATHS IN REGION II
In Region II the pattern of deaths consists of a fairly uniform scattering of deaths, individually and in small clusters, punctuated in just a few places by a large localized group. In contrast to Region I, very large clusters are far less numerous, and in no sense do they constitute the backbone of death distribution. Compared with Region I, there is also a remarkable decline in the density of deaths, partly because of the small size of most scattered death groups, and partly because of the relatively large areas of few or no deaths that separate the individual units.
TABLE 23.-Tornado deaths in May and June, Regions I and II, 1916-53
Deaths on.all days Deaths on days with 25 or more deaths
Region Percent of Percent of
No. regional No. May-June total total
! ____________________________ 1,446 22.0 1,095 75.8 11.-------------------------- 991 58.3 661 66.7

Large Groups of Deaths.-In Region II there are but 6 localized groups o:f deaths consisting o:f 50 or more persons, and only:;! others having :from 25 to 49 (table 24) . Each o:f these 8 large clusters owes its size to the deadly effect of just 1 vortex. Moreover, without exception the place struck was some city, town, or village. The three biggest occurred in urban areas of large or medium size. Only one, the smallest, was in a town o:f less than 2,500 inhabitants. In contrast to Region I, the largest localized group o:f deaths in strictly rural areas within R.egion II was the 15 perons killed near Oberlin, Kans.
In view of the exclusive association in Region II o:f very large death groups with tornado strikes in urban areas, it is interesting to note that 5 o:f the 6 accounting for more than 50 :fatalities occurred along or east of the Mississippi River, where the higher proportion o:f urban inhabitants results in larger and more vulnerable targets than exist :farther west. Included in these 5 are the 4largest, all o:f which had 75 or more :fatalities. In contrast to Region I, at least :for the 38-year period covered by the investigation, no tornado strike in a small village resulted in a death total o:f notable size. In fact, except for Tyler, Minn., no community o:f less than 2,500 inhabitants in Region II suffered more than 19 tornado :fatalities.
The Flint Disaster.-In spite o:f the large death toll ( 115) at Flint, Mich., on June 8, 1953, the tornado responsible for this disaster completely missed the heart o:f the city. All deaths in that vicinity took place along an· 8-mile, east-west path through residential areas in the city's northern suburbs. The vortex was large and well developed; where it struck the northern outskirts o:f Flint its path of destruction is said to have been one-half mile wide. According to the report o:f an aerial survey made by personnel o:f the Detroit office o:f the "'\V eather Bureau [29 J, this storm displayed a remarkable persistence in :following eastwest sections of highways, a peculiarity that greatly increased the number of casualties and the damage to property.
The St. Louis Tornado of 1927.-Though the September 29, 1927, tornado in St. Louis, Mo., passed northwest o:f the business district, its path lay well within the city limits, and crossed closely built-up and densely settled areas. That casualties were not even higher than the 72 reported :fatalities can be attributed, perhaps, to its· rather
23;
TABLE 24.-Localizea aeath groups in Region II consisting ot 25 or more persons, 1916-53
Number of
Place deaths Date of major repre-sen ted
death strike
by circle
Flint, Mich ___________________ 115 June 8,1953 St. Louis, Mo., area .......... 80 Sept. 29, 1927 Lorain, Ohio, area ............ 78 June 28,1924 Shinnston, W.Va., area ______ 75 June 23,1944 Fergus Falls, Miun ___________ 59 June 22, 1919 Mattoon, Ill_----------------- 54 May 26,1917 Charleston, Ill ................ 38 May 26,1917 Tyler, Miun __________________ 36 Aug. 21, 1918
Number of
deaths, major death strike
115 72 73 72 59 54 38 36
Popu-lation*
163,14 821,96 37,29
3 0 5 7 1 2 5 8
2,81 7,58
13,55 6,61
85
*Population of community hit, at census on date nearest to the death strike.
discontinuous path, and to the :fact that the storm caused general destruction over only a 2¥2-mile portion o:f its path. In making the obvious comparison between this vortex and the great St. Louis tornado o:f May 27, 1896., Hayes [14] offers the considered opinion that the more recent one was probably not as violent.
The Mattoon Tornado.-Though death totals in the two small citie~Mattoon and Charleston, Ill., struck by this tornado, are not among the largest in Region II, they are o:f special interest because of the noteworthy characteristics of the storm. The tornado in question was first observed in western Illinois, close to the Mississippi River, at about noon on May 26, 1917. During the next 7 hours and 20 minutes it traveled nearly 300 miles to southeastern Indiana, the longest tornado path ever recorded. This vortex was most destructive in the 10 miles between Mattoon, where 54 persons were killed, and Charleston, where 38 more lost their lives. In J\!Iattoon most o:f the damage took place in a section o:f the city occupied by small cottages o:f working people; in Charleston there was extensive destruction in both residential and business districts. This well-developed storm caused but 11 additional deaths elsewhere along its path, which passed chiefly through rural areas.
The Hennipirv. Oounty, Minn. Tornadoes.-One more :feature o:f death distribution in Region II seems to merit comment. Though :few counties in this part of the country reported deaths on more than two days, Hennipin County, Minn. recorded the remarkable total of five death days between 1916 and 1953 (chart 18). The most obvious explanation :for this unusual situation seems to be the coincidence o:f a very large population center and an area o:f considerable tornado activity in sum-

mer months. In several instances light to moderate casualties have resulted from passage of tornadoes across densely settled districts. The fact that southern Minnesota is subject to notable tornado-death activity in summer is also suggested
by the fact that both Fergus Falls and Tyler, the only places west of the Mississippi River having 25 or more tornado deaths during the period covered by this study, are both situated in this general area.
TORNADO DEATHS IN PERIPHERAL AREAS
Tornado deaths in peripheral areas were generally few and scattered. Together, Region III, which borders the heart of the tornado-death country on the east and south, and Region IV, which adjoins it on the west, accounted for scarcely more than 5 percent of all tornado :fatalities between 1916 and 1953. Of the two, Region III, with 4 percent of the 38-year national total, ranked higher in nmnber of persons killed.
REGION Til
With 352 tornado fatalities, Region III displays a sharp drop in numbeapf deaths compared with Regions I and II (table 17). In most other categories of tornado-death statistics too, Region III as a whole is far outranked by either Region I or II (tables 18, 19, and 20). However, within Region III, which extends through nearly 2'0° of latitude and embraces areas having marked differences in population, there are some noteworthy contrasts in tornado-death characteristics.
The Northeast.-In the Northeast, from Pennsylvania and New Jersey northward, deaths were generally few and extremely scattered. The one notable exception was Worcester County, Mass., where one remarkable tornado claimed a total of 90 lives on June 9, 1953 (charts 16 and 7). Seventy-eight of these fatalities occurred over a distance of about 8 1niles in densely settled sections of Holden, Worcester, and Shrewsbury. The grim irony of the unhappy coincidence which caused the path of this formidable vortex to cross a succession of towns and cities is emphasized by the relative obscurity of a contemporaneous tornado which cut a 29-mile swath several miles south and east of the Worcester storm (see [23]). According to the Weather Bureau [32], this second storm was well-developed and potentially devastating, hut property damage was light and fatalities lacking because its path lay mostly over wooded territory.
Most important reason for the generally low
level of tornado-death activity in the Northeast is infrequency of violent tornadoes. On the other hand, the large population and high degree of urbanization enhance considerably such limited tornado-death possibilities as exist in this part of the country.
The Southeast.-Between Maryland and. the southern end of the Florida peninsula, though number of people and density of population show a substantial drop in comparison with the Northeast section of Region III, the level of tornadodeath activity does not. In the Southeast tornado deaths were not only more numerous, but their distribution was more continuous, and individual death units generally included more fatalities than in the Northeast (chart 16). Moreover, the tornado-death picture was not so completely dominated by the work of one unprecedented storm.
However, within the Southeast there were two rather large areas where deaths were either few or absent. No tornado deaths were reported in the more mountainous sections of Region III, between Maryland and North Carolina (chart 16), whether the consequence of a virtual lack of tornadoes (chart 20) because of high altitude and rough topography, or just a fortunate failure of occasional vortices to strike with sufficient force in populated areas. On the other hand, in thE. Florida peninsula tornado deaths were sparse, but not absent. In the latter area there seems to be no dearth of tornadoes, but such storms reported :from Florida have short, narrow paths, and cause little damage and few, if any, casualties.
The markedly high level of tornado-death activity in other sections of Region III, between Virginia and Georgia, may result from their position in the lee of the highest portion of the Appalachian Highland. Fawbush, Miller, and Starrett [7] find indications of a small regional maximum of tornado frequency about 100 miles east of the mean Appalachian ridge. It is also possible that this part of Region III, lying as it does to the leeward

TABLE 25.-M onths having greatest concentration of tornado deaths, Gulf Coast section of Region III, 1916-53
Months
Nov.-Apr------ __________________________________ _ All other ______ --------- ____________________ ------_ TotaL __ ------------------------------------------
Tornado deaths
Number Percentofre· gional total
74 6
80
92.5 7.5
100.0
of Hoegion I, shares in a very limited degree the high level of tornado-death activity of that part of the country. In any event, 19 of 50 fatalities reported from North Carolina between 1916 and 1953 occurred on two days marked by higher casualty lists in nearby areas within Region 1.9 _
The Gulf Ooast.-Along the Gulf Coast, from the Florida Panhandle westward, the density and distribution of tornado deaths is not unlike that on the Piedmont and Atlantic Coastal Plain of Virginia and North Carolina (chart 16) . However, along the Gulf Coast, the density of tornado tracks is even greater than in the latter area (chart 20), and the number of counties reporting deaths on two or more days exceeds the combined total in all other parts of Region III (chart 18) .
The fairly high level of tornado-death activity suggested by these comparisons with other sections of Region III results primarily from the deadly work of frequent tornadoes, many of which are quite severe but none of which causes damage over a very wide or very long path. As might be expected from its southerly location, death-dealing tornadoes in this area are concentrated in winter (table 25), a fact that may contribute to the moderate intensity of these storms. That such vortices cause no more fatalities is to be attributed not only to the limited area they customarily sweep, but also to the generally low density of rural population in this part of Region III.
The pattern of tornado deaths along the Gulf Coast, like the population, is scattered (chart 16). Most conspicuous, perhaps, in comparison with either nearby parts of Region I or other sections of Region III, is the complete absence of any localized group of deaths as large as 10. In view of the
o The 13 deaths in Greensboro and vicinity and one near Mebane on the evening of April 2, 1936, followed a 24-hour death toll of 31 persons in Region I sections of Alabama and Georgia. Four deaths in Chatham County and 1 in Martin County took place on Apr. 30, 1924, a day when 106 persons lost tlleir lives in parts of South Carolina, Alabama, and Georgia lying within Region I.
25
fact that the Gulf Coast has many urban centers, including several large cities, it would not be surprising to find that long-range tornado-death potentialities in this section of Region III embrace a 1-day maximum considerably higher than the record of 7 persons between 1916 and 1953.
REGION IV
The keynote in Region IV is few and scattered deaths in an area having considerable tornadic a.ctivity but low population density. For the entire 38 years, tornado fatalities total a mere 125 (table 17). Moreover, areas in which these deaths occurred are more isolated and more widely scattered than those in any of the other three tornadodeath regions (chart 17). The 48 tornado-death days, though small in an absolute sense, are fairly nmnerous in view of the size of the death total. The wide distribution of deaths among death days is also reflected in the size of the absolute daily maximum, just 17 fatalities (table 19). There is also but slight tendency for tornadoes to strike repeatedly in one area; of 55 counties over which the 125 deaths were scattered, only 3 reported deaths on more than 1 day, and none on more than 2 (table 20).
Most important among reasons responsible for this very low level of tornado-death activity in Region IV are small population and wide dispersal of settlement. Indeed, when the small population is taken into consideration, tornado deaths in Region IV amount to between two and three persons per 100,000 inhabitants, well over half the comparable figure for Region II and nearly four times that for Region III (table 18) . Though the frequency and intensity of vortices in Region IV are apparently sufficient to support a substantially higher level of tornado-death activity but for the notably sparse population, it is doubtful that the destructive capability of tornadoes in this part of the country is, in general, equal to that in Region I. Indeed, many funnels reported from these western plains are small and evanescent, and some never even reach the ground. These characteristics typical of tornadoes in Region IV doubtlessly help to reduce the number of deaths below what might otherwise be expected in view of the probable frequency of their occurrence.
Among other factors which contribute, at least in a minor way, to the low level of tornado-death

activity in Region IV are the conspicuous development of funnels and the generally level topography. Henry [16] has observed that funnels seem generally to be more clear""cut and well defined in the Plains States than they are along the Gulf and Atlantic slopes. Beebe [1 J comments that many photographs of tornadoes are of those associated with a type of airmass especially common over western and northern Plains States in sumn1er and with which excellent visibility is customarily associated. The generally level topography and unobstructed outlook over wide areas in Region IV permit such prominent funnels to be seen and followed for miles over the prairie. As a consequence, the approach of a tornado is frequently more easily apprehended in these lands
26
than in the East, and people are more likely to seek safe shelter or avoid the path.
The pattern of deaths within Region IV is quite simple. Largest spot total is the 10 persons killed in one hpuse a few miles northeast of Thurman, in Washington County, Colo. This death group, though larger than any other, is typical of the tendency of deaths to be scattered individually or clustered together in one spot. Usually each of these units represents the place where the path of some well-developed vortex passed across a town, a school, or a farm. Moreover, in but few instances is there any connection in time or in space between adjacent units. In all these respects the pattern of deaths reflects the work of occasional well-developed tornadoes in a region whose population is small and widely dispersed.

CHAPTER III
CONCLUSIONS
Two factors are inseparable for the occurrence of tornado deaths. They are, obviously, tornadoes and people. In the United States, which has both a high incidence of tornadoes and many people, from a few tens to several hundreds of persons lose their lives each year as a result of these devastating windstorms. However, because of variations in the distribution of population as well as in the seasonal and areal distribution of tornadoes, there are marked contrasts from one part of the country to another in the number and seasonal regime of tornado deaths.
Since tornadoes have now been reported from all States, there is no pa.rt of the country that can be said to enjoy complete immunity from the possibility of tornado deaths. There are, however, quite extensive regions where the hazard to life from this source is so slight as to be practically nil. Foremost among them is the Pacific Slope, west of the Cascade-Sierra. Nevada divide. Only slightly greater risk exists elsewhere in the Western Highland, and in the eastern United States in the vicinity of the Canadian boundary, east of western Minnesota.
It is within the remainder of the United States that tornadoes constitute· a significant peril to life. In each of the four tornado-death regions there is what might be. called a basic tornado-death hazard, which depends chiefly on the frequency and severity of tornadoes, and the number and distribution of people. Granted this basic hazard, it is possible to reduce it by any of several means. On an individual basis, people will always attempt to get out of the path of a vortex or reach safe shelter once they have become aware of the in1pending danger. In recent years, vVeather Bureau tornado alerts, covering quite limited areas, represent a most significant break-thtough, which can be exploited on an organized and effective basis to protect whole communities. Far beyond the foreseeable future, there is the as yet doubtful prospect of weather control. All these and other factors may in the future alter substantially the degree of risk in any region. It should be under-
27
stood, however, that as long as people and tornadoes occupy the same space they constitute a predisposing cause of tornado deaths that must be evaluated and overcome. And overcoming this susceptibility to casualties will always be realized at a cost, in money, in foresight and painstaking planning by disaster agencies, and in intelligent cooperation by the public. It is appropriate, therefore, to examine regional contrasts in this basic death hazard as indicated, at least to a first approximation, by experience over the period from 1916 through 1953, and to relate the varying degree of risk to certain obvious preventive measures.
The greatest basic tornado-death potential exists in south-central United States, within that part of the country identified as Region I. This region suffers the highest incidence of devastating vortices, and, probably, the most violent ones as well. Lacking effective tornado-death control, all parts of the region face the grim possibility of tens or hundreds of tornado casualties. In urban cen~ ters the death possibilities are extremely high, with maximum probable totals numbering in the hundreds. Moreover, the rapidly increasing urbanization in this pa.rt of the country constitutes a further incentive to expand the positive deathreduction measures already initiated. Though the maximum expectable toll in small villages is substantially less, perhaps 50 to 75 persons, such communities are liable to almost complete destruction. This latter prospect coupled with the general absence of tornado-proof buildings complicates death-evasion plans in small population centers. However, in Region I, every community, large or small, should undertake positive disastercontrol measures. Even strictly rural areas, if moderately de,nsely populated, may experience widespread fatalities. In the latter areas perhaps the best solution is the construction of sufficiently numerous storm cellars, and schooling of the inhabitants in their effective use.
Though the basic tornado-death danger in that portion of the North Central States lying within

Region II is substantially lower, the possibility of sudden death from these violent storms is still a threat with which to reckon. In this part of the country only cities and large towns seem to present targets of sufficient size to be in danger of largescale disaster. However, in small villages deaths may occasionally number as many as a few tens. It is apparent, then that the potential risk is sufficiently great in all these population centers to justify the expense and effort needed to organize for an effective reduction of tornado casualties. In the open countryside, tornadoes may claim frmn one to ten or more lives on individual farmsteads at intervals along their paths. Fortunately in these areas storm cellars are already used effectively. Chiefly what is needed is an increase in the number and distribution of these refuges, especially in eastern North Central States, and an imaginative use of steadily improving tornado alerts.
In Regions III and IV, where the basic death hazard is far below that in the other two regions, the need for elaborate plans to reduce the number of deaths is open to some question. In the Northeast, infrequent well-developed vortices striking in large towns or cities constitute the only important danger to life from tornadoes. In view of the high degree of urbanization, positive preventive measures are probably worth the price. The same, however, cannot be said for rural areas in this part of Region III.
The tornado-death risk appears to be very small in Inost of peninsular Florida, too. However, in view of necessary hurricane precautions in this area,, it might be improvident to neglect to dovetail some measure of tornado protection into local disaster control, at least in urban areas.
In other parts of the Southeast lying within Region III, as well as the Gulf Coast section of the same region, the tornado-death hazard is relatively higher, though still small in an absolute sense. In these areas the danger in urban centers is certainly great enough to demand precautions to reduce tornado casualties, even if no danger were to exist from hurricanes.
In the Great Plains, tornado-death potentialities are also small, but in this instance the limited .danger depends very significantly on low density of population. This latter fact constitutes a clear warning to growing cities, which are most numerous in the Southern Plains, not to depend too heavily on past immunity for protection. Though
28
the death ]:lazard is rather small in rural areas, the unequalled ease with which funnels can be observed throughout the Plains encourages a continually expanding and more effective use of local signs in conjunction with whatever official tornado alerts may be possible in this sparsely inhabited, windward section of the chief tornado belt.
From season to season there are considerable fluctuations in the mean basic hazard in any given region. Thus in winter the possibility of tornado deaths is so slight as to be negligible anywhere in northern United States. In the North Central States tornado disasters occur rarely as early as March; in the Northeast there is little possibility through May. By October the danger throughout the North has again dropped to a very low level. Even the chief centers of tornado-death activity in the South have a seasonal respite :from the specter of sudden death. By June the death possibilities are small in Southeastern States, and much reduced in the Southwest. From July to late September, the risk is very small anywhere in the South.
It is a well-known :fact that people in many communities or localized areas, even within the chief tornado belt, have considered the immediate vicinity in which they reside to be iminune from tornadic destruction. In some instances this belief seems to have evolved primarily as a result of prolonged freedom from tornado disaster. In other instances the opinion seems more firmly based on some tangible consideration, such as the existence of a topographic barrier to the windward, or location on the shore of a large lake. The record is replete, however, with cases of tornado strikes, some of them disastrous, in places whose site was hopefully supposed to be tornado-proof. At least until a great deal more is known about the mechanism that gives rise to tornadoes, and the complex factors that control their trajectories as well as their decline, it is. unwise to depend for protection on such baseless assumptions.
On the contrary, far into the foreseeable future the only justifiable precaution against tornado deaths in those parts of the country where a sig~ nificant basic risk exists is the planned use of Weather Bureau alerts and any local signs of an approaching vortex. In this connection it. is significant to note that the capabilities of meteorologists do not in the foreseeable future embrace the control of tornadogenesis, or of the trajectories or

life cycle of tornadoes already in progress. For the time being at least, the saving of lives depends strictly on control of the position and movements of people. However, with enthusiastic public
support, and with the technical know ledge now becoming available, prospects for cutting the ex· pectable annual tornado death toll in this country appear to be brightening rapidly.
REFERENCES 1. R. G. Beebe, "Types of Airmasses in ·which Tor
nadoes Occur," Bulletin of the American M eteorological Society, vol. 36, No. 7, Sept. 1955, pp. 349-350.
2. E. M. Brooks, "Tornado Tragedies of 1953," Weatherwise, vol. 6, No. 4, Aug. 1953, pp. 100-103, 110.
3. E. M. Brooks, "Tornadoes and Related Phenomena," Compendium of Meteorology, American Meteorological Society, Boston, 1951, pp. 673-680.
4. T. R. Brooks, "The Tornado in Southern Maryland, November 9, 1926," Monthly Weather Review, vol. 54, No.11, Nov.1926, p. 462.
5. P. C. Day, "Weather Bureau Gets Data on Behavior and Effects of Tornadoes," 1930, Yearbook of Agriculture, U. S. Department of Agriculture, Wash· ington, D. C., 1930, pp. 530-534.
6. E. J. Fawbush and R. C. Miller, "The Types of Airmasses in which North American Tornadoes Form," Bulletin of the .American Meteorological Society, vol. 35, No. 4, Apr. 1954, pp. 154-165.
7. E. J. Fawbush, R. C. Miller and L. G. Starrett, "An Empirical Method of Forecasting Tornado Development," Bulletin of the .American Meteorologi· cal Society, vol. 32, No. 1, Jan. 1951, pp. 1-9.
8. J. P. Finley, "Tornado Studies for 1884," Professional Paper No. 16, U. S. Signal Service, Washington, D. C., 1885, 15 pp., 74 charts.
9. S. D. Flora, Tornadoes of the United States, University of Oklahoma Press, Norman, Oklahoma, rev. ed., 1954, 221 pp.
10. J. R. Fulks, "The Instability Line," Compendium of Meteorology, American Meteorological Society, Boston, 1951, pp. 64 7-652.
11. J. R. Fulks and C. D. Smith, Jr., "A December Storm Accompanied by Tornadoes," Monthly Weather Review, vol. 78, No. 12, Dec. 1950, pp. 220-225.
12. S. S. Gaigerov, "Synoptic Conditions Accompanying Tornadoes in the United States during 1884," Bulletin of the American Meteorological Society, vol. 21, No. 6, June 1940, pp. 229-236.
13. D. L. Harris, "Effects of Atomic Explosions on the Frequency of Tornadoes in the United States," Monthly Weather Review, vol. 82, No. 12, Dec. 1954, pp. 360-369.
14. M. W. Hayes, "The St. Louis Tornado of September 29, 1927," Monthly Weather Review, vol. 55, No. 9, Sept. 1927, pp. 405-407.
15. A. J. Henry "The Tornadoes of March 18, 1925," Monthly Weather Review, vol. 53, No. 4, Apr. 1925, pp. 141-145.
16. A. J. Henry, "Tornadoes of 1889-1896," Report of Chief of the Weather Bureau, .1895-1896, Washington, D. C., 1896, pp. xxiii-xl.
29
17. J. E. Hissong, "Whirlwinds at Oil-Tank Fire, San Luis Obispo, Calif.," Monthly Weather Review, vol. 54, No. 4, Apr. 1926, pp. 161-163.
18. E. W. Holcomb, "Jay and Adams Counties" in "Papers on Tornadoes. The Thirteen Tornadoes of March 28, 1920: In Indiana," Monthly Weather Review, vol. 48, No. 4, Apr. 1920, p. 194.
19. V. E. Jakl, "Pressure Gradients, Winds, and Tornadoes," Journal of .Aeronautical Meteorology, vol. 1, No. 1, Oct. 1944, pp. 16-22.
20. J. H. Jarboe, "The Rocksprings, Texas, Tornado, April12, 1927," Monthly Weather Review, vol. 55, No.4, Apr. 1927, pp. 182-183.
21. J. R. Lloyd, "The Development and Trajectories of Tornadoes," Monthly Weather Review, vol. 70, No.4, Apr.1942, pp. 65-75.
22. R. E. Murphy and H. E. Spittal, "Movements in the Center of Coal Mining in the Appalachian Plateaus," Geographical Review, vol. 35, No. 4, Oct. 1945, pp. 624-633.
23. S. Penn, C. Pierce, and J. K. McGuire, "The Squall Line and Massachusetts Tornadoes of June 9, 1953," Bulletin of the American Meteorological Society, vol. 36, No.3, Mar. 1955, pp. 109-122.
24. J. A. Reihle, "Tornadoes in Northeastern Oklahoma, May 2, 1920," Monthly Weather Review, vol. 48, No.4, Apr. 1920, p. 211.
25. C. J. Root and W. E. Barron, "The Tri-State Tornado of March 18, 1925," Climatological Data, Illinois Section, vol. 30, No.3, Mar. 1925, pp. 12a-1~d.
26. A. K. Showalter and J. R. Fulks, Preliminary Rep,ort on Tornadoes, U. S. Weather Bureau, Washington, D. C. 1943, 162 pp.
27. M. Tepper, "A Proposed Mechanism of Squall Lines: The Pressure Jump Line," Journal of Meteorology, vol. 7, No.1, Feb. 1950, pp. 21-29.
28. Topeka Daily Capital, May 1, 1942, pp. 1 and 8. 29. U.S. Weather Bureau, Climatological Data, Michigan
Section, vol. 68, No.6, June 1953, pp. 82-83. 30. U. S. Weather Bureau, Climatological Data, National
Summary, vol. 5, No.13, Annual issue, 1954, Table 11. 31. U. S. Weather Bureau, Climatological Data, National
Summary, vol. 6, No.13, Annual issue, 1955, Table 13. 32. U.S. Weather Bureau, Climatological Data, New Eng
land Section, vol. 65, No. 6, June 1953, pp. 105-107. 33. U. S. Weather Bureau, Report of the Chief of the
Weather Bureau, 1925-1926, Washington, D. C., 1927, 253 pp.
34. U. S. Weather Bureau, "Tornado Occurrences in the United States," Technical Paper No. 20, Washington, D. C., 1952, 43 pp.
35. U. S. Weather Bureau, "Forecasting Tornadoes and Severe Thunderstorms,'' Forecasting Guide No. 1. Washington, D. C., 1956.
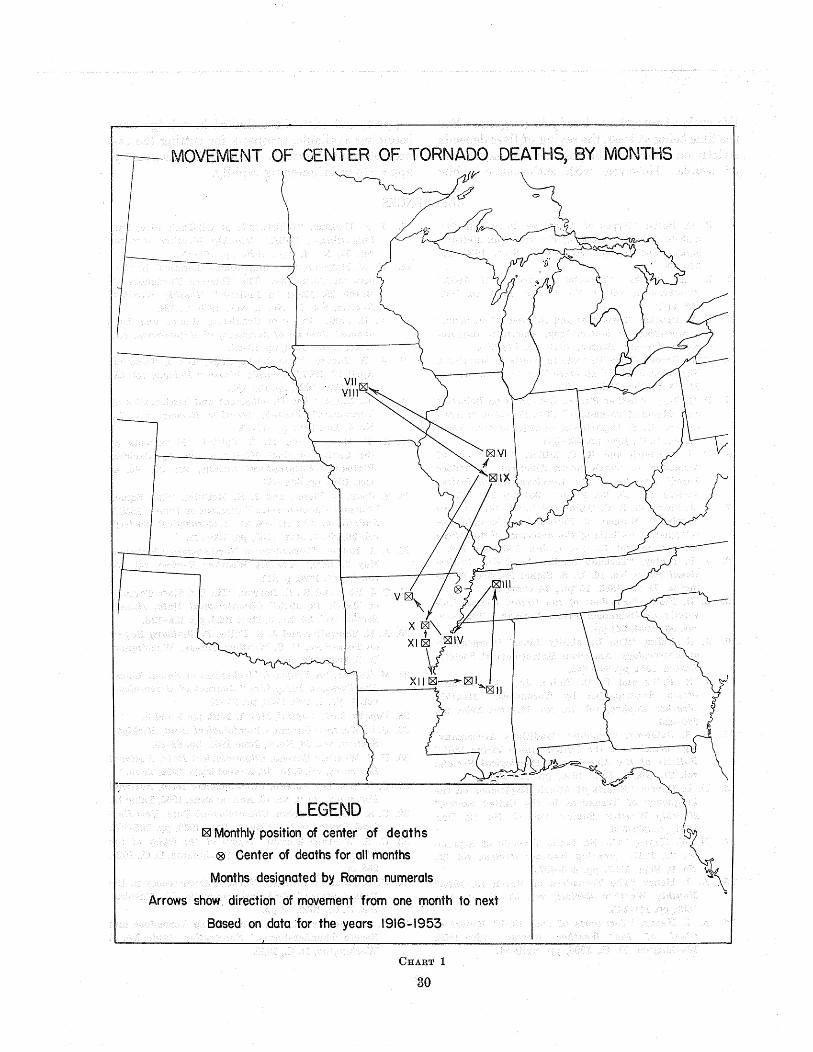
MOVEMENT OF CENTER OF TORNADO DEATHS, BY MONTHS
~~~ ~
X \lf\ XI~ IZJIV
\( XII 1:8:1-~1':1>..
1------L IZlll
LEGEND r8l Monthly position of center of deaths
® Center of deaths for all months
Months designated by Roman numerals
Arrows show. direction of movement ·from one fTIOnth to next
Based on data ·for the years 1916-1953
CHART 1
30

'~ ......
0
TORNADO DEATHS IN JANUARY, 1916-1953 ~
~;iJii. ,:-
CHART 2
LEGEND Graduated circles represent 10 or more deaths
o 10 deaths
0 50 deaths
® 75 deaths
Each dot represents one death
l:8l Center of tornado deaths in January
50 0 100 200 300 Miles

........... I~ /
TORNADO IN
~ to li
(:)-------< LEGEND \ :. Graduated circles represent 10 or more deaths
: \ 0 o 10 deaths
o 25 deaths
G> 50 deaths
Each dot represents one death
~ Center of tornado deaths in February
~ 50 0 100 200 300 Miles
!<':~ ~· ..
CHAnT, 3

·~ ~
·'
\
G
- ~ "( I \ ) \
TORNADO DEATHS IN MARCH, 1916-1953
,. /~· ~ . &;: •• .~ @• '
(_~ 0; . vf'-' .. . · ··. ~~-~~;: ·.f . -~ .: .. ~.·
' • 0 0 • )·. 4 '· • 0 :.
0.. !..!.'e • • r2l · · · · ' ·• r ____,._,
. -;~~--' ... (~. -~:~-.· ; .. ' -::·· ·\~ ~--. . .. ... . r . . ,. . ~ . . . . : . f. ·.. . •• · '~o·· 0 e 0 • }> >~· . .() 0 \
~. ;··~·· •%00 •
.• •• • 00.,
Graduated circles represent 10 or more deaths
o I 0 deaths 0 75 deaths
LEGEND
o 25 deaths 0 125 deaths
o 50 deaths 0 250 deaths
Each dot represents one death
r2l Center of tornado deaths in March
50 0 100 200 300 Miles
CHART 4

~ ~
---~
• •
... · .. \ . /hl2". . · .. · :·:--,~ ..
®~1··. ·. ". .. _..,...._.,. . ...
. :~ . t,• 0
.. ~
®
~.·
\ 7)7
~ ~~ _.---r-- ) <l.•
TORNADO DEATHS IN APRIL, 1916-1953 ~
.d
CHART 5
LEGEND Graduated circles represent 10 or more deaths
• I 0 deaths ~ 75 deaths
o 25 deaths
e;, 50 deaths
_ 200 deaths
8 250' deaths
Each dot represents one death
tornado deaths in April rgJ Center of
·~ 50 0 100 200 300 ....

~ 01:
~
LEGEND Graduated cirolis represent 10 or more deaths
• 10 deaths ® 75 deaths
e 25 deaths ® 100 deaths
e 50 deaths ® 125 deaths
Each dot represents one death
cgJ Center of tornado deaths in May
50 0 100 200 300 Miles
I.
.·'\ ·~?
"1 .. I
.· .... . ,•
~ .... .
.: .. . . . . . .
. '""""·
...
;e •
& '!'· e
. .
CHART 6

~ C':>
l
LEGEND
. Graduated circles represent 10 or more deaths
• I 0 deaths ~ 75 deaths
e 25 deaths
e 50 deaths
@ 100 deaths.
@ 125 deaths
Each dot represents one death
t8:l Center of ·tornado deaths in June
50 0 100 200 300 Miles
IN JUNE, 1916-1953
(!)
.('.·
·~· II)
·I&
~;<! -··
CHART 7

r0
1.() (j)
I
tO
(j)
~
:.J :::::> J z (f) :r: ~
w
0 0
00
10
H ~
L~ ,0
:: g
<1 ~
0
. ______. . . ....---
~
>.
~
'5
0 .s::.
~
g 0
.5
Q)
"0
(/J
Q)
.s::. §
0 ~
,Q)
0 (/J
"0
z 'E
0 Q
) "0
w
(/J
0
~ c:
(.9
.E ~
w
e _
J
0 '5
"0
.... ·~
~ c Q
) (.)
181
37

~ 00
.. , 50 0 100 200 300 Miles
~/~~
TORNADO
® l!l
[8j
1916-1953
CHART 9
.LEGEND
Graduated circles represent 10 or more deaths
• 10 deaths
a 25 deaths
ct 50 deaths
Each dot represents one death
' t8:1 Center of tornado deaths in August

~ ~
~ /lfY \
TORNADO DEATHS IN SEPTEMBER, 1916-1953
•
~ ,[81
®
LEGEND Graduated circles represent 10 or more deaths
o 10 deaths ~ 50 deaths
• 25 deaths e 75 deaths
8 100 deaths
Each dot represents one death
18:1 Center of tornado deaths in September
50 0 100 200 300 Miles J ~ ~~ ~{,/ ~ ~ CWJ 'lUG
I . .
CHART 10

~
LEGEND
"' TORNADO
0
Graduated circles represent 10 or more deaths
o 10 deaths
0 25 deaths
® 50 deaths
Each dot represents one death
~ . Center of tornado deaths in October 50 0 100 200 300 Miles
:.~~;;i ,.
CHART 11

fi:>. ........
0
"-·~LEGEND Graduated circles represent 10 or more deaths
• 10 deaths
• 25 deaths
Each dot represents one death
l8l Center of tornado deaths in November
'-..... J ·'""'
TORNADO DEATHS IN NOVEMBER, 1916-1953
~v v 100 200 300 Miles
!f
~
:;;,i;i _.to
CHART 12

H::. 1.'0
\ " I ./ TORNADO DEATHS IN DECEMBER, 1916-1953
\ (J
~
:;;.;.·~ ;
CHART 13
-l
LEGEND Graduated circles represent 10 or more deaths
o 10 deaths
e 25 deaths
® 50 deaths
Each dot represents one death
[8J Center of tornado deaths in December
50 0 100 200 300 Miles

IOOO>.---r---.---r--,--,-,--r--r1-~ -..----r--r---r--.---r--r-,--,--,--,-.,---,-r-r--r-.--,--,-----,---,--,--,---,1----,-,..-,----,
900I--t-t--+--+-+--t-+--r--+-.-t-t--+--l--+--+--+-l-+-f--l---l--f-1--l--+--+--f--+--+--t---1--+----l---l---t----+---1
soof-----t---l--1--l-+--+--+--+--lil-+-+-l----+--l----l--l-~--+---l--!--+--l 700 I I I I TORNADO DEATHS. TORNADO-DEATH DAYS.
I \ I I 1 1- TORNADOES AND TORNADO ~YS 1--t----t---+-1
6oof-----t--f--1--t-+--t--+--f---ILH-+-+----I----+--I---I-- I ANNUAL TOTALS. 1916-1953
500 j 1\ I I . 400 li\ /I\ I \ /1\ I /1\ I f
:~~- \/ 11 __ \~~ l. ____ \(_\1/" l-,j .:~~\-·/·lt\//Kr-- ~~/~~~t~&:~ ~~:
0 ~-·-· ·-·-- ·:=:::·. :=:= -·-·- .---+-·--- -----= -·-+---- ---- -·-· --·-·r·-· 'T --- ~ -~.\ :.::.:=, -·.- -·- .:;-- ·- r-:,.._ .---,-·- ·-· ·--- -·- ---·~-· -.............. ~
-•oo~-~~~~---~--~a-----~--~--~~--~--~~--
N001ber d hs
10 de at
0
00
80 0
00
50 0
oo I
~ 00 ~
]
-Tornododeoths -Tornado-death days ·-·--Tornadoes -·-·Tornado days
CHART 14
l I
I : TORNADO DEATHS I
ANNUAL AND MONTHLY TC)TALS
~ 1916-1953 d
I
~I I
I I I L I
1 :1 I ~ I I I I A I !L_ _j__\1 I ~ I
'\ -~ !
I L\-1-, I ll I ;I
1r \ I I A ~~~n~tr I I ff?
1/
1- --II I? Pi ···· -\ ----11-
1/ \ If:~- i/~ . .J _____ ~-----' .....
II ----- ·----- ----- ----- ----- ·-,;-
~~ I " J ~ -~ 1\1 (1 \ I I 1~1\ I \I \\1 v '/\ I • ~
-I 11,lj1 I li It I~ ,J Jd
- .1'1· lv [I .YIL~ -~
~ j ~ ¥
till I I !.I. .L ... .JJ l~r ,}. .. 9 Annual totals J. Monthly totals ~ Major death season each year· ---- Mean onnuol death total, 1916-1953 ! Divides death total in two equal ports
CHART 15
43
.Efl
I
I
---- ---- I -·--\ ~ J· L ....

~ ~
t TORNADO DEATHS IN ALL MONTHS, 1916-1953 IV
~
0
0.
. .
LEGEND
. J> .. \·· ··._.· ....... }.. . e. .. •._. . .. .,.. e·.
e . "( • · .• ~ '.
_.-~. -~, : >:- . ·C:j:-_ } ~-• •· ' • ( - ~·G.~~ •
_; . . .·· ,. "'-·'R:!r ~- r . : "':' . ' .: : .. ·. < ·,_~ . :l~~~.P.·.
cP.L2'9_::' .. ··~--·--:~:·.:··:~ .. -~~./'}/?:~~< ·:,:J::.~:L<~· • · • .. ce • o"'·· •. ~t t-•: .. ·: o··-r.,: ~-~·· • .. C) i:\:. • ::,_ <:v;~~;,J .. :::-: :·:::!¥~::<·: ¥/~• ;:~-' .. :. <~.~.·;·: '.'
.. , u.,~,.· •. ~ . .-·. Oe:\.~-~~-·. -~~···0·~.G'"cj·'·P •.. · 0 •~ • 111 • • ~~ •···· G G t)•6·: *•' • • •• •aCJ G \
•.. ·g.• •· e-g,.~· •• o.. • <DG> .. •• ·.-~
•• ~0 • ••. ~: •• \._.",; '. •• ··: • ·\,,.: : -..·<i;· :· :~. ~ 0 ••• . ·.I . .. • • ~ • •• • ., •• ~·· ... • ··"•· \ • 0 0~. ·,.._ '·.":: >~- ._.; : .r .. ·:·· ·, .o·. ..... ·.·· ......
••• -f •• ·.~ ~.-~ ··=.,~
"• I . .. : ·: .· :·1--~ ~.:)<-"· ~ : ... r-//
~r, ..
Graduated circles represent 10 or mere deaths 0
10 deaths 0 100 deaths ~· o 25 deaths ® 125 deaths
0 50 deaths ® 200 deaths
0 75 deaths ~ 250 ·deaths
Each dot represents one death
50 0 100 2.00 300 Mles '.iiw .,,
CHART 16

~ 01:
+
t-
•o.,
• "'1:1
"
LEGEND Number of reported tornado-death days
G:l .Two
ffiil Three
!llllllll Four
• Five or more
COUNTI.ES HAVING TWO OR MORE REPORTED TORNADO-DEATH DAYS, 1916-1953 +
+
CHART 17

J.l::.. ~
1-
+
Shoded areas enclose ports of counties or connect ports of contiguous counties from which torro:1o deaths were reported in the years. 1916-1953.
GENERAL AREAS FROM WHICH TORNADO DEATHS WERE REPORTED, 1916-1953
N~m~rals identify major re~.
Dotted lines indicate natlhem and western limits « tornado-death activity, 1916-1953.
CHART 18
+
+

0 lO
0'\
r-i'
..:J ~
:::::> 0
::
a z <(
ff3 z ~
<(
,...; ~
CD
~ 0
:: ti)
:::::> ~
a z
~
I.LJ 0
0 !:::
f=
z :::::>
:::::> C
D
-~ (/)
iS z 0
·~ ~
~
47

U, S. GOVERNMENT PR!NT:!IG OFFICE: 1957
48

0 [()
i:J r--1
0
) r--1
rn~
Q)
0 '"0
tt1 s:l 1>-t
~
....... ........ II:( ....... 0 00 ~
u tt1 1>-t
E-4
\•
-\
""· .
(
......... : . \
t "l\ 1
\
I I
\I
·1 \
{ \ (
/ \
r--) \ \
\ t
I
I
I
\
\ -
?
\
\
I I
/'J
\
0 C'1
_.., r-oj
..c v