1 october to 31 december 2017 office of water prediction...
TRANSCRIPT

Hydrometeorological Design Studies Center Quarterly Progress Report, January 2018
HYDROMETEOROLOGICAL DESIGN STUDIES CENTER
QUARTERLY PROGRESS REPORT
1 October to 31 December 2017
Office of Water Prediction
National Weather Service
National Oceanic and Atmospheric Administration
U.S. Department of Commerce
Silver Spring, Maryland
January 2018

Hydrometeorological Design Studies Center Quarterly Progress Report, January 2018
DISCLAIMER
The data and information presented in this report are provided only to demonstrate current progress on the various tasks associated with these projects. Values presented herein are NOT intended for any other use beyond the scope of this progress report. Anyone using any data or
information presented in this report for any other purpose does so at their own risk.

Hydrometeorological Design Studies Center Quarterly Progress Report, January 2018
TABLE OF CONTENTS
I. INTRODUCTION .......................................................................................................................................... 1
II. CURRENT PROJECTS ............................................................................................................................. 2
1. NOAA ATLAS 14 VOLUME 10: NORTHEASTERN STATES ............................................................ 2
2. NOAA ATLAS 14 VOLUME 11: TEXAS .............................................................................................. 3
2.1. PROGRESS IN THIS REPORTING PERIOD (Oct - Dec 2017) ..................................................... 5
2.1.1. Peer review .......................................................................................................................... 5
2.1.2. Scaling factors for 5-min and 10-min durations .................................................................... 9
2.2. PROJECTED ACTIVITIES FOR THE NEXT REPORTING PERIOD (Oct - Dec 2017) ................. 9
2.3. PROJECT SCHEDULE ................................................................................................................... 9
3. ANALYSIS OF IMPACTS OF NON-STATIONARY CLIMATE ON PRECIPITATION FREQUENCY ESTIMATES ........................................................................................................................................ 10
Hydrometeorological Design Studies Center Quarterly Progress Report, January 2018
1
I. INTRODUCTION
The Hydrometeorological Design Studies Center (HDSC) within the Office of Water Prediction (OWP) of the National Oceanic and Atmospheric Administration’s (NOAA) National Weather Service (NWS) has been updating precipitation frequency estimates for various parts of the United States and affiliated territories. Updated precipitation frequency estimates, accompanied by additional relevant information, are published in NOAA Atlas 14. All NOAA Atlas 14 products and documents are available for download from the Precipitation Frequency Data Server (PFDS).
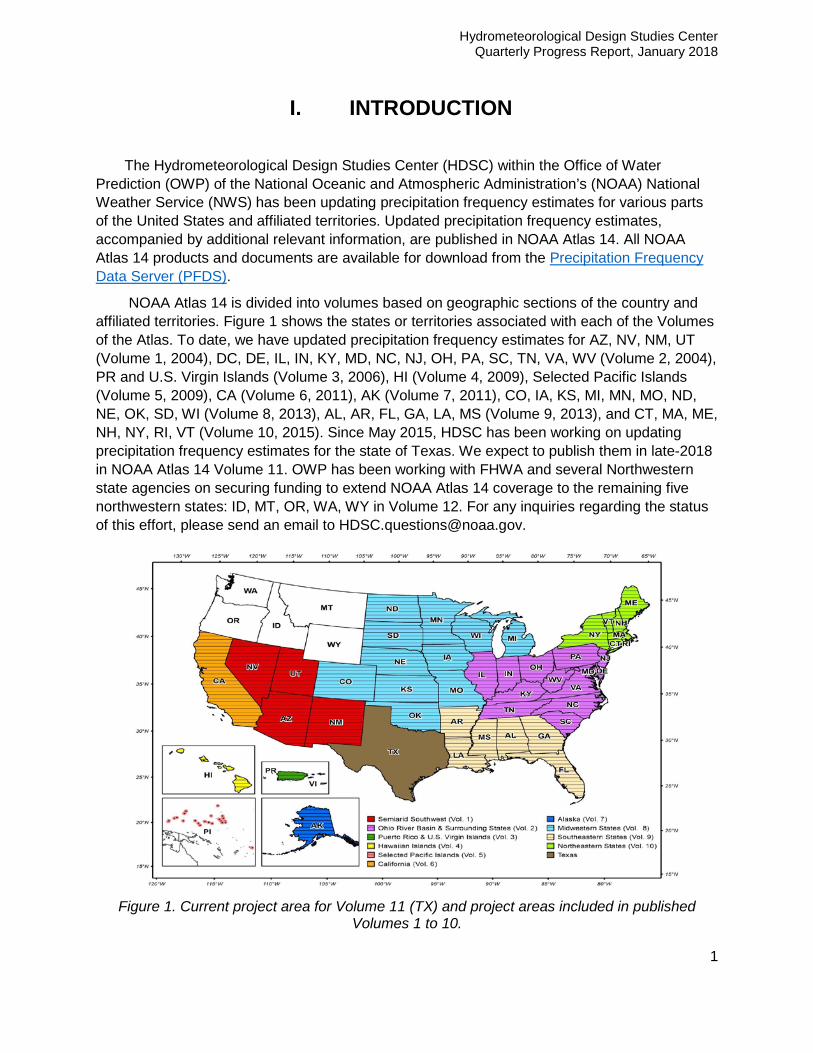
NOAA Atlas 14 is divided into volumes based on geographic sections of the country and affiliated territories. Figure 1 shows the states or territories associated with each of the Volumes of the Atlas. To date, we have updated precipitation frequency estimates for AZ, NV, NM, UT (Volume 1, 2004), DC, DE, IL, IN, KY, MD, NC, NJ, OH, PA, SC, TN, VA, WV (Volume 2, 2004), PR and U.S. Virgin Islands (Volume 3, 2006), HI (Volume 4, 2009), Selected Pacific Islands (Volume 5, 2009), CA (Volume 6, 2011), AK (Volume 7, 2011), CO, IA, KS, MI, MN, MO, ND, NE, OK, SD, WI (Volume 8, 2013), AL, AR, FL, GA, LA, MS (Volume 9, 2013), and CT, MA, ME, NH, NY, RI, VT (Volume 10, 2015). Since May 2015, HDSC has been working on updating precipitation frequency estimates for the state of Texas. We expect to publish them in late-2018 in NOAA Atlas 14 Volume 11. OWP has been working with FHWA and several Northwestern state agencies on securing funding to extend NOAA Atlas 14 coverage to the remaining five northwestern states: ID, MT, OR, WA, WY in Volume 12. For any inquiries regarding the status of this effort, please send an email to [email protected].
Figure 1. Current project area for Volume 11 (TX) and project areas included in published
Volumes 1 to 10.
Hydrometeorological Design Studies Center Quarterly Progress Report, January 2018
2
II. CURRENT PROJECTS
1. NOAA ATLAS 14 VOLUME 10: NORTHEASTERN STATES
Precipitation frequency estimates for the following seven northeastern states: Connecticut, Maine, Massachusetts, New Hampshire, New York, Rhode Island and Vermont were published in September 2015 as NOAA Atlas 14 Volume 10. The estimates for any location in the project area, along with all related products except documentation, are available for download in a variety of formats through the PFDS. At the request of the OWP management, work on documentation describing the station metadata, data and project methodology was put on hold until some funding issues are resolved. Our best estimate for the publication of NOAA Atlas 14 Volume 10 documentation is May 2018.

Hydrometeorological Design Studies Center Quarterly Progress Report, January 2018
3
2. NOAA ATLAS 14 VOLUME 11: TEXAS
The extended project area for the NOAA Atlas 14 Volume 11 precipitation frequency project includes the state of Texas and approximately a 1-degree buffer around the state (Figure 2).
Figure 2. NOAA Atlas 14, Volume 11 extended project area.
The primary source of data for NOAA Atlas 14 Volumes is the NOAA’s National Centers for Environmental Information (NCEI). In addition to the NCEI’s data, we gathered precipitation data collected by other Federal, State and local agencies for stations in Texas, as well as in adjacent portions of neighboring states (Arkansas, Louisiana, New Mexico, and Oklahoma) and also in Mexico to assist in data quality control and regionalization tasks. Since we started this project, we have contacted numerous agencies for assistance with the data and would like to thank all of those who responded to our inquiries and/or provided the data.
We have formatted data for 11,931 stations from 34 datasets listed in Table 1. Each formatted station was assigned a unique 6-digit identification number (ID), where the first 2 digits of the ID indicate the dataset. Stations were then screened for duplicate records, potential merges and for sufficient number of years with usable data. Stations with shorter or less reliable records in station dense areas were removed from the database. After all the screenings, approximately 3900 stations were retained for frequency analysis.

Hydrometeorological Design Studies Center Quarterly Progress Report, January 2018
4
Table 1. List of formatted datasets.
Data provider Dataset name Abbr. Station IDs (common digits)
Base duration
National Centers for Environmental Information (NCEI)
Automated Surface Observing System
NCEI
78 15M
DSI 3240, DSI 3260 03,05,14,16, 29,34,41* 15M, HLY
Digitized data 99 HLY, DLY Global Historical Climatology Network (GHCN)
03,05,14,16,29, 34,41,69,79,90* DLY
Integrated Surface Data (Lite) 64 HLY, DLY
Quality Controlled Local Climatol. Data 56 HLY
Raw sub-daily precipitation data 66 15M
Unedited Local Climatological Data 55 HLY
City of Austin ALERT Network COA 65 15M
City of Dallas ALERT Network COD 81 15M
Edwards Aquifer Authority EAA 62 HLY
Guadalupe-Blanco River Authority GBRA 77 15M
Harris County Flood Control District Flood Warning System HCFCD 60 15M Jefferson County Drainage District 6
ALERT Precipitation and Stream Level Network DD6 82 15M
Lower Colorado River Authority Regional Meteorological Network LCRA 63 15M
Midwestern Regional Climate Center CDMP 19th Century Forts and Voluntary Observers Database FORTS 52 DLY
Illinois State Water Survey National Atmospheric Deposition Program NADP 54 DLY National Estuarine Research Reserve System NERRS 57 15M, HLY
National Weather Service Hydromet. Automated Data System HADS 85 HLY
Oklahoma Climatological Survey Oklahoma Mesonet OKM 86 15M, DLY
San Antonio River Authority SARA 91 15M
Sabine River Authority SRA 58 DLY
Servicio Meteorologico Nacional, Mexico SMN 61 DLY Tarrant Regional Water District (Greater Fort Worth area) Tarrant County Urban Flood Control Network TRWD 83 15M, HLY
Texas Commission on Env. Quality Air Quality Network TCEQ 75 HLY
Texas Evapotranspiration Network TEN 89 HLY, DLY
Texas Water Development Board TWDB 84 HLY, DLY Titus County Fresh Water Supply District No. 1 TCWS 53 DLY
U.S. Bureau of Reclamation HydroMet USBR 87 HLY, DLY
US Dept. of Agriculture (USDA) Agricultural Research Service USDA 94 15M
USDA, Forest Service Remote Automated Weather Station Network RAWS 76 HLY
USDA, National Resources Conservation Service Soil Climate Analysis Network SCAN 88 HLY
U.S. Geological Survey National Water Information System NWIS 59 15M
West Texas Mesonet WTM 80 15M *03 - Arkansas, 05 - Colorado, 14 - Kansas, 16 - Louisiana, 29 - New Mexico, 34 - Oklahoma, 41 - Texas (DLY, HLY)
69 - GHCN CoCoRaHS, 79 - GHCN, 90 - GHCN Mexico (DLY)

Hydrometeorological Design Studies Center Quarterly Progress Report, January 2018
5
2. PROGRESS IN THIS REPORTING PERIOD (Oct - Dec 2017)
2.1.1. Peer review
All NOAA Atlas 14 Volumes are subject to peer review which provides critical feedback on the reasonableness of point precipitation frequency estimates, their spatial patterns, and station metadata. This allows us to incorporate the reviewers’ local knowledge of rainfall patterns and rain gauge networks into the final product.
On November 20, 2017 we published the preliminary (Version 1) results for Volume 11 on the peer review page (see Figure 3) and sent an invitation for the review to individuals who expressed interest in the review and/or subscribed to our list server. The peer review process will conclude on January 19, 2018. At that time, we will consolidate all comments, review and address them accordingly. We will publish all comments (anonymously) with our resulting action as Appendix 4 of Volume 11 document.
Figure 3. Peer review page for Volume 11.

Hydrometeorological Design Studies Center Quarterly Progress Report, January 2018
6
Preliminary precipitation frequency estimates reflect rainfall amounts associated with Hurricane Harvey, as we included 2017 data for stations in the area affected by the hurricane. The preliminary results published on the peer review pages should not be used in design since they are subject to change. The final estimates with supplementary information will be delivered via the Precipitation Frequency Data Server, and will be similar in format to previous volumes. We expect to publish the final estimates in September 2018 as NOAA Atlas 14 Volume 11 Version 2.
For the review we have provided the following Volume 11 preliminary products and encouraged peer reviewers to make comments on:
a. Station metadata. We grouped 11,931 stations from 34 datasets listed in Table 1 in three categories: a) stations inside Texas that were used in frequency analysis (shown as green squares on the map in Figure 3), b) stations outside Texas that assisted in the analysis (yellow squares), and c) stations that were examined but not retained for the analysis (red squares). We asked reviewers to examine the accuracy of stations’ coordinates and provide comments on suggested stations’ deletions, merges and co-locations.
b. At-station depth-duration-frequency (DDF) curves. We provided DDF curves for stations retained in analysis for durations between 1-hour and 10-days for average recurrence intervals from 2-year through 100-year. We asked reviewers to examine the curves and let us know if precipitation frequency estimates at the station are in line with expected values.
c. Spatially-interpolated estimates. We created cartographic maps of spatially-interpolated precipitation frequency estimates for 2-year and 100-year ARIs and for 60-minute, 6-hour, 24-hour and 10-day durations (8 maps total) and invited reviewers to comment on the overall and local spatial patterns. Figure 4 shows, as an example, a cartographic map of 100-year 24-hour estimates. For more information on NOAA Atlas 14 frequency analysis and interpolation methods, see, for example, the NOAA Atlas 14 Vol 9 document.
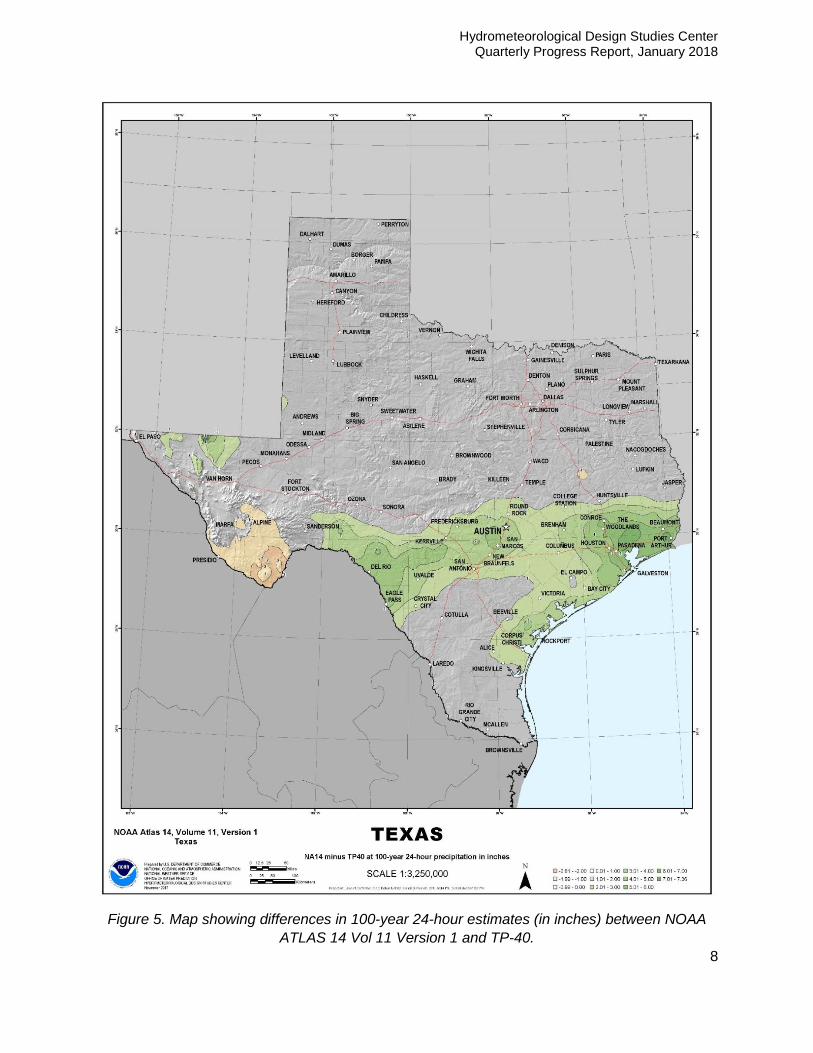
To illustrate how much estimates changed in the project area, we also created cartographic maps for 100-year estimates showing differences between NOAA Atlas 14 and currently valid NOAA estimates for 60-minute, 6-hour, 24-hour and 10-day durations. For this comparison, we digitized relevant paper cartographic maps using the standard spatial interpolation tools available in ArcGIS. The map in Figure 5 shows the differences in 100-year 24-hour estimates (in inches) between NOAA Atlas 14 and Technical Paper 40 (TP-40). The differences in estimates between the two publications are attributed to a number of factors, including differences in frequency analysis, spatial interpolation techniques and in the amount of available data, both in the number of stations and their record lengths, etc.
As part of the peer review process, we participated in several meetings and panel discussions to address any questions or concerns reviewers may have after looking over the information shared.

Hydrometeorological Design Studies Center Quarterly Progress Report, January 2018
7
Figure 4. Cartographic map showing 100-year 24-hour estimates (in inches) from
NOAA ATLAS 14 Vol 11 Version 1.
Hydrometeorological Design Studies Center Quarterly Progress Report, January 2018
8
Figure 5. Map showing differences in 100-year 24-hour estimates (in inches) between NOAA
ATLAS 14 Vol 11 Version 1 and TP-40.

Hydrometeorological Design Studies Center Quarterly Progress Report, January 2018
9
2.1.2. Scaling factors for 5-min and 10-min durations
The shortest duration at which annual maximum series data are extracted is 15 minutes. Precipitation frequency estimates at 5-min and 10-min durations are derived by applying scaling factors on corresponding 15-min estimates. During this reporting period, we calculated scaling factors as average ratios of 5-min and 10-min annual maxima to corresponding 15-min annual maxima. We analyzed spatial patterns in scaling factors, but did not find any geographic clusters. Therefore, we will assume they are uniform for the whole project area.
2.2. PROJECTED ACTIVITIES FOR THE NEXT REPORTING PERIOD (Jan - Mar 2018)
In the next reporting period, we will update datasets for the most recent precipitation record where available and extract AMS for years appended. We will consolidate, review and address comments received from reviewers and work on trend, temporal distribution and seasonality analyses.
2.3. PROJECT SCHEDULE
Data collection, formatting, and initial quality control [Done]
Extraction of annual maximum series (AMS); additional quality control and data reliability tests (e.g., outliers, independence, consistency across durations, duplicate stations, candidates for merging) [Done]
Regionalization and frequency analysis [Done]
Spatial interpolation of precipitation frequency (PF) estimates and consistency checks across durations [Done]
Peer review [In progress]
Revision of PF estimates [February 2018; revised to April 2018]
Remaining tasks (e.g., development of precipitation frequency estimates for partial duration series, seasonality, temporal distributions, documentation) [March 2018; revised to July 2018]
Web publication of data [May 2018; revised to October 2018]
Web publication of documentation [June 2018; revised to December 2018]

Hydrometeorological Design Studies Center Quarterly Progress Report, January 2018
10
3. ANALYSIS OF IMPACTS OF NON-STATIONARY CLIMATE ON PRECIPITATION FREQUENCY ESTIMATES
The current approach used in NOAA Atlas 14 to calculate precipitation magnitude-frequency relationships assumes stationarity in the annual maximum series (AMS) data used for frequency distribution selection and fitting. Several parametric and non-parametric statistical tests are used to detect trends in the AMS, but so far, tests have shown very little geographically consistent trends across considered durations (for more information, see any NOAA Atlas 14 document).
However, it is questionable if use of stationary methods relying on AMS data is appropriate for the analysis of extreme precipitation in the presence of nonstationary climate. AMS-based approaches consider only a single highest precipitation amount for a given duration per year; consequently, they are not sensitive to changes in the rate of extreme events not accompanied with a significant change in magnitudes. That suggests the need to replace the current stationary AMS-based approach with a non-stationary partial duration series (PDS)-based approach.
In an effort to understand the potential impact of non-stationary climate conditions on precipitation frequency estimates, the Federal Highway Administration tasked HDSC to conduct a pilot project, but preliminary findings were inconclusive. With help from academia, HDSC continues to look into this issue with the goal of developing a modeling framework that will allow non-stationary climate effects to be integrated into the NOAA Atlas 14 process, and will produce credible precipitation frequency estimates which can be relied upon by Federal water agencies. With that goal in mind, we identified four major tasks: (1) selection of non-stationary frequency analysis method(s) appropriate for NOAA Atlas 14 process; (2) testing the feasibility of incorporating future climate projections into precipitation frequency analysis; (3) implementation of selected non-stationary method(s) using historical and future precipitation data on a designated project area; (4) assessing the added value of new precipitation frequency estimates with respect to traditional NOAA Atlas 14 estimates and recommending an approach for national implementation.
Since 2016, HDSC has been working together with the Penn State University team led by Drs. Shaby and Mejia on assessing the suitability of different non-stationary frequency analysis methods with respect to NOAA Atlas 14 (Task 1). As part of this effort, we have been evaluating estimates from various types of non-stationary models against the current NOAA Atlas 14 stationary model and investigating a number of related issues, such as performance of the AMS and PDS models in terms of the uncertainty of precipitation frequency estimators, effects of different de-clustering techniques and threshold selection mechanisms for the PDS model, effects of distribution parameterization techniques, etc. We also plan to explore if other covariates in addition to time may improve estimates. The details of methods tested and major findings will be available in a report that will be published on the PFDS website in late-2018.
Work on Task 2 - testing the feasibility of incorporating climate projections in precipitation frequency analysis is scheduled to start in March 2018.