topic 1 measurement
DESCRIPTION
measurementTRANSCRIPT
� INTRODUCTION
We apply measurements in almost everything we do. For example, how much time does it take to bake a cake? Or how far away is the school from your house? Or what is your weight? Each of these quantities needs to be measured using different measuring tools. You need to be able to determine the proper measuring tool for each measurement that you make so that you can get the best results from the activities that you do.
PHYSICAL QUANTITIES AND SI UNITS
All measurements in physics are related to fundamental quantities such length, mass and time. In the earlier times, until about the year 1800, workers in various countries used different systems of units. Thus, while the English used inches to measure length, a scientist from another country would measure lengths in centimetres. This made it difficult for people from different countries to compare
1.1
TTooppiicc
11 � Measurement
By the end of this topic, you should be able to:
1. Define physical quantity;
2. Describe base and derived quantities and their respective SI units;
3. Determine the appropriate measurement tools for measuring different physical quantities;
4. Discuss the precision, accuracy and sensitivity of measuring tools; and
5. Use the graph technique to analyse measurements and data.
LEARNING OUTCOMES
� TOPIC 1 MEASUREMENT
2
the measurements that they have made. Fortunately, this situation has now been changed by the efforts of various international committees of scientists who have met for discussion regularly over many years. In 1960, the General Conference of Weights and Measures in France recommended the use of a metric system of measurement called the International System of Units*. The SI units are derived from the earlier MKS system, so called because its first three basic units are the metre (m), the kilogram (kg), and the second (s). Most countries including Malaysia have adopted this system.# A pphysical quantity is a quantity that can be mmeasured. Examples of physical quantities are length, mass, time, weight, electric current, force, velocity and energy. NNon-physical quantities are quantities that ccannot be measured such as colour, feelings or beauty. To describe a physical quantity, two things need to be specified. The first is its numerical value and the second is its uunit. For example, the distance between your house and school is five kilometres. The distance has a numerical value of five and the unit is kilometre (km). On the other hand, colour, feelings and beauty cannot be stated in numerical form and do not have units. Thus these quantities are subjective, as in the famous saying, „beauty is in the eye of the beholder‰.
1.1.1 Base and Derived Quantity
Now let us get to know base and derived quantity. (a) Base Quantity There are two types of physical quantities; the base quantity and the
derived quantity.
________________________________
* (Le Systeme International (SI)) # To date, there are three countries known not to adopt this system: the United States, Myanmar
and Liberia.
A bbase quantity is a physical quantity that cannot be defined in terms of any other physical quantity.

TOPIC 1 MEASUREMENT �
3
Table 1.1 shows five base quantities and their respective SI units.
Table 1.1: Base Quantities and Their Respective Base Units
Base Quantity BBase Unit (SI Unit) SSymbol of Unit
Length, l Metre m
Mass, m Kilogram kg
Time, t Second s
Temperature, T Kelvin K
Current, I Ampere A
Scientific investigations usually involve quantities with values either very big or very small. For example, the height of Mount Everest is 8848 m or the diameter of a cell is 0.000002 m. Quantities written this way take up much space and are difficult to use in calculations. Thus we can write them as numbers which are base of 10s to make them simpler to use.
M � 10n where 1 ª M � 10 and n is an integer By using the above multiplication factor, the height of Mount Everest is written as 8.848 � 103 m and the diameter of the cell is 2.0 � 10�6 m. The magnitudes of physical quantities are usually rounded up to three or four significant figures. The list of prefixes and multiplication factors is shown in Table 1.2. Prefixes in the SI unit represent the multiplication factors. For example, the multiplication 103 is represented by the prefix, kilo.* Similarly, 1,000 m can be stated as 1 km. 1 cm can be stated as 0.01 m or 1 � 10�2 m.

� TOPIC 1 MEASUREMENT
4
Table 1.2: Prefixes and Multiplication Factors
Prefix SSymbol MMultiplication Factor
Tera T � 1012
Giga G � 109
Mega M � 106
Kilo k � 103
Deci d � 10�1
Centi c � 10�2
Milli m � 10�3
Micro ø � 10�6
Nano � � 10�9
Pico p � 10�12
When we want to change a prefix to the base unit, we need to use suitable multiplication factors. The example below shows the conversion of units.
Example 1.1: 6.78 mm = __________________ km Solution: 6.78 mm = 6.78 � 10�3 m = 6.78 � 10�3 � 10�3 km = 6.78 � 10�6 km

TOPIC 1 MEASUREMENT �
5
(b) Derived Quantity What does derived quantity mean?
Physical quantities are related to one another by mathematical equations. These quantities can be expressed and derived from base quantities. For example,
Velocity = Displacement/Time Table 1.3 shows some derived quantitties, their units and how their units are derived from base units.
A derived quantity is a physical quantity that is produced from a combination of base quantities through some operation such as multiplication, division or both.
1. Search the values of the following constants in prefixes and convert them to real numbers:
(a) Speed of light in vacuum;
(b) Mass of an electron; and
(c) Distance from Earth to the Sun.
2. Convert the following numbers using suitable prefixes.
(a) 23,000,000 kg; and
(b) 7,500 nm.
ACTIVITY 1.1
� TOPIC 1 MEASUREMENT
6
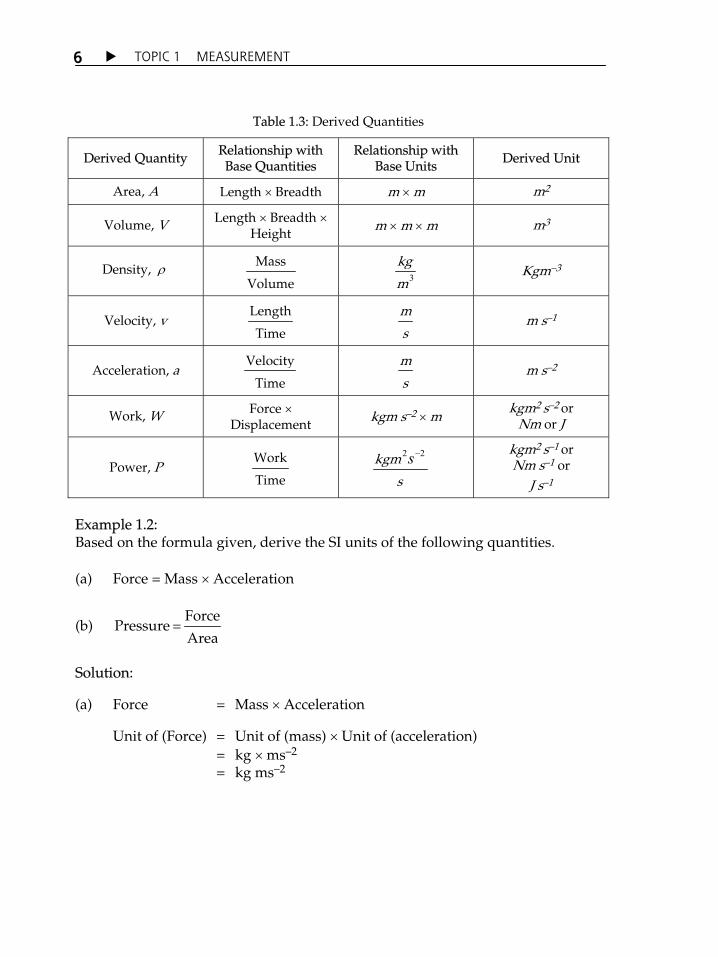
Table 1.3: Derived Quantities
Derived Quantity Relationship with Base Quantities
Relationship with Base Units Derived Unit
Area, A Length � Breadth m � m m2
Volume, V Length � Breadth � Height m � m � m m3
Density, � Mass
Volume 3
kg
m Kgm�3
Velocity, v Length
Time
m
s m s�1
Acceleration, a Velocity
Time
m
s m s�2
Work, W Force � Displacement kgm s�2 � m
kgm2 s�2 or Nm or J
Power, P Work
Time
2 2s�kgm
s
kgm2 s�1 or Nm s�1 or
J s�1
Example 1.2: Based on the formula given, derive the SI units of the following quantities. (a) Force = Mass � Acceleration
(b) Force
Pressure = Area
Solution:
(a) Force = Mass � Acceleration
Unit of (Force) = Unit of (mass) � Unit of (acceleration) = kg � ms�2
= kg ms�2

TOPIC 1 MEASUREMENT �
7
(b) Pressure = Force
Area
Unit of (Pressure) = Unit of (Force)
Unit of (Area)
= 2
2
�kgms
m
= kgm�1s�2
1.1.2 Length
Length is a measure of displacement between two points within a single dimension. Different terms are used for measurement in two other perpendicular dimensions: width and height. You have learnt that length is measured using the SI unit, metre. It is defined as:
Other than the metre or its prefixes (centimetre, kilometre etc), the US customary units, English or Imperial System of units uses other units for the measurement of length such as inch, foot, yard or mile.
1.1.3 Area
Area is defined as the amount of the two-dimensional space within a boundary. For a square or a rectangular, Area = Length � Width Thus, the SI unit for area is m2. If symbols are used to represent quantities as in table 1.1 (where l = length), and let A = Area; and b = width or breadth, we obtain the following equation for area of a square or a rectangle: A = l � b
Metre is the length of path travelled by light in vacuum during an interval of 1/299,792,458 of a second.
� TOPIC 1 MEASUREMENT
8
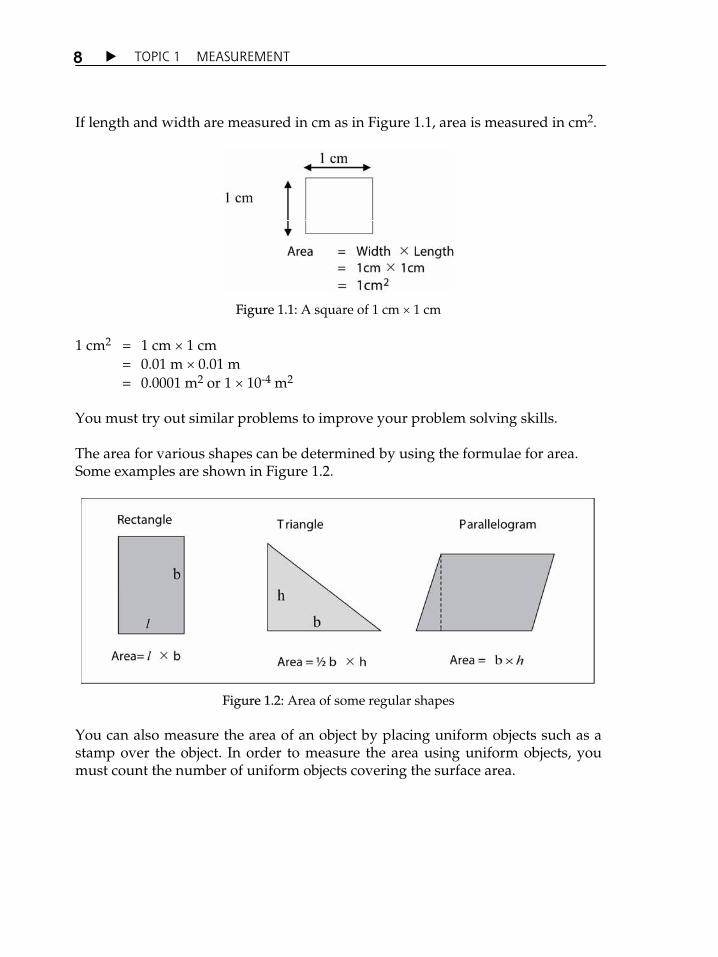
If length and width are measured in cm as in Figure 1.1, area is measured in cm2.
Figure 1.1: A square of 1 cm � 1 cm 1 cm2 = 1 cm � 1 cm = 0.01 m � 0.01 m = 0.0001 m2 or 1 � 10-4 m2 You must try out similar problems to improve your problem solving skills.
The area for various shapes can be determined by using the formulae for area. Some examples are shown in Figure 1.2.
Figure 1.2: Area of some regular shapes
You can also measure the area of an object by placing uniform objects such as a stamp over the object. In order to measure the area using uniform objects, you must count the number of uniform objects covering the surface area.

TOPIC 1 MEASUREMENT �
9
For example, if you want to measure the area of a textbook, you should fill as many stamps as possible on the surface of the book. The number of stamps covering the surface of the book is the area of the book. Look at the diagram in Figure 1.3. The area of the book is covered by 12 stamps.
Figure 1.3: Stamps cover book surface
Although the stamps can be used to measure the area of the book, this method is considered as a non-standard method. Again, there is a need to use a standardised unit in order to make the method a standard one. A simple method to measure the area of a rectangular or square is by using graph paper. The advantage of using graph paper is that it has uniform squares printed on it. To measure the area of a rectangular or square object, place the graph paper on the surface of the object. One square on the graph paper is 1cm2. Thus, the number of squares on the graph papers can be counted to measure the area of the objects being covered. By using the previous example, let us replace the stamps covered on the book with the graph paper (as shown in Figure 1.4).

� TOPIC 1 MEASUREMENT
10
Figure 1.4: Graph squares cover book surface
The area of the book is 48 squares. Since the area of each square is 1 cm2, the area of the book is 48 cm2.

TOPIC 1 MEASUREMENT �
11
To find the area of a non-regular shape, you can trace the shape on centimetre grid paper (see Figure 1.5).
Figure 1.5: A non-regular shape
Then, count the number of full centimetre squares inside the shape. Then, piece together the remaining parts (for example, halves) into full squares. This method will give you a good estimate of the shapeÊs area.
We have learned how to use graph paper to measure an area of a rectangular and a square object. Imagine, if the area you want to measure is big, like a badminton court or a football field. Is it practical to use graph paper as a tool to measure those big areas? There are other alternatives we can use to measure such big areas. The area of a square or a rectangle is measured by using the formula: A = l � b.
Calculate the area of your classroom by using the given formula.
SELF-CHECK 1.1
As a teacher, you can ask your students to do this activity: They have already learned that a graph paper can be used as a tool tomeasure the area of a rectangular and a square object. Now, ask them tomeasure the area of their own books by using graph paper.
ACTIVITY 1.2
� TOPIC 1 MEASUREMENT
12
1.1.4 Volume
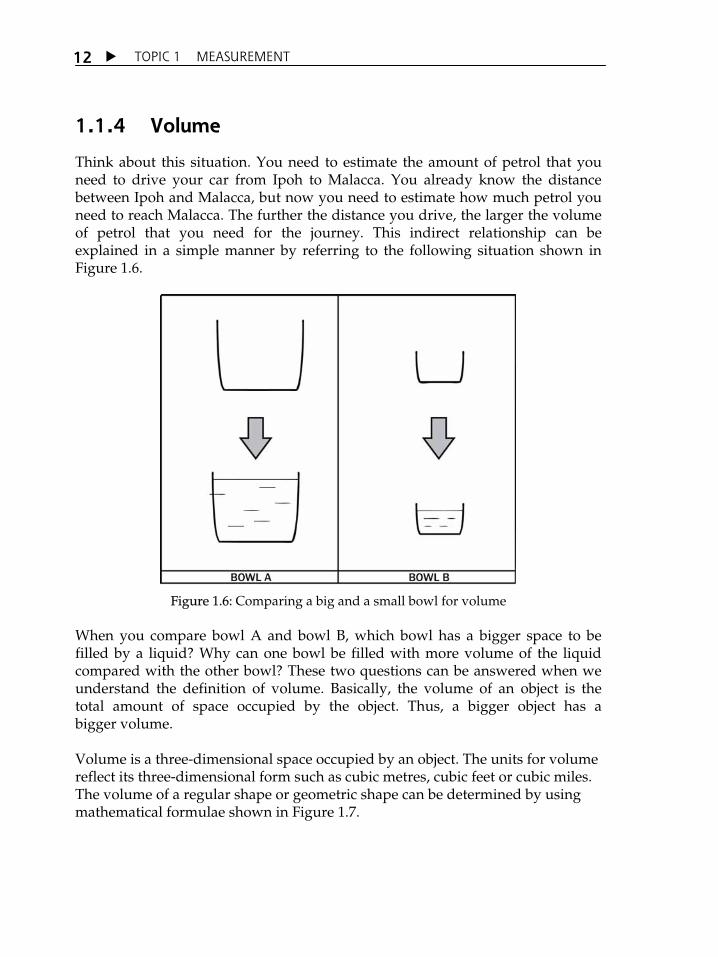
Think about this situation. You need to estimate the amount of petrol that you need to drive your car from Ipoh to Malacca. You already know the distance between Ipoh and Malacca, but now you need to estimate how much petrol you need to reach Malacca. The further the distance you drive, the larger the volume of petrol that you need for the journey. This indirect relationship can be explained in a simple manner by referring to the following situation shown in Figure 1.6.
Figure 1.6: Comparing a big and a small bowl for volume
When you compare bowl A and bowl B, which bowl has a bigger space to be filled by a liquid? Why can one bowl be filled with more volume of the liquid compared with the other bowl? These two questions can be answered when we understand the definition of volume. Basically, the volume of an object is the total amount of space occupied by the object. Thus, a bigger object has a bigger volume. Volume is a three-dimensional space occupied by an object. The units for volume reflect its three-dimensional form such as cubic metres, cubic feet or cubic miles. The volume of a regular shape or geometric shape can be determined by using mathematical formulae shown in Figure 1.7.

TOPIC 1 MEASUREMENT �
13
Figure 1.7: Volume of some geometric shaped objects
Volume of Cuboid The volume of a cuboid can also be determined experimentally by filling the box completely with cubes of equal sizes. This is because the cubes can completely fill the box. In order to measure the volume of an empty cuboid with cubes, we need cubes with sides of 1cm and volume of 1cm3. We can measure the volume of an empty box by filling it up completely with cubes with a volume of 1cm3 each. The number of cubes which fill the box completely is the volume of that particular box. If 36 cubes fill up the box completely, that means the volume of the box is 36cm3. The second method to measure a volume of cuboid is by using a mathematical formula. First of all, we need to understand the basic characteristics of a cuboid. The length, width and height of a cuboid are different. Even so, we can still calculate the volume by using the following formula shown in Figure 1.8.
Figure 1.8: Formula to calculate the volume of a cuboid

� TOPIC 1 MEASUREMENT
14
Example 1.3: Given the length of the cuboid is 5cm, its width is 4cm and its height is 2cm, its volume can be calculated by using the formula: Volume = Length � Width � Height = 5 cm � 4 cm � 2 cm = 40 cm3
For irregular shaped objects, the volume cannot be determined using formula, we can use the displacement of liquid as a way to determine its volume. When an object is placed into a measuring cylinder, the level of water will rise. The difference in the volume of water is the volume of the object, Vobject.
The water in the first cylinder in Figure 1.9 has a volume of 200 cm3.
Figure 1.9: Measuring the volume of a liquid
The level of the water rises to 260 cm3 when the object is placed in it. Thus the volume of the object is:
Vobject = 260 cm3 � 200 cm3 = 60 cm3
Vobject = Vobject + water � Vwater

TOPIC 1 MEASUREMENT �
15
1.1.5 Time
Time is a non-spatial continuum measure of existence and events. The unit of time, second (ss), was defined originally as the fraction 1/86 400 of the mean solar day. However, the irregularities of the rotation of the Earth do not allow accuracy to be achieved for the measurement of a second. The second was redefined in the year 1967 to take advantage of the high precision attainable with an atomic clock, which uses the characteristic frequency of the light emitted from the cesium-133 atom as its „reference clock.‰
1.1.6 Mass
When you walk around in a supermarket, you will see many things sold in packets. If you read the packets carefully, you will notice the amount of mass printed on the packets, such as 1 kg, 5 kg, 10 kg etc. We use the concept of mass in daily life situations. Can you give examples of daily situations related to mass? All objects have mass. Mass is the quantity of matter present in the object. An object which has larger quantity of matter in it has larger mass. The mass of an object is the same even though it is measured at different places. This is because the mass of an object depends on the amount of matter present in the object. Thus, a 50 cent coin has a bigger mass than a 20 cent coin. The standard unit for mass is kilogram (kg). The standard mass is an international prototype of mass 1 kilogram kept at the International Bureau of Weights and Measures near Paris.
A kkilogram is equal to the mass of the IInternational Prototype Kilogram (IPK), a platinum-iridium cylinder kept by the BIPM at Sèvres, France.
The ssecond is defined as the time required for 9,192,631.770 periods of radiation of caesium atoms as they pass between two particular states.
Metric Units
1 kilogram (kg) = 1000 grams (g)
1 gram (g) = 1000 milligrams (mg)

� TOPIC 1 MEASUREMENT
16
1.1.7 Temperature
You are probably familiar with the weather report aired in the news which predicts the weather for the next day. You may have noticed that some numbers appear on the screen which indicate how hot or cold the day would be. The numbers may be relatively higher or lower in some places. These are called temperatures. Temperature is used to indicate how hot or cold an object is. Usually, a hot object is indicated by having a high temperature. In contrast, a cold object has a low temperature. You cannot measure temperature of boiling or cold water accurately by dipping in your fingers into it. You may only be able to estimate the temperature of the water. A thermometer is used to measure temperature accurately. Temperature is a physical property of matter which quantitatively expresses the common notion of hot or cold. If the temperature of an object is low, the object is cold; various degrees of higher temperatures are referred to as warm or hot. Temperature can be measured using various kinds of thermometers. The basic unit of temperature in the International System of Units (SI) is Kelvin and has the symbol K. It is named after the British physicist, Lord Kelvin.
On the scale commonly used in laboratories, the number 0 is assigned to the temperature at which water freezes and the number 100 as the temperature at which water boils. The space between is divided into 100 equal parts called degrees, hence, a thermometer so calibrated is called a centigrade thermometer (from centi, „hundredth‰, and gradus, „degrees‰). It is now called a Celsius thermometer in honour of the man who first suggested the scale, Swedish astronomer Anders Celsius (1710-1744). This unit is used by many customers.
Tc = Tk � 273.15 The United States uses a different unit do measure temperature. In United States, number 32 is assigned to the temperature when water freezes. Boiling water is assigned to number 212. This scale is known as the Fahrenheit scale.
TF = 1.8 Tc + 32À F
Kelvin is the fraction 1/273.16 of the thermodynamic temperature of the triple point of water.

TOPIC 1 MEASUREMENT �
17
MEASUREMENT TOOLS
In the following subtopics we are going to look at some of the tools that we commonly use scientifically to measure. When we make measurements, there are certain things that we need to know about the measuring tools that we use so that we can get the best results for our measurements, which are precision, accuracy and sensitivity.
1.2.1 Precision, Accuracy and Sensitivity
In everyday life, no measurement is exactly accurate. All of the physical quantities are only estimations. For example, 500 g of sugar bought from a mini market may be 500.2 g or 499.8 g. There will always be a slight difference between the observed value and the real value of the quantity. The difference
1.2
ABSOLUTE ZERO TEMPERATURE
Absolute zero temperature, OK (corresponds to �273.15À C on the Celcius temperature scale and �459.67 À F on the Fahrenheit temperature scale) is the temperature at which a thermodyname system has the lowest energy.
Riddles related to temperature. 1. Why should someone wear a hat on a cold day?
2. Why can you warm your hands by blowing them gently, and cool
them by blowing hard?
3. Air and water, both at 25ÀC, do not feel the same. You notice this temperature difference upon jumping from 25ÀC air into a swimming pool of 25ÀC water. Why are there differences?
4. Can an ice cube be so hot that your fingers will burn when in contact?
(Source: Jargodzki & Potter, 2001)
ACTIVITY 1.3

� TOPIC 1 MEASUREMENT
18
between the real value and the observed value (OObserved value � Real value, �) is known as tthe error of uncertainty. There are many reasons for errors of measurement, such as: (a) Using unsuitable measuring instruments;
(b) Personal error when reading the scale; and
(c) The measuring process itself. The three important aspects of a measurement are explained in Table 1.4.
Table 1.4: Three Important Aspects of Measurement
Aspect Description
Precision
Ability of the instrument to give consistent readings when the same physical quantity is measured more than once. In other words, there is no or little deviation among the measurements taken.
Accuracy How close is the measured value compared with the actual value?
Sensitivity
The ability of detecting small changes in the measured quantity. Sensitive instruments can detect and react fast to small changes in the quantities.
Now let us learn more on these three aspects. (a) PPrecision Let us look at two examples to understand precision. Example 1.4: Precision Table 1.5 shows two sets of readings taken by using two different
measuring instruments; A and B:
Table 1.5: Example for Precision
Instrument A IInstrument B
6.5 7.2
6.4 6.6
6.5 5.9
6.6 5.2
6.5 7.9

TOPIC 1 MEASUREMENT �
19
From the readings in Table 1.5, the values taken by instrument A are closer to one other compared with instrument B. The readings taken by instrument B are scattered, where the five values are quite far from one another. Thus, when comparing instruments A to B, the readings taken by instrument A are more precise than instrument B. Example 1.5: Consistency in the form of deviation
Relative deviation = Average deviation/Average reading � 100%
Steps in finding relative deviation: The readings taken by an instrument G are shown below. Find the relative deviation of the readings.
2.2 m, 2.3 m, 2.5 m, 2.1 m and 2.2 m
Solution: (i) Find the average reading.
Average reading = (2.2 + 2.3 + 2.5 + 2.1 + 2.2)/5 = 2.26 m (ii) Construct a table as shown in Table 1.6:
Table 1.6: Sample Table
No. Readings Taken by Instrument G, (m) Deviation (m)
1 2.2 2.2 � 2.26 = 0.06
2 2.3 2.3 � 2.26 = 0.04
3 2.5 2.5 � 2.26 = 0.24
4 2.1 2.1 � 2.26 = 0.16
5 2.2 2.2 � 2.26 = 0.06
Total 11 0.56
Average 11.3/5 = 2.26 0.56/5 = 0.11
(iii) Find the total deviation using the formula as shown below:
Deviation = Reading � Average reading

� TOPIC 1 MEASUREMENT
20
(iv) Find the average deviation using the formula:
Average deviation = Total deviation/Number of readings = 0.56/5 = 0.11 m (v) Find the relative deviation using the formula given:
Relative deviation = Average deviation/Average reading � 100% = 0.11/2.26 � 100% = 4.86 %
If we use a 100% consistent measuring instrument to measure one of the physical quantities, then the relative deviation of a reading taken will be zero. This situation happens as there is no deviation in every reading taken. On the other hand, if we use a measuring instrument which is not 100% precise, we will get different readings for the measurement of the physical quantities.
(b) AAccuracy Let us look at an example to show the concept of accuracy. Example 1.6: A teacher asks two students, Afiq and Syazwan, to measure the height of a
chair in the physics laboratory. The actual height of the chair is 35.4 cm. The following data table shows the obtained data:
Afiq 35.2 cm 35.6 cm 35.4 cm 35.7 cm 35.3 cm
Syazwan 36.2 cm 36.1 cm 36.2 cm 36.1 cm 36.2 cm
For Afiq:
(i) Since the readings taken are very close to the actual reading, his readings can be considered as accurate.
(ii) But, there are variations between the readings, so his readings can be considered as not precise (consistent).

TOPIC 1 MEASUREMENT �
21
For Syazwan:
(i) Since the readings taken are far from the actual reading, his readings can be considered as less accurate.
(ii) But, his readings are more precise compared with Afiq because the readings are concentrated on two values, 36.1 cm and 36.2 cm only.
(c) SSensitivity If we look at a ruler, we will observe that there are two scales �� the
centimetre (cm) and millimetre (mm) scales. We can state that the millimetre (mm) scale is more sensitive than the centimetre scale as instruments with smaller divisions on the scale are more sensitive.
The sensitivity of a measuring instrument can be compared between
different measuring instruments. Some examples:
(i) A ruler can measure to a smallest value of 0.1 cm, a vernier caliper to a smallest value of 0.01 cm and a micrometer screw gauge to a smallest value of 0.001 cm. So when we measure the diameter of a glass rod, we will possibly get 0.8 cm from a ruler, 0.82 cm from a vernier caliper and 0.823 cm form a micrometer screw gauge. Thus, the micrometer screw gauge is more sensitive than a vernier caliper which is more sensitive than a ruler.
(ii) A millimetre is more sensitive than an ammeter as it has a scale which can measure currents accurately to a smallest value of 1 milliampere. An ammeter can only measure currents to a smallest value of 1 Ampere only.
(iii) An electronic balance has a smallest value of 0.0001 g, while the weighing balance has a smallest value of 100 g. Thus, the electronic balance is more sensitive than a weighing balance.

� TOPIC 1 MEASUREMENT
22
1.2.2 Tools to Measure Length, Mass, Time, Electric and Temperature
Now let us look at the tools that we can use to measure length, mass, time, electric and temperature.
(a) Tools for Measuring Length There are several methods we can use to measure length. A long time ago,
people used parts of their body to measure length. For example, they used their legs, arms or fingers to measure the length of certain things.
Basically, there are five units of length when using parts of the body as a measurement: a span, a foot, a cubit, an arm span and a stride (refer to Figure 1.10).
Figure 1.10: Area of some regular shapes
Source: http://www.ilmoamal.org
Each has its own unique description. For example, the span is the distance from the tip of the thumb to the tip of the index finger, whereas a foot is the length of a human foot. Other than that, a cubit is the distance from the elbow to the tip of the middle finger. In addition, an arm span is the distance between an adult manÊs hands when the arms are outstretched. Last but not least, a stride is the distance covered by one long step. Our
Is the diamond yours? A friend asks to borrow your diamond for a day to show her family. You are a bit worried, so you carefully have your diamond weighted on a scale which reads 8.17 grams. The scale accuracy is claimed to be �0.05 grams. The next day, you weigh the returned diamond again, getting 8.09 grams. Is this your diamond?
Source: Giancolli (1998)
ACTIVITY 1.4

TOPIC 1 MEASUREMENT �
23
ancestors also used terms like a hail (sepelaung) or a boil of rice (setanak nasi) to describe a distance travelled.
Various tools have been designed so that we can measure length accurately as the Laser Distance Meter which is designed to measure length up to 100 metres using laser rays. Another common tool to measure length is the measuring tape. It measures lengths in millimetres (mm), centimetres (cm) and metres (m). It is often used to measure larger objects (more than 1 m).
In this topic we will to discuss three measuring instruments for length which is mmetre rule, vernier caliper and mmicrometer screw gauge.
(i) Metre Rule A meter rule is used to measure length of an object in the laboratory.
It can give reading to 0.1 centimetre (cm) or 1 millimetre (mm) depending on its type.
(ii) VVernier Caliper A vernier caliper is a measuring tool which can measure the length of
small objects between 0 and 10 cm. It has an accuracy of up to 0.01 cm. Figure 1.11 shows a vernier caliper.
Figure 1.11: Vernier caliper
Source: www.tutorvista.com
� TOPIC 1 MEASUREMENT
24
There are two scales in the vernier caliper:
� Main scale - Main scale is in cm where 1 cm is divided into 10 equal parts, and 1 part is equivalent to 0.1 cm (or 1 mm).
� Vernier scale - Vernier scale is a short scale of 0.9 cm long divided into 10 equal parts, where 1 part is equivalent to 0.09 cm. Thus, the difference in length between vernier divisions on the main scale is 0.1cm � 0.09 cm = 0.01 cm.
A vernier caliper can be used to measure the external and internal diameter of an object. When we want to measure the outer diameter of a container, we may use the outside jaws, while we use the inner jaws to measure the inner diameter of a container or tube.
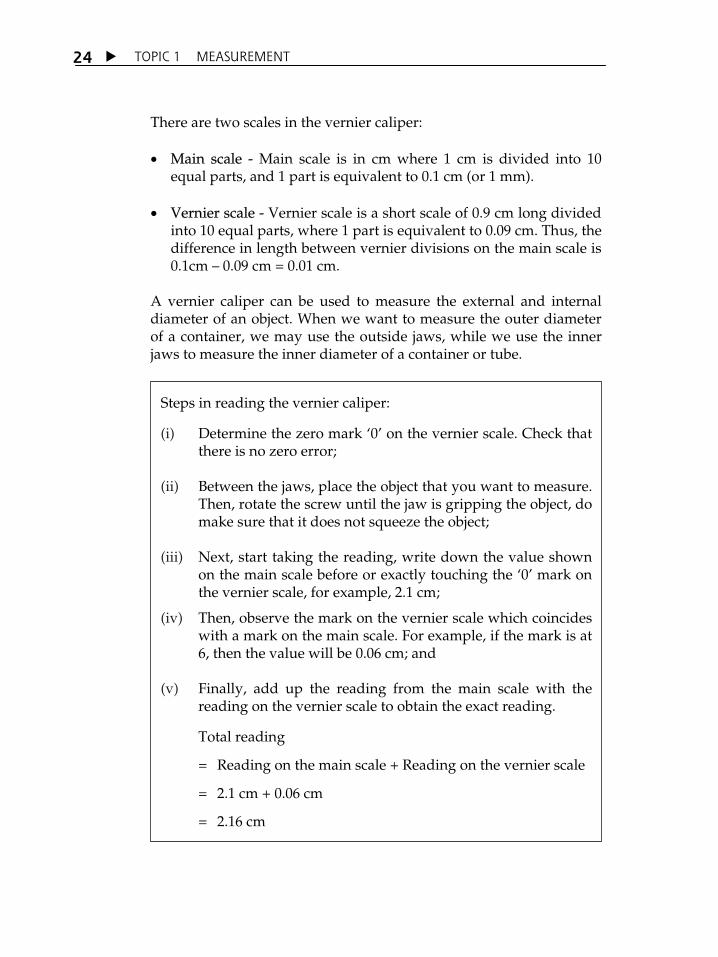
Steps in reading the vernier caliper:
(i) Determine the zero mark Â0Ê on the vernier scale. Check that there is no zero error;
(ii) Between the jaws, place the object that you want to measure.
Then, rotate the screw until the jaw is gripping the object, do make sure that it does not squeeze the object;
(iii) Next, start taking the reading, write down the value shown on the main scale before or exactly touching the Â0Ê mark on the vernier scale, for example, 2.1 cm;
(iv) Then, observe the mark on the vernier scale which coincides with a mark on the main scale. For example, if the mark is at 6, then the value will be 0.06 cm; and
(v) Finally, add up the reading from the main scale with the reading on the vernier scale to obtain the exact reading.
Total reading
= Reading on the main scale + Reading on the vernier scale
= 2.1 cm + 0.06 cm
= 2.16 cm

TOPIC 1 MEASUREMENT �
25
If the vernier caliper has a zero error, then the readings need to be corrected through the following formula:
To find out whether there is zero error or not, we must first close the jaws. If the zero mark on the vernier scale coincides with the zero mark on the main scale, then the vernier caliper does not have a zero error (Figure 1.12).
Figure 1.12: A vernier caliper with no zero error
(iii) Micrometer Screw Gauge If we want to measure the thickness or diameter of a small object, we
may use the micrometer screw gauge. It has an accuracy of up to 0.01 mm or 0.001 cm.
There are a few structures in a micrometer screw gauge �� the anvil,
spindle, sleeve, thimble and ratchet. See Figure 1.13.
� Anvil and Spindle � Used to grip the object that we want to measure.
� Sleeve � Used to determine the reading on the sleeve by referring to the scale on the thimble.
� Thimble � Thimble is actually connected to the graduated sleeve. It can be rotated in order to tighten the anvil and spindle. One revolution of the thimble will give 0.5 mm gap between the anvil and spindle. The scale on the thimble has 50 equal divisions and every division is 0.5/50 mm or 0.01 mm as we turn the thimble.

� TOPIC 1 MEASUREMENT
26
� Ratchet � We rotate the ratchet for fines adjustment so as to exert the correct amount of pressure on the object that we want to measure.
If the micrometer screw gauge has a zero error, then the readings need to be corrected through the following formula:
Figure 1.13:
Source: http://www.cyberphysics.co.uk/practical/skills/micrometer.htm
Procedure in using the micrometer screw gauge:
(i) Between the anvil and spindle, place the object that you want to measure;
(ii) Grip the object gently with the anvil and spindle by rotating the thimble; and
(iii) We may rotate the ratchet, but as soon as the first „clickÊ sound is heard we should stop. This is because the „click‰ sound tells us that the anvil and spindle are gripping the object gently without applying any pressure on it.

TOPIC 1 MEASUREMENT �
27
(b) TTools for Measuring Mass Imagine that you are now at the fish market. You see many different kinds
of fish sold at the stalls. Some are big and some are small. Each kind of fish is sold at different prices. Some are cheaper while others are more expensive. The price of the fish is not based only on its type but also on its mass. As we have discussed in the previous section, the higher the mass of the fish, the higher the price. The fishmonger will usually use a specific tool to measure the mass of the fish. It is called a bbalance.
In general, the mass of an object can be measured using a balance. There
are several types of balance as shown in Figure 1.14, Figure 1.15 and Figure 1.16.
Both ruler and measuring tape are useful for measuring length or distance. However, sometimes, one tool is more suitable than the other depending on what kind of objects we want to measure. Based on this assumption, fill in the following table. Length Measured Tool Unit
Examples Length of paper clip
Examples Ruler
Examples mm
Length and height of a refrigerator m
Length and width of a badminton court Measuring tape
Height of a classmate
Circumference of a ball
Height of a cat
Length of a necktie
Circumference of a marble
Height of a rambutan tree
SELF-CHECK 1.2

� TOPIC 1 MEASUREMENT
28
Figure 1.14: Electronic balance
Source: www.lehmanscientific.com
Figure 1.15: Lever balance
Source: www.psawcatalogue.com
Figure 1.16: Compression balance
Source: www.narangindustries.com

TOPIC 1 MEASUREMENT �
29
In a formal setting like in the laboratory, a lever balance is used to measure an objectÊs mass. Besides the above mentioned balances, there is also another type of balance called ttriple-beam balance which is used to find the mass of various objects (see Figure 1.17) in a laboratory.
Figure 1.17: Triple-beam balance
Source: http://www.southwestscales.com
When we use triple-beam balance, the objects are placed on the scale and then we move the weights on the beams until we get the lines on the right-side of the scale to match up. Once we have balanced the scale, we have to add up the amounts on each beam to find the total mass.
Steps in using triple-beam balance to measure mass: (i) Place the objects on the scale;
(ii) Slide the large weight to the right until the arm drops below the
line. Move the rider back one groove. Make sure it „locks‰ into place;
(iii) Repeat this process with the top weight. When the arm moves below the line, back it up one groove;
(iv) Slide the small weight on the front beam until the lines match up; and
(v) Add the amounts on each beam to find the total mass to the nearest tenth of a gram.

� TOPIC 1 MEASUREMENT
30
(c) Tool for Measuring Time
Stopwatch We can use a stopwatch to measure a short period of time. Hence, a
stopwatch is usually used in a sports event or in a laboratory. On the middle upper part of an analogue stopwatch, there is a knob. We press the knob when we want to start the stopwatch. We need to press the knob a second time in order to stop the watch. In order to restart again, we press the knob for the third time. Alternatively, we can use digital stopwatch which often have more features.
�
�Figure 1.18: Reading in a triple-beam balance
Source: www.regentsprep.org
Based on the reading in Figure 1.18, what would be the mass of the object measured in the picture? _______ + ______ + _______ = ________ g
SELF-CHECK 1.3
There are many types of balances, such as lever, compression and electronic. Search the Internet to find out more about these. You may search for more information on their:
(a) Attributes;
(b) Functions and usefulnesses; and
(c) Advantages and disadvantages.
ACTIVITY 1.5
TOPIC 1 MEASUREMENT �
31
(d) TTools for Measuring Electric Current There are two tools that can be used to measure electric current . They are:
(i) Ammeter An ammeter is used to measure the quantity of electric current. The
SI unit of electrical current is amperes (A). There are more sensitive types of ammeter, which are the milliamperes (mA) and the microamperes (�A).
In order to measure the current, we need to connect the ammeter in series. We have to make sure that the positive terminal of the battery is connected to the positive terminal of the ammeter and vice versa in order to measure the electric current. The deflection of the ammeter pointer shows the value of the current flowing through the circuit. The pointer of the ammeter will deflect slightly below the zero mark if the connection of the circuit is wrong.
1 ampere = 1,000 milliamperes (mA) 1 milliampere (mA) = 1,000 micoramperes (�A)
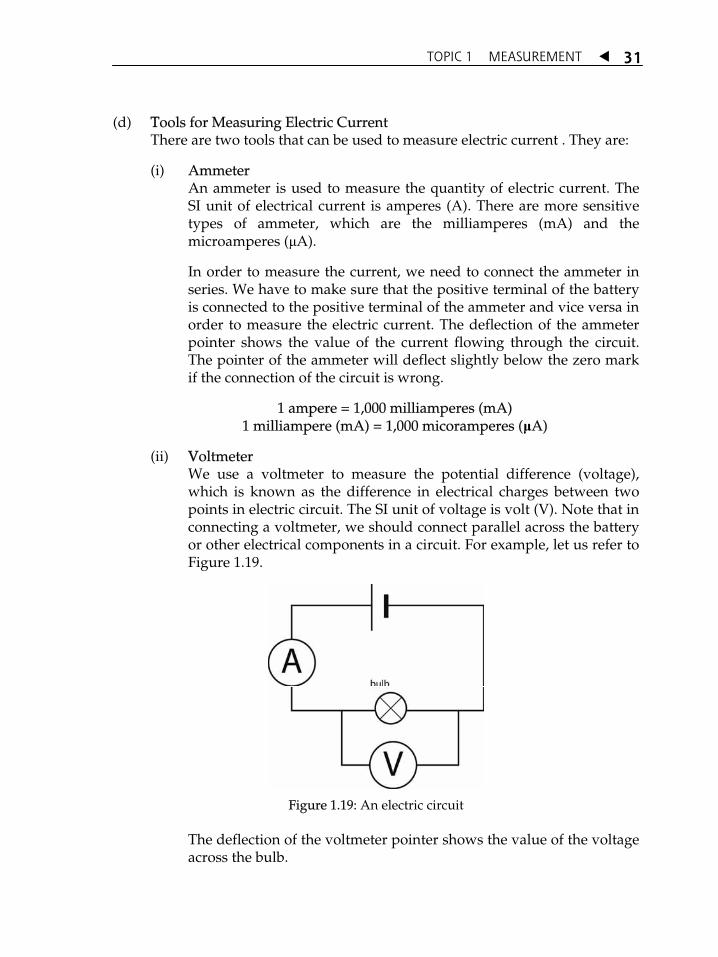
(ii) VVoltmeter We use a voltmeter to measure the potential difference (voltage),
which is known as the difference in electrical charges between two points in electric circuit. The SI unit of voltage is volt (V). Note that in connecting a voltmeter, we should connect parallel across the battery or other electrical components in a circuit. For example, let us refer to Figure 1.19.
Figure 1.19: An electric circuit
The deflection of the voltmeter pointer shows the value of the voltage across the bulb.

� TOPIC 1 MEASUREMENT
32
(e) TTool for Measuring Temperature
Thermometer We use a thermometer to measure temperatures accurately. Usually we use
mercury thermometers to measure temperatures. A thermometer has its own special sealed tube which contains either mercury or alcohol. Both liquids are sensitive and will expand when they are heated and contract when they are cooled. Usually, a dye is added to the alcohol to make it easy to read the scales.
Temperature is proportional to the average kinetic energy of molecular motion in a substance. Thus, when a thermometer is in contact with the object whose temperature we wish to find, energy will flow between the two media until their temperatures are equal and thermal equilibrium is established. By reading the scales on the thermometer, we will know the temperature of an object. A thermometer should be small enough and must not alter the temperature of the object we are measuring. There are many types of thermometers. The most commonly used thermometers are:
(i) Laboratory thermometer
This thermometer is used specifically in the laboratory. It is used to measure temperature when an experiment is being done in the science laboratory (see Figure 1.20). The normal reading scale is from -100C to 1100C.
Figure 1.20: Laboratory thermometer
Source: http://www.northernbrewer.com

TOPIC 1 MEASUREMENT �
33
(ii) Clinical Thermometer This thermometer is used by medical doctors to measure the
temperature of people. A healthy person should have a body temperature of 37oC. This thermometer is designed to have a narrow constriction in the tube to prevent the mercury from returning to the bulb after it is taken out from the mouth. A sharp jerk is required to make the mercury go back to the bulb.
Measuring Temperature and Correct Technique to use the Thermometer In order to measure temperature using a thermometer in the correct manner, hold the thermometer vertically. The eyes should be at the same level as the curved surface of the mercury in the capillary tube of the thermometer. By getting accurate information about the temperature of an object, it will tell us how cold or hot the object is. In everyday life, we often deal with things related to temperature. For instance, if we want to eat instant noodles, we need to boil water until it reaches a certain degree. Do you know what temperature indicates the heated water has reached its boiling point? The next activity will deal with measuring the temperature of water when it is heated.
Measuring temperature of water when it is heated
Materials: Bunsen burner, thermometer, beaker, retort stand, tripod stand, stopwatch, wire gauze, distilled water.
Steps: Place a wire gauze on a tripod stand and a beaker containing 100ml of water on the wire gauze. Heat the water slowly with the Bunsen burner. Read the temperature of the water every 30 seconds. Continue heating until the water boils. Record the readings in the table below.
Time (Seconds) 30 60 90 120 150 180 210 240
Temperature (oC)
Draw a graph on a piece of paper to show the relationship between the time and temperature of water.
ACTIVITY 1.6

� TOPIC 1 MEASUREMENT
34
GRAPH TECHNIQUE
In this subtopic, we will discuss on how to present data in a table, draw graph and analyse graph.
1.3.1 Table of Data
Data is arranged so that it can be presented systematically. In order to ensure the tidiness of the data, we may present the data in a table as shown in Table 1.7:
Table 1.7: How We Can Present Data in a Table
Name of the manipulated variable (symbol, unit)
Name of the responding variable (symbol, unit)
1st reading, A
2nd reading, BB
Average reading, (A+B)/2
At least five sets of readings for each table, decimal places according to the sensitivity of the instrument. Readings must be consistent in decimal places.
20
22.9
19.66
1.3
Avoid inconsistent
decimal places
Measuring the water when it is cooled
Steps After the water has been boiled, remove the water from the Bunsen burner. Let the water cool naturally to room temperature. Record the temperature of the water every thirty seconds. Record the readings in the table below.
Time (Seconds) 30 60 90 120 150 180 210 240
Temperature (oC)
Based on the information, draw a graph on a piece of paper to show the relationship between the time and the temperature of the water.
ACTIVITY 1.7

TOPIC 1 MEASUREMENT �
35
For example,
Length of the Thread, l (cm)
Time Taken for 20 Complete Circulations, t (s) t1 t2 taverage
10 20.2 20.4 20.3
20 19.9 19.9 19.9
30 19.7 19.8 19.8
40 19.0 19.0 19.0
50 20.0 20.1 20.1
60 19.5 19.5 19.5
1.3.2 Drawing Graph In order to analyse the results of an experiment, we may use a graphical method. The relationship between two physical quantities is shown through a graph, such as the graph of time against length shows the relationship between the length of a pendulum and the period of oscillation. A Step-by-step Guide to Draw a Graph (a) DDetermine the Axes (see Figure 1.21).
Figure 1.21: Determining the axes in a graph

� TOPIC 1 MEASUREMENT
36
(b) DDetermine the Scale of the Graph We use scale to fit our data into the graph, and we may use the unit of
representation such as:
1cm represents 2 units (1 cm: 2 units), 2cm: 5 units, or 2cm: multiplication of 10 units.
But, avoid using odd scales like 1cm: 3 units and 1 cm: 9 units. This will lead to some difficulties when we want to take readings from the graph.
(c) PPlot the Readings Plotting the readings is a process where we transfer the data into the graph.
It is best to use a sharp pencil when drawing. A cross (X) is used to represent the point of a graph. A graph should contain at least five points.
Figure 1.22: Example of a good graph
(d) JJoin the Points In a straight line graph, one should try to join the points with the following
criteria. If possible, the line should:
(i) Pass through as many points and any one of the axis;
(ii) If the points cannot fit into the line, the number of the points above and below the line should be approximately the same; and
(iii) Be smooth.
A good example of graph is shown in Figure 1.22.

TOPIC 1 MEASUREMENT �
37
(e) DDetermine the Title of the Graph A good graph will always contain the title of the graph which is written on
top of the graph by the following form:
A graph of responding variable against manipulated variable
For example: A graph of time against length
1.3.3 Analysis of Graphs
We can analyse a graph by finding its gradient. The gradient of the graph can be determined by the following steps: Pick two points that are far apart. Draw a right-angled triangle as shown in Figure 1.23.
Figure 1.23: A right-angled triangle
Calculate the value of ’’�y (difference in the y-coordinates) and �x (difference in the x-coordinates).
� � �
� � �2 1
2 1
, andy y y
x x x

� TOPIC 1 MEASUREMENT
38
���
��
�2 1
2 1
Gradientyx
y yx x
For example, if the two selected points are (s, 4) and (20, 24), then
3
3
��
�
�
�
27 4The Gradient
20 52
151.5
PRACTICAL INVESTIGATIONS IN PRIMARY SCIENCE CURRICULUM
In the primary science, measurements are taught at the Year 3 level. Pupils were required to measure various physical properties such as length, area, volume, mass and time using non-standard and standard measurements.
1.4.1 Measurement of Length
In the measurement of length, students were required to suggest and do activities on different ways that they can measure length using non-standard measuring tools such as using their hands or parts of their body. Other than using parts of the human body, we can use other tools for measurement such as a book, pen or box. These things are more uniform. For example, take your own eraser and use it to measure this book. The diagram below shows how an eraser can be used to measure the length of a book (see Figure 1.24).
1.4

TOPIC 1 MEASUREMENT �
39
Figure 1.24: Measuring length of a book using an eraser
Based on Figure 1.24, we can measure the length of the book by counting how many erasers cover the length of the book. This diagram shows that the length of the book is approximately equal to three times the length of the eraser. Pupils were then required to measure length using standard measuring tools such as measuring tape. The measuring tape will have standard units like millimetres (mm), centimetres (cm) and metres (m). Another example is a ruler, which measures lengths in millimetres (mm) and centimetres (cm). The measurements will be recorded in a graphic organiser.
1.4.2 Measurement of Area
Knowing length, pupils need to apply the information to calculate area. They will be given activities that will lead them to understand the concept area. For example, a few 1cm � 1cm squares will be used to produce a 4 cm � 4 cm square and 8 cm � 8 cm square, and make comparisons between the numbers of 1 cm � 1 cm squares that can make up the two bigger squares. Pupils were then required to calculate the area using standard units in the metric system and use formulae like area = length � width.
1.4.3 Measurements of Volume
Objects in the solid and liquid form are considered for the measurements of volume. For solids, the suggested activity is to arrange a 1 cm3 cubes into a bigger cube for example, a 4 cm3 cube or a 2 cm � 4 cm � 8 cm cuboid. Students compare the total number of cubes that can fill up the bigger cube/cuboid to

� TOPIC 1 MEASUREMENT
40
discuss volume, or use the formula, volume = length � breadth � height to calculate volume and state their answers in standard units. Both the non-standard ways to measure volume such as using cups, cap of a bottle and standard ways such as using beakers, measuring cylinders are used to give pupils the idea on volume. Pupils make measurements of liquids given by using different standard measuring tools and give their answers in the standard metric units.
1.4.4 Measurement of Mass
Various tools for measuring mass are introduced in this topic such as lever balance. Non-standard measurements can be used by comparing the mass of the object measured with the mass of a book, glass or any available objects. Pupils need to know the standard units for mass in the metric system such as mg, g and kg. They will take measurements using the correct technique and record the findings in the form of graphic organisers.
1.4.5 Measurements of Time
Non-standard ways to measure time will be discussed. Some examples are the swinging pendulum, water dripping or the pulse. Pupils are required to measure the time taken for an action using this non-standard time measurement technique. They also need to know that they can only use things that repeat uniformly to measure time. The pupils are then required to choose appropriate standard tools to measure time by using a stopwatch etc. They need to state the measurements in the standard units for time such as seconds, minute or hour.
� A physical quantity is a quantity that can be measured.
� A base quantity is a physical quantity that cannot be defined in terms of other physical quantities.
� Derived quantities are produced from the combination of base quantities through some operation such as multiplication, division or both.

TOPIC 1 MEASUREMENT �
41
� Some derived quantities are area (m2), volume (m3), density (kg/m3) and velocity (m s-1).
� When we make measurements, there are certain things that we need to know about the measuring tools that we use so that we can get the best results for our measurements.
� The three important aspects of a measurement are precision, accuracy and sensitivity.
� Precision is the ability of the instrument to give consistent readings when the same physical quantity is measured more than once.
� Accuracy refers to how close is the measured value compared with the actual value.
� Sensitivity is the ability of detecting small changes in the measured quantity.
� In order to measure the length of a small object between 0 and 10 cm, we may use the vernier caliper, as it has an accuracy of up to 0.01 cm.
� If we want to measure the thickness or diameter of a small object, we may use the micrometer screw gauge.
� The mass of an object can be measured using a balance.
� Stopwatch is used to measure a short period of time.
� Voltmeter is used to measure the potential difference (voltage), which is known as the difference in electrical charges between two points in an electric circuit.
� Thermometer is used to measure temperatures.
� Graphical method is used to analyse the result of an experiment.
� A graph is analysed by finding its gradient.

� TOPIC 1 MEASUREMENT
42
Accuracy
Base quantity
Derived quantity
Graph technique
Precision
SI unit
Sensitivity
Tools
Beyer, B. K. (1997). Improving student thinking: A comprehensive approach.
Boston: Allyn & Bacon. Giancoli, D. C. (1998). Physics: Principles with applications. New Jersey: Prentice
Hall. Hartman, H. J. (2002). Tips for the science teacher. Thousand Oaks: Corwin Press. Hewitt, P. G. (1998). Conceptual physics. (8th ed.). Reading: Addison-Wesley.