tonometry – past, present and future -...
TRANSCRIPT

6
Tonometry – Past, Present and Future
Elliot M. Kirstein, Ahmed Elsheikh and Pinakin Gunvant 1The Glaucoma and Diabetes Eye Institute,
Harpers Point Eye Associates, Cincinnati, Ohio, 2School of Engineering, University of Liverpool, Liverpool,
3College of Optometry, Western University of Health Sciences, Pomona, CA
1,3USA 2UK
1. Introduction
The technology used to estimate intraocular pressure (IOP) has evolved tremendously since Sir William Bowman emphasized the importance of ocular tension measurements. In an address delivered at the 1826 meeting of the British Medical Association, Sir William underscored the critical role that digital estimation of ocular tension played in his practice. (In this case the term "digital" refers to palpation of the eyes using the fingers–the digits.) In his address, Sir William stated: “…it is now my constant practice, where defective vision is complained of, to ascertain almost at the first instant the state of tension in the eye.… It is easy enough to estimate the tension of the eye, though there is a right and a wrong way of doing even so simple a thing…. With medical men, the touch is already an educated sense, and a very little practice should suffice to apply it successfully to the eye.” (Bowman, 1856) Soon afterwards, digital palpation tonometry became an essential clinical skill to be mastered by all ophthalmologists. When mechanical tonometry was first introduced in the late 1800s, many ophthalmologists felt so confident with their ability to estimate IOP by palpation that they viewed the new technology as inferior. We have indeed come a long way from there and there is currently no doubt on the need to perform tonometry as an essential measurement performed in any ocular examination. IOP has been associated with glaucoma for a long time and clinicians managing glaucoma patients have a love hate relationship with IOP. This is in part due to errors in tonometry and the variability in measurement of IOP. As clinicians we look for data that is helpful in managing a disease, data that is consistent, reproducible and accurate. IOP, like many other physiological measurements, is in a state of flux and can vary both short term and long term. To complicate the issues further, there are numerous ocular biomechanical factors like central corneal thickness, corneal curvature, corneal rigidity and hydration that can lead to errors in IOP measurement clinically. (Brandt et al, 2001; Goldmann & Schmidt, 1957; Liu & Roberts, 2005; Orssengo & Pye, 1999; Whitacre et al, 1993) Contrary to once believed, high IOP value is not as integral to the diagnosis of glaucoma and one-off IOP measurement of 21 mmHg or greater does not constitute a diagnosis of
www.intechopen.com
Glaucoma – Current Clinical and Research Aspects
86
glaucoma. While ocular hypertensive patients have IOP that is consistently over 21 mmHg, a pressure below this value does not equate to physiological normality. Despite these arguments, IOP remains the single most important alterable risk factor in the management of glaucoma as has been pointed out by various epidemiological studies (Goldmann & Schmidt, 1957; Schnabel, 1908). However, there are numerous factors that may lead to frank errors in IOP measurement (Whitacre and Stein 1993) and others that lead to IOP fluctuation. Overall IOP is thought to show polygenic inheritance with a definite environmental contribution. (Goldmann, 1961) The factors that can contribute to long term fluctuations or variations in IOP are age, blood pressure and seasonal variations (Whitacre and Stein 1993). While these factors are of theoretical interest, they are of minimal clinical importance and tend to co-vary. The factors that contribute to short term fluctuations in IOP are diurnal variations, body posture, exercise, eye movements, activities causing valsalva maneuver and food and drug effects. (Bowman, 1852) These factors can pose a significant problem in clinical management, as level of IOP is one of the integral measurements that help decide the clinical efficacy of glaucoma medications and to some extent the management strategy in patients with or at risk of glaucoma. These short term fluctuations in IOP make the case for having many IOP measurements at different times of day and possibly continuous IOP monitoring diurnally to initiating therapy or making changes to the management of patients. This chapter will address the following areas: 1) past and present technologies available to perform IOP measurement through tonometry 2) the principles behind tonometry devices 3)The errors in IOP measurement caused by physiological variations in ocular parameters, when measurements are made by the Goldmann applanation tonometer 4) tonometric correction factors that have been developed for the Goldmann applanation tonometer to eliminate errors in IOP measurement when mea, and 4) the continuous monitoring of IOP using telemetry methods.
2. Historical perspectives
2.1 Impression tonometry
Although Albrecht von Graefe is credited with the first attempts to create instruments that mechanically measured IOP in the early 1860s, his proposed instruments were neither designed nor built. Rather, it was Donders who designed the first instrument capable of estimating IOP – albeit not accurately – in the mid 1860s. With this instrument, which was refined by Smith and Lazerat in the 1880s, ophthalmologists first measured the curvature of the sclera at the site of contact and used the measurement to determine the depth of indentation produced by the tonometer tip. However, the later discovery of cocaine by Carl Koller in 1884 led the way to corneal impression tonometry. Using corneal anesthesia, corneal tonometry became the definitive choice for IOP measurement because it offered a well-defined and uniform site of impression. The major shortcoming of impression tonometry was that it displaced so much fluid upon contact with the eye that the measured readings were highly variable and mostly inaccurate. What was needed was a way to displace a minimal amount of fluid to record IOP. This breakthrough came in 1867 when Adolf Weber designed the first applanation tonometer that gave a highly defined applanation point without indentation. After two decades of skepticism,
www.intechopen.com

Tonometry – Past, Present and Future
87
the value of applanation tonometry was re-discovered when Alexei Maklakoff and others introduced new versions of applanation tonometers similar to that depicted in figure 1. In the early 20th century, while many tonometer models had become available, digital palpation tonometry remained the “gold standard” among most ophthalmologists. (Kniestedt et al, 2004) The first commonly used mechanical tonometer was designed and introduced by Hjalmar Schiotz in the early 1900s (figure 2). The instrument was simple, easy to use and relatively precise. It was quickly accepted and became the new gold standard beginning the 1910s. Innovations in calibration led to its increased use, and a tremendous amount of knowledge about the normal and glaucomatous eye was quickly acquired.
Fig. 1. Maklakoff’s original tonometer, circa 1885.
Fig. 2. Schiotz Tonometer.
www.intechopen.com
Glaucoma – Current Clinical and Research Aspects
88
2.2 Indentation (Schiotz) tonometry
This type of tonometry uses a plunger to indent the cornea. IOP is determined by measuring how much the cornea is indented by a given weight. The test is less accurate than applanation tonometry and is not commonly used today by ophthalmologists and optometrists.
2.3 Goldmann Applanation Tonometer
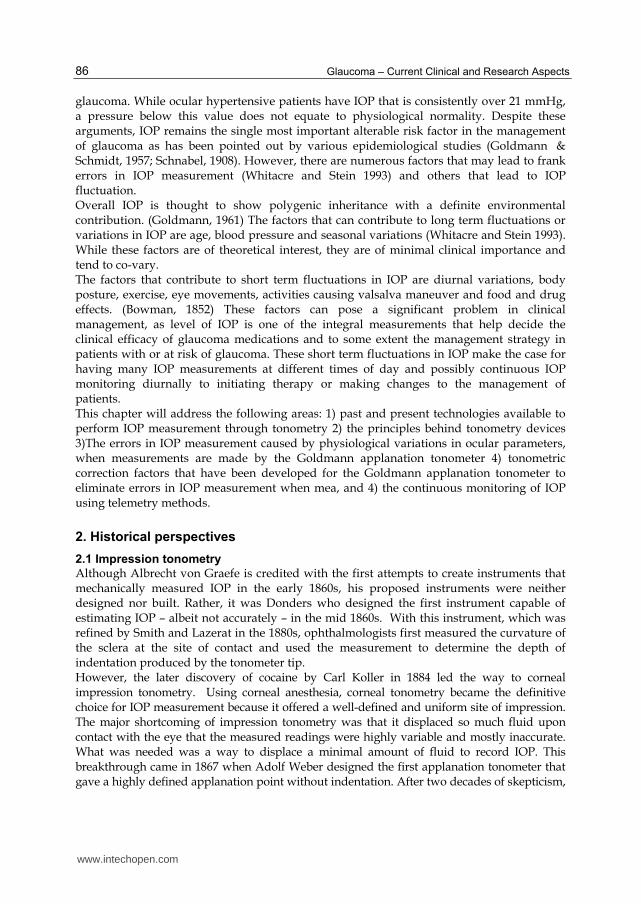
Since its introduction in the 1950s, the Goldmann Applanation Tonometer (GAT) has gained widespread acceptance and remained the reference standard in tonometry (ISO, 2001). The technique is based on Imbert-Fick law, according to which the intraocular pressure (IOP), p, is inferred from the force, W, required to applanate a certain area, A, of the central cornea, Figure 3.
W = p.A (1)
Fig. 3. Corneal applanation under the action of the Goldmann Applanation Tonometer
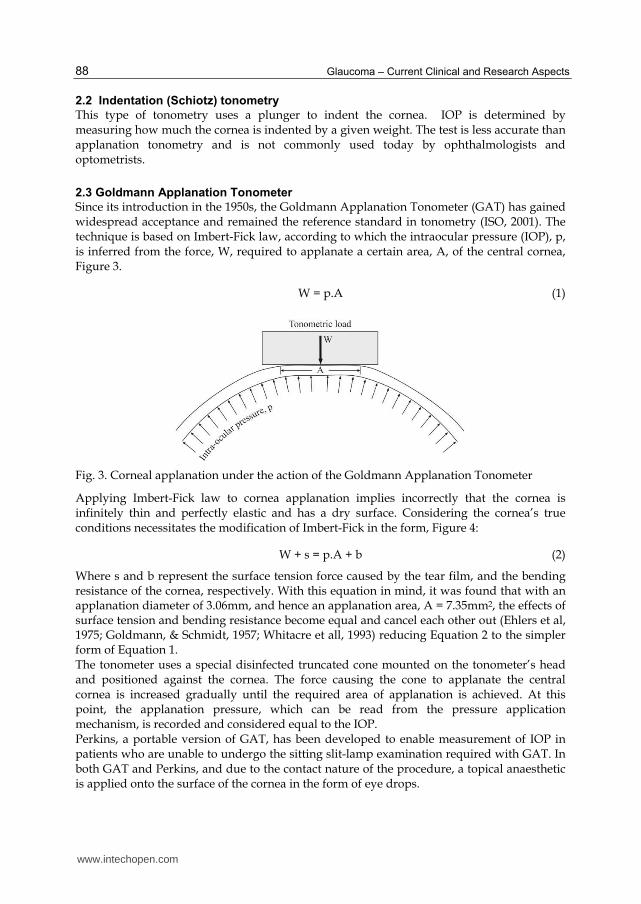
Applying Imbert-Fick law to cornea applanation implies incorrectly that the cornea is infinitely thin and perfectly elastic and has a dry surface. Considering the cornea’s true conditions necessitates the modification of Imbert-Fick in the form, Figure 4:
W + s = p.A + b (2)
Where s and b represent the surface tension force caused by the tear film, and the bending resistance of the cornea, respectively. With this equation in mind, it was found that with an applanation diameter of 3.06mm, and hence an applanation area, A = 7.35mm2, the effects of surface tension and bending resistance become equal and cancel each other out (Ehlers et al, 1975; Goldmann, & Schmidt, 1957; Whitacre et all, 1993) reducing Equation 2 to the simpler form of Equation 1. The tonometer uses a special disinfected truncated cone mounted on the tonometer’s head and positioned against the cornea. The force causing the cone to applanate the central cornea is increased gradually until the required area of applanation is achieved. At this point, the applanation pressure, which can be read from the pressure application mechanism, is recorded and considered equal to the IOP. Perkins, a portable version of GAT, has been developed to enable measurement of IOP in patients who are unable to undergo the sitting slit-lamp examination required with GAT. In both GAT and Perkins, and due to the contact nature of the procedure, a topical anaesthetic is applied onto the surface of the cornea in the form of eye drops.
www.intechopen.com
Tonometry – Past, Present and Future
89
Fig. 4. Factors that influence the IOP measurement by GAT including the surface tension forces created by the tear film and the bending resistance of the cornea
2.4 McKay–Marg and TonoPen tonometry
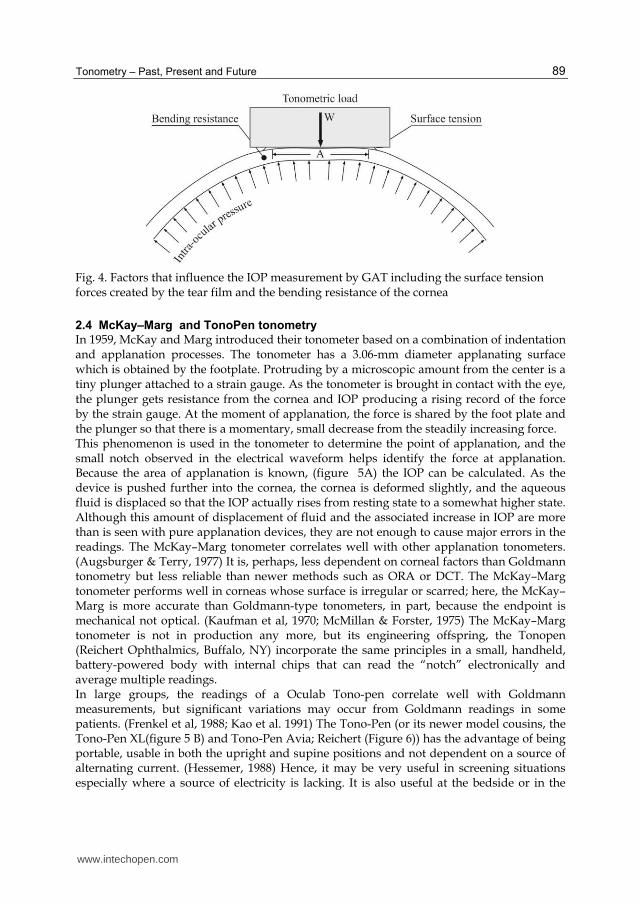
In 1959, McKay and Marg introduced their tonometer based on a combination of indentation and applanation processes. The tonometer has a 3.06-mm diameter applanating surface which is obtained by the footplate. Protruding by a microscopic amount from the center is a tiny plunger attached to a strain gauge. As the tonometer is brought in contact with the eye, the plunger gets resistance from the cornea and IOP producing a rising record of the force by the strain gauge. At the moment of applanation, the force is shared by the foot plate and the plunger so that there is a momentary, small decrease from the steadily increasing force. This phenomenon is used in the tonometer to determine the point of applanation, and the small notch observed in the electrical waveform helps identify the force at applanation. Because the area of applanation is known, (figure 5A) the IOP can be calculated. As the device is pushed further into the cornea, the cornea is deformed slightly, and the aqueous fluid is displaced so that the IOP actually rises from resting state to a somewhat higher state. Although this amount of displacement of fluid and the associated increase in IOP are more than is seen with pure applanation devices, they are not enough to cause major errors in the readings. The McKay–Marg tonometer correlates well with other applanation tonometers. (Augsburger & Terry, 1977) It is, perhaps, less dependent on corneal factors than Goldmann tonometry but less reliable than newer methods such as ORA or DCT. The McKay–Marg tonometer performs well in corneas whose surface is irregular or scarred; here, the McKay–Marg is more accurate than Goldmann-type tonometers, in part, because the endpoint is mechanical not optical. (Kaufman et al, 1970; McMillan & Forster, 1975) The McKay–Marg tonometer is not in production any more, but its engineering offspring, the Tonopen (Reichert Ophthalmics, Buffalo, NY) incorporate the same principles in a small, handheld, battery-powered body with internal chips that can read the “notch” electronically and average multiple readings. In large groups, the readings of a Oculab Tono-pen correlate well with Goldmann measurements, but significant variations may occur from Goldmann readings in some patients. (Frenkel et al, 1988; Kao et al. 1991) The Tono-Pen (or its newer model cousins, the Tono-Pen XL(figure 5 B) and Tono-Pen Avia; Reichert (Figure 6)) has the advantage of being portable, usable in both the upright and supine positions and not dependent on a source of alternating current. (Hessemer, 1988) Hence, it may be very useful in screening situations especially where a source of electricity is lacking. It is also useful at the bedside or in the
www.intechopen.com

Glaucoma – Current Clinical and Research Aspects
90
operating room. The Tono-Pen is able to record IOP through a bandage contact lens, which makes it useful in eyes with alkali or other chemical burns, chronic neurotrophic ulceration, and other situations where a bandage contact lens is therapeutically indicated and where removing it for pressure measurement may cause problems. (Mark et al, 1992; Panek et al, 1990)
Fig. 5.
The Tono-Pen is used with disposable latex covers with a new one used for each patient reducing the chance of transmission of infectious agents. However, this adds to the cost of pressure measurement, as does the need for battery replacement. As noted above, there may
www.intechopen.com
Tonometry – Past, Present and Future
91
be significant variation from Goldmann readings. It is not known if this is because of inaccuracy on the part of the Tono-Pen or the Goldmann. The Tono-Pen gives a similar snapshot of IOP as the airpuff type tonometers. From the Tono-Pen readings, it is difficult to ascertain the size of the IOP pulse or where in that pulse wave the pressure reading may be. The Tono-Pen XL takes an average of 4 readings and the Tono-Pen Avia 10 readings, and each gives a statistical indicator of reliability.
Fig. 6. Tono-Pen Avia
2.5 Non-Contact Tonometry (NCT)
In 1970’s individuals without a medical degree were not permitted to instill topical anesthesia which was a pre-requisite to perform tonometry with any device. Non-contact tonometry was a timely invention of Dr. Bernard Grolman which allowed optometrists to measure IOP without the need of anesthesia (Reichert website 2011). Non-contact (also called air-puff) tonometers do not touch the eye because they use a puff of air to flatten (applanate) the cornea. Once initiated, the puff force increases until the cornea is applanated over a predetermined area. The tonometer then translates the applanation force into a measure of IOP (see figure 3). Because the air puff tonometer relies on corneal applanation, it is subject to the same potential measurement errors induced by variations in corneal properties, as is the Goldmann tonometer and these errors are exaggerated in the measurement outcome (Tonnu et al, 2005) An additional source of error in NCT measurements is that IOP is determined at a single very brief instant in time and IOP can pulsate considerably over time as the choroid fills with blood and then empties in concert with the cardiac cycle. This phenomenon can be directly observed by viewing pulsation of mires during Goldmann tonometry. (To some degree, Goldmann takes this pressure variation into account because measurements are made when the inner aspects of the pulsating mires just touch.) In some individuals, IOP can vary as much as 5 or 6 mm Hg within one second while the choroid fills and empties. The NCT has no ability to determine at what point in an individual's intraocular pressure cycle the IOP is measured. These issues are better handled by devices that continuously measure IOP for 8 seconds or longer (figure 4).
www.intechopen.com

Glaucoma – Current Clinical and Research Aspects
92
Fig. 7. The original American Optical (Reichert) non-contact tonometer.
Fig. 8. Intraocular pressure pulsation
www.intechopen.com
Tonometry – Past, Present and Future
93
3. Major errors in IOP measurements using the Goldmann Applanation Tonometer
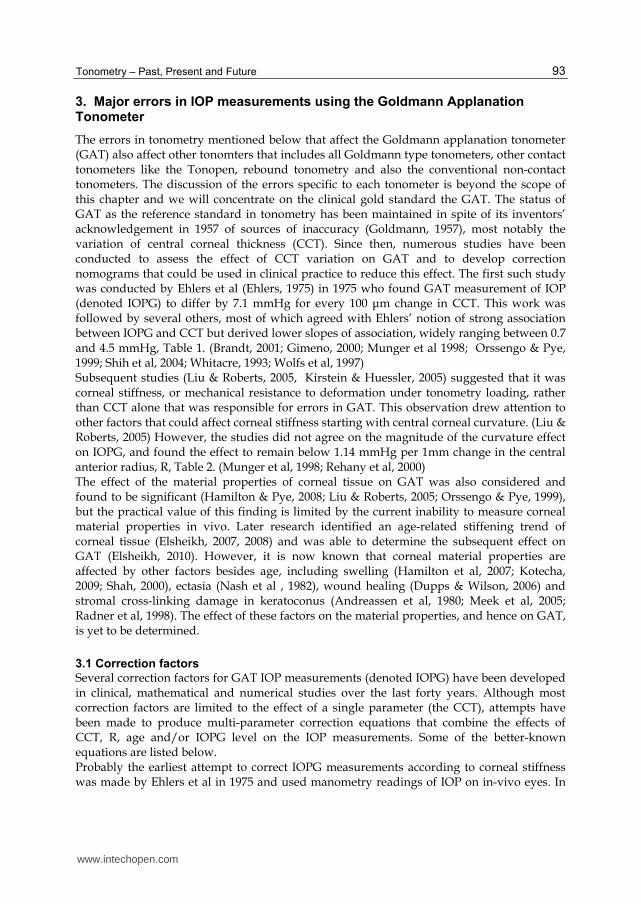
The errors in tonometry mentioned below that affect the Goldmann applanation tonometer (GAT) also affect other tonomters that includes all Goldmann type tonometers, other contact tonometers like the Tonopen, rebound tonometry and also the conventional non-contact tonometers. The discussion of the errors specific to each tonometer is beyond the scope of this chapter and we will concentrate on the clinical gold standard the GAT. The status of GAT as the reference standard in tonometry has been maintained in spite of its inventors’ acknowledgement in 1957 of sources of inaccuracy (Goldmann, 1957), most notably the variation of central corneal thickness (CCT). Since then, numerous studies have been conducted to assess the effect of CCT variation on GAT and to develop correction nomograms that could be used in clinical practice to reduce this effect. The first such study was conducted by Ehlers et al (Ehlers, 1975) in 1975 who found GAT measurement of IOP (denoted IOPG) to differ by 7.1 mmHg for every 100 ┤m change in CCT. This work was followed by several others, most of which agreed with Ehlers’ notion of strong association between IOPG and CCT but derived lower slopes of association, widely ranging between 0.7 and 4.5 mmHg, Table 1. (Brandt, 2001; Gimeno, 2000; Munger et al 1998; Orssengo & Pye, 1999; Shih et al, 2004; Whitacre, 1993; Wolfs et al, 1997) Subsequent studies (Liu & Roberts, 2005, Kirstein & Huessler, 2005) suggested that it was corneal stiffness, or mechanical resistance to deformation under tonometry loading, rather than CCT alone that was responsible for errors in GAT. This observation drew attention to other factors that could affect corneal stiffness starting with central corneal curvature. (Liu & Roberts, 2005) However, the studies did not agree on the magnitude of the curvature effect on IOPG, and found the effect to remain below 1.14 mmHg per 1mm change in the central anterior radius, R, Table 2. (Munger et al, 1998; Rehany et al, 2000) The effect of the material properties of corneal tissue on GAT was also considered and found to be significant (Hamilton & Pye, 2008; Liu & Roberts, 2005; Orssengo & Pye, 1999), but the practical value of this finding is limited by the current inability to measure corneal material properties in vivo. Later research identified an age-related stiffening trend of corneal tissue (Elsheikh, 2007, 2008) and was able to determine the subsequent effect on GAT (Elsheikh, 2010). However, it is now known that corneal material properties are affected by other factors besides age, including swelling (Hamilton et al, 2007; Kotecha, 2009; Shah, 2000), ectasia (Nash et al , 1982), wound healing (Dupps & Wilson, 2006) and stromal cross-linking damage in keratoconus (Andreassen et al, 1980; Meek et al, 2005; Radner et al, 1998). The effect of these factors on the material properties, and hence on GAT, is yet to be determined.
3.1 Correction factors
Several correction factors for GAT IOP measurements (denoted IOPG) have been developed in clinical, mathematical and numerical studies over the last forty years. Although most correction factors are limited to the effect of a single parameter (the CCT), attempts have been made to produce multi-parameter correction equations that combine the effects of CCT, R, age and/or IOPG level on the IOP measurements. Some of the better-known equations are listed below. Probably the earliest attempt to correct IOPG measurements according to corneal stiffness was made by Ehlers et al in 1975 and used manometry readings of IOP on in-vivo eyes. In
www.intechopen.com
Glaucoma – Current Clinical and Research Aspects
94
Authors Year Effect on GAT IOP
associated with 100 µm change in CCT (mmHg)
Notes
Ehlers et al 1975 7.1 Manometry study on in-
vivo eyes
Schneider and Grehn
2006 4.50 100 healthy participants
Kohlhaas et al 2006 4.23 125 cataract patients, CCT
= 569+-44 (462-705) microns
Ko et al 2005 3.70 170 participants
Tonnu et al 2005 2.80 105 glaucoma patients
Gunvant et al 2004 2.70 334 healthy participants, CCT = 518 (426 to 616)
microns
Gunvant et al 2003 2.6
Foster et al 1998 1.8 (right), 2.4 (left) 1242 participants, CCT = 495+-32 (right), 514+-32
(left) microns
Bhan et al 2002 2.30 181 healthy participants, CCT = 551+-49 microns
Whitacre et al 1993 2.28 Manometry study on 15
eyes
Wolfs et al 1997 1.90 395 participants, CCT = 537
(427-620) microns
Foster et al 2003 1.5 to 1.8 1232 participants
Elsheikh et al 2011 1.65 Numerical study
Shimmyo et al 2003 1.60 1976 participants, CCT =
551+-35 microns
Shah at el 1999 1.10 908 participants
Stodtmeister 1998 0.7 579 participants, CCT =
585+-41 (475-721) microns
Liu and Roberts 2005 1.6 Mathematical study
Orssengo and Pye 1999 4.0 Mathematical study
Table 1. Correction factors of GAT IOP based on CCT variations
www.intechopen.com

Tonometry – Past, Present and Future
95
Authors Year Effect on GAT IOP associated
with 1 mm change in R (mm Hg)
Notes
Orssengo and Pye 1999 0.57 Mathematical study
Elsheikh et al 2011 0.89 Numerical study
Liu and Roberts 2005 1.05 Mathematical study
Gunvant et al 2004 1.14 334 eyes of healthy
participants, R = 7.60 (6.64 to 8.73) mm
Kohlhaas et al 2006 No correlation 125 eyes of cataract
patients, R = 7.72+-0.27 (7.07-8.32) mm
Schneider and Grehn
2006 No correlation 100 healthy participants
Table 2. Correction factors of GAT IOP based on central corneal radius variations
Ehler’s study, correction factors were provided in a tabulated form for specific values of IOPG and CCT (in mmHg and ┤m, respectively). This information was later used (Elsheikh et al, 2011) to derive the following correction equation using the least squares method.
IOPT IOPG 0.071 520 CCT 0.526 IOPG 20 0.012 IOPG 20 1 (3)
Ehler’s publication was followed by a number of clinical studies that focussed on the correlation between IOPG measurements and the values of corneal thickness, CCT, and in some cases corneal curvature, R. Some of the main correction equations resulting from these studies include Equations 4 (Chihara et al, 2008), 5 (Shimmyo et al, 2003) and 6 (Kohlhaas et al, 2006):
2
3 4
IOPG 4.15IOPT
19.09 CCT1
A( ) (R 10 CCT / 2) 10
(4)
0.005 OPG
(550 CCT)IOPT IOPG
18 e 0.8 (R 7.848837) (5)
IOPT IOPG 23.28 0.0423 CCT (6)
In these equations, CCT is in ┤m, R in mm, IOPT (estimate of true IOP) and IOPG in mmHg, and A(┤) a theoretically drawn parameter that varied with CCT and R. Other studies used mathematical analysis of the applanation process to produce IOPG correction equations, the most significant of which is that derived by Orssengo and Pye in 1999 : (Orssengo & Pye, 1999)
www.intechopen.com
Glaucoma – Current Clinical and Research Aspects
96
C C
BIOPT IOPG
B C C (7)
In Equation 7,
2 2
2
0.6 R(R CCT / 2000) 1 v R(R CCT / 2000) (1 v)B , C=
A CCT /1000(CCT /1000)
,
Bc and Cc the same as B and C but consider the average (calibration) values of CCT and R, A = area of contact with the tonometer = 7.35 mm2, ┥ Poisson’s ratio, taken as 0.49 considering that corneal tissue is almost incompressible (Bryant et al, 1996; Vito et al, 1989). A more recent numerical study produced the only correction equation that considered the combined effects of CCT, R, age and the IOPG level (Elsheikh et al, 2010). This equation was successfully validated both experimentally (Elsheikh et al, 2011) and clinically (Elsheikh et al, 2011) and found to reduce the association of IOPG with all stiffness parameters considered.
CCT R AGE IOPG
IOPGIOPT
A A A A (8)
In this equation: ACCT = effect of variation in CCT (mm) = 0.68 (CCT–0.520)2 + 1.12 (CCT–0.520) + 1.0
AR = effect of variation in R (mm) = 1 – 0.06 (R - 7.8)
AAge = effect of variation in age (years) = 0.310-6 age3 – 8810-6 age2 + 0.0085 age + 0.815
AIOPG = effect of variation in IOPG (mmHg) = 1.427 (IOPG + 3.373)-0.119
3.2 Can we do better than the 50 year old “Gold Standard?”
As discussed in the previous section, the equation derived by Elsheikh and coworkers helps decrease the overall effect of CCT, R and age on IOP measurements. However it has to be remembered that when correcting IOP of an individual, residual errors may still persist and these may be significant. It would be ideal if tonometers provided measurements that were independent of ocular parameters. The “new age” tonometers like the Pascal Dynamic Contour Tonometer (Ziemer Ophthalmic Systems) and the Ocular Response Analyzer (Reichert technologies, Inc) have been to provide IOP that are relatively independent of biomechanical properties related to central corneal thickness and curvature (Kaufmann et al, 2004; Madeiros & Weinreb, 2006). Studies have claimed superiority for these devices compared to conventional tonometry in various pathologies like keratoconus (Gkika et al, 2011) and post LASIK (laser insitu keratomileusis) (Kaufman et al, 2003; Kirwan & O’Keefe, 2008). In a study performed in vivo, Andreas Boehm compared IOP in the anterior chamber with Pascal measurements prior to cataract surgery. (Boehm et al, 2008) This study demonstrated that DCT values were reliably within one millimeter of actual manometric IOP. In a more recent comparison between GAT and DCT IOP, Kotecha et al showed that DCT was more precise and reliable than GAT. (Kotecha et al, 2010)
www.intechopen.com

Tonometry – Past, Present and Future
97
4. The PASCAL® – Dynamic Contour Tonometer (DCT)
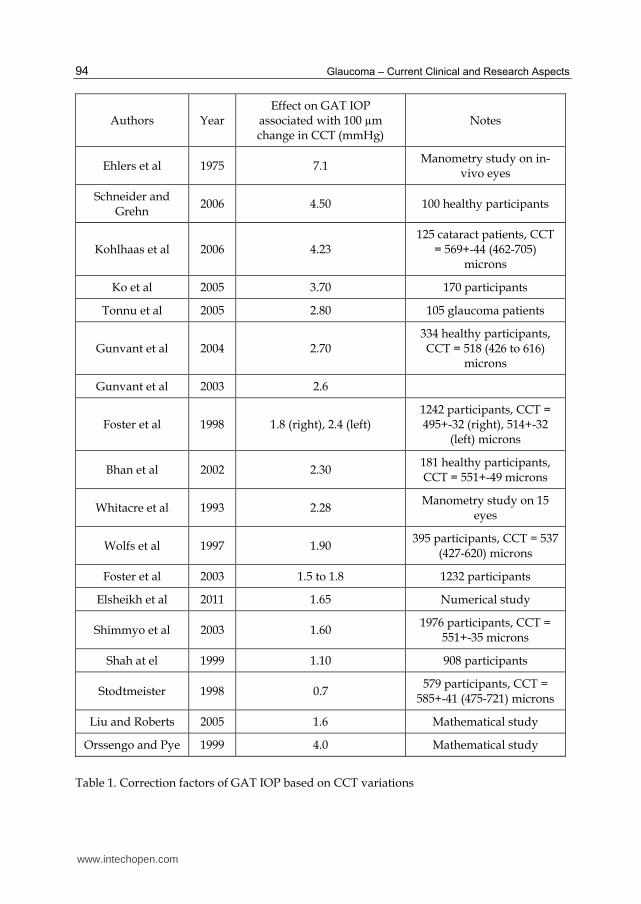
Dynamic contour tonometry (DCT) (figures 10,11 ) is a novel measuring technique using the principle of contour matching instead of applanation to eliminate the systematic errors inherent in previous tonometers. These factors include the influence of corneal thickness, rigidity, curvature, and elastic properties. The net effect of the increased precision that the DCT delivers would be a reduction in false positives and, more importantly, false negatives in IOP measurement. With more precise IOP measurement, researchers and clinicians could develop a more meaningful understanding of the role of IOP in the pathogenesis and management of glaucoma. The PASCAL® (DCT) tonometer (Ziemer Ophthalmic Systems, AG, Switzerland) was designed with the goal of minimizing the unwanted effects of variability of corneal structural dynamics on the measurement of IOP. Although this device is similar in appearance to a Goldmann, it is unlike Goldmann applanation in that it is not a variable force tonometer and uses a miniature piezoresistive pressure sensor embedded within a tonometer tip contour-matched to the shape of the cornea. The tonometer tip rests on the cornea with a constant appositional force of one gram. This is an important difference from all forms of applanation tonometry in which the probe force is variable. When the sensor is subjected to a change in pressure, the electrical resistance is altered and the DCT’s computer calculates a change in pressure in concordance with the change in resistance. The contour matched tip has a concave surface of radius 10.5 mm, which approximates the cornea’s shape when the pressures on both sides of it are equal. This is the key to the DCT ability to neutralize the effect of intra-individual variation in corneal properties. (Kaufman et al, 2003; Kniestadt, 2004; Mueller-Holz et al, 2006)
Fig. 9. Juxtaposition of cornea and PASCAL tip
Once a portion of the central cornea has taken up the shape of the tip (figure 9), the integrated pressure sensor begins to acquire data, measuring IOP 100 times per second. A complete measurement cycle requires about 8 seconds of contact time. During the
www.intechopen.com
Glaucoma – Current Clinical and Research Aspects
98
measurement cycle, audio feedback is generated, which helps the clinician insure proper contact with the cornea.
Fig. 10. The PASCAL® contoured piezoresistive sensor tip
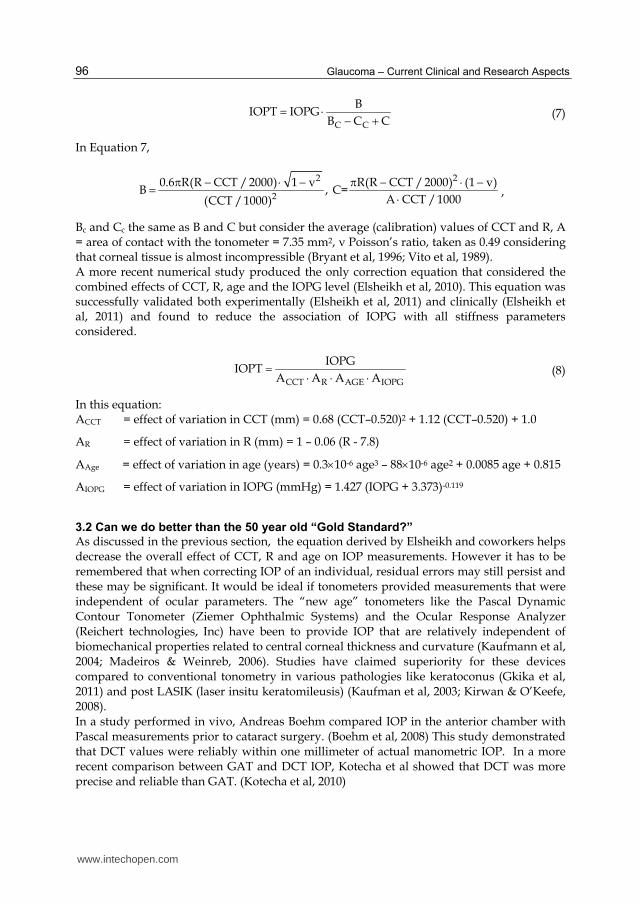
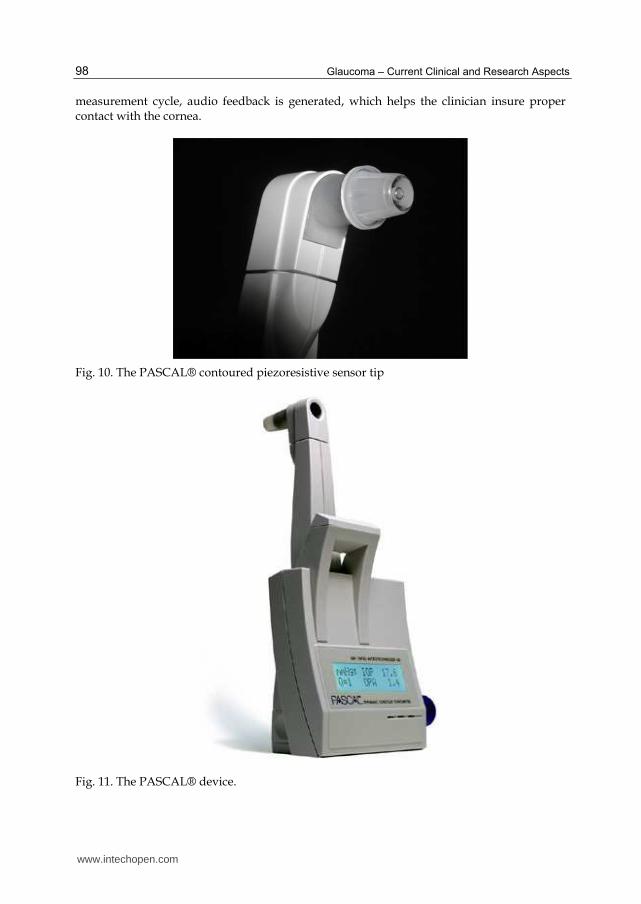
Fig. 11. The PASCAL® device.
www.intechopen.com
Tonometry – Past, Present and Future
99
5. Ocular Response Analyzer
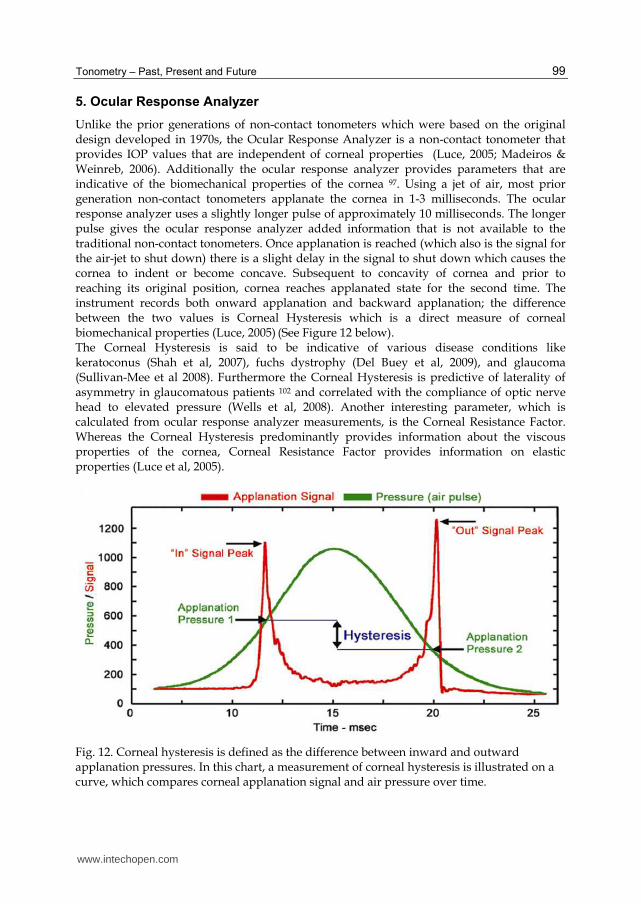
Unlike the prior generations of non-contact tonometers which were based on the original design developed in 1970s, the Ocular Response Analyzer is a non-contact tonometer that provides IOP values that are independent of corneal properties (Luce, 2005; Madeiros & Weinreb, 2006). Additionally the ocular response analyzer provides parameters that are indicative of the biomechanical properties of the cornea 97. Using a jet of air, most prior generation non-contact tonometers applanate the cornea in 1-3 milliseconds. The ocular response analyzer uses a slightly longer pulse of approximately 10 milliseconds. The longer pulse gives the ocular response analyzer added information that is not available to the traditional non-contact tonometers. Once applanation is reached (which also is the signal for the air-jet to shut down) there is a slight delay in the signal to shut down which causes the cornea to indent or become concave. Subsequent to concavity of cornea and prior to reaching its original position, cornea reaches applanated state for the second time. The instrument records both onward applanation and backward applanation; the difference between the two values is Corneal Hysteresis which is a direct measure of corneal biomechanical properties (Luce, 2005) (See Figure 12 below). The Corneal Hysteresis is said to be indicative of various disease conditions like keratoconus (Shah et al, 2007), fuchs dystrophy (Del Buey et al, 2009), and glaucoma (Sullivan-Mee et al 2008). Furthermore the Corneal Hysteresis is predictive of laterality of asymmetry in glaucomatous patients 102 and correlated with the compliance of optic nerve head to elevated pressure (Wells et al, 2008). Another interesting parameter, which is calculated from ocular response analyzer measurements, is the Corneal Resistance Factor. Whereas the Corneal Hysteresis predominantly provides information about the viscous properties of the cornea, Corneal Resistance Factor provides information on elastic properties (Luce et al, 2005).
Fig. 12. Corneal hysteresis is defined as the difference between inward and outward applanation pressures. In this chart, a measurement of corneal hysteresis is illustrated on a curve, which compares corneal applanation signal and air pressure over time.
www.intechopen.com
Glaucoma – Current Clinical and Research Aspects
100
6. Tonometers with research and clinical utility
6.1 Rebound tonometry
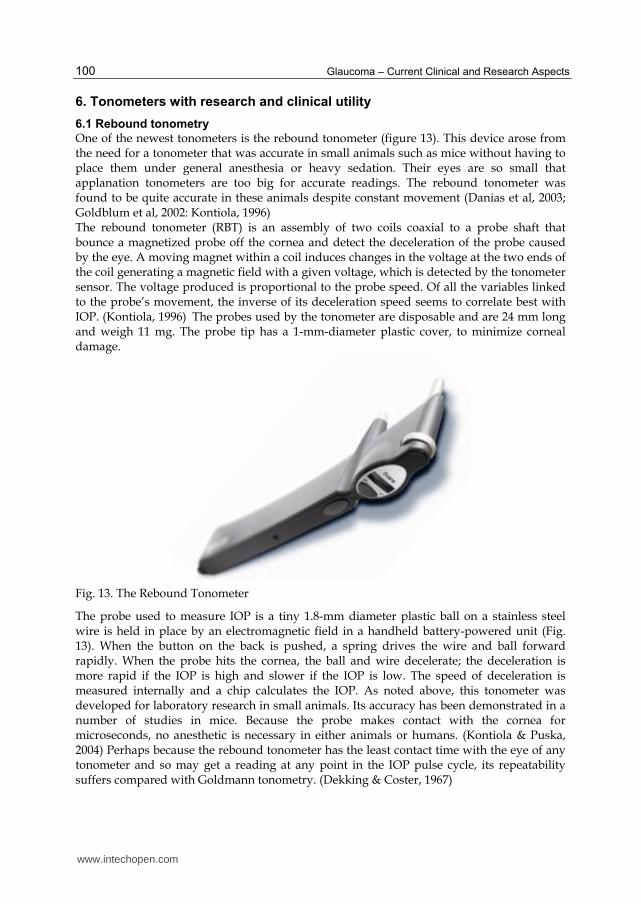
One of the newest tonometers is the rebound tonometer (figure 13). This device arose from the need for a tonometer that was accurate in small animals such as mice without having to place them under general anesthesia or heavy sedation. Their eyes are so small that applanation tonometers are too big for accurate readings. The rebound tonometer was found to be quite accurate in these animals despite constant movement (Danias et al, 2003; Goldblum et al, 2002: Kontiola, 1996) The rebound tonometer (RBT) is an assembly of two coils coaxial to a probe shaft that bounce a magnetized probe off the cornea and detect the deceleration of the probe caused by the eye. A moving magnet within a coil induces changes in the voltage at the two ends of the coil generating a magnetic field with a given voltage, which is detected by the tonometer sensor. The voltage produced is proportional to the probe speed. Of all the variables linked to the probe’s movement, the inverse of its deceleration speed seems to correlate best with IOP. (Kontiola, 1996) The probes used by the tonometer are disposable and are 24 mm long and weigh 11 mg. The probe tip has a 1-mm-diameter plastic cover, to minimize corneal damage.
Fig. 13. The Rebound Tonometer
The probe used to measure IOP is a tiny 1.8-mm diameter plastic ball on a stainless steel wire is held in place by an electromagnetic field in a handheld battery-powered unit (Fig. 13). When the button on the back is pushed, a spring drives the wire and ball forward rapidly. When the probe hits the cornea, the ball and wire decelerate; the deceleration is more rapid if the IOP is high and slower if the IOP is low. The speed of deceleration is measured internally and a chip calculates the IOP. As noted above, this tonometer was developed for laboratory research in small animals. Its accuracy has been demonstrated in a number of studies in mice. Because the probe makes contact with the cornea for microseconds, no anesthetic is necessary in either animals or humans. (Kontiola & Puska, 2004) Perhaps because the rebound tonometer has the least contact time with the eye of any tonometer and so may get a reading at any point in the IOP pulse cycle, its repeatability suffers compared with Goldmann tonometry. (Dekking & Coster, 1967)
www.intechopen.com

Tonometry – Past, Present and Future
101
The probes are disposable between patients, so, disinfection is not necessary. The disadvantages are that it can only be used in an upright patient (the probe falls out if the instrument is facing downward). Accuracy may be an issue especially in patients where accurate IOP measurements are critical for long-term management.
6.2 IOP Telemetry devices At present, the only therapeutic approach in glaucoma is to lower IOP, whether or not IOP is above the normal range. Typically, when therapy is initiated, a target pressure is set, based on the IOP before treatment, the amount of glaucoma damage present and the life-expectancy of the patient. Therefore, an accurate assessment of the IOP both before and after initiating therapy is key. Current practice to monitor IOP is based on taking measurements during the few minutes at the clinic two or three times a year. These measurements are unlikely to characterise the IOP sufficiently well, as IOP varies considerably due to changes in posture and physiologic state, and during sleeping and awakening. Studies reported that there was only a 60-70% chance of capturing the peak IOP if the IOP was measured only during office hours (Kitazawa & Horie, 1975). Others found that 2 to 4 hourly IOP monitoring over a 24-hour period (which requires hospitalisation) resulted in a change in the clinical management of glaucoma in more than 75% of patients (Hughes et al, 2003). Further research on normal tension glaucoma, a type of glaucoma that develops in people with IOP measurements within the normal range, found that the progression of the disease was related to IOP fluctuations, which could not be identified by measurements made during a clinic visit (Hong et al, 2007). Reports also concluded that current measurement methods were insufficient to monitor the circadian fluctuation in IOP (of up to 11mmHg) (Kitazawa & Horie, 1975) – possibly another glaucoma risk factor. These studies identified the need for devices that can effectively monitor IOP continuously over long periods of at least 24 hours (Brandt, 2007). The concept of an IOP continuous measurement device is not new. Several recent efforts have resulted in at least ten patented systems. Many of these systems employ a pressure sensor to be surgically implanted inside the ocular globe or within the thickness of the cornea. For this reason, these systems have not been used except in cases where surgical intervention is required for another reason. Examples of this technology include the systems developed by (Abita et al, 2003; Lloyd et al, 2003; Jeffries et al, 2001; and sketched in Figure 14.
(a) (b) (c)
Fig. 14. IOP measurement techniques involving surgically implanted pressure sensors: (a) An IOP sensor implanted within corneal thickness (Abita et al, 2003) (b) IOP monitoring system employing a vitreal chamber implant (Lloyd et al, 2003) (c) An IOP sensor attached surgically to the eye iris (Jeffries & Birchansky, 2001)
www.intechopen.com
Glaucoma – Current Clinical and Research Aspects
102
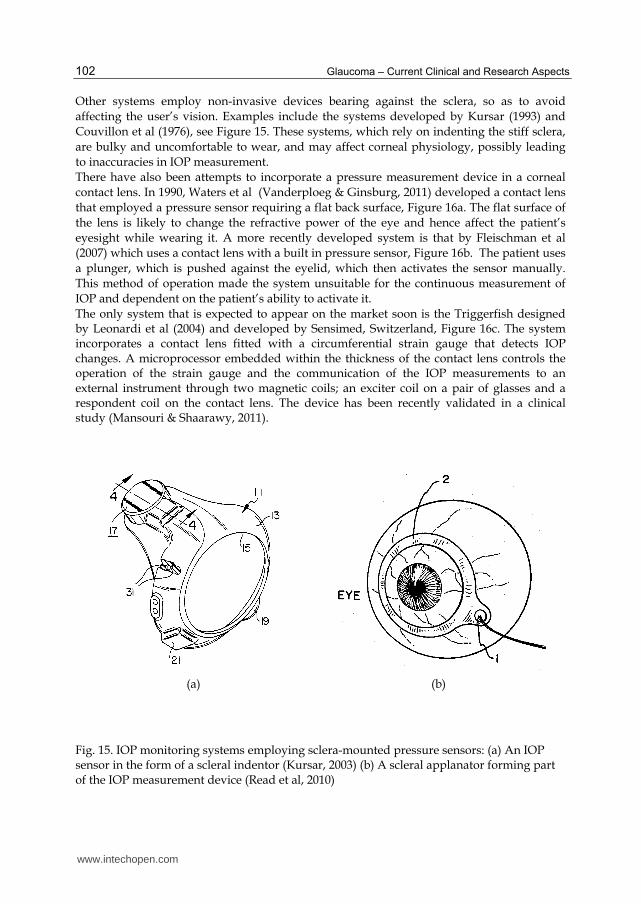
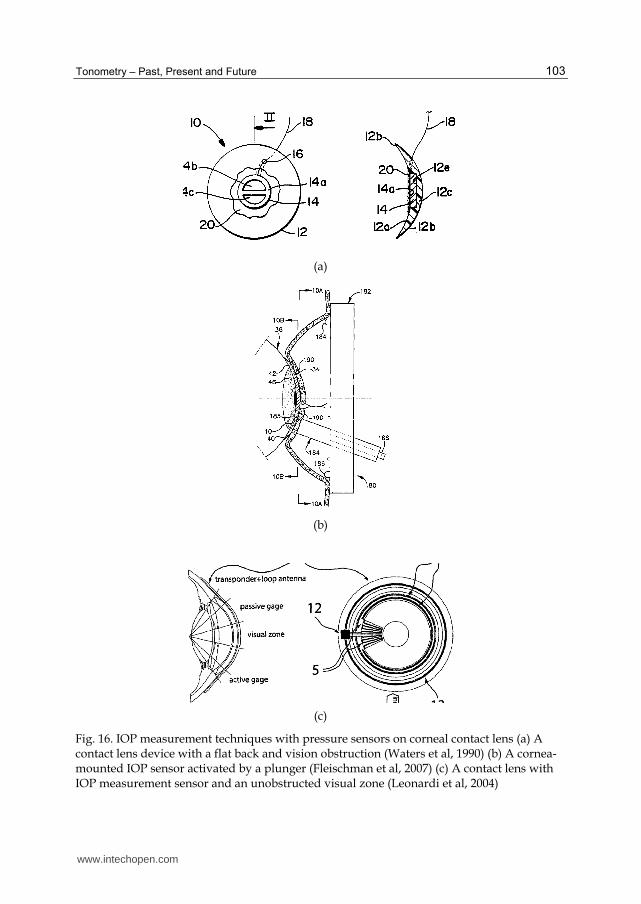
Other systems employ non-invasive devices bearing against the sclera, so as to avoid affecting the user’s vision. Examples include the systems developed by Kursar (1993) and Couvillon et al (1976), see Figure 15. These systems, which rely on indenting the stiff sclera, are bulky and uncomfortable to wear, and may affect corneal physiology, possibly leading to inaccuracies in IOP measurement. There have also been attempts to incorporate a pressure measurement device in a corneal contact lens. In 1990, Waters et al (Vanderploeg & Ginsburg, 2011) developed a contact lens that employed a pressure sensor requiring a flat back surface, Figure 16a. The flat surface of the lens is likely to change the refractive power of the eye and hence affect the patient’s eyesight while wearing it. A more recently developed system is that by Fleischman et al (2007) which uses a contact lens with a built in pressure sensor, Figure 16b. The patient uses a plunger, which is pushed against the eyelid, which then activates the sensor manually. This method of operation made the system unsuitable for the continuous measurement of IOP and dependent on the patient’s ability to activate it. The only system that is expected to appear on the market soon is the Triggerfish designed by Leonardi et al (2004) and developed by Sensimed, Switzerland, Figure 16c. The system incorporates a contact lens fitted with a circumferential strain gauge that detects IOP changes. A microprocessor embedded within the thickness of the contact lens controls the operation of the strain gauge and the communication of the IOP measurements to an external instrument through two magnetic coils; an exciter coil on a pair of glasses and a respondent coil on the contact lens. The device has been recently validated in a clinical study (Mansouri & Shaarawy, 2011).
(a) (b)
Fig. 15. IOP monitoring systems employing sclera-mounted pressure sensors: (a) An IOP sensor in the form of a scleral indentor (Kursar, 2003) (b) A scleral applanator forming part of the IOP measurement device (Read et al, 2010)
www.intechopen.com
Tonometry – Past, Present and Future
103
(a)
(b)
(c)
Fig. 16. IOP measurement techniques with pressure sensors on corneal contact lens (a) A contact lens device with a flat back and vision obstruction (Waters et al, 1990) (b) A cornea-mounted IOP sensor activated by a plunger (Fleischman et al, 2007) (c) A contact lens with IOP measurement sensor and an unobstructed visual zone (Leonardi et al, 2004)
www.intechopen.com
Glaucoma – Current Clinical and Research Aspects
104
7. Conclusion
It is not an exaggeration to say that tonometry and intraocular pressure have had a long journey. Despite the shortcomings and errors in measurement, IOP remains the most important risk factor of glaucoma. The extensive research into tonometry has yielded numerous technological advances and sophisticated “new age” tonometers the Ocular Response Analyzer and the Pascal dynamic contour tonometer. These devices are reported to be less erroneous than the “clinical gold standard” the Goldmann applanation tonometer. We hope that over time the new age tonometers will replace the current clinical gold standard. The rebound tonometer fast becoming the tonometer of choice in measuring IOP in animal experiments and may have a role to play in clinical screenings. IOP telemetry promises to fulfil the gaps in glaucoma management by providing the information on 24-hour diurnal variation in IOP. How this piece of information will change the face of glaucoma management remains to be determined.
8. References
Abita, J, Carkhuff B. and Frankel R. (2003). Method for monitoring intraocular pressure using a passive intraocular pressure sensor and patient worn monitoring. Patent US6,579,235 B1.
Andreassen, T.T., A. Hjorth Simonsen, and H. Oxlund. (1980). Biomechanical properties of keratoconus and normal corneas. Experimental Eye Research,. 31(4): p. 435-441.
Augsburger A, Terry JE. (1977). Non-contact and Mackay-Marg tonometry: comparison in patients ages 7 to 85 years. Am J Optom Physiol Opt;54:31–4.
Boehm AG, Weber A, Pillunat LE, Koch R, Spoerl (IOVS) 2008 Jun;49(6):2472-7. Epub (3/2008) Dynamic Contour Tonometry in Comparison to Intracameral IOP Measurements. E Invest Ophthalmol Vis Sci. 08-02 Jun 08
Bowman, W., (1856) British Medical Association Annual Meeting Lecture. Br Med J,: p. 377-382. Brandt J, Beisser J, Gordon M. (2001). Central corneal thickness in Ocular Hypertension
treatment study (OHTS). Ophthalmology.;108(10):1779-88 Brandt, J.D., (2007). Central corneal thickness, tonometry, and glaucoma risk--a guide for the
perplexed. Can J Ophthalmol,. 42(4): p. 562-6. Bryant, M.R. and P.J. McDonnell. (1996). Constitutive laws for biomechanical modeling of
refractive surgery. J Biomech Eng,. 118(4): p. 473-81. Chihara, E., (2008). Assessment of true intraocular pressure: the gap between theory and
practical data. Surv Ophthalmol,. 53(3): p. 203-18. Couvillon LA, Baker CD, Grover TP, Konigsberg E. (1976). Telemetry monitoring of
intraocular pressure. Biotelemetry. 976;3:123– 126. Danias J, Kontiola AI, Filippopoulos T, Mittag T. (2003). Method for the noninvasive
measurement of intraocular pressure in mice. Invest Ophthalmol Vis Sci;44:1138–41. Dekking, H.M. and Coster, H.D. (1967). Dynamic tonometry. Ophthalmologica. 154, 59-74. Del Buey MA, Cristóbal JA, Ascaso FJ, Lavilla L, Lanchares E. (2009). Biomechanical
properties of the cornea in Fuchs' corneal dystrophy. Invest Ophthalmol Vis Sci. Jul;50(7):3199-202.
Ehlers, N., T. Bramsen, and S. Sperling, (1975). Applanation tonometry and central corneal thickness. Acta Ophthalmol (Copenh),. 53(1): p. 34-43.
www.intechopen.com
Tonometry – Past, Present and Future
105
Elsheikh, A., et al., (2007). Assessment of corneal biomechanical properties and their variation with age. Curr Eye Res,. 32(1): p. 11-9.
Elsheikh, A., et al., (2008). Experimental assessment of human corneal hysteresis. Curr Eye Res,. 33(3): p. 205-13.
Elsheikh, A., et al (2011). Multi-parameter correction equation for Goldmann applanation tonometry. Optometry and Vision Science;88:E102-E112.
Elsheikh A, Alhasso D, Gunvant P, Garway-Heath D: (2011). Multi-parameter correction equation for Goldmann applanation tonometry. Optometry and Vision;88:E102–E112
Elsheikh, A., et al., (2011). In-vitro experimental assessment of multi-parameter correction factors for Goldmann tonometry. Journal of Glaucoma,.
Fleischman, A., S. Roy, and H. Lewis, Intraocular pressure measurement system including a sensor mounted in a contact lens. 2007, Google Patents
Frenkel RP, Hong J & Shin DH (1988):Comparison of the TonoPen to the Goldmann applanation tonometer. Arch Ophthalmol 106: 750–753.
Gkika MG, Labiris G, Kozobolis VP. (2011). Tonometry in keratoconic eyes before and after riboflavin/UVA corneal collagen crosslinking using three different tonometers. Eur J Ophthalmol. May 11. pii: 735D77F2-7490-4543-993D-8C54537264F6. doi: 10.5301/EJO.2011.8328. [Epub ahead of print]
Goldblum D, Kontiola AI, Mittag T, Chen B, Danias J. (2002). Noninvasive determination of intraocular pressure in the rat eye. Comparison of an electronic tonometer (TonoPen), and a rebound (impact probe) tonometer. Graefes Arch Clin Exp Ophthalmol; 240:942–6.
Goldmann H, Schmidt T. (1957). Über Applanationstonometrie. Ophthalmologica;134:221-242. Goldmann H, Schmidt T. (1961). Weiterer Beitrag zur Applanationstonometrie.
Op1hthalmologica;141:441-456. Hamilton, K.E. and D.C. Pye, (2008) Young's modulus in normal corneas and the effect on
applanation tonometry. Optom Vis Sci,. 85(6): p. 445-50. Hessemer, V, Rosler, Yacobi KW. (1988). Comparison of intraocular pressure measurements
with oculab tonopen Vs manometry in humans shortly after death, Am j Ophthalmology;105:678.
Hong, S., G.J. Seong, and Y.J. Hong, (2007). Long-term intraocular pressure fluctuation and progressive visual field deterioration in patients with glaucoma and low intraocular pressures after a triple procedure. Arch Ophthalmol,. 125(8): p. 1010-3.
Hughes, E., P. Spry, and J. Diamond, (2003). 24-hour monitoring of intraocular pressure in glaucoma management: a retrospective review. Journal of Glaucoma,. 12(3): p. 232.
Jeffries, R. and L. Birchansky, Intraocular pressure monitoring/measuring apparatus and method. 2001, Google Patents.
Kao SF, Lichter PR, Bergstrom TJ, et al. (1991). Clinical comparison of the oculab tonopen to the Goldmann applanation tonopen. Ophthalmology;94:1541
Kaufman, H. E., Wind, C. A., and Waltman,S. R.: 1970Validity of MacKay-Marg electronic applanation tonometer in patients with scarred irregular corneas, Am. J. Ophthalmol. 69: 1003,.
Kaufmann C, Bachmann LM, Thiel MA, (2004).Comparison of Dynamic Contour Tonometry and Goldmann Applanation Tonometry. Invest Ophthal & Vis Sci, Vol 45, Sept, pp. 3118-3121.
www.intechopen.com
Glaucoma – Current Clinical and Research Aspects
106
Kaufmann C, Bachmann LM, Thiel MA. (2003). Intraocular pressure measurements using dynamic contour tonometry after laser in situ keratomileusis. Invest Ophthalmol Vis Sci. Sep;44(9):3790-4.
Kitazawa, Y. and T. Horie, (1975). Diurnal variation of intraocular pressure in primary open-angle glaucoma. Am J Ophthalmol,. 79(4): p. 557-66.
Kotecha A, White E, Schlottmann PG, Garway-Heath DF (2010) Intraocular Pressure Measurement Precision with the Goldmann Applanation, Dynamic Contour, and Ocular Response Analyzer Tonometers. Ophthalmology. 2010 Apr;117(4):730-7. Epub 2010 Feb 1.
Kniestedt C, Nee M, Stamper RL. (2004). Dynamic Contour Tonometry A Comparative Study on Human Cadaver Eyes. Arch Ophthalmol.;122:1287-1293
Kirstein E, Huesler A. (2005) Evaluation of the Orssengo-Pye IOP Corrective Algorithm in LASIK Patients with Thick Corneas. Optometry Sept.,2005
Kirwan C, O'Keefe M. (2008). Measurement of intraocular pressure in LASIK and LASEK patients using the Reichert Ocular Response Analyzer and Goldmann applanation tonometry. J Refract Surg. Apr;24(4):366-70
Kohlhaas, M., et al., (2006). Effect of central corneal thickness, corneal curvature, and axial length on applanation tonometry. Arch Ophthalmol,. 124(4): p. 471-6.
Kontiola A. (1996). A new electromechanical method for measuring intraocular pressure. Doc Ophthalmol;93:265–76.
Kontiola A, Puska P.(2004). Measuring intraocular pressure with the Pulsair 3000 and Rebound tonometers in elderly patients without an anesthetic. Graefes Arch Clin Exp Ophthalmol;242:3–7
Liu and Roberts, (1993). JCRS, JCRS 31, Issue 1, p 146-155 Kursar, G., Portable diurnal intraocular pressure recording system., Google Patents. Leonardi, M; Leudenberger, P; Bertrand, D; Bertsch, A; and Renaud, P; (2004). First Steps
toward Noninvasive Intraocular Pressure Monitoring with a Sensing Contact Lens, Invest Ophthalmol Vis Sci, 2004. 45(9): p. 3113-7
Fred McMillan, MD; Richard K. Forster, MD (1975). Comparison of MacKay-Marg, Goldmann, and Perkins Tonometers in Abnormal Corneas Arch Ophthalmol. ; 93(6):420-424
Lloyd, J., et al., (2003). Implantable microscale pressure sensor system for pressure monitoring and management., Google Patents.
Luce DA. (2005). Determining in vivo biomechanical properties of the cornea with an ocular response analyzer. J Cataract Refract Surg. Jan;31(1):156-62.
Mansouri K, Shaarawy T. (2011). Continuous intraocular pressure monitoring with a wireless ocular telemetry sensor: initial clinical experience in patients with open angle glaucoma. Br J Ophthalmol;95:627-629.
Medeiros FA, Weinreb RN. (2006). Evaluation of the influence of corneal biomechanical properties on intraocular pressure measurements using the ocular response analyzer. J Glaucoma. 2006 Oct;15(5):364-70.
Meek, K.M., et al., (2005). Changes in collagen orientation and distribution in keratoconus corneas. Invest Ophthalmol Vis Sci, 2005. 46(6): p. 1948-56.
Mueller-Holz MF, Spanier J, Schmidt E, Boehm AG, Pillunat LE, (2006). Dynamic Contour Tonometry vs. Applanation Tonometry – Comparison of IOP - Measurements, Dept. of Ophthalmology, University of Dresden, Dresden, Germany, ARVO
www.intechopen.com
Tonometry – Past, Present and Future
107
Munger R, Hodge WG, Mintsioulis G, Agapitos PJ, Jackson WB, Damji KF. (2001). Correction of intraocular pressure for changes in central corneal thickness following photorefractive keratectomy Can J Ophthalmol. 1998 Apr;33(3):159-65
Organization, I.S., ISO8612:2001(E): Ophthalmic Instruments - tonometers., Switzerland: Copyright Office
Orssengo GJ, Pye DC. (1999). Determination of the true intraocular pressure and modulus of elasticity of the human cornea in vivo. Bull Mathematical Biol;61:551-72.
Radner, W., et al., (1998). Interlacing and cross-angle distribution of collagen lamellae in the human cornea. Cornea,. 17(5): p. 537-43
Read, S.A., et al., (2010). Changes in intraocular pressure and ocular pulse amplitude with accommodation. British Journal of Ophthalmology,. 94(3): p. 332-335.
Reichert website (2011) http://www.reichert.com/history.cfm accessed June 29th 2011 Rehany U, Bersudsky V, Rumelt S, (2000). Paradoxical hypotony after laser in situ
keratomileusis, Journal of Cataract & Refractive Surgery, Volume 26, Number 12, Schnabel I., (1908). Klin Montasbl Augenh 1908; 48:318 Carolyn Y. Shih, MD; Joshua S. Graff Zivin, PhD; Stephen L. Trokel, MD; James C. Tsai, MD.
(2004). Clinical Significance of Central Corneal Thickness in the Management of Glaucoma Arch Ophthalmol. ;122:1270-1275
Shah S, Laiquzzaman M, Bhojwani R, Mantry S, Cunliffe I. (2007). Assessment of the biomechanical properties of the cornea with the ocular response analyzer in normal and keratoconic eyes. Invest Ophthalmol Vis Sci. Jul;48(7):3026-31
Shimmyo, M., et al., (2003). Intraocular pressure, Goldmann applanation tension, corneal thickness, and corneal curvature in Caucasians, Asians, Hispanics, and African Americans. Am J Ophthalmol,. 136(4): p. 603-13.
Sullivan-Mee M, Billingsley SC, Patel AD, Halverson KD, (2008). Alldredge BR, Qualls C. Ocular Response Analyzer in subjects with and without glaucoma. Optom Vis Sci. Jun;85(6):463-70
Tonnu, P.A., et al., (2005). The influence of central corneal thickness and age on intraocular pressure measured by pneumotonometry, noncontact tonometry, the Tono-Pen XL, and Goldmann applanation tonometry. British Journal of Ophthalmology,. 89(7): p. 851-854.
Vanderploeg, J.M. and A.P. Ginsburg. (2011). Near Vision Acuity and Contrast Sensitivity (DSO 408). Life Sciences Data Archive ; Available from:
http://lsda.jsc.nasa.gov/scripts/experiment/exper.cfm?exp_index=543. Vito, R.P., Shin, T. J., McCarey, B. E., (1989). A mechanical model of the cornea: The effects of
physiological and surgical factors on radial keratotomy surgery. Refractive & Corneal Surgery,. 5: p. 82-88
Waters Jr, G. and R. Thommen, Intraocular pressure sensor. 1990, Google Patents. Wells AP, Garway-Heath DF, Poostchi A, Wong T, Chan KC, Sachdev N. (2008). Corneal
hysteresis but not corneal thickness correlates with optic nerve surface compliance in glaucoma patients. Invest Ophthalmol Vis Sci. Aug;49(8):3262-8
Whitacre MM, Stein RA, Hassanein K. (1994). The effect of corneal thickness on applanation tonometry. Am J Ophthalmol;115:592-596
Whitacre MM, Stein R (1993). Sources of error with use of Goldmann-type tonometers. Surv Ophthalmol. Jul-Aug;38(1):1-30
www.intechopen.com

Glaucoma – Current Clinical and Research Aspects
108
Wolfs RC, Klaver CC, Vingerling JR, et al. (1997) Distribution of central corneal thickness and its association with intraocular pressure: The Rotterdam Study. Am J Ophthalmology;123(6):767-72.
www.intechopen.com

Glaucoma - Current Clinical and Research AspectsEdited by Dr. Pinakin Gunvant
ISBN 978-953-307-263-0Hard cover, 376 pagesPublisher InTechPublished online 09, November, 2011Published in print edition November, 2011
InTech EuropeUniversity Campus STeP Ri Slavka Krautzeka 83/A 51000 Rijeka, Croatia Phone: +385 (51) 770 447 Fax: +385 (51) 686 166www.intechopen.com
InTech ChinaUnit 405, Office Block, Hotel Equatorial Shanghai No.65, Yan An Road (West), Shanghai, 200040, China
Phone: +86-21-62489820 Fax: +86-21-62489821
This book summarizes current literature about research and clinical science in glaucoma and it is a synopsisand translation of the research conducted by individuals who are known in each of their respective areas. Thebook is divided into two broad sections: basic science and clinical science. The basic science section examinesbench- and animal-modeling research in an attempt to understand the pathogenesis of glaucoma. The clinicalscience section addresses various diagnostic issues and the medical, laser and surgical techniques used inglaucoma management.
How to referenceIn order to correctly reference this scholarly work, feel free to copy and paste the following:
Elliot M. Kirstein, Ahmed Elsheikh and Pinakin Gunvant (2011). Tonometry – Past, Present and Future,Glaucoma - Current Clinical and Research Aspects, Dr. Pinakin Gunvant (Ed.), ISBN: 978-953-307-263-0,InTech, Available from: http://www.intechopen.com/books/glaucoma-current-clinical-and-research-aspects/tonometry-past-present-and-future