to assess the age of giving complementary feeding to ... · and analyzed using nutrisurvey. 2.1...
TRANSCRIPT

G.J.B.A.H.S.,Vol.5(1):49-67 (January-March, 2016) ISSN: 2319 – 5584
49
To Assess the Age of Giving Complementary Feeding to Infants before Six Months and Reasons Given and the Nutritional Status of Lactating Mothers
of Mwanamukia Area- Nairobi
Nkirigacha, E. M.*1, Imungi, J. K.
1, & Okoth, M.W.
1
1Department of Food Science, Nutrition and Technology, University of Nairobi, Kenya 2Department of Health Sciences, University of Nairobi, Kenya
*Corresponding Author
Abstract Exclusive breastfeeding with appropriate complementary feeding can save infants from many problems later in life.
The study found that majority of respondents were married (63.9%), single (25.5%). 43.1% had primary school
education while 35.3% had attained Secondary ‘O’ level. The maximum household number was 12 while the average
was 6. Most of them had Meru (25.5%) and Luhya (17.3%) ethnicity. The average monthly income was Kenya
shilings27, 154.12. Business (28.6%) and housewives (23.9%). Household heads 51.2% men and 34.6 women. Most
had 36-40 years age. 9.4% exclusively breastfed for 4 months while 2.7% breastfed exclusively for 6 months. 50%
breastfed until one year while 27.84% breastfed for 1 and 11/2 years. Majority of the mothers (51.8%) introduced
complementary feeds by three months. Cow’s milk was used (34.1 percent) followed by porridge at (22.4 percent). Lack of milk (29.8 percent) and lack of enough food were reasons for weaning early.
Key words: Age, exclusive, breastfeeding, complementary feeding, lactating mothers.
1. INTRODUCTION Exclusive breastfeeding for the first six months, continuing to breastfeed and giving appropriate complementary
foods after six months up to the first two years of a child’s life, saves one in five children. Exclusive breastfeeding with
appropriate complementary feeding can save up to 19 percent of child deaths (Bhutta et al., 2008). Breastfeeding practices and introduction of supplemental foods are important determinants of children’s nutritional status, particularly
among children under age two. With improved nutritional status, the risk of child mortality is reduced and development
is enhanced (KDHS 2015).
The aim of this study was to determine the social demographic and social economic characteristics of lactating
mothers in Mwanamukia, Nairobi and was to determine the age of introduction of complementary feeding and identify
the reasons given for the same.
This cross sectional study was conducted on 260 purposively selected lactating women living in Mwanamukia,
Nairobi Kenya. A structured, validated and pre-tested questionnaire was used to obtain information on social, economic
and demographic characteristics; age at which lactating mothers introduced complementary feeding to the infants and
reasons given for not exclusively breastfeeding their infants and a 24-hour dietary recall was used to assess the
nutritional status of lactating mothers. Data was entered into SPSS version 20 and analyzed using descriptive statistics and Pearson correlation coefficient was used to determine associations.
Complementary feeding refers to the consumption of both breast milk and other foods, usually during the period
from 6 to 24 months of age, until the child ceases to nurse at the breast and is able to consume the same foods as the rest
of the family (Brown, 2007).
Complementary feeding is the provision of foods or fluids to infants in addition to breast-milk. Complementary
foods can be subdivided into transitional foods and family foods. Transitional foods are complementary foods
specifically designed to meet the particular nutritional or physiological needs of the infant and family foods are
complementary foods given to the young child and are broadly the same as those consumed by the rest of the family. It
should be a process of introducing foods with an increasing variety of texture, flavor, aroma and appearance, while
maintaining breastfeeding. Highly salted foods should not be given during the complementary feeding period, nor should
salt be added to food during this period (Michaelsen et al., 2003).
Infants should receive breastmilk exclusively from birth to 6 months after which they are introduced to nutritious solids of increasing consistency while continuing to breastfeed until 24 months of age (PAHO/WHO, 2005). After six
months of age, breastmilk alone is no longer adequate to meet an infant’s nutritional requirements. From this age,
complementary foods that are nutritionally adequate should therefore be provided in addition to breast milk. Breast milk
continues to be an important source of vital nutrients, fluids and offers immunological protection (DON, 2013). Even
with optimum breastfeeding children will become stunted if they do not receive an adequate quantity and quality of
complementary foods after 6 months of age (Black et al., 2008).
As an infant grows and becomes more active, breast-milk alone is insufficient to meet it’s full nutritional and
psychological needs of the infant. Adapted family foods (transitional foods) are needed to fill the gap in energy and iron
and other essential nutrients, between what is provided by exclusive breastfeeding and the total nutritional requirements
of the infant. This gap increases with age, demanding an increasing contribution of energy and nutrients; especially iron,
from foods other than breastmilk (Michaelsen et al., 2003). Breast milk continues to be an important source of vital nutrients, fluids and it offers immunological protection.
Giving complementary foods too early or too late are both detrimental to child health (DON, 2013). Poor nutrition and
G.J.B.A.H.S.,Vol.5(1):49-67 (January-March, 2016) ISSN: 2319 – 5584
50
less-than-optimum feeding practices during this critical period may increase the risk of growth faltering (wasting and
stunting) and nutritional deficiencies, and may have longer-term adverse effects on health and mental development
(Michaelsen et al., 2003). The main purpose of introducing complementary foods is to provide needed nutrients that are no longer supplied
adequately by breast milk or formula alone. The foods chosen must be those that the infant is developmentally capable of
handling both physically and metabolically (Whitney and Rolfes, 2013). Complementary foods play an important part in
the development of neuromuscular coordination. Infants do not have the physiological maturity to progress from
exclusive breastfeeding directly to family foods. Transitional foods are necessary to bridge this gap, and are required
until the infant is sufficiently mature to consume normal family foods. The introduction of transitional foods also exposes
the infant to a variety of textures and consistencies, thus encouraging the development of vital motor abilities such as
chewing (Michaelsen et al., 2003).
The exact timing of introduction of complementary food depends on the individual infant’s needs and
developmental readiness, varying from infant to infant because of differences in growth rates, activities, and
environmental condition (Whitney and Rolfes, 2013). The age during which transitional foods are introduced is a
particularly sensitive time in infant development. Timely introduction of appropriate complementary foods promotes good health, nutritional status and growth of infants and young children during a period of rapid growth, and should be a
high priority for public health (Michaelsen et al., 2003).
Giving complementary foods too early or too late are both detrimental to child health and development (DON,
2013). Starting complementary feeding too soon is dangerous because; breast-milk can be displaced by complementary
foods, leading to reduced production of breast-milk thereby increasing the risk of insufficient energy and nutrient intake
by the infant. Infants are exposed to microbial pathogens present in foods and fluids which are potentially contaminated
increasing the risk of diarrheal disease and consequently malnutrition. The risks of food allergies are increased because
of intestinal immaturity and these increase the risk of malnutrition (Michaelsen et al., 2003).
If complementary foods are introduced too late it could result in inadequate provision of energy and nutrients from
breast-milk alone may lead to growth faltering and malnutrition. Micronutrient deficiencies, especially of iron and zinc,
may develop owing to the inability of breast-milk to meet requirements and the optimal development of motor skills such as chewing, and the infant’s acceptance of new tastes and textures, may not be ensured (Michaelsen et al., 2003).
In addition to the infant’s nutrient needs and physical readiness to handle different forms of foods, the need to
detect and control allergic reactions should also be considered when introducing solid foods (Whitney and Rolfes, 2013).
During the period of transition from exclusive breastfeeding to the cessation of breastfeeding, infants gradually become
accustomed to eating family foods until they entirely replace breast-milk. Throughout the period of complementary
feeding, breast-milk should continue to be the main type of milk consumed by the infant (Michaelsen et al., 2003).
Infant foods should be selected to provide variety, balance, and moderation. Homemade infant foods require that the
cook minimizes nutrient losses during preparation to remain nutritious. Ingredients for homemade foods should be fresh,
whole foods without added salt, sugar, or seasonings (Whitney and Rolfes, 2013). The advantage of home-prepared baby
food is that a wider variety of foods may be introduced that are likely to be a part of the diet later (Brown et al., 2011).
Frequent, complementary feeds (five small meals are recommended) of locally available foods adequate in nutrients and
micronutrients and safely prepared could decrease stunting by 20% at 12 months (Bhutta et al., 2013). From 9–12 months, infants are capable of consuming foods eaten by other family members (Brown et al., 2011).
They no longer need to be modified to meet the special needs of the infant. From 12 months, cow’s milk can be gradually
introduced into the infant’s diet as a drink. Complementary foods with a low energy density can limit energy intake, and
the average energy density should not usually be less than 4.2 kJ (1 kcal)/g. This energy density depends on meal
frequency and can be lower if meals are offered often (Michaelsen et al., 2003).
The first food generally recommended for infants at 6 months is baby cereal, such as iron-fortified cereal mixed
with water or breast milk. Rice cereal is a common first food because it is easily digested. What are considered healthy
first foods for infants vary in different cultures and ethnic groups. Regardless of what foods are offered first, the timing
and spacing of new foods can be used to identify any negative reactions. Common recommendations are to add only one
new food at a time and to offer it over 2 or 3 days (Brown et al., 2011).
To guard against food-borne illnesses, hands and equipment must be kept clean. To prevent choking, nuts, cherries, peanut butter, popcorn, raw carrots, raw celery, whole beans and whole grapes should not be given to infants or young
children (Whitney and Rolfes, 2013).
2. Materials and Methods A cross-sectional survey was conducted at Mwanamukia in Nairobi and the study targeted lactating mothers. It had
a sample size of 260 lactating mothers. A structured and validated questionnaire was used to assess the socio-economic
demographic of lactating mothers and age of introduction of complementary feeds and reasons given for early introduction before 6 months. The conventional 24-hour dietary recall method was used to record the amount of food
consumed by lactating mothers for the last 24 hours. The principle researcher with the help of research assistants
recorded the consumption of food items in chronological order from morning, mid- morning, lunch, mid-afternoon and
diner time. Among the lactating mothers they had to meet the following criteria to be included for the 24-hour dietary
recall interviews. Currently breastfeeding; free from any chronic illness and not on medication; not pregnant at the time;
not fasting.; they also reported any food taken outside the home. A data base of nutritive values of foods were generated
and analyzed using nutrisurvey.
2.1 Statistical analysis
2.1.1 Complementary feeding
Questions on complementally feeding were compiled to generate information on; time the child was breastfed before introducing complementary feeds, age of the child when the complementally feed was introduced, the first
food/fluid given to the child, among others. Frequencies and percentages were obtained.

G.J.B.A.H.S.,Vol.5(1):49-67 (January-March, 2016) ISSN: 2319 – 5584
51
Responses on Socio-demographic and socioeconomic were coded and analyzed quantitatively, using statistical
package SPSS
To facilitate data entry, questionnaires were coded. Data was then entered and cleaned using statistical packages for social sciences (SPSS version 20).The data was then analyzed. The variables for each objective were defined and coded
for ease of data analysis. Frequencies mean, standard deviations, percentages were determined. Correlations were
conducted to identify associations. Where the associations existed, chi-square was used to test their strength.
3. Results
1. Age
The minimum age of the respondents was 20 while the maximum age was 49. The highest number of people fell in the
36-40 years age category.
2. Ethnicity
The study had respondents from different ethnic backgrounds. Meru (25.5 percent), Luhya (17.3 percent) and Kikuyu (16.1 percent) formed the majority of the respondents.
3. Marital status
Majority of the respondents were either married (63.9%), single (25.5%) or divorced (5.9%).

G.J.B.A.H.S.,Vol.5(1):49-67 (January-March, 2016) ISSN: 2319 – 5584
52
4. Education level
43.1% had achieved primary school education and 35.3 persons had attained Secondary ‘O’ level education.
5. The monthly income
The average monthly income was 27, 154.12 Kenyan shillings. The income category with the highest number was
11,000-20,000.
6. Number of people living in the household
The maximum number of people living in households was 12. The average number of people was 6. Household members
between 1-5 were the highest.

G.J.B.A.H.S.,Vol.5(1):49-67 (January-March, 2016) ISSN: 2319 – 5584
53
7. Occupation
There were many differing occupations among the respondents. Majority were business people (28.6%) and housewives
(23.9%).
8. The number of children in the HH
The maximum number of children in the household was 10. The average was 4 children. The category of 0-2 children per
household had the highest percentage (37%)
.
9. Children below 5 years
The Maximum number of children under 5 years was 4. The average was 1.

G.J.B.A.H.S.,Vol.5(1):49-67 (January-March, 2016) ISSN: 2319 – 5584
54
10. The head of the household
51.2 percent of household heads were men while 34.6 percent were women.
Correlations The study found associations among number of people living in household and occupation of mothers; number of
people living in household and monthly income; number of people living in household and age of the mothers;
occupation of mothers and age of the mothers. These were significant at 1%. The monthly income and age of the mothers
were highly correlated at 5 percent. Complementary feeding started early for the young lactating mothers and later for
young mothers.
Table1: correlation between age of complementary feeding and social-economic demorgraphic
Monthly
income
Size of
HH
Occupat
ion
Number of
children
Childre
n
below
5 years
Head of
the
Househol
d
Age of
complement
ary feeding
Age Pearson
Correlation
.151* .498** -.278** .535** .184** -.135*
Sig. (2-tailed) .016 .000 .000 .000 .003 .031
N 254 254 254 254 254 254
Ethnicity Pearson Correlation
-.135* -.166**
Sig. (2-tailed) .032 .008
N 254 254
Highest level
of education
Pearson
Correlation
.298** -.154* .208** -.182** -.188**
Sig. (2-tailed) .000 .014 .001 .004 .003
N 254 254 254 254 254
Monthly
income
Pearson
Correlation
-.196** -.199** -.325**
Sig. (2-tailed) .002 .001 .000
N 254 254 254
House Hold
size
Pearson
Correlation
-.383** .878** .734** -.302** -.321**
Sig. (2-tailed) .000 .000 .000 .000 .000
N 254 254 254 254 254
Occupation Pearson
Correlation
-.322** -.303** .198** .325**
Sig. (2-tailed) .000 .000 .002 .000
N 254 254 254 254
Number of
children?
Pearson
Correlation
.680** -.271** -.261**
Sig. (2-tailed) .000 .000 .000
N 254 254 254
Children below 5
years?
Pearson Correlation
-.358** -.407**
Sig. (2-tailed) .000 .000
N 254 254
Household
Head
Pearson
Correlation
.159*
Sig. (2-tailed) .011
N 254

G.J.B.A.H.S.,Vol.5(1):49-67 (January-March, 2016) ISSN: 2319 – 5584
55
Table 2: correlation between duration of exclusive breastfeeding and socio-economic demographic
Monthly income Occupation
Number of children
Head of the Household
Duration of
exclusive breastfeeding
Age Pearson Correlation
.151* -.278** .535** -.298**
Sig. (2-
tailed)
.016 .000 .000 .000
N 254 254 254 254
Highest level
of education
Pearson
Correlation
.298** .208** -.182**
Sig. (2-
tailed)
.000 .001 .004
N 254 254 254
Monthly
income
Pearson
Correlation
-.199**
Sig. (2-
tailed)
.001
N 254
Occupation Pearson Correlation
-.322** .198** .235**
Sig. (2-tailed)
.000 .002 .000
N 254 254 254
Number of
children
Pearson
Correlation
-.271** -.365**
Sig. (2-
tailed)
.000 .000
N 254 254
*. Correlation is significant at the 0.05 level (2-tailed).
**. Correlation is significant at the 0.01 level (2-tailed).
Table 3: correlation between reasons for breastfeeding and socio-economic demographic characteristics
The respondents give reasons for early introduction as there was no enough breast milk and there was no enough food to
eat after breast feeding. The correlation was significant at 0.05 level and 0.01 level.
Monthly
income Occupation
Number of
children
Head of the
Household
Reason for
breastfeeding
Age Pearson
Correlatio
n
.151* -.278** .535** .116
Sig. (2-tailed)
.016 .000 .000 .064
N 254 254 254 254
Marital
status?
Pearson
Correlatio
n
-.146*
Sig. (2-
tailed)
.020
N 254
Highest level
of education
Pearson
Correlatio
n
.298** .208** -.182** -.161*
Sig. (2-
tailed)
.000 .001 .004 .010
N 254 254 254 254
Monthly
income
Pearson
Correlatio
n
-.199** -.257**

G.J.B.A.H.S.,Vol.5(1):49-67 (January-March, 2016) ISSN: 2319 – 5584
56
Sig. (2-
tailed)
.001 .000
N 254 254
Occupation Pearson
Correlatio
n
-.322** .198** -.076
Sig. (2-
tailed)
.000 .002 .230
N 254 254 254
Number of
children
Pearson
Correlatio
n
-.271** .326**
Sig. (2-
tailed)
.000 .000
N 254 254
Head of the
Household
Pearson
Correlatio
n
-.113
Sig. (2-
tailed)
.073
N 254
*. Correlation is significant at the 0.05 level (2-tailed).
**. Correlation is significant at the 0.01 level (2-tailed).
Number of
people in
HH Occupation
Monthly
income Age Ethnicity
Marital
status
Number of
people in HH
Pearson
Correlation
-.383** -.196** .498** -.116 .022
Sig. (2-tailed) .000 .002 .000 .065 .728
N
254 254 254 254 254
Occupation Pearson
Correlation
.085 -.278** -.015 -.030
Sig. (2-tailed) .179 .000 .810 .630
N 254 254 254 254
Monthly income Pearson
Correlation
.151* .051 -.021
Sig. (2-tailed) .016 .418 .737
N 254 254 254
**. Correlation is significant at the 0.01 level (2-tailed).
*. Correlation is significant at the 0.05 level (2-tailed).

G.J.B.A.H.S.,Vol.5(1):49-67 (January-March, 2016) ISSN: 2319 – 5584
57
Table 4:Correlation between initiation of breastfeeding and socio-economic demographic characteristic. Correlation
was significant.
Monthly
income Occupation
Number of
children
Head of the
Household
Initiation of
breastfeeding
Age Pearson
Correlation
.151* -.278** .535** .136*
Sig. (2-tailed) .016 .000 .000 .031
N 254 254 254 254
Highest level of
education
Pearson
Correlation
.298** .208** -.182**
Sig. (2-tailed) .000 .001 .004
N 254 254 254
Monthly income Pearson
Correlation
-.199** -.169**
Sig. (2-tailed) .001 .007
N 254 254
Occupation Pearson
Correlation
-.322** .198**
Sig. (2-tailed) .000 .002
N 254 254
Number of
children
Pearson
Correlation
-.271** .213**
Sig. (2-tailed) .000 .001
N 254 254
Household head Pearson
Correlation
-.135*
Sig. (2-tailed) .031
N 254
*. Correlation is significant at the 0.05 level (2-tailed).
**. Correlation is significant at the 0.01 level (2-tailed).
11. Time the child is breastfed after introducing complementary feeds
50 percent breastfed until one year while 27.84 percent breastfed for one year and a half. The percentages reduced
with increase in age.
G.J.B.A.H.S.,Vol.5(1):49-67 (January-March, 2016) ISSN: 2319 – 5584
58
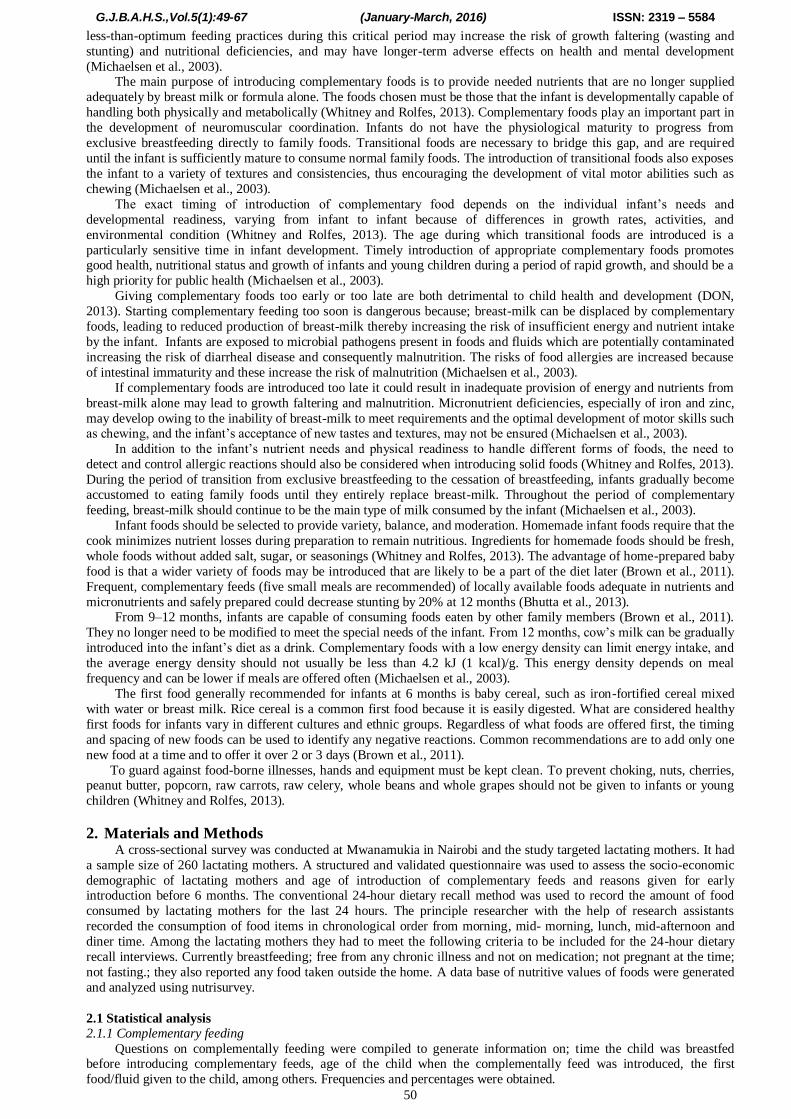
12. Age of the child when the complementally feed was introduced
Majority of the mothers (51.8%) had introduced complementary feeds by three months.
Type of food/fluid Percentage
Cow's milk 34.1 %
Porridge 22.4 %
Plain water 11.0 %
Pawpaw 10.6 %
Infant formula 9.8 %
Solution of water, salt and sugar 2.7 %
13. The first food/fluid given to the child.
The study found that different types of food/fluids were used as complementary food. Cow’s milk was widely used
(34.1 percent) followed by porridge at 22.4 percent.
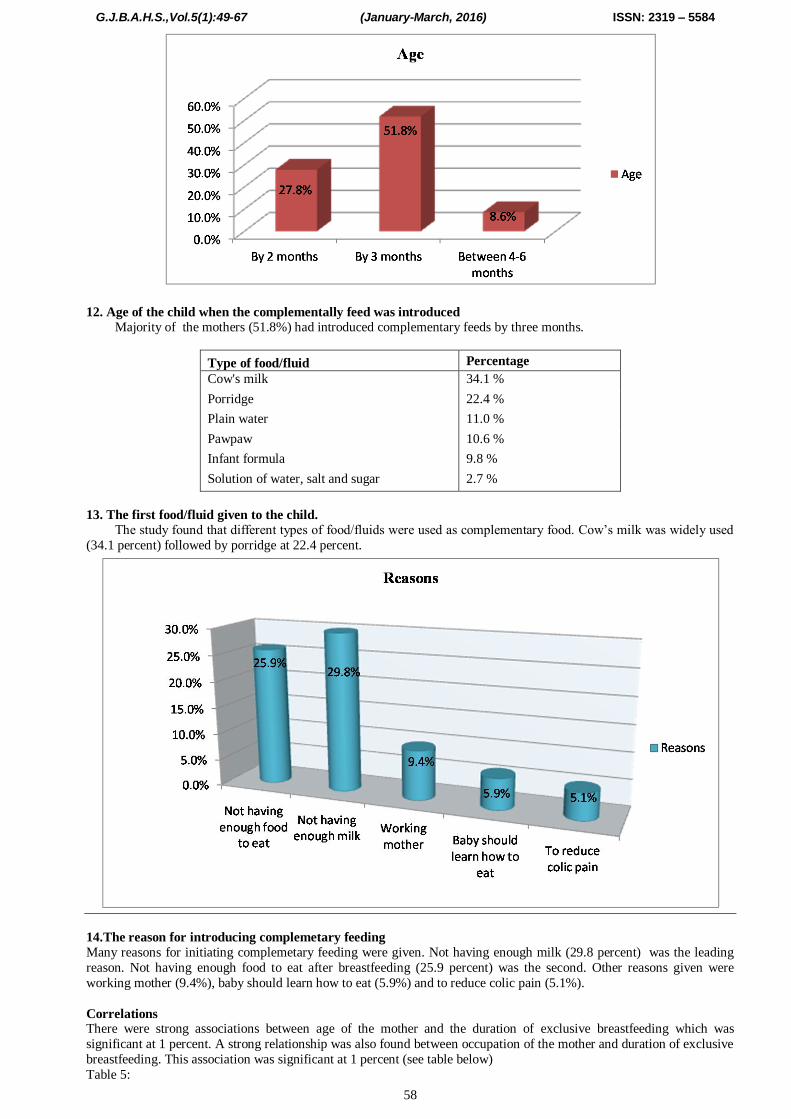
14.The reason for introducing complemetary feeding
Many reasons for initiating complemetary feeding were given. Not having enough milk (29.8 percent) was the leading
reason. Not having enough food to eat after breastfeeding (25.9 percent) was the second. Other reasons given were
working mother (9.4%), baby should learn how to eat (5.9%) and to reduce colic pain (5.1%).
Correlations There were strong associations between age of the mother and the duration of exclusive breastfeeding which was
significant at 1 percent. A strong relationship was also found between occupation of the mother and duration of exclusive
breastfeeding. This association was significant at 1 percent (see table below)
Table 5:

G.J.B.A.H.S.,Vol.5(1):49-67 (January-March, 2016) ISSN: 2319 – 5584
59
Duration of exclusive
breastfeeding
Marital
status
Level of
Education Occupation Age
Duration of exclusive
breastfeeding
Pearson Correlation
1 .084 .048 .235** -.298**
Sig. (2-tailed) .183 .449 .000 .000
N 254 254 254 254 254
Level of
Education
Pearson
Correlation
.048 -.018 1 .208** -.102
Sig. (2-tailed) .449 .780 .001 .105
N 254 254 254 254 254
Occupation Pearson
Correlation
.235** -.030 .208** 1 -.278**
Sig. (2-tailed) .000 .630 .001 .000
N 254 254 254 254 254
Age Pearson
Correlation
-.298** .120 -.102 -.278** 1
Sig. (2-tailed) .000 .056 .105 .000
N 254 254 254 254 254
**. Correlation is significant at the 0.01 level (2-tailed).
*. Correlation is significant at the 0.05 level (2-tailed).
Table 6
The study found out that there was a strong association between the occupation of the mother and the age of the child
when introducing complementary food. It is significant at 1 percent (99%CI). There was also a strong association
correlation between the age of the mothers and age of the child when introducing complementary food. It is significant at
5 percent (95%CI) (see table below)
Duration of breastfeeding
Marital status
Level of Education
Occupation Age
Duration of
breastfeeding
Pearson
Correlation
1 .071 -.009 .180** -.194**
Sig. (2-tailed) .261 .886 .004 .002
N 254 254 254 254 254
Marital status Pearson
Correlation
.071 1 -.018 -.030 .120
Sig. (2-tailed) .261 .780 .630 .056
N 254 254 254 254 254
Level of
Education
Pearson
Correlation
-.009 -.018 1 .208** -.102
Sig. (2-tailed) .886 .780 .001 .105
N 254 254 254 254 254
Occupation Pearson
Correlation
.180** -.030 .208** 1 -.278**
Sig. (2-tailed) .004 .630 .001 .000
N 254 254 254 254 254
Age Pearson
Correlation
-.194** .120 -.102 -.278** 1
Sig. (2-tailed) .002 .056 .105 .000
N 254 254 254 254 254
**. Correlation is significant at the 0.01 level (2-tailed).
*. Correlation is significant at the 0.05 level (2-tailed).

G.J.B.A.H.S.,Vol.5(1):49-67 (January-March, 2016) ISSN: 2319 – 5584
60
There were significant associations (99%CI) between the number of people living in a household and the age at which
the mother started giving the child complementary feed, the occupation of the mother and the age at which mother started
giving the child complementary feed. The age of the mother and the age at which the mother initiated complementary feed were highly correlated at 5 percent (95%CI). See table below
Table 7: Correlation between age of initiating complementary food and some soci- economic characteristics.
Number of
people in HH
Occupation Monthly
income
Age Ethnicity Marital
status
Age of initiating
complementary
food
Pearson
Correlation
-.321**
.325** .014 -.135* .085 .053
Sig. (2-tailed) .000 .000 .827 .031 .178 .399
N 254 254 254 254 254 254
**. Correlation is significant at the 0.01 level (2-tailed).
*. Correlation is significant at the 0.05 level (2-tailed).
Table 8: Correlation between age of introduction of complementary food and the nutritional knowledge of respondents.
The three
food groups
Person
preparing and
cooking for the family
Knowledge on
preparation of vegetables
Knowledge
on cooking vegetables
Growing vegetables
Purpose
for
growing vegetables
Age of complementary
feed initiation
Pearson Correlation
.032 -.107 -.140* -.044 -.057 -.073
Sig. (2-
tailed)
.610 .089 .025 .487 .362 .244
N 254 254 254 254 254 254
Knowledge of
a balanced diet
Pearson
Correlation
.922** .020 -.145* -.189** -.043 -.022
Sig. (2-
tailed)
.000 .756 .021 .002 .494 .725
N 254 254 254 254 254 254
The three food
groups
Pearson
Correlation
.023 -.216** -.227** -.045 -.024
Sig. (2-
tailed)
.719 .001 .000 .474 .708
N 254 254 254 254 254
Who prepares
and cook for
the family
Pearson
Correlation
.228** .094 .049 .061
Sig. (2-
tailed)
.000 .135 .435 .336
N 254 254 254 254
How are
vegetables
prepared?
Pearson
Correlation
.543** .049 .020
Sig. (2-
tailed)
.000 .438 .750
N 254 254 254
How do you
cook the
vegetables?
Pearson
Correlation
.134* .132*
Sig. (2-
tailed)
.033 .035
N 254 254
Do you grow
vegetables?
Pearson
Correlation
.815**
Sig. (2-
tailed)
.000
N 254
**. Correlation is significant at the 0.01 level (2-tailed).
*. Correlation is significant at the 0.05 level (2-tailed).

G.J.B.A.H.S.,Vol.5(1):49-67 (January-March, 2016) ISSN: 2319 – 5584
61
Table 9
The study found the following associations which were significant at 5%. Knowledge of vegetables preparation and the
age of complementary feeding initiation; Knowledge of a balanced diet and age of complementary feeding initiation
If yes, what are the three
food groups
Who prepares
and cook
for the
family
How are vegetables
prepared?
How do you cook the
vegetables?
Do you grow
vegetables?
If yes, what are
the
purpose
for
which
they are
grown?
At what age
did you start
giving your
child
additionalfood
or fluid in
addition to the
breast milk
Pearson
Correlation
.032 -.107 -.140* -.044 -.057 -.073
Sig. (2-
tailed)
.610 .089 .025 .487 .362 .244
N 254 254 254 254 254 254
Do you know
what a
balanced diet
is?
Pearson
Correlation
.922** .020 -.145* -.189** -.043 -.022
Sig. (2-
tailed)
.000 .756 .021 .002 .494 .725
N 254 254 254 254 254 254
If yes, what
are the three
food groups
Pearson
Correlation
.023 -.216** -.227** -.045 -.024
Sig. (2-
tailed)
.719 .001 .000 .474 .708
N 254 254 254 254 254
Who prepares
and cook for
the family
Pearson
Correlation
.228** .094 .049 .061
Sig. (2-
tailed)
.000 .135 .435 .336
N 254 254 254 254
How are
vegetables
prepared?
Pearson
Correlation
.543** .049 .020
Sig. (2-
tailed)
.000 .438 .750
N 254 254 254
How do you
cook the
vegetables?
Pearson
Correlation
.134* .132*
Sig. (2-
tailed)
.033 .035
N 254 254
Do you grow
vegetables?
Pearson
Correlation
.815**
Sig. (2-
tailed)
.000
N 254
*. Correlation is significant at the 0.05 level (2-tailed).
**. Correlation is significant at the 0.01 level (2-tailed).

G.J.B.A.H.S.,Vol.5(1):49-67 (January-March, 2016) ISSN: 2319 – 5584
62
Table 10:
The study found that the food consumed most were dark green vegetable and eggs and food rich in iron were mostly
consumed this means lactating mothers were getting enough iron with good bioavailability.
11. Food frequency
Food item Frequency
Daily 3-6 times a week 1-2 times a week Once a month
Sources of Vitamin A
Eggs 22 17 5 1
Liver
Dark green
leafy vegetables 29 24 24 12
Deep orange fruits 18 7 12 5
Carrots 16 4 2 2
Sweet potatoes 20 6 11 3
Sources of Iron
Goat, beef, pork, rabbit,
lamb, chicken, fish 26 15 25 17
Eggs 22 17 5 1
Legumes 16 7 22 16
Sources of zinc are
Protein-containing foods:
Red meats
whole grains 22 9 7
Some fortified cereals
15.Nutrition status
The highest percentage (36%) of the respondents had a normal BMI. The least number of respondents were obese (8%)
4. Discussion 4.1 Age
The minimum age of the respondents in the current study was 20 while the maximum age was 49. The mean age
was 36 years. This is in agreement with a study in Ghana which found that 63% percent of the farmers were in the age
bracket of 21-40 years (Ackerson and Awuah, 2010). In Namibia as well, majority of the respondents (66.3%) were
young people falling in the age range of 21-40 (Dima, S.J et al., 2002).
In Eldoret, the mean age of respondents was 28 years (Kadenyeka, M.V. et al., 2013). In Gweru city, Zimbabwe,
the average age was 41 years (Jongwe, A. 2014). In their research, Salau and Attah (2012 ) discovered that the mean age
of the respondents was 50 years. Most (35.56%) of the respondents were within the age of 41–50 years followed by those
within the range of 51–60 years (24.44%). In their study, Yusuf et al., (2015) found that the majority of respondents
(76.1%) were aged 41-60 years. This contradicts the findings of the current study. In Accra Ghana, 83% of the farming
household is of 40 years and above while 17% were between 20-29yrs of age. None of the farmers was below 30 years (Danso et al., 2004). However, Stevenson et al., (1994), states that, farming is not restricted to certain age groups.
4.2 Marital status
Majority of the respondents were either married (63.9%), single (25.5%) or divorced (5.9%). A study in Nigeria had
findings similar to the current study. Majority (90%) of the respondents were married while 7.78% were single (Salau
and Attah, 2012). A study in Namibia found that 58% of the respondents were single, 23.4% married, 13.5% cohabiting
and 4% divorced and 6% separated (Dima, S.J et al., 2002). In Samre Woreda, Ethiopia, 92.3% of the respondents were
married, 5.8% divorced and 2% widowed (Haileslassie et al., 2013). In Ibadan, Oyo state, Nigeria 90.9% of the farmers
interviewed were married (Yusuf et al., 2015).

G.J.B.A.H.S.,Vol.5(1):49-67 (January-March, 2016) ISSN: 2319 – 5584
63
4.3 Education level
43.1% had achieved primary school education and 35.3 persons had attained Secondary ‘O’ level education. This
was higher than the national averages in the primary education and lower in the secondary education. According to the KDHS 2014, 25% women and 23% men had completed primary education while 43% women and 49% men had attained
post secondary education. In Nigeria, Salau and Attah (2012), also found that most (33.33%) of the respondents had
primary education while 22.22% had secondary education. About 67% of the respondents in Kumasi Ghana had dropped
out or completed basic education(Ackerson and Awuah, 2010).
In a study in Eldoret, the respondents level of education was 25% for Primary and Secondary 15% (Kadenyeka,
M.V. et al., 2013). In a study in Nigeria, majority of the respondents(50.5%) had tertiary education followed by
primary(25.4%) then secondary (24%) (Yusuf et al., 2015). In Accra Ghana a greater number of farmers interviewed had
primary (33%) or secondary (37%) education while 6% had Tertiary education (Danso et al., 2004).
4.4 Household size
In this study, the maximum number of people living in households was 12 while the average number of people was
6. In Samre Woreda, Ethiopia, the mean family size was 6. The category of ≥5 persons was highest at 63.5% (Haileslassie et al., 2013). In Ghana, Ackerson and Awuah, (2010) found the highest family size to be 5-6 (28%).
According to Stevenson et al., (1994), farm families are generally bigger than the average Dar es Salaam household (5-7
compared to 4-5 members). Larger households have a higher demand for family income and are thus using their
resources to produce more of their own food (Stevenson et al. 1994). ). In Ibadan, Oyo state, Nigeria, majority of the
respondents (92.3%) had a household size of 4-8.
In Pretoria, South Africa the average household counted 4.4 members (Averbeke, W.V 2007). In a study in Eldoret,
the Mean household size was also 4 (Kadenyeka, M.V. et al., 2013). In Gweru city, Zimbabwe, the average household
size was 4.62 (Jongwe, A. 2014). In a study in Namibia, majority of respondents had household sizes ranging from 3 to 8
persons. In Windhoek 76% of the respondents had family sizes of 3-8 persons, 22% had less than 3 persons per
household and only 2% had members greater than 8. In Oshakati the respective figures were 71% with 3-8 persons, 11%
with less than 3 persons and 18% with more than 8 persons living in their families (Dima, S.J et al., 2002).
4.5 Occupation
Majority of the respondents in this study were business people (28.6%) and housewives (23.9%). These findings
concur with those of Foeken and Mwangi (2000) who established that farming activities in the urban areas were mostly
carried out on a part time basis by people in other livelihoods. Their participartion in urban agriculture was to supplement
their family food or income. This study agrees with research conducted by the Planning Commission and the Ministry of
Labour and Youth Development of Daresalaam (1995) which found that, about 30% of the urban population gains an
income in the informal sector and about 6.5% of the informal urban workforce works in urban agriculture. Stevenson et
al. (1996) found that, for 90% of interviewed periurban farmers, agriculture was their primary economic activity.
Farming was the primary occupation of most (90%) farmers, although they all had other sources of supplementary
income, such as trading, teaching, etc (Danso et al., 2004).
The results of Salau and Attah’s study (2012), showed that majority (63.33%) of the respondents were civil servants, 22.22% with trading as their major occupation while 14.45% were full time farmers. In Zimbabwe,
Mudzengerere’s study (2014) showed that 55% of the respondents were unemployed whilst 24% worked in the informal
sector. Only 13% were formally employed. In total, 87% of the interviewed people were unemployed and they were
dependent on the informal sector for employment. In Pretoria, South Africa the contribution to mean total household
income of employment was 67.1%, public welfare grants 16.0%, service provision 7.2%, trade 7.0%, transfers by kin
2.5% and agriculture 0.2% (Averbeke, W.V 2007).
4.6 Head of household
In this study male headed families constituted 51.20% and female headed families constituted 34.60. These results
differ with results of a study carried out in Zimbabwe, where female headed families constitute 31% of the urban
households and these families are vulnerable to poverty (The National Gender Policy, 2002). In Namibia, in Windhoek the male headed households were 78% and female headed households 22% while in Oshakati, the respective figures
were 90 (63%) and 53 (37%) (Dima, S.J et al., 2002). In Accra Ghana, all the households interviewed (100%) are headed
by men (Danso et al., 2004).
4.7 Gender
In this study, more women (49.7%) made decisions on what to plant in the farms than men (33.7%). More women
(56.5%) provided labor in the farms than men (21%). In Kumasi Ghana, majority (98%) of the farmers practicing urban
agriculture were males. Females were not so much involved in the vegetable farming (Ackerson and Awuah, 2010). In
Gweru city, Zimbabwe, males were 66.4% and female 33.62% (Jongwe, A. 2014).
In their study, in Oyo state Nigeria, Yusuf et al., (2015) discovered that 85.5% of the farmers were male while
15.5% were female. In Nasarawa State Nigeria, Salau and Attah (2012), found that majority (55.56%) of the respondents
were females while 44.44% were males. Hovorka et al (2009) describe that women were the greater part of urban farmers worldwide. They comprise 80% of urban farmers in Uganda and 56% in Kenya. The farming households interviewed in
Accra Ghana were predominantly (73%) men (Danso et al., 2004)
4.8 Exclusive breastfeeding
The study showed that respondents exclusively breastfed their infants for a shorter time. 36.5 percent breastfed
exclusively for one month. According to the KDHS (2015), In Kenya, 61 percent of children less than six months are
exclusively breastfed. The proportion of breastfed children declines with age and breastfeeding is nearly universal in a
child’s first month of life. The national figure is higher than this study’s findings. In Nigeria, 16% of infants within the

G.J.B.A.H.S.,Vol.5(1):49-67 (January-March, 2016) ISSN: 2319 – 5584
64
age range of 2 – 8 weeks (<2 months) were exclusively breastfed. Among the 71.6% of the infants studied that were
within the age range of 9 – 16 weeks, 76% were exclusively breastfed. Out of the breastfed infants within the age range
of 17 – 24 weeks, 8% were exclusively breastfed (Olaitan et al., 2015). A study in Malawi discovered that a total of 61 infants (13.3%) were exclusively breast-fed to 4 months, 29 (6.3%) to 5 months and 7 (1.5%) to 6 months ( Kalanda et
al., 2006), these results differ with the current study in that (36.4%) of infants were only exclusively breast fed for only
one month
In Malaysia, the prevalence of exclusive breastfeeding among mothers with infants aged between one and six
months was 43.1% (95% CI: 39.4, 46.8). The prevalence of exclusive breastfeeding when stratified by infant age from
one to six months ranged between 32.4% and 63.3% with the highest among one month old infants and lowest among six
month old infants (Tan, 2011). In Australia, in total, 93.8% of women left the hospital breastfeeding, with 75.6% of
infants being exclusively breastfed. At 6 months of age, 45.8% of infants were receiving any breast milk and only 12.0%
were being fully breastfed. Less than 1% of infants were exclusively breastfed at 6 months of age. The median duration
of exclusive breastfeeding was 3 weeks (Scott et al., 2006). In Sweden, there has been a constantly high breastfeeding
frequency from the beginning of the 1990’s; 98% of all infants are breastfed at 1 week of age and 72% at 6 months of age
(National Board of Health and Welfare, 2003). In Italy, among mothers who exclusively breastfed the median duration of exclusive breastfeeding was 3.1 months.
Within 48 hours of delivery, 91.1% of mothers started breastfeeding. 76.8% of the mothers exclusively breastfed at
hospital discharge. At 4 months the rate of exclusive breastfeeding was 30.9%. At the age of 6 months, 46.8% of the
infants, were still breastfed (Giovannini et al., 2004). In Alabama, less than half (40.7%) of all of the mothers
interviewed initiated breastfeeding, 31.3% breastfed for 1 week or more, and only 8.3% breastfed for 3 months or more.
Breastfeeding duration (measured as mean survival time) in the total sample was 3.5 weeks. Of those mothers who
initiated breastfeeding, one half stopped breastfeedingby 4 weeks postpartum and only one fifth continued for at least 3
months (Meyerink and Marquis, 2002).
The Lancet series states that; In Africa, Asia, and Latin America and the Caribbean only 47–57% of infants younger
than 2 months are exclusively breastfed. For children 2–5 months of age this percentage falls to 25–31%. In children
aged 6–11 months, 6% in Africa and 10% in Asia have stopped breastfeeding, as have 32% in Latin America and the Caribbean (Black et al., 2008).
Although around 63% of women in Scotland initiate breastfeeding (Hamlyn et al. 2002), the rate 6–7 days after
birth is currently estimated at 42% (Tappin et al. 2001).
This study found that there was a strong association between age of the mother and the duration of exclusive
breastfeeding. Older mothers introduced complementary feed later than young mothers. There was also a strong
relationship between the occupation of the mother and the duration of exclusive breastfeeding. These were significant at
1 percent.
4.9 Breastfeeding duration
50 percent breastfed until one year while 27.84 percent breastfed for one year and a half. The percentages reduced
with increase in age of child. These figures were lower than the national percentages indicated in the KDHS (2015),
which states that more than half of children in Kenya are still breastfeeding at age 20-23 months (51 percent). At 9-11months, 93 percent are still breastfeeding, 83.6 percent at 12-17 months, and 59 percent at18-23 months. These results
are in line with a study done In Malawi, where breastfeeding was continued for most babies until 9 months (74.6%). By a
year of age, 11.9% of babies were still partially breast-fed ( Kalanda et al., 2006). In Italy, the median duration of
breastfeeding was 5.3 mo. and median duration of breastfeeding was 6.1 mo for those who exclusively breastfed. The
median duration of breastfeeding in infants who were introduced early to solid foods was 3.1 months while in those who
were not introduced early to solid foods was 5.8 months. At the age of 12 months 11.8% of the infants, were still
breastfed (Giovannini et al., 2004).
A study conducted by Ahmed et al., (2014) in Islamabad, Pakistan, found that the longest duration of breastfeeding
was 6 months (33.3%). In 2004, the Demographic and Health Survey of Bangladesh found that, 62% of infants aged 6–9
months received complementary foods while continuing to breastfed (BDHS 2004). Kabir et al., (2012) found that 71%
of children in Bangladesh had received complementary foods by the age of 6–8 months. In Saudi Arabia, the proportion of mothers who ever initially breast fed their infants was 94.0%. Approximately 92.8% of mothers continued breast
feeding up to 1 month, after which the proportion of lactating mothers declined to 40% by the 12th month postpartum.
The median duration of breast feeding was 6 months (Shawky and Abalkhail, 2003).
The study found a strong association between occupation of the mother and duration of breastfeeding and a strong
relationship between age of the mother and the duration of breastfeeding. These were significant at 1 percent.
4.10 Age of the child when the complementally feed was introduced
Majority of the mothers (51.8%) had introduced complementary feeds by three months. In their research, for
example, Paul et al., (2011) discovered that the mothers who exclusively breastfed for until 6 months cited messages
about exclusive breastfeeding delivered by clinic nurses as their reason. In Kenya, 15.4 % of mothers had introduced
complementally food by the first month, 36.6% by the third month and 57.2% by the fifth month. In Nairobi, nearly all
(98%) of children had been introduced to complementary foods (either liquids or solids) by the age of 6 months. Liquids were introduced much earlier than solids; the mean age of introduction of liquids was one month while that for solids was
three and a half months (Kimani-Murage et al., 2011). In Ogun State, Nigeria, Hamudat and Ibisumbo (2014) found that
73% of the mothers introduced complementary foods before six months, 4% introduced complementary foods before 9
months while 2% introduced complementary foods after 12 months. In Malawi, at 2 months of age, 43% of infants had
received complementary feeding and by 3 months 65% this study differ with the current study in that complementary
feed was introduced by the third month by majority at 51.8%. The mean age for introduction of complementary food was
3.4 months and the mean age for introduction of solids was 4.5 months. The mean age for introduction of water
supplements was 2.5 months (Kalanda et al., 2006).

G.J.B.A.H.S.,Vol.5(1):49-67 (January-March, 2016) ISSN: 2319 – 5584
65
In Italy, the median age at introduction of solid foods was 4.3 months. Solid foods were introduced before the age
of 3 months in 5.6% of infants. At 4 and 6 months of age, 34.2% and 85.5% of infants, respectively, had solids
introduced. All infants received solid foods by the age of 9 months. Early introduction of solid foods occurred in 4.4% of mothers having breastfed (Giovannini et al., 2004). In Saudi Arabia, the introduction of solid foods was as early as the
4th month of the infant’s life. (Shawky and Abalkhail, 2003).
Przyrembel (2012), states that an introduction of complementary food before 15 weeks in breastfed infants may
increase the risk of obesity in later life, particularly when breastfeeding is discontinued at the same time. The
introduction of complementary food before the age of 12–15 weeks appears to increase the risk for infections of the
gastrointestinal and the respiratory tract. The introduction of complementary food before 12 weeks of age appears to
increase the risk for (atopic) eczema in later life and the risk for food allergy in high-risk populations. An introduction
before the age of 17 weeks may be associated with adverse health consequences in later life and is not associated with
any apparent health benefit.
This study found out that there is a strong association between occupation of the mother and age of the child at
introduction of complementary food. It was significant at 1 percent. A strong association was also found between age of
the mother and age of the child at introduction of complementary food. It is significant at 5 percent
4.11 The first food/fluid given to the child
The study found that different types of food/fluids were used as complementary food. Cow’s milk was widely used
(34.1 percent) followed by porridge at 22.4 percent and plain water (11 percent). In addition to breast milk, 15 percent of
children less than 6 months are fed complementary foods, 10 percent consume plain water, 10 percent consume other
milks, and 3 percent consume non-milk liquids (KDHS, 2015). A study in Nairobi by Kimani-Murage et al., (2011),
discovered that the most common complementary foods given to children before the age of six months were: plain water
(56%), with most children on it having been given within the first month (69%); porridge (54%), with most children on it
having been introduced between the second and third months (64.7%); fresh or powdered milk (45%) with most children
on it also having been introduced between second and third months of life (57%); and sweetened/flavoured water (41%),
with most of children on it having been introduced within the first month of life (78%). In an investigation in Pakistan, females supplemented breastmilk with other liquid items like rose water,
cow/buffalo milk, sweetened water, honey and ghutti (Ahmed et al., 2014). In Nigeria, Most of the mothers used cereal
(gruel) (58%) as complementary foods, 17% used solid foods as complementary food while 24% used beverages. Most
of the babies (59%) were being given biscuit, 16% were given sweet and confectionaries while 27% were given soft
drinks (Hamudat and Ibisumbo, 2014). In Italy, it was discovered that 27.8% infants received water with added sugar,
2.7% water and water-based drinks, and 1.1% water alone. The median age at the introduction of fruit juice was 4.9
months. Fruit (73.1%) and cereals (63.9%) were the first solid foods used for most infants. Vegetables, meat/poultry and
milk products were introduced as first solids in 40.3%, 13.7% and 9.2% of infants, respectively. No infants had eggs or
fish given as first solid foods. Cow’s milk was introduced before 3 months in less than 2% of the infants. The median age
of introduction of cow’s milk was 9.3 months (Giovannini et al., 2004).
4.12 The reason for introducing complemetary feeding Many reasons for initiation of complemetary feeding were given. Not having enough milk (29.8 percent) was the
leading reason. Not having enough food to eat after breastfeeding (25.9 percent) was the second reason. Other reasons
given were working mother (9.4%), baby should learn how to eat (5.9%) and to reduce colic pain (5.1%). These results
conccur with the results of a study carried out in Nairobi by Kimani-Murage et al., (2011), ascertained that the main
reason given for introducing complementary foods to children below six months was that the mother had no or little
breast milk (approx 40%). These results also partly concurr with the results of a study carried out by Ahmed et al.,
(2014), which found out the reasons for giving complementary feeds early as, shortage of milk, not enough milk to
satisfy the newborn needs, being working ladies and not able to attend their babies throughout the day and fitness issues
were reported as reasons to cease breastfeeding. Paul et al., (2011) ascertained that mothers in Pemba introduced solid
foods before 6 months because “the baby was crying.”
Sika-Bright and Oduro (2013) discovered that the mothers in their study introduced complemetary feeding because they experienced low supply of breast milk and felt compelled to add other supplementary foods to get the babies
satisfied. They also complained of lack of adequate support from family and friends since they themselves are young
mothers. In the United states, for mothers who stopped breastfeeding within the first month and those who stopped
between the first and second months after their child’s birth, the 3 most frequently chosen reasons were “Baby had
trouble sucking and latching on” (53.7% and 27.1%, respectively), “Breast milk alone didn’t satisfy my baby” (49.7%
and 55.6%), and “I didn’t have enough milk” (51.7% and 52.2%). Among the mothers who discontinued breastfeeding
when their infant was aged 3 months and above, perception of the infant’s lack of satisfaction by breast milk alone
(49.1%–49.5%) and concern about not having enough milk (43.8%–54.0%) continued to be important, and “My baby
lost interest in nursing or began to wean himself or herself” became the third most frequent reason (33.1%–47.9%) (Li et
al, 2008).
More than half of the respondents interviewed were literate, married and lived in households headed by men. A
quarter of them were business people, single and had Meru ethnicity. The highest number of people fell in the 36-40 years age category
Two months was the longest period that most mothers exclusively breastfed their infants. Cow’s milk was the
favorite fluid introduced after weaning. The longest period of breastfeeding for most mothers was a year. The two major
reasons given for weaning early were; not having enough milk and not having enough food to eat after breastfeeding.
Food frequency data from the study indicates that the respondents were consuming a lot of the Vitamin A, Iron and
zinc rich foods at least daily or 3-6 times a day. The lowest consumption was 1 to 2 days a week.
The highest percentage (36%) of the respondents had a normal BMI. The least number of respondents were obese
(8%). The fact that 8% of the respondents were obese could be due to the weight gained during pregnancy which they

G.J.B.A.H.S.,Vol.5(1):49-67 (January-March, 2016) ISSN: 2319 – 5584
66
may not have managed to shed off. It could also be due to the fact that some women tend to overeat while breastfeeding.
Also, the BMI recommendation for normal adults was used in classifying the lactating women in this study, since there is
no recommended standard for them. This could have positioned majority of the women in the overweight and obese categories (WHO, 2000).
5. Conclusion Majority of the respondents were married and had achieved primary education. There was a maximum household
members of 12 and an average of 6. Only a small percentage exclusively breastfed their infants for 6 months. Majority of
lactating mothers introduced complementary feeding before 6 months. The food mostly given as the first complementary
feed was the cow’s milk followed by poridge. Reasons given by majority for introducing complementary feeding before 6 months were not having enough milk and not getting enough food to eat after breastfeeding. Majority of mothers had
normal BMI and only a small percentage was under weight. Their consumption of micronutrients was adequate.
6. Reccomendations Communications of the WHO guidelines on exclusive breast feeding and complementary feeding should be done
effectively using various media channels to the mothers of infants
Female education should be made a priority by the government so that females are educated and empowered to practice adequate exclusive breastfeeding and safe complementary feeding.
Planting of vegetables should be encouraged in households with lactating mothers so that they get enough for own
consumption and for sale to buy other food stuffs which will help them produce enough breast milk to exclusively
breastfeed their babies for at least four to six months. Health professional’s capacity should be strengthened so that they
can regularly counsel clients on importance of exclusive breastfeeding and continuation of the same after introduction of
complementary feeding for at least two years.
Nutrition education should be provided especially on the importance of exclusive breastfeeding for 6 months. The
significance of continued breastfeeding for two years also needs to be passed on. Mothers also need to be informed on
ways they can enhance their breast milk supply so that they do not wean early. Intervention on crop production in the
lactating mother backyards using technologies such as multistory and organoponics can help improve on exclusive
breastfeeding and improve nutritional status of mothers and communities.
7. Acknowledgement First I thank my husband Mr. Patrick Miriti Mwenda for his support throughout the study and especially for
sponsoring my study. I also thank my research assistances Carol, Faith, Malcolm and the University of Nairobi
department of Food Science, Nutrition and Technology, faculty of Agriculture for their support and guidance.
References 1. Admire Jongwe. 2014. Synergies between urban agriculture and urban household food security in Gweru City, Zimbabwe.
Journal of Development and Agricultural Economics. Vol. 6(2), pp. 59-66. 2. Ahmed, A., Chaudhry, A. G., Riaz, A., Batool, A and Farooq, H. 2014. Breastfeeding knowledge and practices: an
Anthropological study of lactating mothers of Noor pur shahan, Islamabad. Sci.Int.(Lahore),26(1),453-457,
3. Bangladesh Demographic and Health Survey (2004) Dhaka, Bangladesh and Calverton, Maryland, USA: National Institute of Population Research and Training, Mitra and Associates, and Macro International.
4. Bhutta ZA, Ahmad T, Black RE, et al, for the Maternal and Child Undernutrition Study Group. What works? Interventions for maternal and child undernutrition and survival. Lancet 2008: 371:417-40
5. Bhutta ZA, Das JK, Rizvi A, Gaffey MF, Walker N, Horton S, Webb P, Lartey A, Black RE, The Lancet Nutrition Interventions Review Group & the Maternal and Child Nutrition Study Group (2013) Evidence-based interventions for improvement of maternal and child nutrition: What can be done and at what cost? The Lancet, 382(9890): 452-477.
6. BF Kalanda, FH Verhoeff, and BJ Brabin Breast and complementary feeding practices in relation to morbidity and growth in Malawian infants European Journal of Clinical Nutrition (2006) 60, 401–407
7. Black RE, Allen LH, Bhutta ZA, Caulfield LE, de Onis M, Ezzati M, Mathers C, Rivera J. Maternal and child undernutrition: global and regional exposures and health consequences. Lancet 2008;371:243–60.
8. Bonte, M., and H. Van Baleen. Prolonged lactation and family planning in Rwanda. J. BioSocial Sci. 1969; 1: 97.. 9. Brown, J. E., Isaacs, J. S., Krinke, U. B., Lechtenberg, E., Murtaugh, M. A., Sharbaugh, C and Splett, P. L., Stang, J. and
Wooldridge N. H. 2011. Nutrition Through the Life Cycle, 4th
Ed. Wadsworth, A. Pp 513-516. 10. Cantrelle, P., and H. Leridon. Breastfeeding, mortality in childhood and fertility in a rural zone of Senegal. Pop. Studies.; 25:
505-533, 1971 11. Danso G., Cofie O., Annang L., Obuobie E. and Keraita B. 2004. Gender and Urban Agriculture: The case of Accra, Ghana.
presented at the RUAF/IWMI/ Urban Harvest Woman Feeding Cities Workshop on Gender Main streaming in Urban Food Production and Food Security. 20-23 September,. Accra, Ghana
12. De Henauw, S., Matthys, C and De Backer, G. (2003). Socioeconomic Status, nutrition and health Arch. Public Health. No. 61. Pp: 15-31
13. Dick Foeken and Alice Mboganie Mwangi. 2000. Increasing Food Security through Urban Farming in Nairobi 14. Dima, S.J., Ogunmokun, A. A and Nantanga, T. 2002. The status of urban and peri-urban agriculture, Windhoek and Oshakati,
Namibia. A Survey Report Prepared For Integrated Support to Sustainable Development and Food Security Programme (IP) in Food and Agriculture Organization of the United Nations (FAO)
15. Division of Nutrition (2013). Maternal, Infant and Young Child Nutrition: National operational guidelines for health workers. Ministry of Health, Kenya.
16. Elizabeth W Kimani-Murage, Nyovani J Madise, Jean-Christophe Fotso, Catherine Kyobutungi, Martin K Mutua, Tabither M Gitau and Nelly Yatich. Patterns and determinants of breastfeeding and complementary feeding practices in urban informal settlements, Nairobi Kenya. BMC Public Health 2011, 11:396 http://www.biomedcentral.com/1471-2458/11/396
17. Gordon Prain and Diana Lee-Smith. 2010. Chapter 2: Urban Agriculture in Africa:What Has Been Learned?

G.J.B.A.H.S.,Vol.5(1):49-67 (January-March, 2016) ISSN: 2319 – 5584
67
18. Hamudat Abiodun Ahmed and Ibisumbo Olayiwola. 2014. Factors Affecting Breastfeeding Practices in Odeda Local Government Area of Ogun State, Nigeria. International Journal of Engineering Science and Innovative Technology (IJESIT) Volume 3, Issue 1, January 2014
19. Hamlyn B., Brooker S., Oleinkova K. & Wands S. (2002) Infant Feeding 2000. Stationery Office, London. 20. Jain, A. K., T. C. Hsu, R. Freedman and W. C. Chang. Demographic aspects of lactation and postpartum amenorrhea.
Demography; 7: 255, 1970. 21. Jane a. scott, colin w. binns, wendy h. oddy, kathleen i. graham. 2006. predictors of breastfeeding duration: evidence from a
cohort study. Pediatrics volume 117, number 4, 22. Kabir, I., Khanam, M., Agho, K. E., Mihrshahi, S., Dibley, M. J and Roy, S. K. (2012), Determinants of inappropriate
complementary feeding practices in infant and young children in Bangladesh: secondary data analysis of Demographic Health Survey 20072011 Blackwell Publishing Ltd Maternal and Child Nutrition. 8 (Suppl. 1), pp. 11–27
23. Kamal, I., F. Hefnawi, M. Ghoneim, M. Talaat, N. Younis, A. Tagui and M. Abdalia. Clinical, biochemical, and experimental studies on lactation. Am. J. Obstet. Gynecol. 105: 315, 1969.
24. Kenya National Bureau of Statistics (KNBS). (2015). Kenya Demographic and Health Survey 2014. Nairobi, Kenya. 25. Kiday Haileslassie, Afework Mulugeta and Meron Girma. 2013. Feeding practices, nutritional status and associated factors of
lactating women in Samre Woreda, South Eastern Zone of Tigray, Ethiopia. Nutrition Journal 12:28 26. Kok Leong Tan. 2011. Factors associated with exclusive breastfeeding among infants under six months of age in peninsular
Malaysia. International Breastfeeding Journal 6:2 27. M Giovannini, E Riva, G Banderali, S Scaglioni, SHE Veehof, M Sala, G Radaelli and C Agostoni. 2004. Feeding practices of
infants through the first year of life in Italy. Acta Paediatr 93: 492-497 28. Michaelsen, K. F., Weaver, L., Branca, F and Robertson, A. 2003. Feeding and nutrition of infants and young children:
Guidelines for the WHO European Region, with emphasis on the former Soviet countries. WHO Regional Publications,
European Series, No. 87 29. Mudzengerere, F. H., (2014) The Contribution of Women to Food Security and Livelihoods through Urban Agriculture in the
City of Bulawayo, Zimbabwe. Zimbabwe Journal of Science & Technology Vol. 7 (2012) MS. 6 30. Mugalavai Violet Kadenyeka, David Omutimba and Nyakecho Harriet. 2013. Urban agriculture livelihoods and household food
security: a case of Eldoret, Kenya. ARPN journal of agricultural and biological science. Vol. 8, No. 1 31. Nana O.B. Ackerson and Esi Awuah. 2010. Urban Agriculture Practices and Health Problems among Farmers Operating on a
University Campus in Kumasi, Ghana 32. Oberndorfer, L., and W. Mejia. Statistical analysis of the duration of breastfeeding (a study of 200 mothers ofAntioquia
Province, Colombia). J. Trop. Pediat.; 4: 27, 1968.
33. Olaitan I. N., Onimawo I. A., Nkwoala C. C. 2015, Characteristics and Micronutrient Intakes of Exclusively and Non - Exclusively Breastfeeding Mothers in Imo State of Nigeria International Journal of Food Science and Nutrition Engineering 5(1): 68-73DOI: 10.5923/j.food.20150501.09
34. Osteria, T. Lactation and postpartum amenorrhea in a rural community. Acta Med. Phillippina.; 9: 144, 1973 35. Pan American Health Organization/World Health Organization. Guiding principles for complementary feeding of the breastfed
child. Geneva: WHO, 2005 36. Paul, K. H., Muti, M.,. Khalfan, S. S., Humphrey, J. H., Caffarella, R and Stoltzfus, R. J. 2011, Beyond food insecurity: How
context can improve complementary feeding interventions. Food and Nutrition Bulletin, vol. 32, no. 3. The United Nations University.
37. Perez, A., R. Potrer and G. S. Masnick. Timing and sequence of resuming ovulation and menstruation after childbirth. Pop. Studies,; 25: 491, 1974.
38. Petra Jacobi, Jörg Amend and Suzan Kiango. 1996. Urban Agriculture in Dar Es Salaam: Providing An Indispensable Part Of The Diet
39. Planning Commission and Ministry of Labour and Youth Development. 1995. The Dar es Salaam informal sector 1995; Volume I: Analysis and Tabulations. Dar es Salaam: Planning Commission and Ministry of Labour and Youth
40. Rachael O. Meyerink and Grace S. Marquis. 2002. Breastfeeding Initiation and Duration Among Low-Income Women in Alabama: The Importance of Personal and Familial Experiences in Making Infant-Feeding Choices. J Hum Lact 18(1)
40 Ruowei Li, Sara B. Fein, Jian Chen, Laurence M. Grummer-Strawn, Why Mothers Stop Breastfeeding: Mothers’ Self-reported Reasons for Stopping During the First Year. Pediatrics 2008;122:S69–S76
41 Sherine Shawky and Bahaa A. Abalkhail. Maternal factors associated with the duration of breast feeding in Jeddah, Saudi Arabia. Paediatric and Perinatal Epidemiology 2003, 17, 91–96. Blackwell Publishing Ltd.
41. Sika-Bright, Solomon and Oduro, Georgina Yaa (2013) "Exclusive Breastfeeding Practices of Mothers in Duakor, a Traditional Migrant Community in Cape Coast, Ghana," Journal of Global Initiatives: Policy, Pedagogy, Perspective: Vol. 8: No. 1, Article 6.
42. Singarimbun, M., and C. Manning. Breastfeeding, amenorrhea, and abstinence in a Javanese village: a case study of Mojolama.
Studies Family Planning.; 7: 175, 1976. 43. Smit, J., Nasr, J and Ratta, A. 2001. Chapter 2- Urban Agriculture Yesterday and Today in Food, Jobs and Sustainable Cities.
The Urban Agriculture Network, Inc. 44. Stevenson C, Kinabo J & Nyange D. 1994. Urban horticulture in Tanzania. Dar es Salaam: Urban Vegetable Promotion Project
(unpublished). 45. Sulaiman A. Yusuf, Olubunmi L. Balogun and Olanike E. Falegbe. 2015. Effect Of Urban Household Farming On Food
Security Status In Ibadan Metropolis, Oyo State, Nigeria Journal of Agricultural Sciences Vol. 60, No. 1. Pages 61-75 46. Tappin D., Mackenzie J.M., Brown A.J., Girdwood R.W.A., Britten J., Broadfoot M. & Warren J. (2001) Breastfeeding rates are
increasing in Scotland. Health Bulletin 59(2), 102–108. 47. The National Board of Health and Welfare. Breast-feeding, children born 2003: Centre for Epidemiology, 2005. 48. The National Gender Policy, (2002), Harare: The Gender Department in the Ministry of Youth Development, Gender and
Employment Creation 49. Whitney, E and Rolfes, S. R. (2013). Understanding Nutrition. 13th Ed. Wardsworth, Cengage Learning. Belmont, US 50. W van Averbeke. 2007. Urban farming in the informal settlements of Atteridgeville, Pretoria, South Africa