to appear in ieee transaction on power systems 1 effect of reactive … · · 2017-04-10index...
TRANSCRIPT
TO APPEAR IN IEEE TRANSACTION ON POWER SYSTEMS 1
Effect of Reactive Power Limit Modeling onMaximum System Loading and Active and Reactive
Power MarketsBehnam Tamimi,Student Member, IEEE, Claudio A. Canizares,Fellow, IEEE, and Sadegh Vaez-Zadeh,Senior
Member, IEEE
Abstract—This paper presents a comparative investigation ofvarious representations of reactive power limits in maximumloadability and active and reactive power market studies. Previ-ously proposed optimal power flow (OPF) models for these typesof analyses are first reviewed and briefly discussed. Differentmodels for representing reactive power limits in these optimiza-tion problems are then presented, concentrating in particularon the proper modeling of the generators’ capability curvesas terminal voltages change, which has been identified as ashortcoming of previous studies. Comparative numerical analysesof the effect of various reactive power limit models in maximumloading and active and reactive power dispatch and pricing levelsare presented and discussed, to thus quantify the effect thesevarious limit representations have on the corresponding results.Two test systems, namely, the CIGRE-32 benchmark system anda 1211-bus dispatch model of a European network, are usedfor numerical studies. The presented results show that in mostOPF applications, the improvement on the reactive power limitsrepresentation lead to subtle differences at the cost of increasedcomputational complexity, which in some cases may be difficultto justify in practice.
Index Terms—Reactive power limits, generator capabilitycurves, maximum loadability, voltage stability, electrical energymarkets, reactive power markets, optimal power flows.
I. I NTRODUCTION
SYNCHRONOUS generators are a primary source of re-active power in electric power systems. Although there
are other important reactive power sources such as shuntcapacitors and Flexible AC Transmission System (FACTS)controllers (e.g. Static Var Compensators or SVCs and ShuntStatic Synchronous Compensator or STATCOMs), to a greatextent, generators are responsible for maintaining adequatevoltage profiles across the systems [1]. Consequently, theircharacteristics and their limitations are of major importancefor the analysis of power grids, particularly when the systemis operated near its limits. This is even more relevant underthe current competitive market environment, as economic
Manuscript submitted December 2008; revised and resubmitted May 2009;accepted June 2009.
This work was partially supported by grants from CFI, NSERC andMITACS, Canada. This work was also partially supported by the Universityof Tehran through the research grant of the third author.
B. Tamimi and S. Vaez-Zadeh are with the Department of Elec-trical and Computer Engineering, University of Tehran, Iran (e-mail:[email protected]).
C. A. Canizares is with the Department of Electrical and ComputerEngineering, University of Waterloo, Waterloo, ON, N2L-3G1, Canada (e-mail: [email protected]).
pressures from market participants force the grid to supplythe required demand with widely varying suppliers whilestill guaranteeing the operational and security limits of thesystem [2]. Therefore, the economic performance of electricitymarkets is directly related to the level which the systems’,andespecially generators’, capabilities are fully recognized anddeployed.
The stability and security limits of power systems can beclosely approximated by voltage stability criteria [3]. Inalmostall voltage instability incidents, one or more synchronousgenerators reached its reactive power limits (Q-limits) [1];thus, the proper modeling of the reactive power capabilities ofgenerators is of crucial importance for voltage stability studies.Various models have been proposed for the representation ofQ-limits of synchronous generators in voltage stability andmarket analyses. Therefore, this paper starts with comparingthe results of using these models in the aforementioned studies,to highlight their shortcomings and advantages.
There are two dominant approaches to voltage stabilitystudies, namely, Continuation Power Flow (CPF) and, morerecently, Optimal Power Flow (OPF) based approaches; thelatter are also referred to as OPF-Direct Methods (OPF-DM)[3]. In the CPF method, the loading level is increased untilthere is no feasible solution to the power flow equationsor the solution does not satisfy required ranges for certainsystem variables such as voltages or power transfers [4].The OPF-DM, on the other hand, is mainly an optimizationproblem that maximizes the system loadability while satisfyingoperational constraints, including the power flow equations aswell as limits on generator reactive powers, voltages and powertransfers, as discussed for example in [5], [6]. Depending onthe way the generator voltage control is modeled, the resultsobtained from an OPF-DM can be shown to be basically thesame as those obtained from the CPF method [7]. In most ofthese studies, generators’ Q-limits have been usually modeledas simple fixed limits to reduced computational burden andavoid convergence problems, in spite of the key role that theselimits play in voltage instability phenomenon, as discussed forexample in [2] and [8]. In the latter two papers, the generatorcapability curves are better represented in voltage stabilitystudies, modeling the voltage dependence of generator Q-limits.
A variety of OPF models are widely used to dispatchgenerators and obtain pricing signals in electrical energymarkets [9]–[12]. More sophisticated market OPF models have
TO APPEAR IN IEEE TRANSACTION ON POWER SYSTEMS 2
been also proposed, where, for example, voltage stability andmarket clearance problems are jointly considered in the OPFformulation [6], [13], [14]. In the majority of these marketauction models, generators Q-limits are assumed as fixedvalues.
OPF-based approaches have been also proposed to effi-ciently formulate a reactive power market problem, providedthat generators capability curves are properly modeled anddeployed [15], [16]. In [17], a better representation of Q-limitsin electricity markets is discussed, proposing as well an OPF-based formulation for reactive power contracting. The authorsin [18] propose a reactive power market structure in which thereactive power management and pricing problem is dividedinto two stages, namely, a seasonal procurement process anda real-time dispatch problem; in this paper, an OPF-basedprocedure for optimal procurement and pricing of reactivepower is also proposed and discussed. In both [17] and [18],the effect of generated active power on the associated Q-limitsis explicitly modeled; however, it is assumed that these limitsare independent of the terminal voltage magnitude. Finally,the authors in [19] and [20] use an OPF model to representgenerator Q-limits in a mixed active and reactive power marketreal-time auction, implicitly accounting for rotor and statorcurrent limits in the modeling. However, no discussions orcomparisons on the effect of this modeling in the marketoutput variables is presented; moreover, the proposed OPFformulation presents various pitfalls as discussed in [18].
Based on the literature review, the present paper concen-trates on comprehensibly addressing some of the shortcomingsobserved in previous publications. Therefore, different modelsof generator Q-limits are discussed in detail, comparing theireffect on system loadability as well as electricity marketOPF-models for both active and reactive powers. Three OPF-based models for the study of maximum system loadabilityand market studies, considering the precise and practicalrepresentation of generator Q-limits, are presented, discussedand compared based on the results obtained for two realistictest systems. The estimation of missing data required forthe proposed models is also discussed. Improvements to apreviously proposed solution technique for the Mixed IntegerNonlinear Programming (MINLP) problem associated with thereactive power procurement OPF model are presented as well.
The paper is organized as follows: In Section II, a briefbackground review of previously proposed OPF models andthe representation of generator Q-limits in voltage stability,active power market auctions, and reactive power procurementis presented. Section III discusses the proposed OPF modelsthat properly represent the generator capability curves throughexplicit limits on rotor and stator currents; this section alsopresents improvements to the solution technique of the Q-procurement MINLP OPF problem. A detailed comparativeanalysis of the effect of various Q-limit representations onsystem loadability and active and reactive powers marketstudies is presented in Section IV; the 32-bus CIGRE testsystem and a 1211-bus model of a European network are usedin these analyses. Finally, Section V summarizes the mainresults and contributions of the present paper.
II. BACKGROUND
A. OPF-DM Formulation
As discussed in the previous section, OPF models have beenproposed for maximum loadability calculations in voltage sta-bility studies. An OPF model with complementarity constraintsis proposed in [6], [7], where it is shown that it yields thesame maximum loadability results as a CPF technique. Inthis formulation, the generator voltage controls are modeledexplicitly; thus, when the generator’s reactive power limits arereached, the machine loses control over its terminal voltage.The latter is mathematically represented in this model usingcomplementarity constraints, which for a generatork can bewritten as follows:
0 ≤(QGk − QGk min) ⊥ Vak ≥ 0 ⇒
(QGk − QGk min) Vak = 0 (1a)
0 ≤(QGk max − QGk) ⊥ Vbk ≥ 0 ⇒
(QGk max − QGk) Vbk = 0 (1b)
Vtk = Vtko + Vak − Vbk (1c)
whereVt represents the generator terminal voltage magnitude;QG stands for the generator reactive power output;⊥ standsfor thecomplement operator;Va andVb are auxiliary, nonnega-tive variables that allow increasing or decreasing the generatorterminal voltage, depending on the value ofQG; andVtko isthe kth generator terminal voltage set-point.
B. OPF Market Auction Model
An optimal set of electric power transactions can be cal-culated by using a proper OPF formulation. Usually theobjective of this optimization problem is the minimizationof electricity production costs or the maximization of socialbenefit or social welfare [10], [11]. Nodal electricity pricesor Locational Marginal Prices (LMPs) are a byproduct of theOPF solution at no extra computational cost. Moreover, theinclusion of system operational and security constraints in anOPF model is straight-forward. It should be noted that, in thisOPF model, there is no need for complementarity constraintsas in the previous subsection, since the aim here is to obtainthe “optimal” generator terminal voltage set-points, which arebounded above and below.
C. Reactive Power Procurement Problem
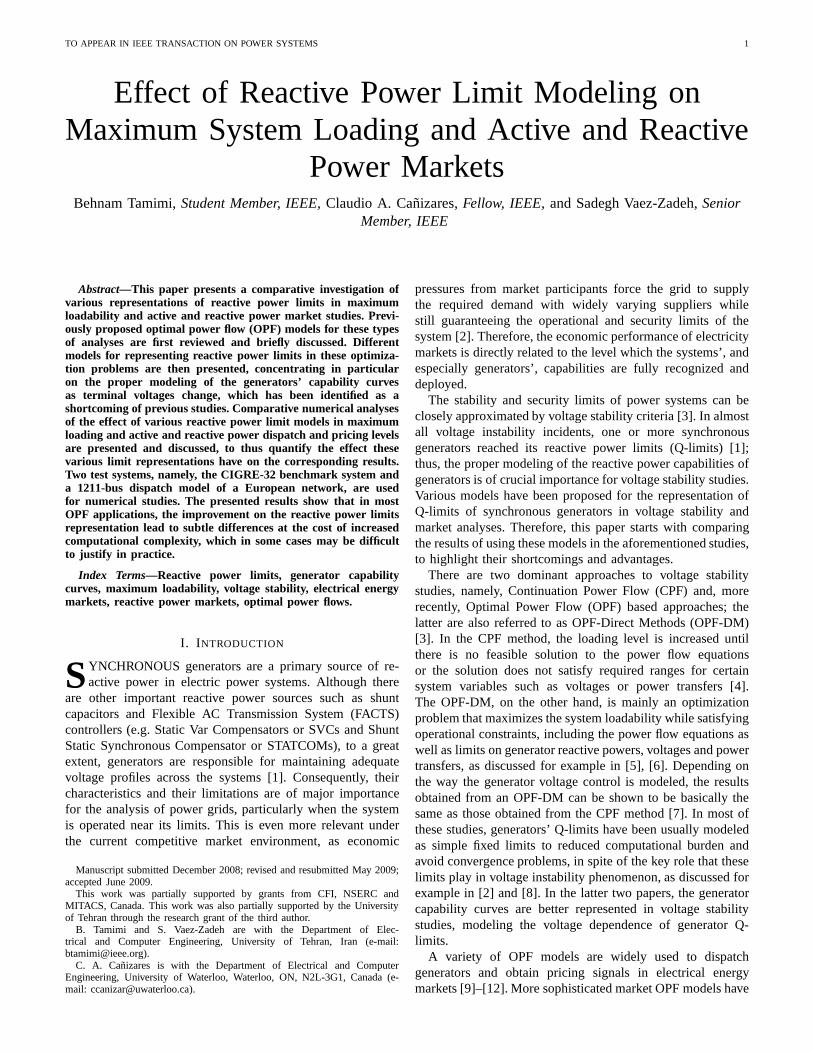
An optimal set of generators for providing reactive powerin the grid can be determined on a seasonal basis by anappropriate OPF formulation [17], [18]. Due to the local natureof reactive power, this problem should be implemented fordifferent voltage zones. Note that it is not proposed as amechanism for real-time reactive power dispatch. The procure-ment procedure is assumed to be based on generators beingcompensated for availability, energy losses, and opportunitycosts associated with active power output reductions due tothe required reactive power provision and generator capabilitylimits. The assumed structure of reactive power offers fromgenerators is depicted in Fig.1.
TO APPEAR IN IEEE TRANSACTION ON POWER SYSTEMS 3
Fig. 1. Reactive power offers from generators and the three operating regions.
The objective function of the procurement OPF problemis a “societal advantage function” (SAF ), which is definedas the aggregate system benefits gained from reactive powerservices minus the expected payments by the system operator.The SAF for a given zonek is expressed as follows [18]:
SAFk = −ρ0k−
∑
i∈k
x1i(CL |µi| − ρ1k
) (QG1i− QGlead)
+∑
i∈k
x2i(CL |ηi| − ρ2k
)(
QG2i− QGlag
)
+∑
i∈k
x3i(CL |γi| − ρ2k
)(
QG3i− QGlag
)
− 0.5ρ3kx3i
(QG3i− QGAi
)2 . (2)
Here, QG1i, QGdi
, QG2i, and QG3i
are reactive powervariables representing the 4 regions for theith generator,i.e. under-excitation, mandatory, over-excitation and oppor-tunity regions, respectively, as per Fig.1, where the param-etersQGlag, QGlead and QGA
are defined. The variablesx1i,
xdi, x2i
and x3iare binary variables associated with the
aforementioned 4 reactive power generating regions, to modelthe generator operation in only one of these regions at atime. The parametersµ, η and γ are sensitivity factors ofthe system’s maximum loadability with respect toQGmin,QG max and QG, respectively, obtained from the OPF-DMproblem; these parameters are meant to represent the marginalbenefit of generator’s reactive powers with respect to systemsecurity. The parameterCL is a loadability cost parameter($/MWh) representing the monetary value of system security.The variablesρ1 ($/Mvar) andρ2 ($/Mvar) are the zonal pricesfor energy losses in the under and over-excitation regions,andρ3 ($/Mvar/Mvar) andρ0 ($/Mvar) are the zonal uniformopportunity and availability price components, respectively.
The reactive power procurement OPF problem is formulatedin [17], [18] based on the zonal objective function (2) andsystem operational constraints. Given the presence of integervariables, this is an MINLP problem, i.e. it is discontinuousand nonconvex, and hence there is a need for special solversand/or solution techniques to obtain a solution. Thus, a heuris-
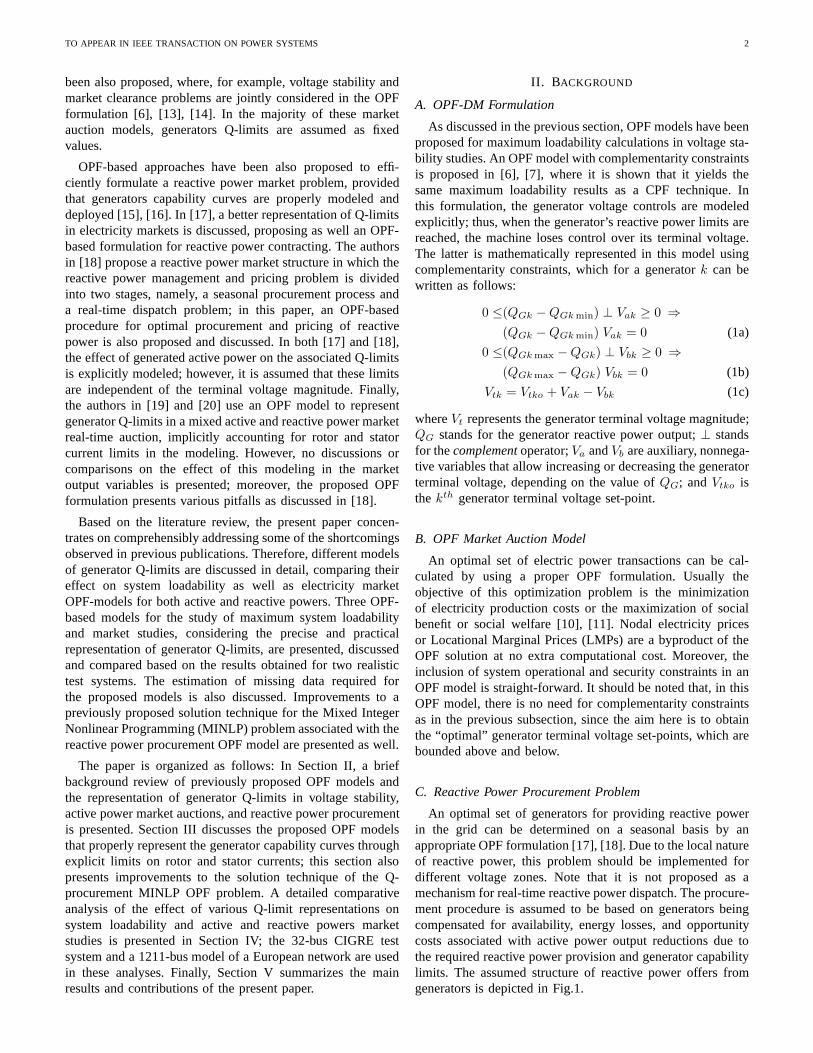
Fig. 2. Representation of reactive power maximum limits.
tic iterative approach to transform this MINLP problem intoaseries of Non-linear Programming (NLP) problems is proposedand discussed in [18]. An improved solution approach basedon sensitivities ofSAF with respect to the different regionsof generator reactive power operation is proposed in SectionIII.
It should be mentioned that the reactive power marketstructures and associated models existent in the literatureconcentrate mainly on generators. Appropriate market mecha-nisms for managing and pricing other reactive power sourcessuch as SVC and STATCOM FACTS controllers have yet tobe proposed and discussed.
D. Representation of Q-limits
Economical usage of power system capabilities is criticaldue to the scarcity of resources and increasing demand.Hence, it has been proposed to model generator reactive powermaximum limits as a function of its active power output tobetter employ its capabilities [17], [18]. The model is depictedgraphically in Fig.2 for a given terminal voltageVto, wherethe intersection of the maximum field (rotor) induced voltagesEf max and the maximum stator currentIa max is noted asa point M. It can be reasonably assumed thatPSM
typicallyrepresents the rated active power, which is typically closetothe maximum active power outputPS max, and QGM
standsfor the maximum reactive power usually stated in the powerflow data set. The maximum reactive power limit in this casecan be stated mathematically as follows:
QG1max =
√
(
Vto Ef max
XS
)2
− P 2
S −V 2
to
XS
(3a)
QG2max =
√
(Vto Ia max)2− P 2
S (3b)
QG max =
{
QG1max if PS < PSM
QG2max if PS > PSM
(3c)
wherePS is the generator active power output;QG1max andQG2max represent reactive power limits due to maximum field
TO APPEAR IN IEEE TRANSACTION ON POWER SYSTEMS 4
and stator currents, respectively; andXS is the machine’s syn-chronous reactance. This reactive power limit representationcan be readily added to the OPF-DM model and the OPFauction model, as proposed in [17], [18].
Observe in (3) that there is a switching behavior in themaximum reactive power limit depending on the value ofgenerated active power. Because of this discontinuity, thismodel can lead to computational problems during the OPFsolution process, especially in the presence of complementarityconstraints. In fact, due to these convergence issues, thegenerators’ active power outputs were assumed constant inthe OPF models discussed in [17], [18]. Since the generatorterminal voltage magnitude is unknown in the OPF model,choosing a priori fixed value for this variable to model thegenerator capability curves is an approximation that may leadto errors in the final results, as discussed in Section IV. Themodels proposed and discussed in Section III and tested inSection IV demonstrate that this assumption is not reallynecessary.
The reason for the aforementioned errors can be clearlyshown by the following analysis: If the partial derivativesofQG1max and QG2max with respect toVt are calculated, fortypical values of variables and parameters, one has, as perFig.3, that:
∂QG1max
∂Vt
∣
∣
∣
∣
Vto
≈ 0− (4a)
∂QG2max
∂Vt
∣
∣
∣
∣
Vto
≥ 0 (4b)
This means that, if for example, the actual voltage value ofthe OPF solution is smaller than the chosenVto value, thenQG1max is slight smaller than the actual Q-limit associatedwith the maximum rotor current. On the other hand,QG2max
would be larger than the actual limit associated with themaximum stator current.
III. PROPOSEDOPF MODELS
Equations (3a) and (3b) can be simply rewritten as follows,for any value ofVt, Ef andIa:
(
QG +V 2
t
XS
)2
+ P 2
S −
(
Vt Ef
XS
)2
= 0. (5)
P 2
S + Q2
G = (Vt Ia)2 (6)
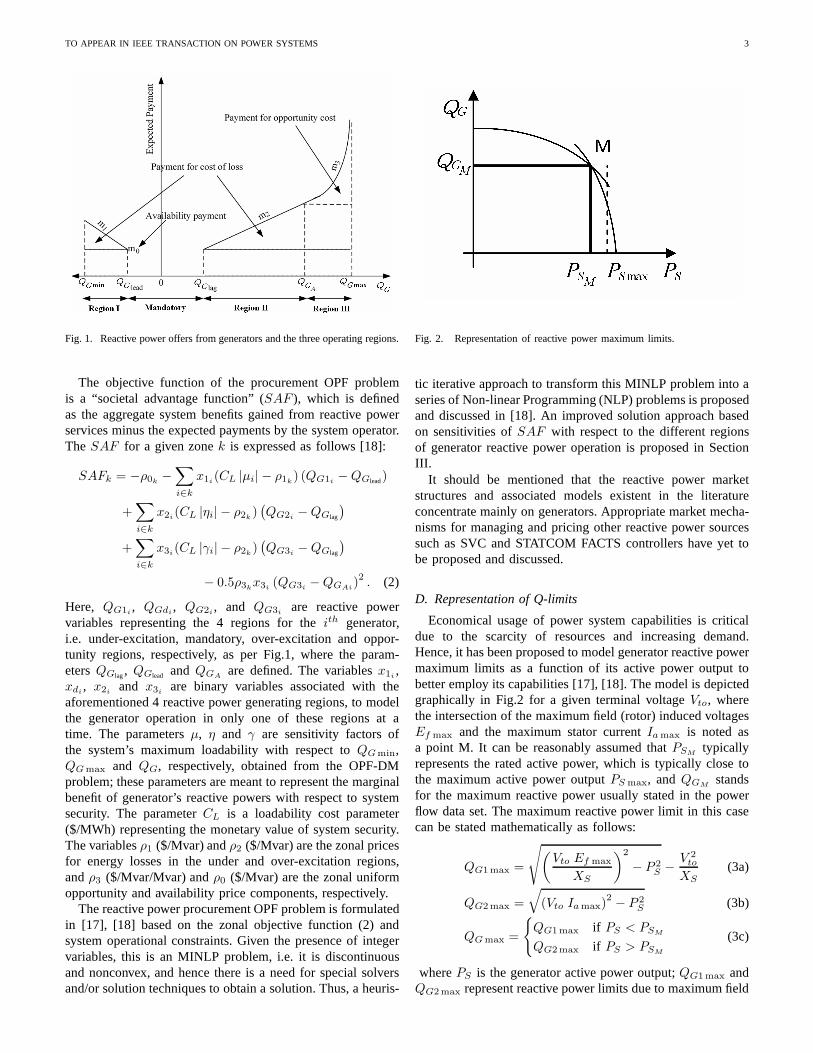
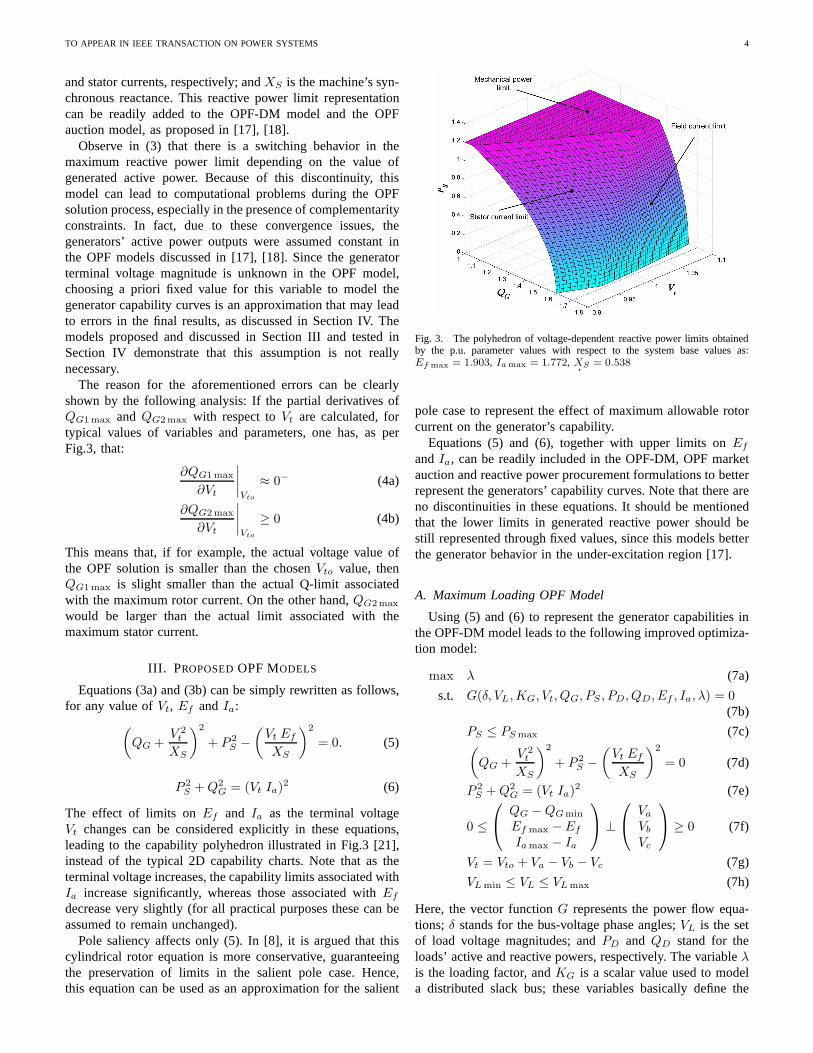
The effect of limits onEf and Ia as the terminal voltageVt changes can be considered explicitly in these equations,leading to the capability polyhedron illustrated in Fig.3 [21],instead of the typical 2D capability charts. Note that as theterminal voltage increases, the capability limits associated withIa increase significantly, whereas those associated withEf
decrease very slightly (for all practical purposes these can beassumed to remain unchanged).
Pole saliency affects only (5). In [8], it is argued that thiscylindrical rotor equation is more conservative, guaranteeingthe preservation of limits in the salient pole case. Hence,this equation can be used as an approximation for the salient
Fig. 3. The polyhedron of voltage-dependent reactive powerlimits obtainedby the p.u. parameter values with respect to the system base values as:Ef max
= 1.903, Ia max = 1.772, XS = 0.538.
pole case to represent the effect of maximum allowable rotorcurrent on the generator’s capability.
Equations (5) and (6), together with upper limits onEf
andIa, can be readily included in the OPF-DM, OPF marketauction and reactive power procurement formulations to betterrepresent the generators’ capability curves. Note that there areno discontinuities in these equations. It should be mentionedthat the lower limits in generated reactive power should bestill represented through fixed values, since this models betterthe generator behavior in the under-excitation region [17].
A. Maximum Loading OPF Model
Using (5) and (6) to represent the generator capabilities inthe OPF-DM model leads to the following improved optimiza-tion model:
max λ (7a)
s.t. G(δ, VL, KG, Vt, QG, PS , PD, QD, Ef , Ia, λ) = 0(7b)
PS ≤ PS max (7c)(
QG +V 2
t
XS
)2
+ P 2
S −
(
Vt Ef
XS
)2
= 0 (7d)
P 2
S + Q2
G = (Vt Ia)2 (7e)
0 ≤
QG − QGmin
Ef max − Ef
Ia max − Ia
⊥
Va
Vb
Vc
≥ 0 (7f)
Vt = Vto + Va − Vb − Vc (7g)
VL min ≤ VL ≤ VL max (7h)
Here, the vector functionG represents the power flow equa-tions; δ stands for the bus-voltage phase angles;VL is the setof load voltage magnitudes; andPD and QD stand for theloads’ active and reactive powers, respectively. The variable λ
is the loading factor, andKG is a scalar value used to modela distributed slack bus; these variables basically define the
TO APPEAR IN IEEE TRANSACTION ON POWER SYSTEMS 5
generator output and load levels as follows:
PS = (1 + λ + KG)PGo (8a)
PD = (1 + λ)PLo (8b)
QD = (1 + λ)QLo (8c)
wherePGo, PLo and QLo are generation active powers andload active and reactive powers base values.
The loss of voltage control due to stator and rotor currentlimits is modeled by the complementarity constraints (7f).Observe that, according to [22], the larger number of com-plementarity constraints may increase the non-smoothnessofthe loadability surface in comparison to the model with simplefixed Q-limits, given the larger number of generator possiblestates.
B. OPF Market Model
The OPF market model can also be improved by replacingthe fixed reactive power limits with the proposed generatorcapability model, resulting in the following model:
max SB =∑
j∈D
CDjPDj −∑
i∈G
CSiPSi (9a)
s.t. G(δ, VL, Vt, QG, PS , PD, Ef , Ia) = 0 (9b)
PS min ≤ PS ≤ PS max (9c)
PD min ≤ PD ≤ PD max (9d)(
QG +V 2
t
XS
)2
+ P 2
S −
(
Vt Ef
XS
)2
= 0 (9e)
P 2
S + Q2
G = (Vt Ia)2 (9f)
0 ≤ Ef ≤ Ef max (9g)
0 ≤ Ia ≤ Ia max (9h)
QG min ≤ QG (9i)
Vt min ≤ Vt ≤ Vt max (9j)
VL min ≤ VL ≤ VL max (9k)
Pij(δ, VL, Vt) ≤ Pij max ∀(i, j) ∈ T (9l)
where theSB objective function stands for the social benefit(social welfare);D and G represent the set of loads andgenerators, respectively; andCD andCS stand for the corre-sponding demand and supply bids. The variablePij representsthe power flow over a transmission component(i, j), whichis bounded due to operational/security limits, andT is theset of transmission components. The demand’s power factoris typically assumed constant, thus the corresponding reactivepower is not a variable, being proportional to its active power.In the case of inelastic demand,PD is fixed andCD = 0,resulting inSB solely representing generated power costs forthe system.
C. Reactive Power Procurement Model
The procurement model can also be improved as the previ-ous OPF-models by replacing the fixed reactive power upperlimits with the proposed generator capability representation,
resulting in the following model:
max SAF =∑
k
SAFk (10a)
s.t. G(δ, VL, Vt, QG, Ef , Ia) = 0 (10b)(
QG +V 2
t
XS
)2
+ P 2
S −
(
Vt Ef
XS
)2
= 0 (10c)
P 2
S + Q2
G = (Vt Ia)2 (10d)
0 ≤ Ef ≤ Ef max (10e)
0 ≤ Ia ≤ Ia max (10f)
x1QG min ≤ QG1 ≤ x1QGlead : α1 (10g)
αd : xdQGlead ≤ QGd ≤ xdQGlag : αd (10h)
α2 : x2QGlag ≤ QG2 ≤ x2QGA: α2 (10i)
α3 : x3QGA≤ QG3 (10j)
x1 + xd + x2 + x3 = 1 (10k)
QG = QG1 + QGd + QG2 + QG3 (10l)
Vt min ≤ Vt ≤ Vt max (10m)
VL min ≤ VL ≤ VL max (10n)
Pij(δ, VL, Vt) ≤ Pij max ∀(i, j) ∈ T (10o)
(1 − xd)m0i≤ ρ0k
if QGi6= 0, ∀i ∈ k, ∀k (10p)
x1im1i
≤ ρ1k∀i ∈ k, ∀k (10q)
x2im2i
≤ ρ2k∀i ∈ k, ∀k (10r)
x3im3i
≤ ρ3k∀i ∈ k, ∀k (10s)
wherem0i, m1i
, m2iandm3i
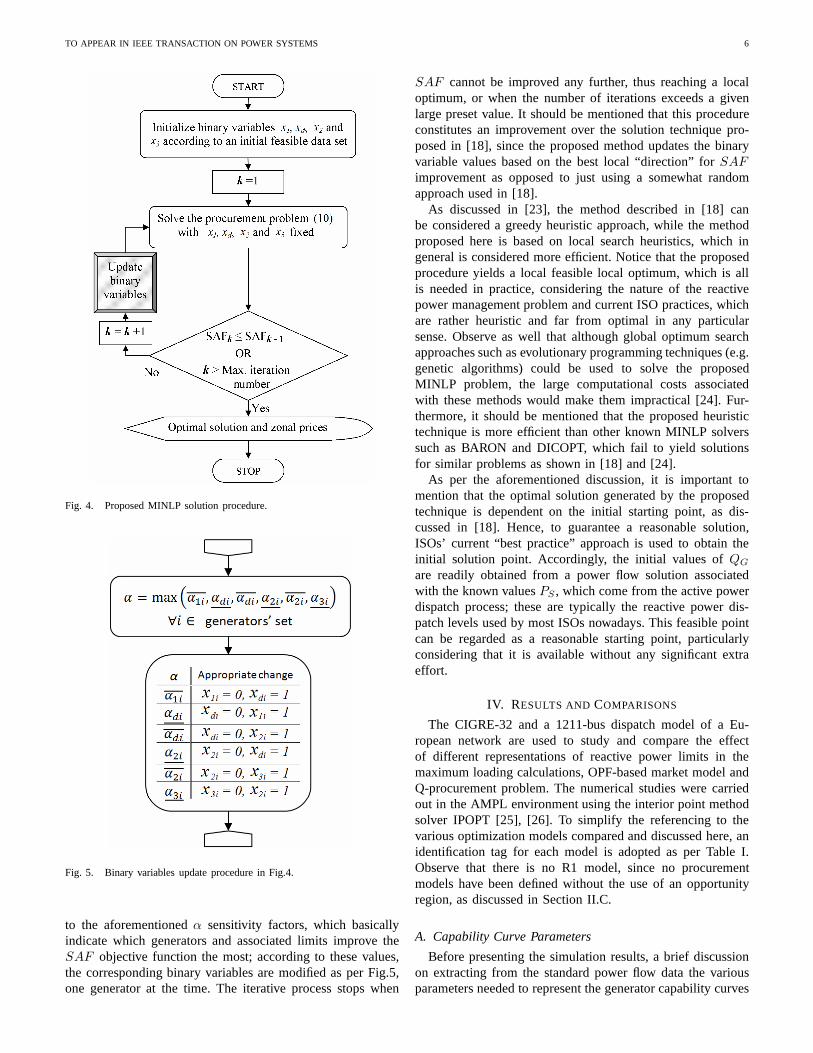
are theith generator bid offers,as defined in Fig.1, andxd is a binary variable associated withtheMandatory region depicted in this figure. The zonal pricingis modeled by (10p)-(10s). Note that (10k) guarantees thatonly one of four Regions I, II, III or Mandatory illustrated inFig.1 would be active at any given time. Observe that eventhough QA may change withVt, depending on the activepower dispatch level of the generator, from the discussionsin Section II.D with respect to Fig.2, generators will likelybe dispatched at nominal power (PSM ), and hence, basedon (4a), the value ofQA will not change considerably withthe generator’s terminal voltage; this assumption significantlysimplifies the model for computational purposes. Equations(10g)-(10j) are constraints representing the various reactivepower generating regions, and theQG max limit has beenreplaced by explicit limits onEf and Ia. The variablesα1,αd, αd, α2, α2 and α3 stand for the Lagrange multipliersassociated with the corresponding constraints. These variablesrepresent the sensitivity ofSAF with respect to the associatedlimits; for instance,α2 yields the sensitivity ofSAF withrespect toQG as it “moves” from Region II into Region III.These sensitivity factors are used to turn this MINLP probleminto a series of NLP problems, as explained next.
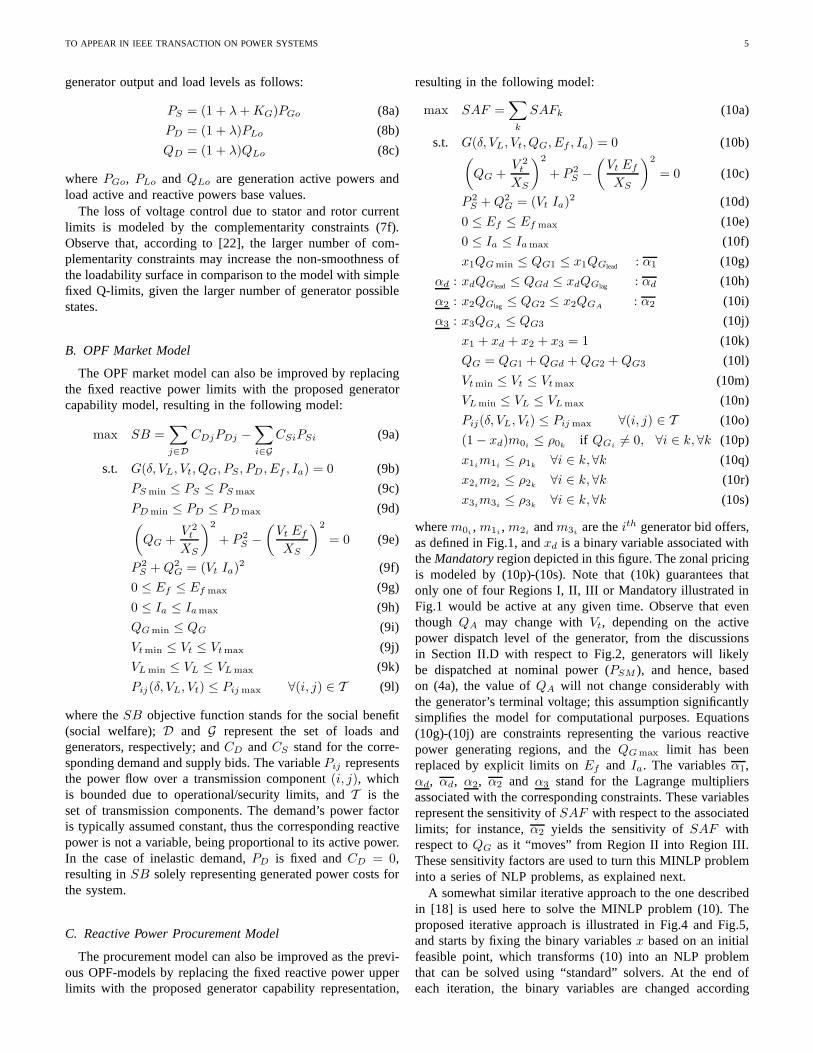
A somewhat similar iterative approach to the one describedin [18] is used here to solve the MINLP problem (10). Theproposed iterative approach is illustrated in Fig.4 and Fig.5,and starts by fixing the binary variablesx based on an initialfeasible point, which transforms (10) into an NLP problemthat can be solved using “standard” solvers. At the end ofeach iteration, the binary variables are changed according
TO APPEAR IN IEEE TRANSACTION ON POWER SYSTEMS 6
Fig. 4. Proposed MINLP solution procedure.
Fig. 5. Binary variables update procedure in Fig.4.
to the aforementionedα sensitivity factors, which basicallyindicate which generators and associated limits improve theSAF objective function the most; according to these values,the corresponding binary variables are modified as per Fig.5,one generator at the time. The iterative process stops when
SAF cannot be improved any further, thus reaching a localoptimum, or when the number of iterations exceeds a givenlarge preset value. It should be mentioned that this procedureconstitutes an improvement over the solution technique pro-posed in [18], since the proposed method updates the binaryvariable values based on the best local “direction” forSAF
improvement as opposed to just using a somewhat randomapproach used in [18].
As discussed in [23], the method described in [18] canbe considered a greedy heuristic approach, while the methodproposed here is based on local search heuristics, which ingeneral is considered more efficient. Notice that the proposedprocedure yields a local feasible local optimum, which is allis needed in practice, considering the nature of the reactivepower management problem and current ISO practices, whichare rather heuristic and far from optimal in any particularsense. Observe as well that although global optimum searchapproaches such as evolutionary programming techniques (e.g.genetic algorithms) could be used to solve the proposedMINLP problem, the large computational costs associatedwith these methods would make them impractical [24]. Fur-thermore, it should be mentioned that the proposed heuristictechnique is more efficient than other known MINLP solverssuch as BARON and DICOPT, which fail to yield solutionsfor similar problems as shown in [18] and [24].
As per the aforementioned discussion, it is important tomention that the optimal solution generated by the proposedtechnique is dependent on the initial starting point, as dis-cussed in [18]. Hence, to guarantee a reasonable solution,ISOs’ current “best practice” approach is used to obtain theinitial solution point. Accordingly, the initial values ofQG
are readily obtained from a power flow solution associatedwith the known valuesPS , which come from the active powerdispatch process; these are typically the reactive power dis-patch levels used by most ISOs nowadays. This feasible pointcan be regarded as a reasonable starting point, particularlyconsidering that it is available without any significant extraeffort.
IV. RESULTS AND COMPARISONS
The CIGRE-32 and a 1211-bus dispatch model of a Eu-ropean network are used to study and compare the effectof different representations of reactive power limits in themaximum loading calculations, OPF-based market model andQ-procurement problem. The numerical studies were carriedout in the AMPL environment using the interior point methodsolver IPOPT [25], [26]. To simplify the referencing to thevarious optimization models compared and discussed here, anidentification tag for each model is adopted as per Table I.Observe that there is no R1 model, since no procurementmodels have been defined without the use of an opportunityregion, as discussed in Section II.C.
A. Capability Curve Parameters
Before presenting the simulation results, a brief discussionon extracting from the standard power flow data the variousparameters needed to represent the generator capability curves
TO APPEAR IN IEEE TRANSACTION ON POWER SYSTEMS 7
TABLE IMODEL TAGS
OPF Type Q-limits Representation Tag
Loadability Calc.Simple Fixed
(3)(7)
L1L2L3
Energy AuctionSimple Fixed
(3)(9)
M1M2M3
Reactive Power Proc.(3)(10)
R2R3
is presented first, so that the data is consistent and thecomparisons are meaningful. Thus, three generator parameters,XS , Ia max andEf max, are required; however, the values ofthese parameters usually are not provided in typical power-flow data sets. Hence, these parameter values need to bedetermined from the available data, considering the generators’rated values.
A generator capability is the highest acceptable continuousloading in MVA (apparent power) under specified conditionsof operation. For a generator operated at rated voltage, fre-quency and coolant conditions, its capability is equal to theoutput rating [27], [28]. Therefore, assuming that the coolingsystem and frequency are fixed at their rated values, thegenerated rated values are taken to be the values providedin the power flow data, which correspond to point M in Fig.2[21]. Hence, the rated MVA of a specific machine is assumedto be given by:
SGM=
√
P 2
SM+ Q2
GM. (11)
whereQGMcorresponds, as mentioned in Section II.D, to the
maximum reactive power in the power flow data.A typical value for the synchronous reactance of a generator,
XG, usually lies in the range0.6 p.u. to 1.5 p.u., in thegenerator’s own base. Hence, it is assumed here thatXG = 1p.u., which allows to readily obtain the required values ofXS
as follows:
XS =
(
SB
SGM
) (
VG
VB
)2
. (12)
where the subscriptsB refers to the system base values, andVG stands for the generator’s base voltage, which is typicallythe same asVB .
The maximum stator current of a generator is obtained bydividing its rated apparent power valueSGM
by its ratedterminal voltage [27], [28]. Since, the value ofVto is typicallyprovided as part of the generator’s parameters in the powerflow data, the value ofIa max in p.u. for a given generatormay be calculated as follows:
Ia max =SGM
Vto
. (13)
The generator’s maximum excitation voltageEf max may thenbe calculated as follows:
Ef max =XS
Vto
√
(
QGM+
V 2to
XS
)2
+ P 2
SM. (14)
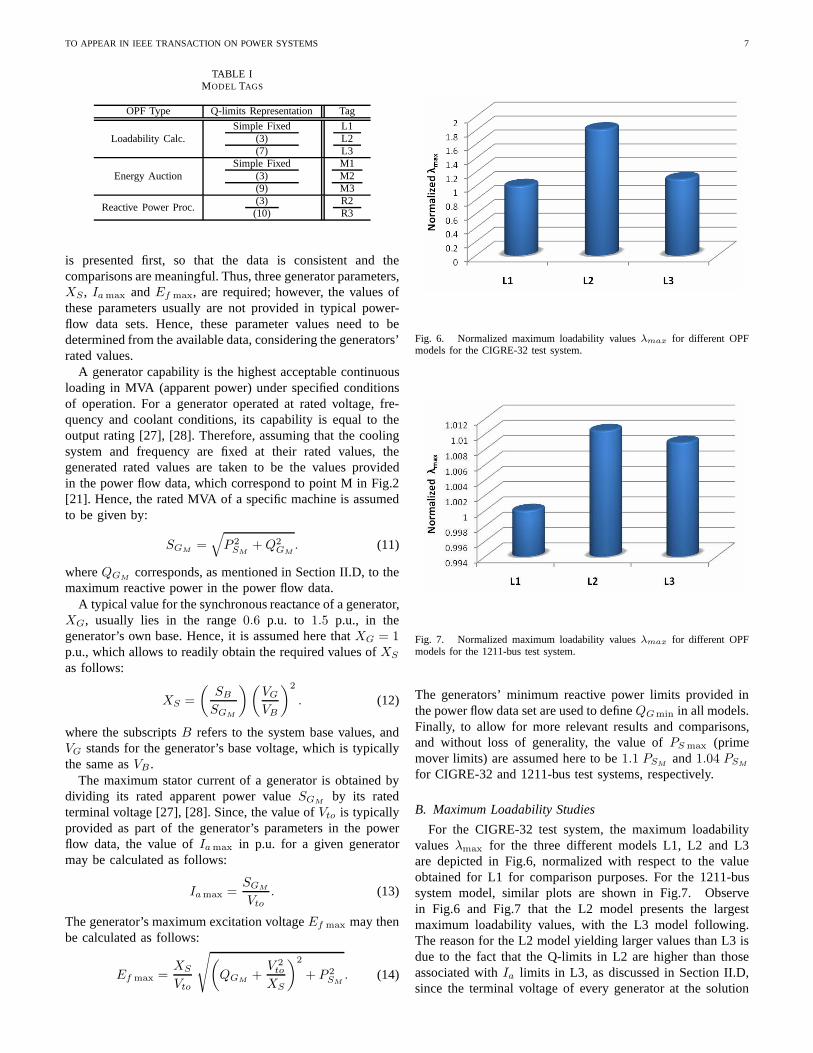
Fig. 6. Normalized maximum loadability valuesλmax for different OPFmodels for the CIGRE-32 test system.
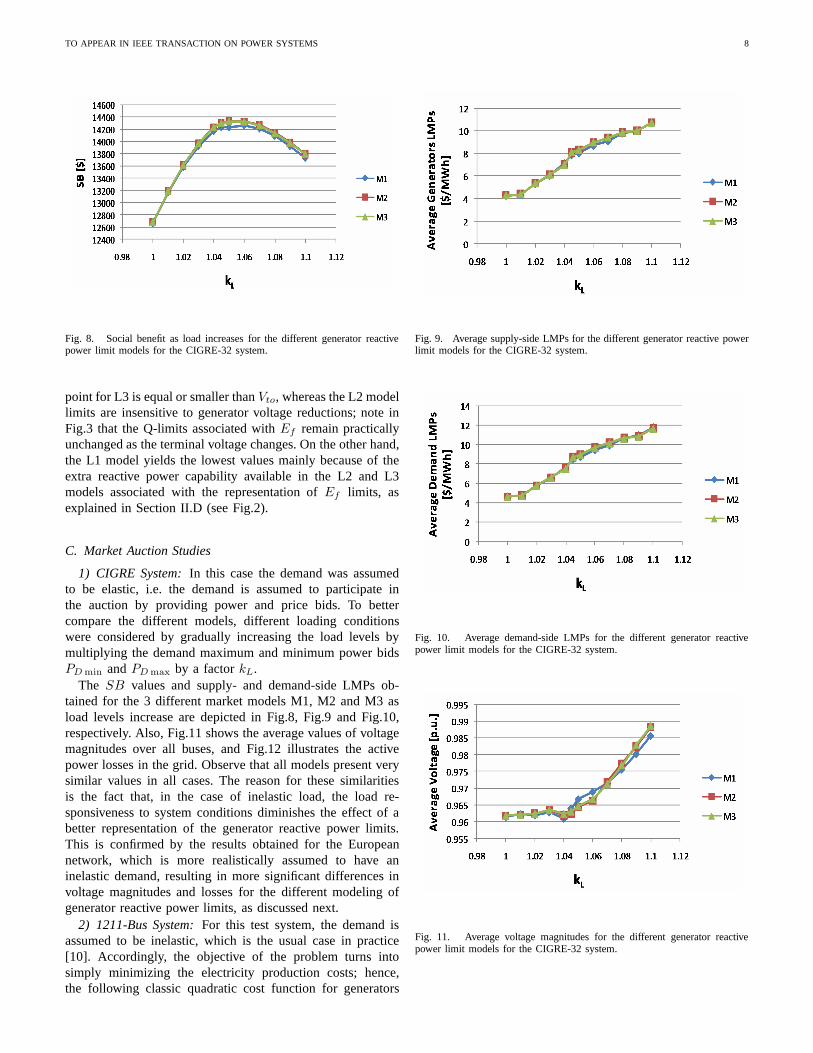
Fig. 7. Normalized maximum loadability valuesλmax for different OPFmodels for the 1211-bus test system.
The generators’ minimum reactive power limits provided inthe power flow data set are used to defineQGmin in all models.Finally, to allow for more relevant results and comparisons,and without loss of generality, the value ofPS max (primemover limits) are assumed here to be1.1 PSM
and1.04 PSM
for CIGRE-32 and 1211-bus test systems, respectively.
B. Maximum Loadability Studies
For the CIGRE-32 test system, the maximum loadabilityvaluesλmax for the three different models L1, L2 and L3are depicted in Fig.6, normalized with respect to the valueobtained for L1 for comparison purposes. For the 1211-bussystem model, similar plots are shown in Fig.7. Observein Fig.6 and Fig.7 that the L2 model presents the largestmaximum loadability values, with the L3 model following.The reason for the L2 model yielding larger values than L3 isdue to the fact that the Q-limits in L2 are higher than thoseassociated withIa limits in L3, as discussed in Section II.D,since the terminal voltage of every generator at the solution
TO APPEAR IN IEEE TRANSACTION ON POWER SYSTEMS 8
Fig. 8. Social benefit as load increases for the different generator reactivepower limit models for the CIGRE-32 system.
point for L3 is equal or smaller thanVto, whereas the L2 modellimits are insensitive to generator voltage reductions; note inFig.3 that the Q-limits associated withEf remain practicallyunchanged as the terminal voltage changes. On the other hand,the L1 model yields the lowest values mainly because of theextra reactive power capability available in the L2 and L3models associated with the representation ofEf limits, asexplained in Section II.D (see Fig.2).
C. Market Auction Studies
1) CIGRE System: In this case the demand was assumedto be elastic, i.e. the demand is assumed to participate inthe auction by providing power and price bids. To bettercompare the different models, different loading conditionswere considered by gradually increasing the load levels bymultiplying the demand maximum and minimum power bidsPD min andPD max by a factorkL.
The SB values and supply- and demand-side LMPs ob-tained for the 3 different market models M1, M2 and M3 asload levels increase are depicted in Fig.8, Fig.9 and Fig.10,respectively. Also, Fig.11 shows the average values of voltagemagnitudes over all buses, and Fig.12 illustrates the activepower losses in the grid. Observe that all models present verysimilar values in all cases. The reason for these similaritiesis the fact that, in the case of inelastic load, the load re-sponsiveness to system conditions diminishes the effect ofabetter representation of the generator reactive power limits.This is confirmed by the results obtained for the Europeannetwork, which is more realistically assumed to have aninelastic demand, resulting in more significant differences involtage magnitudes and losses for the different modeling ofgenerator reactive power limits, as discussed next.
2) 1211-Bus System: For this test system, the demand isassumed to be inelastic, which is the usual case in practice[10]. Accordingly, the objective of the problem turns intosimply minimizing the electricity production costs; hence,the following classic quadratic cost function for generators
Fig. 9. Average supply-side LMPs for the different generator reactive powerlimit models for the CIGRE-32 system.
Fig. 10. Average demand-side LMPs for the different generator reactivepower limit models for the CIGRE-32 system.
Fig. 11. Average voltage magnitudes for the different generator reactivepower limit models for the CIGRE-32 system.
TO APPEAR IN IEEE TRANSACTION ON POWER SYSTEMS 9
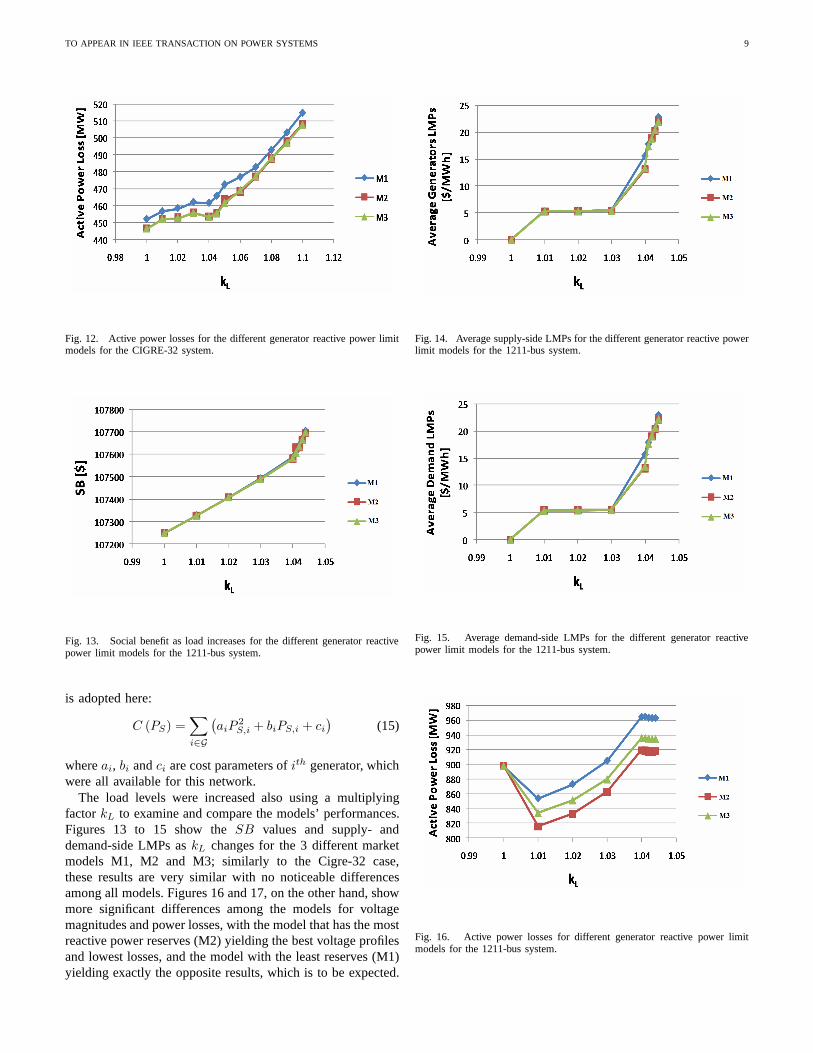
Fig. 12. Active power losses for the different generator reactive power limitmodels for the CIGRE-32 system.
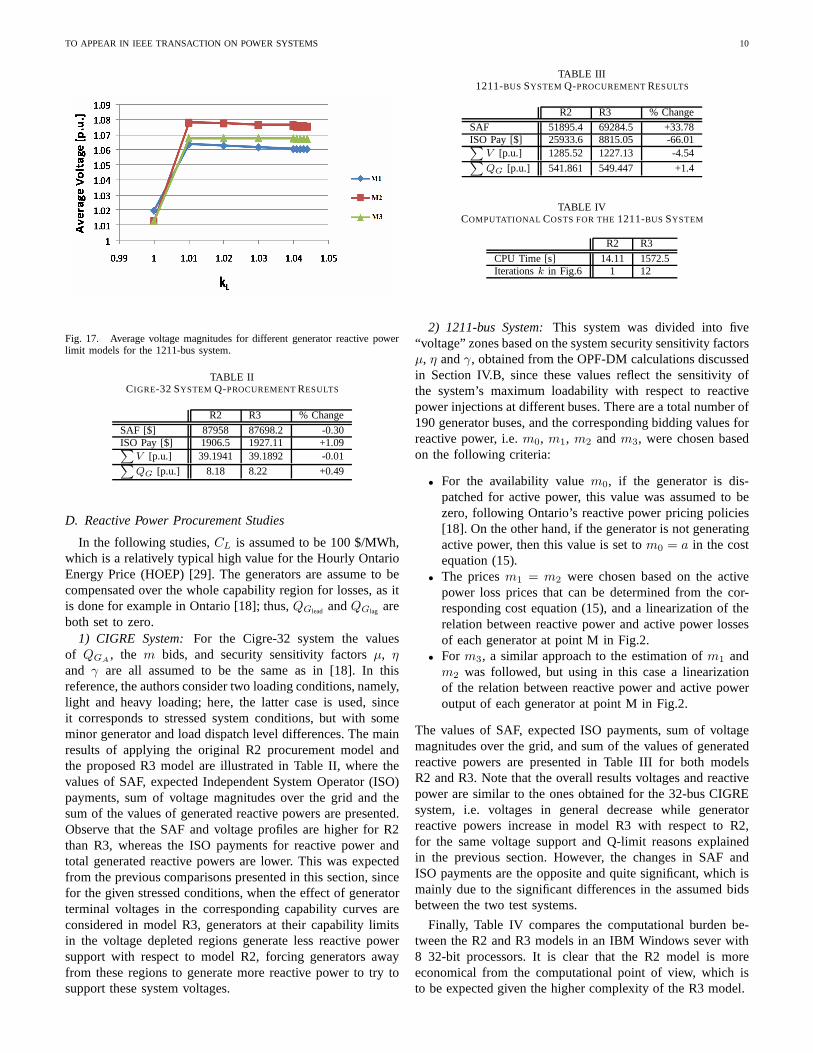
Fig. 13. Social benefit as load increases for the different generator reactivepower limit models for the 1211-bus system.
is adopted here:
C (PS) =∑
i∈G
(
aiP2
S,i + biPS,i + ci
)
(15)
whereai, bi andci are cost parameters ofith generator, whichwere all available for this network.
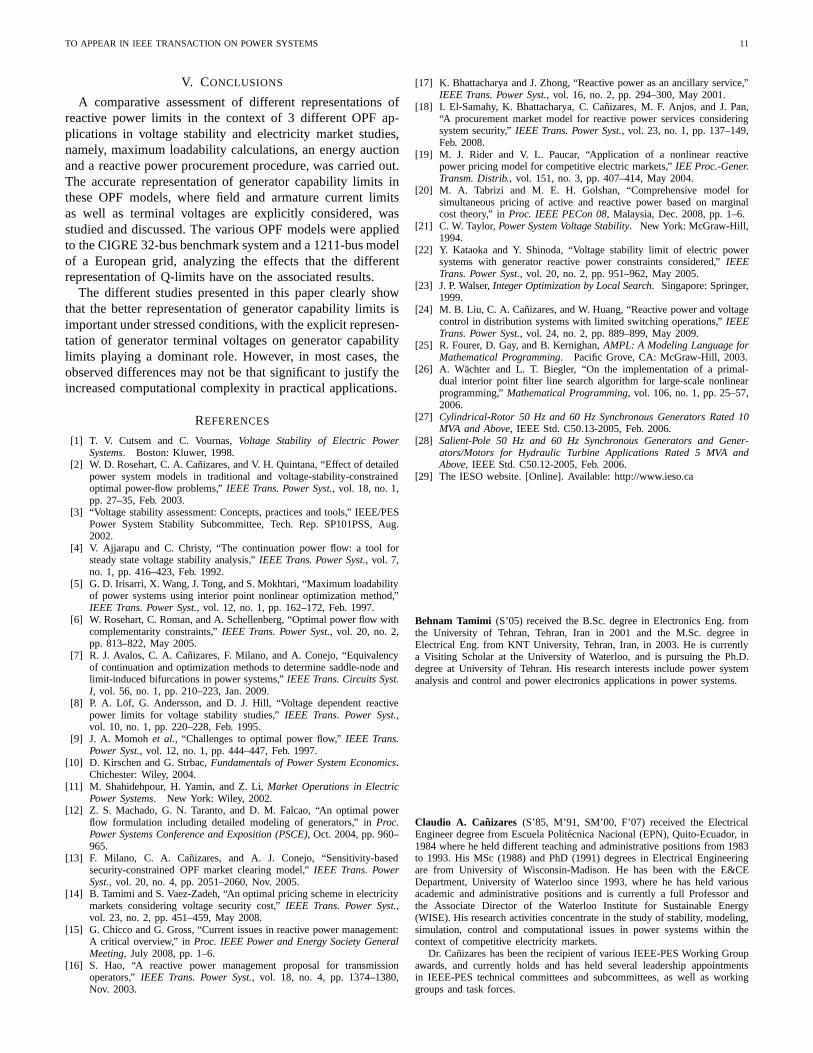
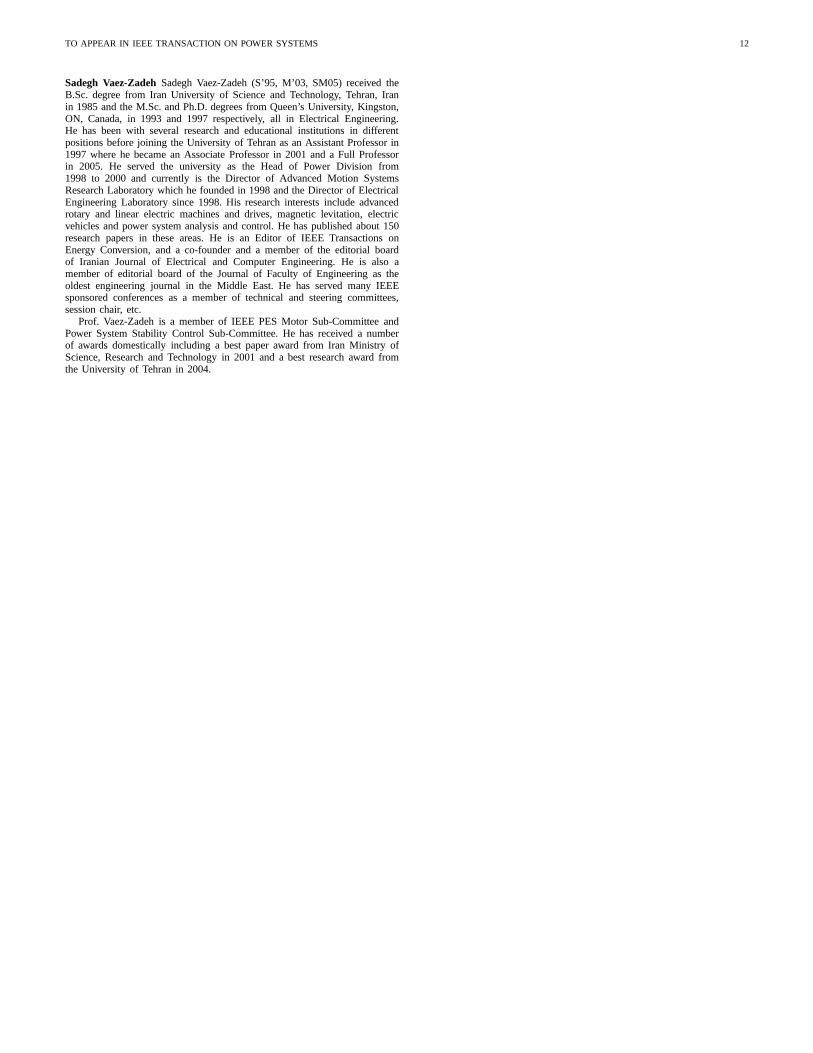
The load levels were increased also using a multiplyingfactorkL to examine and compare the models’ performances.Figures 13 to 15 show theSB values and supply- anddemand-side LMPs askL changes for the 3 different marketmodels M1, M2 and M3; similarly to the Cigre-32 case,these results are very similar with no noticeable differencesamong all models. Figures 16 and 17, on the other hand, showmore significant differences among the models for voltagemagnitudes and power losses, with the model that has the mostreactive power reserves (M2) yielding the best voltage profilesand lowest losses, and the model with the least reserves (M1)yielding exactly the opposite results, which is to be expected.
Fig. 14. Average supply-side LMPs for the different generator reactive powerlimit models for the 1211-bus system.
Fig. 15. Average demand-side LMPs for the different generator reactivepower limit models for the 1211-bus system.
Fig. 16. Active power losses for different generator reactive power limitmodels for the 1211-bus system.
TO APPEAR IN IEEE TRANSACTION ON POWER SYSTEMS 10
Fig. 17. Average voltage magnitudes for different generator reactive powerlimit models for the 1211-bus system.
TABLE IICIGRE-32 SYSTEM Q-PROCUREMENTRESULTS
R2 R3 % Change
SAF [$] 87958 87698.2 -0.30ISO Pay [$] 1906.5 1927.11 +1.09∑
V [p.u.] 39.1941 39.1892 -0.01∑
QG [p.u.] 8.18 8.22 +0.49
D. Reactive Power Procurement Studies
In the following studies,CL is assumed to be 100 $/MWh,which is a relatively typical high value for the Hourly OntarioEnergy Price (HOEP) [29]. The generators are assume to becompensated over the whole capability region for losses, asitis done for example in Ontario [18]; thus,QGlead andQGlag areboth set to zero.
1) CIGRE System: For the Cigre-32 system the valuesof QGA
, the m bids, and security sensitivity factorsµ, η
and γ are all assumed to be the same as in [18]. In thisreference, the authors consider two loading conditions, namely,light and heavy loading; here, the latter case is used, sinceit corresponds to stressed system conditions, but with someminor generator and load dispatch level differences. The mainresults of applying the original R2 procurement model andthe proposed R3 model are illustrated in Table II, where thevalues of SAF, expected Independent System Operator (ISO)payments, sum of voltage magnitudes over the grid and thesum of the values of generated reactive powers are presented.Observe that the SAF and voltage profiles are higher for R2than R3, whereas the ISO payments for reactive power andtotal generated reactive powers are lower. This was expectedfrom the previous comparisons presented in this section, sincefor the given stressed conditions, when the effect of generatorterminal voltages in the corresponding capability curves areconsidered in model R3, generators at their capability limitsin the voltage depleted regions generate less reactive powersupport with respect to model R2, forcing generators awayfrom these regions to generate more reactive power to try tosupport these system voltages.
TABLE III1211-BUS SYSTEM Q-PROCUREMENTRESULTS
R2 R3 % Change
SAF 51895.4 69284.5 +33.78ISO Pay [$] 25933.6 8815.05 -66.01∑
V [p.u.] 1285.52 1227.13 -4.54∑
QG [p.u.] 541.861 549.447 +1.4
TABLE IVCOMPUTATIONAL COSTS FOR THE1211-BUS SYSTEM
R2 R3
CPU Time [s] 14.11 1572.5Iterationsk in Fig.6 1 12
2) 1211-bus System: This system was divided into five“voltage” zones based on the system security sensitivity factorsµ, η andγ, obtained from the OPF-DM calculations discussedin Section IV.B, since these values reflect the sensitivity ofthe system’s maximum loadability with respect to reactivepower injections at different buses. There are a total number of190 generator buses, and the corresponding bidding values forreactive power, i.e.m0, m1, m2 andm3, were chosen basedon the following criteria:
• For the availability valuem0, if the generator is dis-patched for active power, this value was assumed to bezero, following Ontario’s reactive power pricing policies[18]. On the other hand, if the generator is not generatingactive power, then this value is set tom0 = a in the costequation (15).
• The pricesm1 = m2 were chosen based on the activepower loss prices that can be determined from the cor-responding cost equation (15), and a linearization of therelation between reactive power and active power lossesof each generator at point M in Fig.2.
• For m3, a similar approach to the estimation ofm1 andm2 was followed, but using in this case a linearizationof the relation between reactive power and active poweroutput of each generator at point M in Fig.2.
The values of SAF, expected ISO payments, sum of voltagemagnitudes over the grid, and sum of the values of generatedreactive powers are presented in Table III for both modelsR2 and R3. Note that the overall results voltages and reactivepower are similar to the ones obtained for the 32-bus CIGREsystem, i.e. voltages in general decrease while generatorreactive powers increase in model R3 with respect to R2,for the same voltage support and Q-limit reasons explainedin the previous section. However, the changes in SAF andISO payments are the opposite and quite significant, which ismainly due to the significant differences in the assumed bidsbetween the two test systems.
Finally, Table IV compares the computational burden be-tween the R2 and R3 models in an IBM Windows sever with8 32-bit processors. It is clear that the R2 model is moreeconomical from the computational point of view, which isto be expected given the higher complexity of the R3 model.
TO APPEAR IN IEEE TRANSACTION ON POWER SYSTEMS 11
V. CONCLUSIONS
A comparative assessment of different representations ofreactive power limits in the context of 3 different OPF ap-plications in voltage stability and electricity market studies,namely, maximum loadability calculations, an energy auctionand a reactive power procurement procedure, was carried out.The accurate representation of generator capability limits inthese OPF models, where field and armature current limitsas well as terminal voltages are explicitly considered, wasstudied and discussed. The various OPF models were appliedto the CIGRE 32-bus benchmark system and a 1211-bus modelof a European grid, analyzing the effects that the differentrepresentation of Q-limits have on the associated results.
The different studies presented in this paper clearly showthat the better representation of generator capability limits isimportant under stressed conditions, with the explicit represen-tation of generator terminal voltages on generator capabilitylimits playing a dominant role. However, in most cases, theobserved differences may not be that significant to justify theincreased computational complexity in practical applications.
REFERENCES
[1] T. V. Cutsem and C. Vournas,Voltage Stability of Electric PowerSystems. Boston: Kluwer, 1998.
[2] W. D. Rosehart, C. A. Canizares, and V. H. Quintana, “Effect of detailedpower system models in traditional and voltage-stability-constrainedoptimal power-flow problems,”IEEE Trans. Power Syst., vol. 18, no. 1,pp. 27–35, Feb. 2003.
[3] “Voltage stability assessment: Concepts, practices and tools,” IEEE/PESPower System Stability Subcommittee, Tech. Rep. SP101PSS,Aug.2002.
[4] V. Ajjarapu and C. Christy, “The continuation power flow:a tool forsteady state voltage stability analysis,”IEEE Trans. Power Syst., vol. 7,no. 1, pp. 416–423, Feb. 1992.
[5] G. D. Irisarri, X. Wang, J. Tong, and S. Mokhtari, “Maximum loadabilityof power systems using interior point nonlinear optimization method,”IEEE Trans. Power Syst., vol. 12, no. 1, pp. 162–172, Feb. 1997.
[6] W. Rosehart, C. Roman, and A. Schellenberg, “Optimal power flow withcomplementarity constraints,”IEEE Trans. Power Syst., vol. 20, no. 2,pp. 813–822, May 2005.
[7] R. J. Avalos, C. A. Canizares, F. Milano, and A. Conejo, “Equivalencyof continuation and optimization methods to determine saddle-node andlimit-induced bifurcations in power systems,”IEEE Trans. Circuits Syst.I, vol. 56, no. 1, pp. 210–223, Jan. 2009.
[8] P. A. Lof, G. Andersson, and D. J. Hill, “Voltage dependent reactivepower limits for voltage stability studies,”IEEE Trans. Power Syst.,vol. 10, no. 1, pp. 220–228, Feb. 1995.
[9] J. A. Momoh et al., “Challenges to optimal power flow,”IEEE Trans.Power Syst., vol. 12, no. 1, pp. 444–447, Feb. 1997.
[10] D. Kirschen and G. Strbac,Fundamentals of Power System Economics.Chichester: Wiley, 2004.
[11] M. Shahidehpour, H. Yamin, and Z. Li,Market Operations in ElectricPower Systems. New York: Wiley, 2002.
[12] Z. S. Machado, G. N. Taranto, and D. M. Falcao, “An optimal powerflow formulation including detailed modeling of generators,” in Proc.Power Systems Conference and Exposition (PSCE), Oct. 2004, pp. 960–965.
[13] F. Milano, C. A. Canizares, and A. J. Conejo, “Sensitivity-basedsecurity-constrained OPF market clearing model,”IEEE Trans. PowerSyst., vol. 20, no. 4, pp. 2051–2060, Nov. 2005.
[14] B. Tamimi and S. Vaez-Zadeh, “An optimal pricing schemein electricitymarkets considering voltage security cost,”IEEE Trans. Power Syst.,vol. 23, no. 2, pp. 451–459, May 2008.
[15] G. Chicco and G. Gross, “Current issues in reactive power management:A critical overview,” in Proc. IEEE Power and Energy Society GeneralMeeting, July 2008, pp. 1–6.
[16] S. Hao, “A reactive power management proposal for transmissionoperators,”IEEE Trans. Power Syst., vol. 18, no. 4, pp. 1374–1380,Nov. 2003.
[17] K. Bhattacharya and J. Zhong, “Reactive power as an ancillary service,”IEEE Trans. Power Syst., vol. 16, no. 2, pp. 294–300, May 2001.
[18] I. El-Samahy, K. Bhattacharya, C. Canizares, M. F. Anjos, and J. Pan,“A procurement market model for reactive power services consideringsystem security,”IEEE Trans. Power Syst., vol. 23, no. 1, pp. 137–149,Feb. 2008.
[19] M. J. Rider and V. L. Paucar, “Application of a nonlinearreactivepower pricing model for competitive electric markets,”IEE Proc.-Gener.Transm. Distrib., vol. 151, no. 3, pp. 407–414, May 2004.
[20] M. A. Tabrizi and M. E. H. Golshan, “Comprehensive modelforsimultaneous pricing of active and reactive power based on marginalcost theory,” inProc. IEEE PECon 08, Malaysia, Dec. 2008, pp. 1–6.
[21] C. W. Taylor,Power System Voltage Stability. New York: McGraw-Hill,1994.
[22] Y. Kataoka and Y. Shinoda, “Voltage stability limit of electric powersystems with generator reactive power constraints considered,” IEEETrans. Power Syst., vol. 20, no. 2, pp. 951–962, May 2005.
[23] J. P. Walser,Integer Optimization by Local Search. Singapore: Springer,1999.
[24] M. B. Liu, C. A. Canizares, and W. Huang, “Reactive power and voltagecontrol in distribution systems with limited switching operations,” IEEETrans. Power Syst., vol. 24, no. 2, pp. 889–899, May 2009.
[25] R. Fourer, D. Gay, and B. Kernighan,AMPL: A Modeling Language forMathematical Programming. Pacific Grove, CA: McGraw-Hill, 2003.
[26] A. Wachter and L. T. Biegler, “On the implementation ofa primal-dual interior point filter line search algorithm for large-scale nonlinearprogramming,”Mathematical Programming, vol. 106, no. 1, pp. 25–57,2006.
[27] Cylindrical-Rotor 50 Hz and 60 Hz Synchronous Generators Rated 10MVA and Above, IEEE Std. C50.13-2005, Feb. 2006.
[28] Salient-Pole 50 Hz and 60 Hz Synchronous Generators and Gener-ators/Motors for Hydraulic Turbine Applications Rated 5 MVA andAbove, IEEE Std. C50.12-2005, Feb. 2006.
[29] The IESO website. [Online]. Available: http://www.ieso.ca
Behnam Tamimi (S’05) received the B.Sc. degree in Electronics Eng. fromthe University of Tehran, Tehran, Iran in 2001 and the M.Sc. degree inElectrical Eng. from KNT University, Tehran, Iran, in 2003.He is currentlya Visiting Scholar at the University of Waterloo, and is pursuing the Ph.D.degree at University of Tehran. His research interests include power systemanalysis and control and power electronics applications inpower systems.
Claudio A. Canizares (S’85, M’91, SM’00, F’07) received the ElectricalEngineer degree from Escuela Politecnica Nacional (EPN),Quito-Ecuador, in1984 where he held different teaching and administrative positions from 1983to 1993. His MSc (1988) and PhD (1991) degrees in Electrical Engineeringare from University of Wisconsin-Madison. He has been with the E&CEDepartment, University of Waterloo since 1993, where he hasheld variousacademic and administrative positions and is currently a full Professor andthe Associate Director of the Waterloo Institute for Sustainable Energy(WISE). His research activities concentrate in the study ofstability, modeling,simulation, control and computational issues in power systems within thecontext of competitive electricity markets.
Dr. Canizares has been the recipient of various IEEE-PES Working Groupawards, and currently holds and has held several leadershipappointmentsin IEEE-PES technical committees and subcommittees, as well as workinggroups and task forces.
TO APPEAR IN IEEE TRANSACTION ON POWER SYSTEMS 12
Sadegh Vaez-ZadehSadegh Vaez-Zadeh (S’95, M’03, SM05) received theB.Sc. degree from Iran University of Science and Technology, Tehran, Iranin 1985 and the M.Sc. and Ph.D. degrees from Queen’s University, Kingston,ON, Canada, in 1993 and 1997 respectively, all in ElectricalEngineering.He has been with several research and educational institutions in differentpositions before joining the University of Tehran as an Assistant Professor in1997 where he became an Associate Professor in 2001 and a FullProfessorin 2005. He served the university as the Head of Power Division from1998 to 2000 and currently is the Director of Advanced MotionSystemsResearch Laboratory which he founded in 1998 and the Director of ElectricalEngineering Laboratory since 1998. His research interestsinclude advancedrotary and linear electric machines and drives, magnetic levitation, electricvehicles and power system analysis and control. He has published about 150research papers in these areas. He is an Editor of IEEE Transactions onEnergy Conversion, and a co-founder and a member of the editorial boardof Iranian Journal of Electrical and Computer Engineering.He is also amember of editorial board of the Journal of Faculty of Engineering as theoldest engineering journal in the Middle East. He has servedmany IEEEsponsored conferences as a member of technical and steeringcommittees,session chair, etc.
Prof. Vaez-Zadeh is a member of IEEE PES Motor Sub-CommitteeandPower System Stability Control Sub-Committee. He has received a numberof awards domestically including a best paper award from Iran Ministry ofScience, Research and Technology in 2001 and a best researchaward fromthe University of Tehran in 2004.