tnt express capital markets day analyst presentation nl australia & pacific rest of asia india...
TRANSCRIPT

11
Agenda
Opening 13:00 Antony Burgmans
Express investment opportunity
Marie-Christine LombardEMEA
Americas
Aspac
International and SME sales Jan Willem Breen
Aspac Michael Drake
Short break 14:30
Finance 14:50 Bernard Bot
Q&A 15:15
Closing 16:00 Marie-Christine Lombard
Drinks – reception
TNT ExpressCapital Markets Day
Marie-Christine Lombard3 May 2011

33
TNT Express organisation
Supervisory Board
Mr A BurgmansChairman Mr T Gunning Ms M Scheltema Mr R King Mr S Levy Ms M Harris
Executive BoardMs MC Lombard
CEOMr B Bot
CFO
Management BoardMr JW Breen
Director Marketing & Sales
Ms C GoossensDirector Global
Operations
Mr G MasonICS Managing
Director
Mr S ScheersHR Director
Mr D BurtonRegional Managing
Director Northern Europe
Mr C DrenthenRegional Managing
Director SE and MEA
Mr M DrakeRegional Managing
Director ASPAC

44
Agenda
Express investment opportunity
EMEA
Americas
Aspac

5
TNT: leader in Europe, attractive growth options
Unique position in attractive Express market
• Large and growing Express market• Unique position TNT
Leader in Europe and MEA with significant upside potential
• Number 1 B2B Express player in Europe
• Track record of high margins
Positioned to leverage high-growth in emerging markets
• Number 1 China to Europe with dedicated fleet
• Leading presence in domestic emerging markets
High growth and high returns

6
Large and growing market benefiting TNT networks
Source: TNTNote: € 22 billion includes intercontinental; Aspac excludes €8 billion Japan
Revenuegrowth
Real GDPgrowth
South America
4
Aspac
8
EMEA
22
2.0 – 2.5x
Large market with leading presence TNT€ billion, 2009, B2B
TNT
Other
GrowingGDP multiple revenue growth – 2005 to 2010
Enablingleverage of
network economics

7
Global footprint TNT
OtherAmericas
Aspac
EMEA
0.40.5
1.74.5
Africa & ME Rest of Europe
Belgium
France
GermanyItaly
UK
NL
Australia & Pacific
Rest of Asia
India
Greater China
South & Middle America
Brazil
USA and Canada
Revenue contribution and headcount by segment and by country
Headcount
EMEA 36,184
Aspac 31,924
Americas 11,081
Other 4,047
(€ billion)

88
Unique position TNTWide product offer Broad geographic presence
Flexible cost model
Europe
Intercontinental
Emerging platforms
TNTOutsourced
Parcels
Spee
d
Weight
Express
EconomyExpress
Freight
Time certain/Next day
Day uncertain/Standard
Same day
Day certain/Expedited
1kg ~30 kg 1,000 kg
Customer-first focus

99
Number 1 Significant upside potential
Leading in Europe and MEA with significant upside potential
Note: 2001 – 2003 Express division restated for one-offs, from 2007 revenue at reported rates
2
4
6
8
10
12
14
10090807060504030201
Operating margin (%)
DPD/La Poste
8%
UPS9%
DHL15%
TNT
18%
Other 50%
Intra-Europe B2B Express 100% = € 19 billion (2009)
Medium term

10
Strong growth as first mover in emerging markets
#1 China to Europe
• Own-controlled Express uplifts • Seamless connectivity • Key sectors
Share of revenues China-to-Europe Express
Leading domestic positions
• Double-digit growth• Upgrading of delivery infrastructure• TNT first-mover advantage
DHL 31%
TNT 33%Other46%
100% = € 1.2 billion (2009)
Largest domestic operator with ~20% market share
Largest privately owned domestic network

1111
TNT’s global footprint
Americas
Aspac
EMEA
Other
Africa & ME Rest of Europe
Belgium
France
GermanyItaly
UK
NL
Australia & Pacific
Rest of Asia
India
Greater China
South & Middle America
Brazil
USA and Canada
Revenue contribution by segment and by country

1212
Unique geographic European footprint
8%9%
DPD/La PosteUPS
15% DHL
TNT
18%
Other 50%
B2B Express intra-Europe market share100% = € 19 billion (2009)
Iberia
0.2
EE
0.3
Nordics
0.3
I
0.6
BNL
0.7
F
0.7
G
0.8
UK
0.9
Revenues by country2010, € billion

1313
Leading European road and air networks
European road network European air network
• 39 countries• 16 road hubs • 85 international depots• Connecting 523 depots• 70% of customers by value can
be reached overnight by truck
• 46 planes• 65 airports• 19 countries• 635 flights per week• Late pick-up and early
next-day drop-off
Unique combination networks: Air / Road
International / Regional / Domestic

1414
Good growth prospects Europe
Europe growth
Organic
New initiatives
2.0 – 2.5
2.12.0 2.1
201420132012
Europe GDP forecasts*
x=
* Source: Economist Intelligence Unit
Express factor growth
• Value added solutions (VAS)• Parcels B2C• Freight
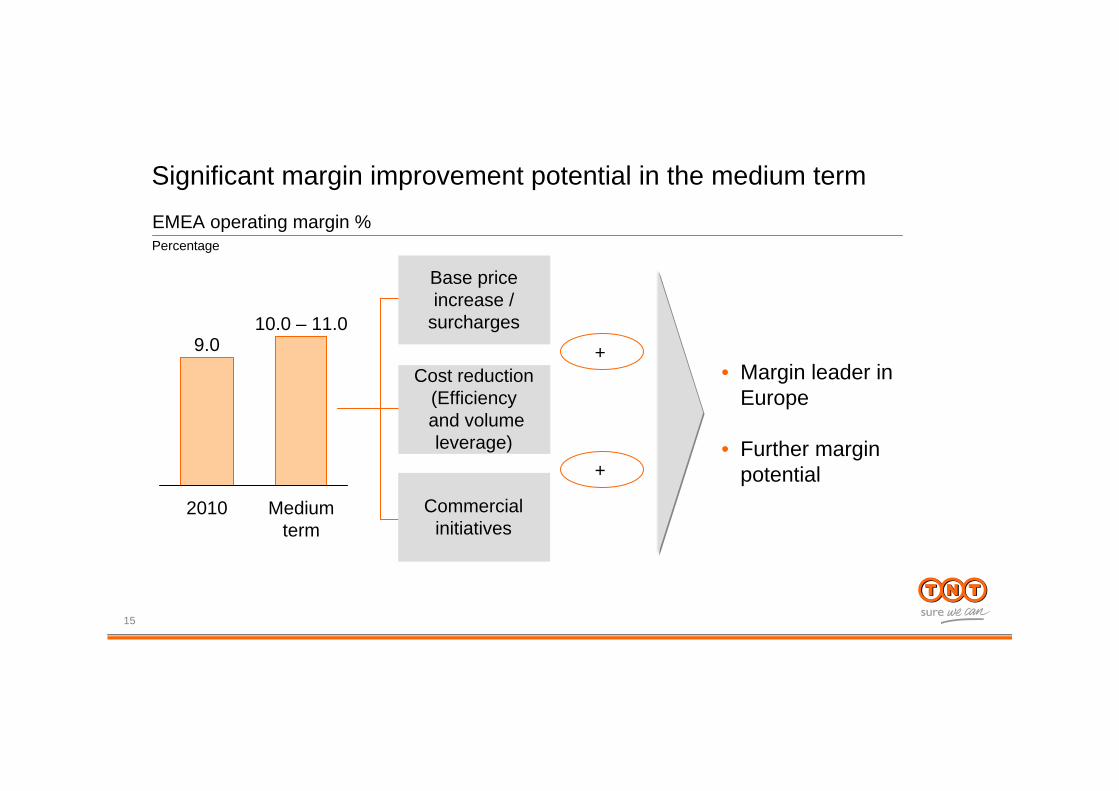
15
Base price increase /
surcharges
Significant margin improvement potential in the medium term
Medium term
10.0 – 11.0
2010
9.0 +
+
Cost reduction(Efficiencyand volume leverage)
Commercial initiatives
EMEA operating margin %Percentage
• Margin leader in Europe
• Further margin potential

1616
Base price increases and surcharge opportunitiesEMEA
Price Q1 2011 Objectives
International Express Positive
• Focus on increasing volumes• Application of surcharges
International Economy Above inflation
Further increase price given high demand/differentiated service
Domestic Some pressure Focus on most attractive accounts given solid growth

1717
Cost reductions to continue
Average cost per consignmentYoY growth %
Targets
-2
-10
32
2010200920082007
Local operations• LEAN depot and warehouse• PUD routing optimisation
Central operations• Capacity optimisation• HUB operations productivity
Indirect and other• Target indirect cost reduction

18
+
Commercial initiatives
Margins
+
Express Economy DomesticSolutions
Globalaccounts
Majoraccounts
SME
Solutions
Broadest product offering
Customer service

1919
TNT’s global footprint
Americas
Aspac
EMEA
Other
Australia & Pacific
Rest of Asia
India
Greater China
South & Middle America
Brazil
USA and Canada
Revenue contribution by segment and by country
Africa & ME Rest of Europe
Belgium
France
GermanyItaly
UK
NL

20
• Global customer demand• High growth market• Opportunity to leverage from domestic
position to intra-regional and intercontinental services
20
Brazil: strategic rationale
Other
79%
Integrators1%
TNT
20%
Domestic Brazil market share100% = ~€1.8 billion; domestic Express
• Combination of Mercúrio (acquired 2007) and Araçatuba (acquired 2009)
• 140 locations, ~8,000 employees, more than 3,000 vehicles
• Leading automation and track & trace technology
Current footprint
Mercúrio depots
Franchisees
Araçatuba depots
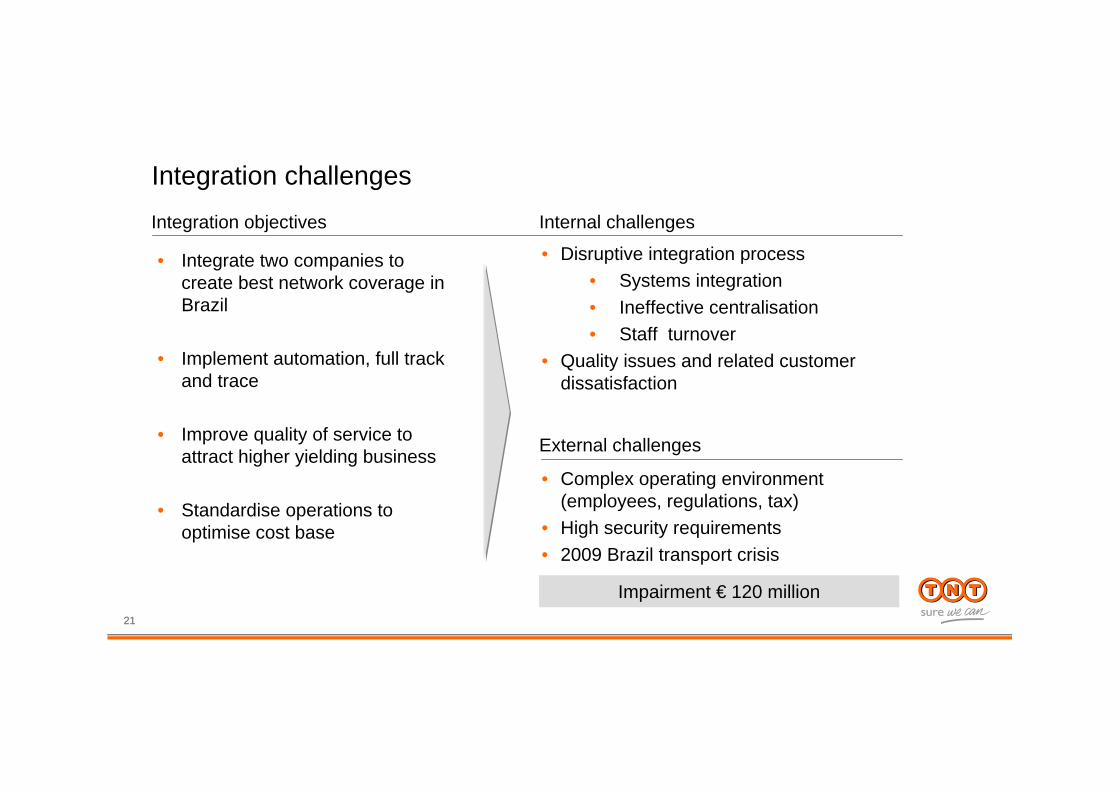
2121
Integration challengesIntegration objectives
• Integrate two companies to create best network coverage in Brazil
• Implement automation, full track and trace
• Improve quality of service to attract higher yielding business
• Standardise operations to optimise cost base
Internal challenges
External challenges
• Disruptive integration process• Systems integration• Ineffective centralisation• Staff turnover
• Quality issues and related customer dissatisfaction
• Complex operating environment (employees, regulations, tax)
• High security requirements• 2009 Brazil transport crisis
Impairment € 120 million

2222
Turnaround Brazil – target breakeven 2H 2012
Organisation Deliverable
• New, experienced leadership team in place since March, with local know-how
• New organisation structure around regional and depot management implemented
• Controls and systems adjusted to local controls• Cut indirect costs
• Service quality improvement
• Control
Commercial
• Stabilisation of top 25 customers• Sales drive focused on TNT major / global
accounts and local key customers
• Additional compatible volumes to fuel existing network
Operations
• Service quality target of >90% on-time for all customers
• Focus on absorbing volume loss
• Price increase opportunity
• Fewer claims
Full turn-aroundplan beingdeveloped
• Continuous monitoring

2323
TNT’s global footprint
Americas
Aspac
EMEA
Other
Australia & Pacific
Rest of Asia
India
Greater China
South & Middle America
Brazil
USA and Canada
Revenue contribution by segment and by country
Africa & ME Rest of Europe
Belgium
France
GermanyItaly
UK
NL

2424
Solid positioning Asia-PacificRevenue contribution 2010
Rest of AsiaAustralia & Pacific
Greater China
India
Total revenue € 1.6 billion (2010)China• International connection Europe• Differentiating domestic footprint
Australia• Leverage solid domestic position• Grow International share
India• International focus Europe and Asia• Domestic footprint (road and air)
Rest of Asia• Growth based on existing regional
and international connectivity

TNT ExpressCapital Markets Day
Jan Willem Breen3 May 2011

26
Marketing & Sales organisation
Globalaccounts
Majoraccounts
SME
Customer segments Sales channels
• Corporate and Global account management teams
• National account management teams
• Territory sales teams• Self-service e-sales
Central organisation
Ensure balanced growth
Indicative # of customers
40%
30%
30%
Revenues
• Marketing• Sales processes
and collaterals• Pricing• Product
management• Reporting

27 +
Commercial initiatives to improve yield and margins
Margins
+
Express Economy DomesticSolutions
Controlled growth especially in Domestic
Limited volume growth but focus on higher margin industry specific value added solutions
Express parcel growth to improve both product and customer mix
Globalaccounts
Majoraccounts
SME

28
Innovation in value added solutions
Lifestyle & Other
Healthcare
High tech
Automotive &Industrial
After-market /service logistics
• Last mile delivery
• Critical parts/FSL
• Innight delivery
• Replenishment
• Temperature controlled end-to-end shipping
• Hospital deliveries
Sector split of top 500 accountsEuropean revenues
• High-end B2C
• Multi-modal and direct solutions inbound Europe
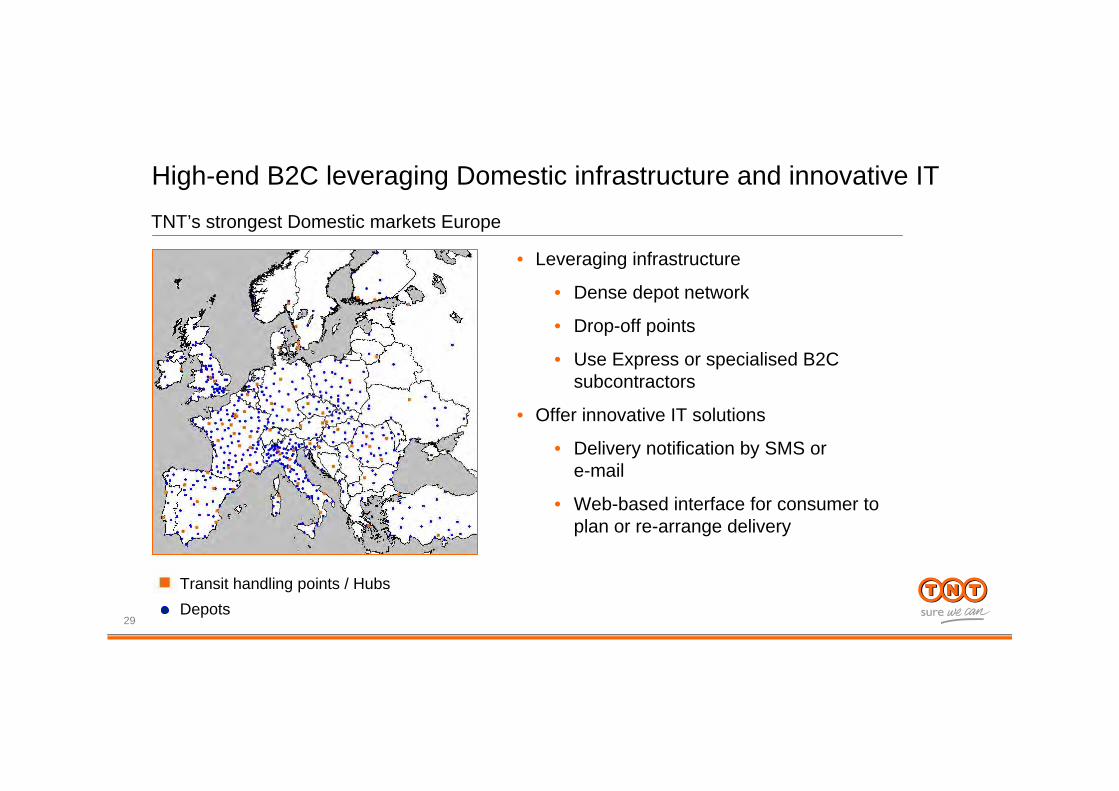
29
High-end B2C leveraging Domestic infrastructure and innovative IT
• Leveraging infrastructure
• Dense depot network
• Drop-off points
• Use Express or specialised B2C subcontractors
• Offer innovative IT solutions
• Delivery notification by SMS or e-mail
• Web-based interface for consumer to plan or re-arrange delivery
TNT’s strongest Domestic markets Europe
Transit handling points / HubsDepots

30
Leveraging our SME sales machine…
FieldSales
IndoorSales
888 940
25
Visits Calls
150
1.0
CallsVisits
6.2
44 weeks/year
ActivityMillion per year
European salesforceFTE
Actual activity levels# per week
x
x
Existing customers
1/3
Prospects
2/3
Target group
95% of TNT’s individual customers and > 40% of revenue

31
… to sell Express parcels to SMEs
• International express commission > 2x domestic
• Internal sales teamcompetition
• ‘Automatic’ Monthly Volume Discount
• Parcel acquisition tariff
• Campaign management system
• Automated activity scheduling
• Electronic salespresenter
• Express Import• 12:00 Express• Intercontinental
Sales incentives Sales systems
Pricing Direct marketing campaigns

Example – Express parcel booster programmeTarget annualised revenues
20,000 to 25,000 new traders
15 to 20 consignments per trader
More than € 100 average price per consignment
Significant annualised revenues (at very high margin)
x
x
=• Internal sales team competition
• Parcel acquisition tariff with introduction discount
Sales incentives
Pricing
32

TNT ExpressCapital Markets Day
Michael Drake3 May 2011

34
Number 1 Asia – Europe with dedicated fleet
34
SIN
PVGCKG
LGG
HKG
TNT proposition
• Reliable and consistent service – owned air assets
• End to end solution including customs clearance
• Complementary Europe air / road capabilities
• Global account management
• Migration of manufacturing to West (Chongqing)
3535
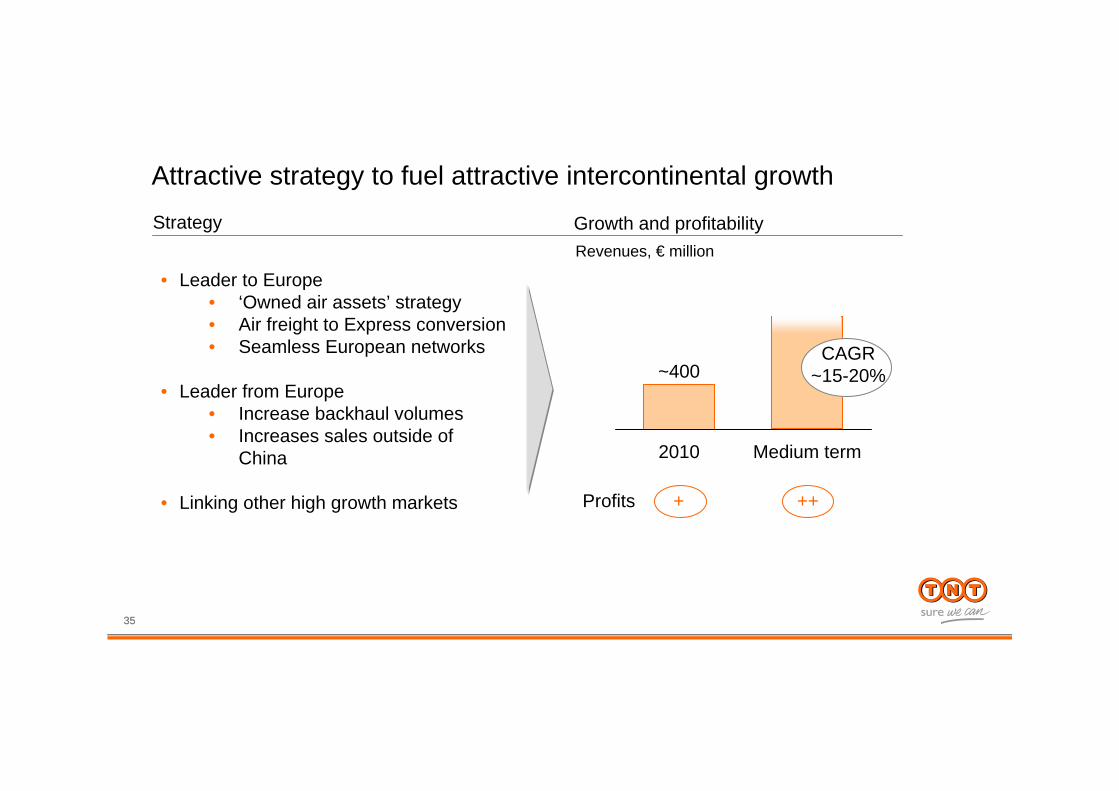
Attractive strategy to fuel attractive intercontinental growthStrategy Growth and profitability
Medium term2010
~400
• Leader to Europe• ‘Owned air assets’ strategy• Air freight to Express conversion• Seamless European networks
• Leader from Europe• Increase backhaul volumes• Increases sales outside of
China
• Linking other high growth markets
Revenues, € million
Profits + ++
CAGR ~15-20%

36
Optimise profit and cash flow
36
Emerging markets: domestic strategy
Acquire Transform Establish and grow high-end
services
Pro
fitab
ility
0
2008 - 2010
>2010
>2013
• Invest in linehaul, PUD and depot infrastructure
• Reduce share heavy day-uncertain freight
• Launch Day Definite Service
• Expand network• Introduce tracking
• Continue service innovation
• Optimise yield, capacity management and operations
Acquisition Hoau
2007
3737
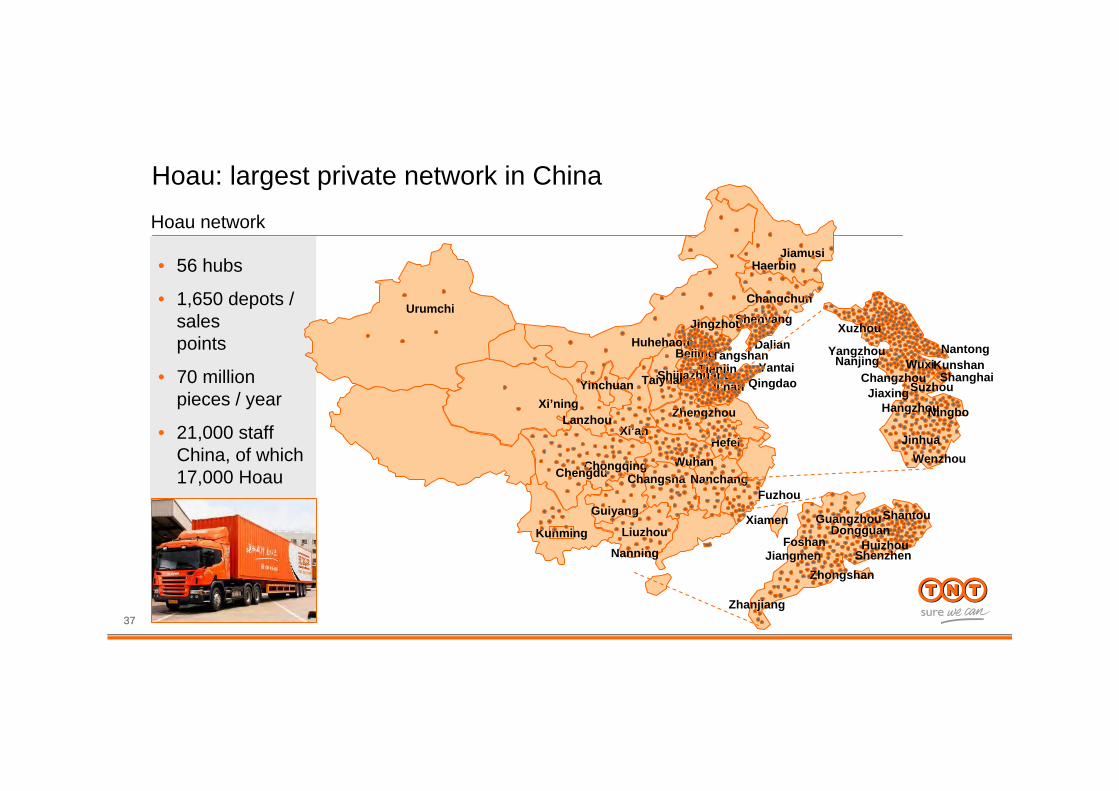
• 56 hubs
• 1,650 depots / sales points
• 70 million pieces / year
• 21,000 staff China, of which 17,000 Hoau
Nanning
Guiyang
Kunming
Hefei
LanzhouXi’ning
Xi’an
ChongqingChengdu
Yinchuan
Urumchi
NanchangWuhan
Changsha
BeijingTangshanHuhehaote
ShenyangJingzhou
Changchun
JiamusiHaerbin
Zhengzhou
Ji’nanShijiazhuangTaiyuan
Liuzhou
QingdaoYantai
Fuzhou
Xiamen
Dalian
TianjinShanghai
KunshanNantong
SuzhouChangzhou
Yangzhou
Xuzhou
HangzhouNingbo
WenzhouJinhua
Jiaxing
GuangzhouShantou
HuizhouDongguan
Foshan
ZhongshanJiangmen
Zhanjiang
WuxiNanjing
Shenzhen
Hoau: largest private network in ChinaHoau network

3838
• Dedicated service hot line• Arrival notice by SMS• Full track and trace
Superior customer proposition with Day Definite Product
Committed Time
Guaranteed Safety
Superior Service
Weight limitation
Customer feedback
High reputation
Convenience
Strong network
Good service
Punctuality
Price
Speed
Security
Purchase criteria
• On time departure & transit• On-time delivery (via GPS)• Transit tracing
• Cage & seal operation• Bar coding and GPS• Insurance

3939
Day-definite ‘sweet spot’
Price
Speed and Service Quality
FTL / LTL
Air Freight
Rail Day Definite
Freight
Road Day Definite
Freight
• Day-definite market in the making with Hoauand a few others defining offering
• Attractive alternative to rail / air freight with consistent service at competitive price
4040
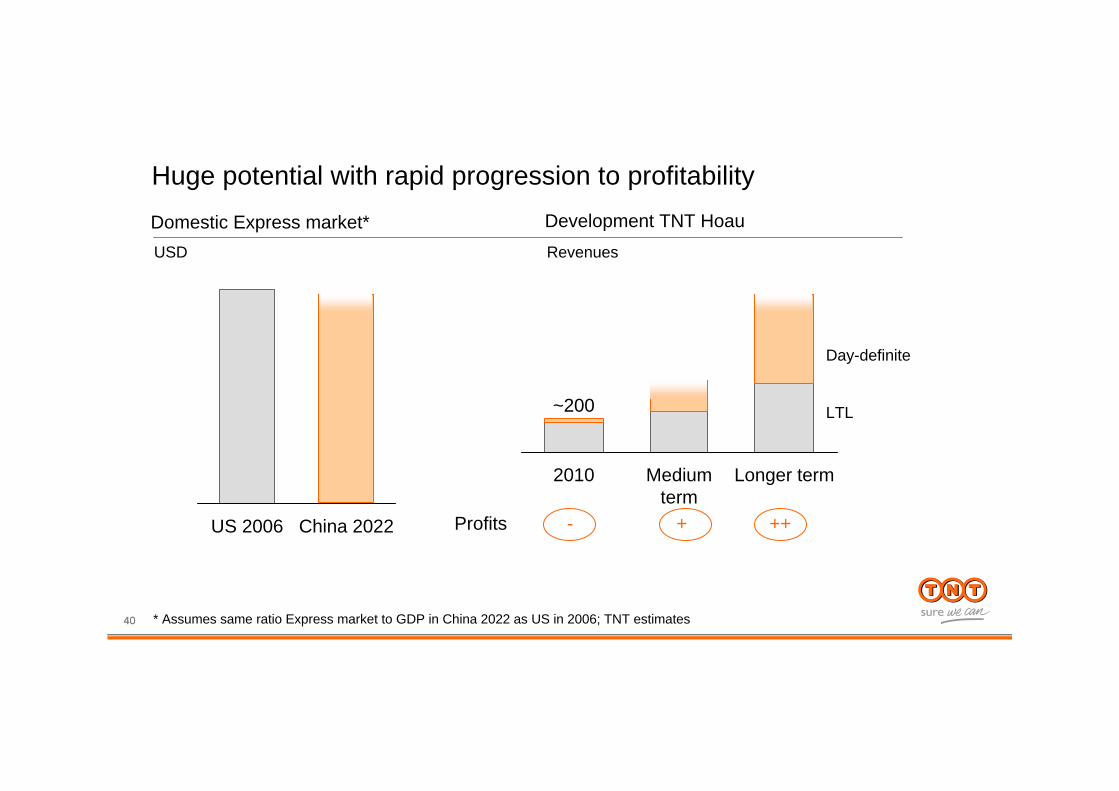
Huge potential with rapid progression to profitability
China 2022US 2006
Domestic Express market*USD
Longer termMedium term
2010
~200
Development TNT HoauRevenues
* Assumes same ratio Express market to GDP in China 2022 as US in 2006; TNT estimates
Profits - + ++
Day-definite
LTL

TNT ExpressDelivering our customers’ success
Bernard Bot3 May 2011

Agenda
Q1 recap
Finance priorities

Q1 2011
Q1 2011 Q1 2010 % change
Revenues 1,796 1,685 6.6%
EBITDA 96 110 -12.7%
Operating income (79) 59
EMEA • Resilient European performance: cost control offsetting negative impacts• Tariff measures and sales initiatives to improve product and customer mix
ASPAC• Lower China-Europe air volumes at start of the year, recovered since week 10• Negative impact one-offs• Restructuring costs regional head office
Americas
• Unexpected and recent volume losses and performance pressure in Brazil• Impairment € 120 million• New experienced leadership team in place• Deadline for realising turnaround no later than by 2H 2012
Other• Restructuring of indirect and non-core activities targeted savings of
€ 40 - 50 million• Expected related charges and write-offs of € 45 - 65 million
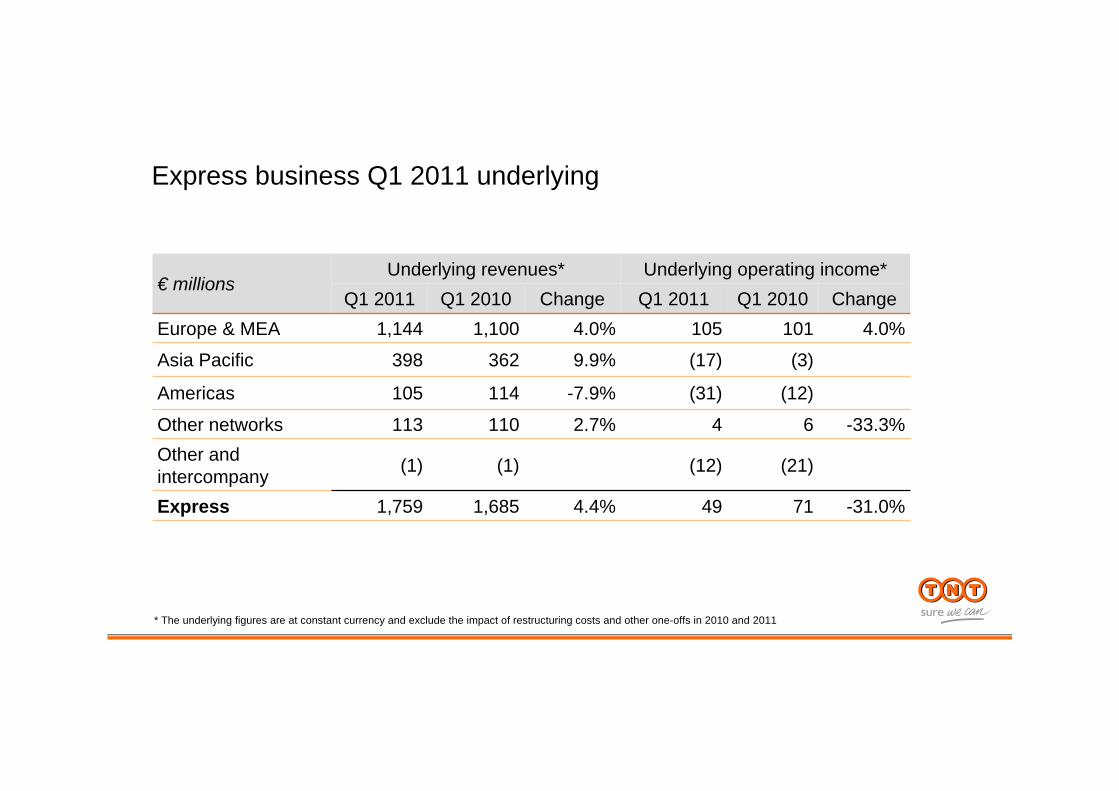
Express business Q1 2011 underlying
€ millionsUnderlying revenues* Underlying operating income*
Q1 2011 Q1 2010 Change Q1 2011 Q1 2010 ChangeEurope & MEA 1,144 1,100 4.0% 105 101 4.0%
Asia Pacific 398 362 9.9% (17) (3)
Americas 105 114 -7.9% (31) (12)
Other networks 113 110 2.7% 4 6 -33.3%Other and intercompany (1) (1) (12) (21)
Express 1,759 1,685 4.4% 49 71 -31.0%
* The underlying figures are at constant currency and exclude the impact of restructuring costs and other one-offs in 2010 and 2011

Impact restructuring initiatives
• Target € 40-50 million annualised savings
• Implementation 2H 2011• Full impact of savings in 2012• Total charges expected of
€ 45 – 65 million, around one-third non-cash
• Indirect and non-core activities
• All functions• Central, regional and
operating units • Third-party and staff
Indirect andnon-core
• Impairment € 120 million included in Q1 results
• Additional losses, restructuring charges and provisions expected in 2011
• Quick fixes and milestones• Deadline turnaround by no
later than 2H 2012Brazil

Agenda
Q1 recap
Finance priorities
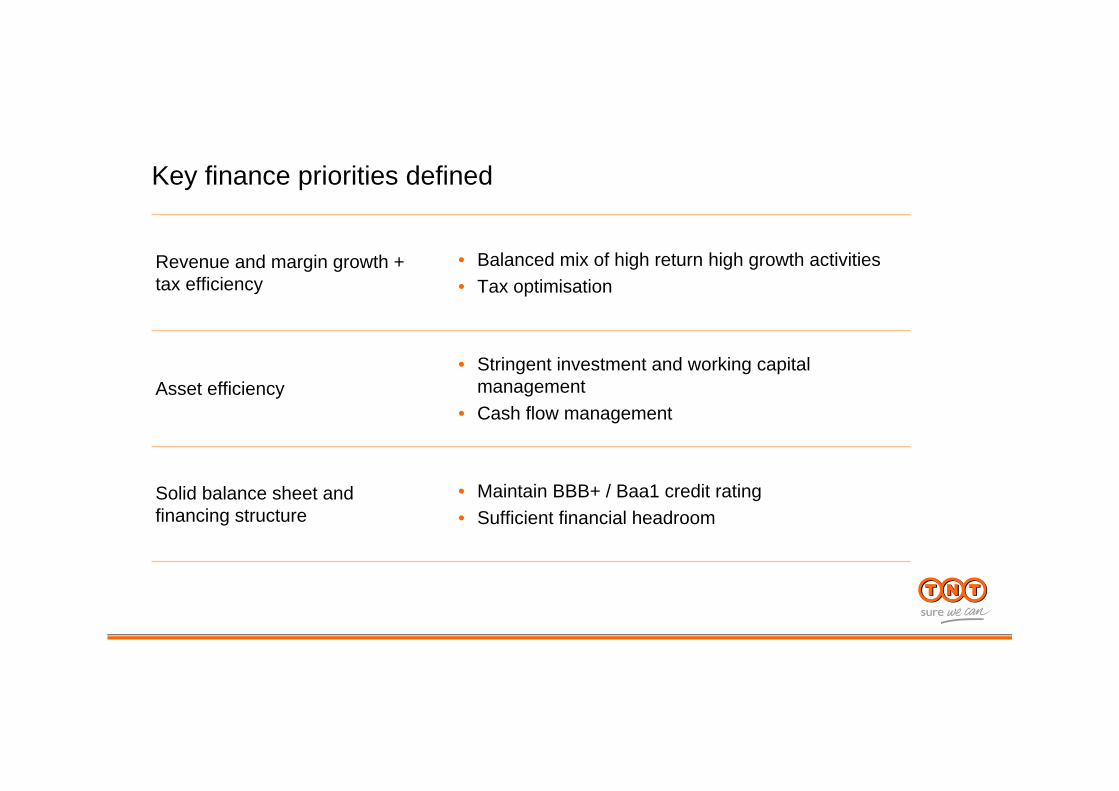
Key finance priorities defined
• Maintain BBB+ / Baa1 credit rating• Sufficient financial headroom
Solid balance sheet and financing structure
• Stringent investment and working capital management
• Cash flow managementAsset efficiency
• Balanced mix of high return high growth activities• Tax optimisation
Revenue and margin growth + tax efficiency

2011 and medium term: continued growth, higher returns
In line with prior year
Negative, to be addressed through corrective measures
Partially recover on the back of improving intercontinental volumes
9% or slightly above
Modest growth2011 Medium term aims
• Double digit revenues growth
• Solid contribution
1,656RevenuesAspac10-11%9.0%Margin
399Operating incomeOrganic growth + initiatives4,453RevenuesEMEA
2010
(7.8%)Margin(39)Operating income502RevenuesAmericas
0.8%Margin14Operating income
(55)Operating incomeSavings
(6)RevenuesUnallocated4.2%Margin
19Operating income448RevenuesOther Networks
Excluding one-offs, in € million

EMEA: further increase returns
2007 -2010 margins
9.0
12.8
Medium term
20102007
10.0-11.0~-4%+1-2%
Operating margin, percentage; approximate impact
-2%
-2%
-5%
+5%
Product mix
Customer mix
Base price
Cost reduction
Price
Cost
2010 – Medium term margins aims
Ongoing efficiencies and volume leverage
Base price increases and
surcharges
Product and customer mix
initiatives

Aspac and Americas: strong growth, secure profitability
FinancialB
usiness
Value drivers Example Brazil Example China
Growth Double-digit Double-digit
Competitiveedge Market leader
• Seamless international network• Domestic footprint• Day-definite
Customer support Local + global Local + global
Leadership Turnaround team Experienced local team
Historicperformance Requires turnaround
International profitableContinuous improvement
Future Break even by H2 2012 Domestic profits by 2013
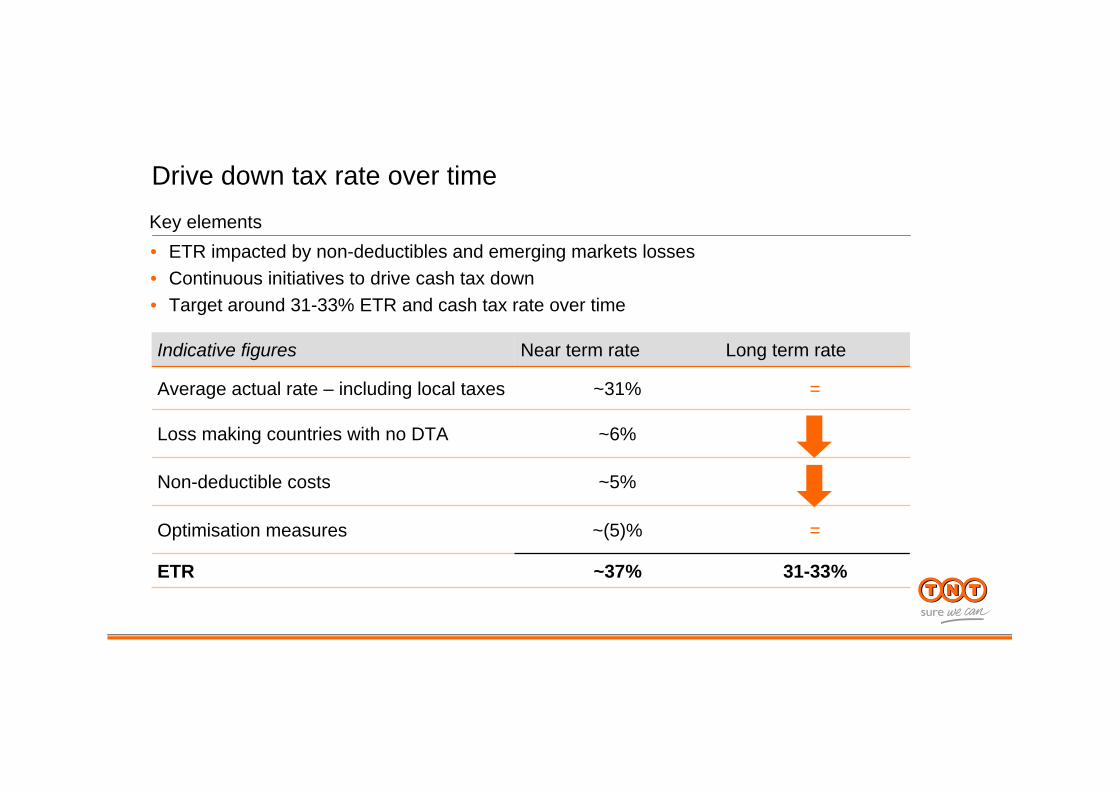
Indicative figures Near term rate Long term rate
Average actual rate – including local taxes ~31% =
Loss making countries with no DTA ~6%
Non-deductible costs ~5%
Optimisation measures ~(5)% =
ETR ~37% 31-33%
Drive down tax rate over timeKey elements• ETR impacted by non-deductibles and emerging markets losses• Continuous initiatives to drive cash tax down• Target around 31-33% ETR and cash tax rate over time

Focus on cash flow to continue
1514131211100908
Uses - Capex and acquisitionsSources356416771Cash from ops
(26)(44)(42)Net interest paid(76)(34)(152)Taxes paid
606425Δ profit pool / demerger(12)(28)84Δ taxes302374686Sources-31128172WC movements
333246514Sources ex. WC
143129243Net capex317712Acquisitions
174206255Uses
2008 2009 2010
Sources and uses of cash flow

Tight capex and working capital management
• Continue successful working capital initiatives, roll out globally• Remain restrictive on capex
<10%~10%Trade working capital
% of revenues Current Range medium-term
Capex* ~2.5% - 3.0%
~2.5% - 3.0% maintenance investments
1.0% - 2.0% points higher for extension investments in specific years
65% spent on EMEA, 25% Aspac
* Excluding operating leases
10090807060504
Capex / revenues
10090807060504
WC / revenues
Key elements

Solid capital structure
• Sufficient financial headroom maintained• Target net debt demerger accounts 31 December 2010 around zero• Availability of € 570 million currently undrawn committed facilities• Focus on free cash flow and cash concentration• S&P preliminary credit rating ‘BBB+ Stable’ after demerger• Moody’s provisional credit rating '(P) Baa1 Stable'
Indicative figures based on S&P methodology DebtTNT Express demerger target net debt ~0Lease adjustments 925Pension adjustments 50De-central cash adjustments 100Adjusted net debt ~1,075Expected net interest ~€25 - 35 million per year (finance leases, local loans and interest included in FX hedges)
Key elements

Dividend: manageable cash flow impact
• Target 40% of normalised net income• In line with UPS, Deutsche Post, K&N, Panalpina• Cover expectations global investors
• Payment in cash and/or in ordinary shares• Withholding tax benefit• Interim and first dividend
Key elements

TNT ExpressCapital Markets Day
Marie-Christine Lombard3 May 2011

5757
Three key reasons to invest
Unique position in attractive Express market
Leader in Europe and MEA with significant upside potential
Leverage positions in high-growth emerging markets
5858
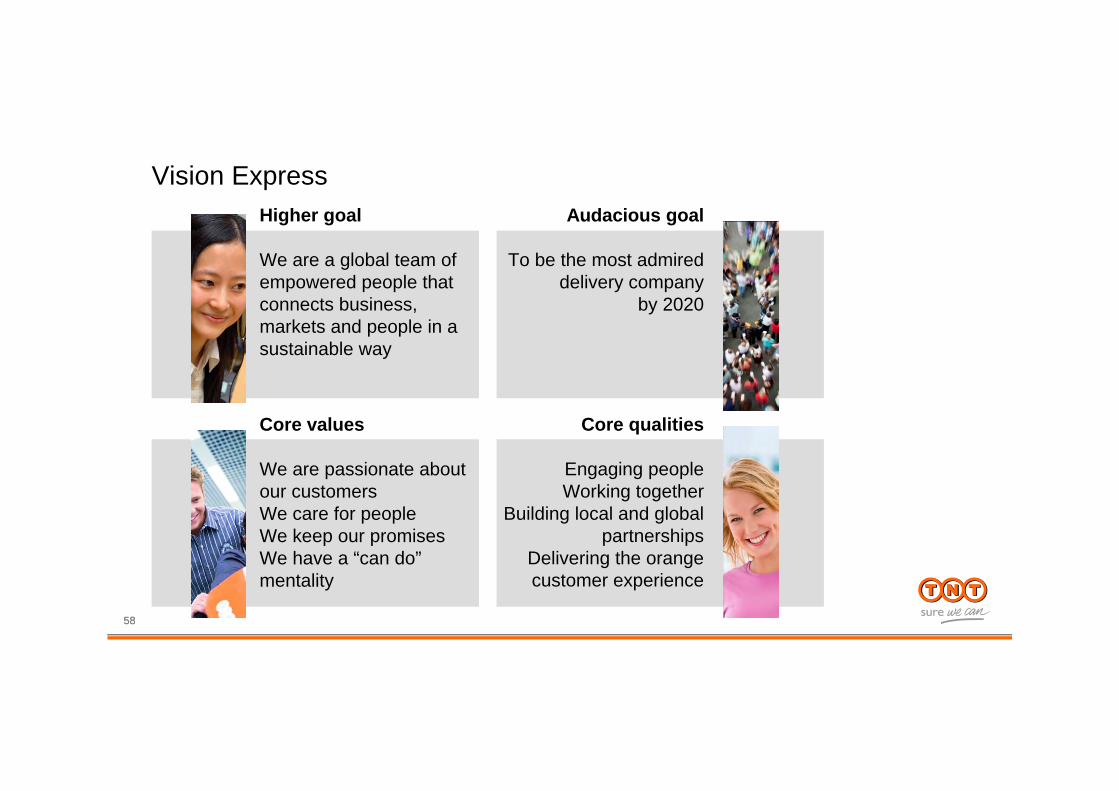
Vision ExpressAudacious goal
To be the most admired delivery company
by 2020
Higher goal
We are a global team of empowered people that connects business, markets and people in a sustainable way
Core values
We are passionate about our customersWe care for peopleWe keep our promisesWe have a “can do”mentality
Core qualities
Engaging peopleWorking together
Building local and global partnerships
Delivering the orange customer experience

59
Keeping our promises to customers
Eye for detail in operations
Engaging people

60
Focus on one business
Improve performance
Focus on shareholder value

TNT ExpressCapital Markets Day
Appendix ICurriculum VitaeExecutive BoardSupervisory Board

62
Marie-Christine Lombard
BIO
GR
AP
HY
Marie-Christine Lombard has been CEO and chairman of the Executive Board since 2 March 2011. Prior to that date, Ms Lombard was group managing director of Express and a member of the board of management of TNT N.V. since January 2004. She joined Jet Services in France in 1993. Upon TNT N.V.’s acquisition of Jet Services in 1999, Ms Lombard joined TNT as the managing director of the domestic Express business and from March 2001 until January 2004 she was managing director of TNT’s international Express business in France. Ms Lombard is an independent member of the Supervisory Board since January 2011 of Groupe BPCE, a French banking group. Ms Lombard is also president of the ‘‘Lyon Ville de l’Entrepreneuriat’’ Business Network Group. She served as a member of the supervisory board of Royal Wessanen N.V. until 22 April 2009 and as a member of the supervisory board of METRO AG until 31 December 2010.
63
Bernard BotBernard Bot has been CFO and member of the Executive Board since 2 March 2011. Prior to that date, Mr Bot was acting CFO of TNT N.V. from August 2010. Before joining TNT N.V. in 2005, he worked for 13 years at McKinsey & Company, where he was a partner serving clients in the post, logistics and transportation sectors. At TNT N.V., he was appointed Group Director Business Control directly reporting to the CFO. His responsibilities included internal control, mergers and acquisitions and business control. Bernard Bot is a member of the supervisory board of Avio-Diepen B.V.
BIO
GR
AP
HY

64
A. (Antony) BurgmansMr Burgmans held several positions with Unilever Plc/N.V. From 1999 until 2005 he was CEO and chairman of Unilever N.V. and from 2005 until 2007 he was chairman of Unilever N.V. and Unilever plc. His current responsibilities include: non-executive board member of BP plc, member of the supervisory boards of AkzoNobel, AEGON, SHV and Jumbo Supermarkten, chairman of the supervisory boards of WWF The Netherlands, theDutch National Opera (Amsterdam), and Intergamma B.V. and member Advisory Board CVC Capital Partners Nederland.
BIO
GR
AP
HY

65
L.W. (Tex) GunningMr Gunning held several positions with Unilever Plc/N.V., lastly as Business Group President Asia Foods. He was chief executive officer and chair of the management board of Vedior and is a member of AkzoNobel’s Executive Committee and responsible for its Decorative Paints business.
BIO
GR
AP
HY
66
M.E. (Mary) HarrisMs Harris was appointed as a member of the supervisory board of TNT N.V. on 20 April 2007. From 1994 to 2006, Ms Harris held a number of positions at McKinsey & Company in London, China, South-east Asia and Amsterdam. Previously, Ms Harris held positions at media venture capital firm Maxwell Entertainment Group, Pepsi Cola Beverages and Goldman Sachs & Co. Ms Harris is a non-executive director at J. Sainsbury plc, a member of the supervisory board of Unibail-Rodamco SE and a member of the advisory board of Irdeto B.V.
BIO
GR
AP
HY

67
R. (Roger) KingMr King was appointed as a member of the supervisory board of TNT N.V. on 20 April 2006. Mr King is non-executive director of Orient Overseas International Limited (Hong Kong) and Sincere Watch (Hong Kong) Limited. He is Honorary Consul for the Republic of Latvia in Hong Kong SAR, and serves on various business and community committees. Mr King is adjunct professor of finance and director of the Center for Asian Family Business and Entrepreneurship Studies at Hong Kong University of Science and Technology and director of the Center for Business Case Studies School of Business & Management. He is former president and chief executive officer of Sa Sa International Holdings Limited, former chairman and chief executive officer of ODS System-Pro Holdings Limited (Hong Kong), part of the CY Tung Group of Companies, and was managing director and chief operating officer of Orient Overseas International Limited and non-executive director of Arrow Electronics, Inc. (USA).
BIO
GR
AP
HY

68
S. (Shemaya) LevyMr Levy was appointed as a member of the supervisory board of TNT N.V. in 2005 and as the vicechairman of the supervisory board of TNT N.V. as of 1 January 2009. Mr Levy is a member of the supervisory boards of Safran, Segula Technologies Group and AEGON N.V. Formerly, Mr Levy was chief executive officer of Renault Industrial Vehicles Division and executive vice-president and chief financial officer of Renault Group as well as member of the supervisory boards of Nissan and Renault Spain.
BIO
GR
AP
HY

69
M. (Margot) ScheltemaMs Scheltema spent most of her career abroad with Royal Dutch Shell, in various management positions, always in finance. Since 2009 she manages a portfolio of executive and supervisory positions. She is also a research fellow at the Erasmus University of Rotterdam. Her current responsibilities include: vice-chairman supervisory board Triodos Bank, chairman audit committee, supervisory board ASR Verzekeringen, external member audit committee ABP, supervisory board Schiphol Group, supervisory board Energy Research Centre, Petten, supervisory board of Stichting Rijksmuseum, member of the committee on External Reporting of the AFM, member of the board of World Press Photo and chairman of the curatorium of the post-doctoral controllers education at the Vrije Universiteit, Amsterdam.
BIO
GR
AP
HY

TNT ExpressCapital Markets Day
Appendix II

Summary other indicators
Medium-term indication
ETR Target 31% - 33%
Capex*• 2.5 - 3.5% of revenues maintenance • 1.0 - 2.0% points higher for extension in specific years
Working capital Target <10% of revenues
Credit rating BBB+ / Baa1
Net interest payments ~€ 25-35 million per year (relating to financial leases, local debts and foreign currency hedges)
Dividend policy Target 40% of normalised net income
* Excluding operating leases
72
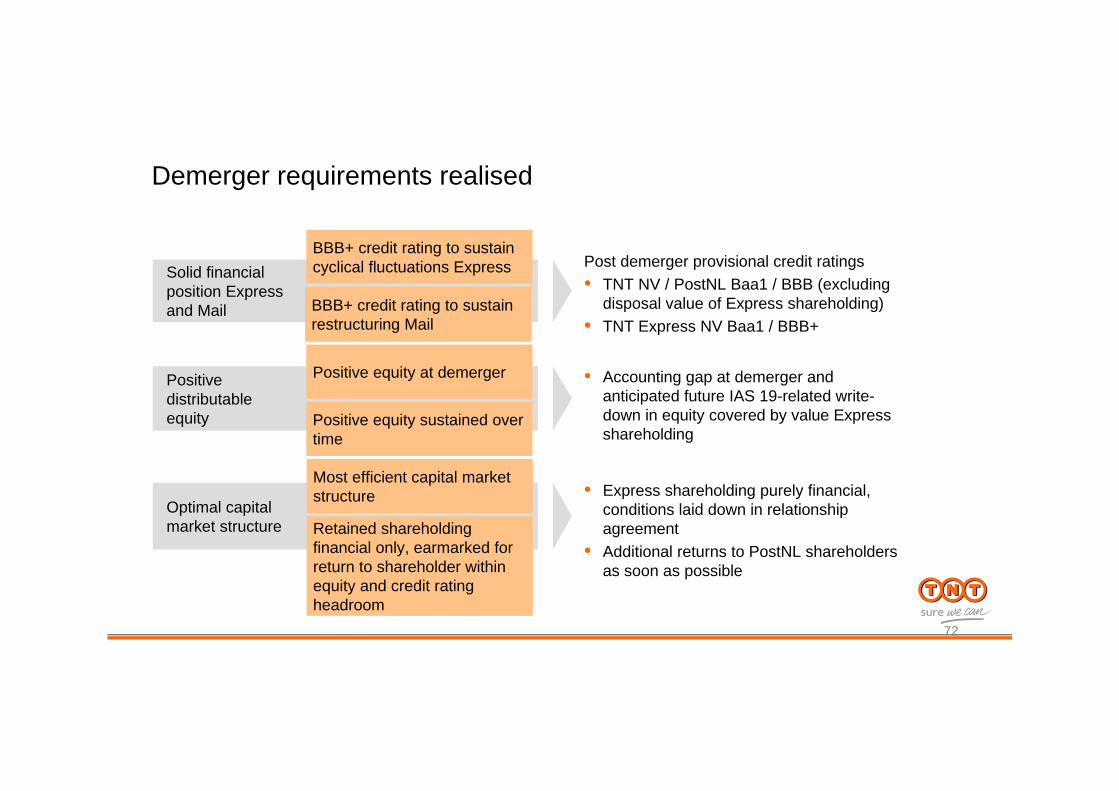
Demerger requirements realised
Optimal capital market structure
• Express shareholding purely financial, conditions laid down in relationship agreement
• Additional returns to PostNL shareholders as soon as possible
Positivedistributableequity
• Accounting gap at demerger and anticipated future IAS 19-related write-down in equity covered by value Express shareholding
Solid financial position Express and Mail
Most efficient capital market structure
Retained shareholding financial only, earmarked for return to shareholder within equity and credit rating headroom
Positive equity at demerger
Positive equity sustained over time
BBB+ credit rating to sustain cyclical fluctuations Express
BBB+ credit rating to sustain restructuring Mail
Post demerger provisional credit ratings• TNT NV / PostNL Baa1 / BBB (excluding
disposal value of Express shareholding)• TNT Express NV Baa1 / BBB+
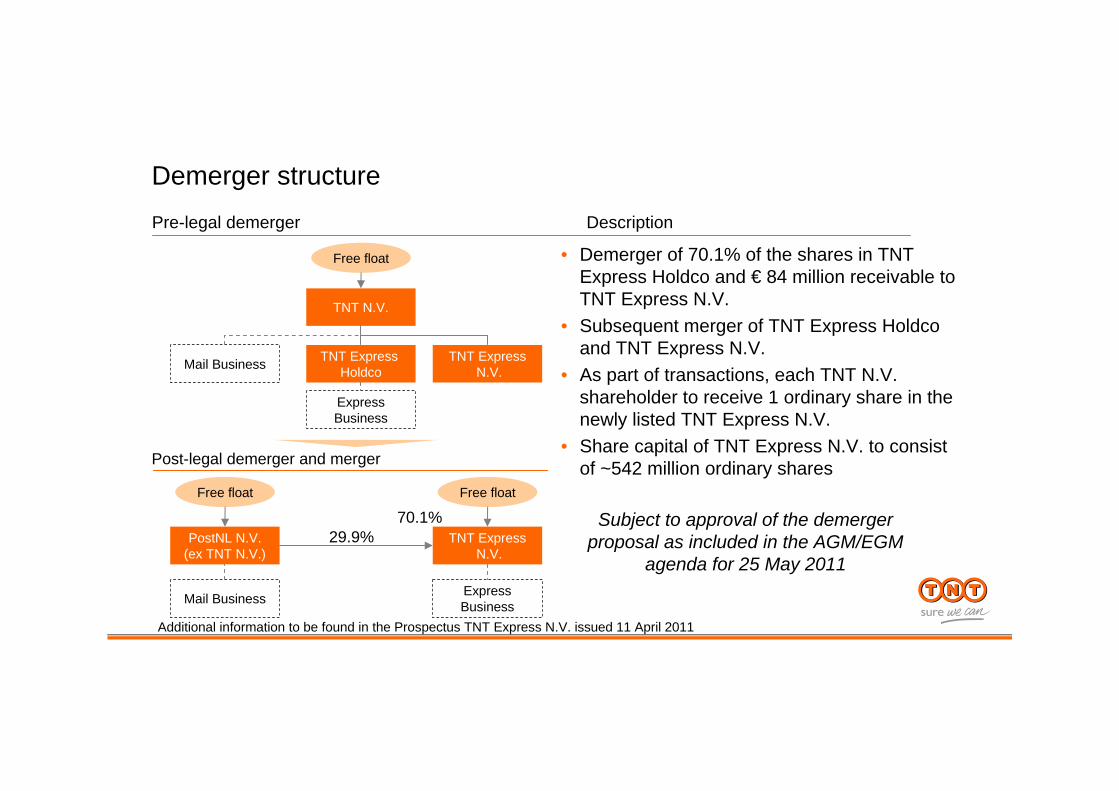
Demerger structurePre-legal demerger Description
• Demerger of 70.1% of the shares in TNT Express Holdco and € 84 million receivable to TNT Express N.V.
• Subsequent merger of TNT Express Holdco and TNT Express N.V.
• As part of transactions, each TNT N.V. shareholder to receive 1 ordinary share in the newly listed TNT Express N.V.
• Share capital of TNT Express N.V. to consist of ~542 million ordinary shares
Subject to approval of the demerger proposal as included in the AGM/EGM
agenda for 25 May 2011
TNT N.V.
TNT Express Holdco
ExpressBusiness
PostNL N.V.(ex TNT N.V.)
Mail Business TNT ExpressN.V.
Mail Business ExpressBusiness
TNT ExpressN.V.
Free float Free float
Free float
29.9%70.1%
Post-legal demerger and merger
Additional information to be found in the Prospectus TNT Express N.V. issued 11 April 2011

Relationship agreement and related party transactions
• Six months lock up from date of demerger• Maximum offering of 15% of the shares of TNT Express to one party
or group of related parties• In case of public offer, obliged to tender if supported by TNT Express
or if 50% of the ordinary shares tendered*• PostNL to abstain from voting on specified decisions entailing
significant change in identity, demerger or merger
Other
Relationshipagreement
• Separate execution agreements with the Dutch pension funds• Subsidiary cross-guarantees regarding accrued pension benefits
up to date of demerger in case of default / bankruptcy• Transitional agreement for period 1-36 months for use of TNT
brand by Mail• Limited set of other agreements related to separation
* If Mail’s stake is between 29.9% and 25% if 66.67% of the other shares are tenderedAdditional information to be found in the Prospectus TNT Express N.V. issued 11 April 2011
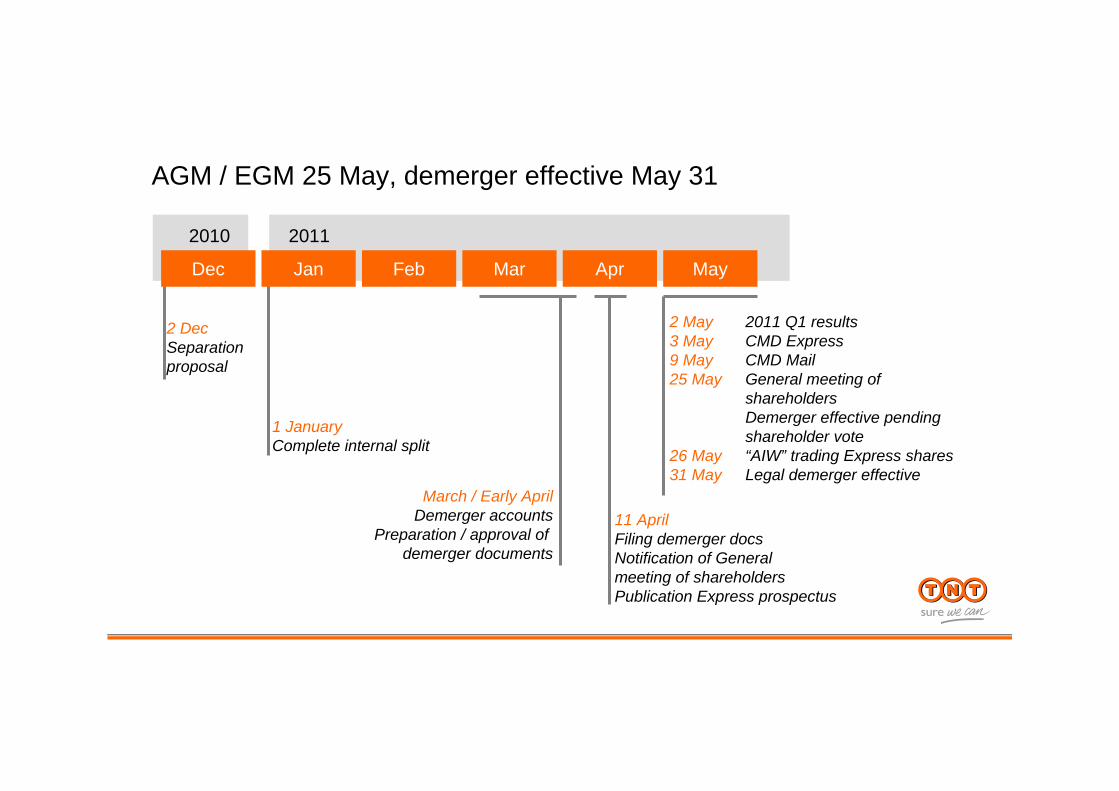
AGM / EGM 25 May, demerger effective May 31
11 AprilFiling demerger docsNotification of General meeting of shareholdersPublication Express prospectus
2 DecSeparation proposal
1 JanuaryComplete internal split
March / Early AprilDemerger accounts
Preparation / approval of demerger documents
Dec Jan Feb Mar Apr May
2011
2 May 2011 Q1 results3 May CMD Express9 May CMD Mail25 May General meeting of
shareholdersDemerger effective pending shareholder vote
26 May “AIW” trading Express shares31 May Legal demerger effective
2010

Trading of TNT Express N.V. shares
• First trading Express shares and ‘ex-spin off’ TNT N.V./PostNL N.V. shares expected on 26 May 2011
• Express to trade under symbol ‘TNTE’, Mail under ‘PNL’
• Settlement of trades on First Trading date and first date of irrevocable trading on 31 May 2011
Timetable Description
May 31First day of irrevocable trading
Approval demerger proposal May 25
Expected first trading TNT Express NV on ‘as-if-and-when issued’ basis
May 26
PostNL N.V. ‘ex-spin off’ May 26
Record date May 30
Execution demerger structure effective May 31
Allotment, delivery and settlement May 31
