title sphingosine kinase 1-interacting protein is a novel ... · gsis was amplified more in...
TRANSCRIPT

Title Sphingosine kinase 1-interacting protein is a novel regulator ofglucose-stimulated insulin secretion.( Dissertation_全文 )
Author(s) Wang, Yu
Citation Kyoto University (京都大学)
Issue Date 2017-07-24
URL https://doi.org/10.14989/doctor.k20616
Right
Sphingosine kinase 1-interacting protein is a novel regulator ofglucose-stimulated insulin secretion Yu Wang, Shin-ichiHarashima, Yanyan Liu, Ryota Usui & Nobuya InagakiScientific Reports 7, Article number: 779 (2017)doi:10.1038/s41598-017-00900-7
Type Thesis or Dissertation
Textversion ETD
Kyoto University

1Scientific RepoRts | 7: 779 | DOI:10.1038/s41598-017-00900-7
www.nature.com/scientificreports
Sphingosine kinase 1-interacting protein is a novel regulator of glucose-stimulated insulin secretionYu Wang, Shin-ichi Harashima, Yanyan Liu, Ryota Usui & Nobuya Inagaki
Glucose-stimulated insulin secretion (GSIS) is essential in keeping blood glucose levels within normal range. GSIS is impaired in type 2 diabetes, and its recovery is crucial in treatment of the disease. We find here that sphingosine kinase 1-interacting protein (SKIP, also called Sphkap) is highly expressed in pancreatic β-cells but not in α-cells. Intraperitoneal glucose tolerance test showed that plasma glucose levels were decreased and insulin levels were increased in SKIP−/− mice compared to SKIP+/+ mice, but exendin-4-enhanced insulin secretion was masked. GSIS was amplified more in SKIP−/− but exendin-4-enhanced insulin secretion was masked compared to that in SKIP+/+ islets. The ATP and cAMP content were similarly increased in SKIP+/+ and SKIP−/− islets; depolarization-evoked, PKA and cAMP-mediated insulin secretion were not affected. Inhibition of PDE activity equally augmented GSIS in SKIP+/+ and SKIP−/− islets. These results indicate that SKIP modulates GSIS by a pathway distinct from that of cAMP-, PDE- and sphingosine kinase-dependent pathways.
Glucose is the most important physiological secretagogue of insulin secretion. Intracellular uptake and metabo-lism of glucose are the essential features of glucose-stimulated insulin secretion (GSIS)1. Dual, hierarchical con-trol of insulin secretion by glucose is proposed: the triggering pathway and the metabolic amplifying pathway2, 3. The increase of the ATP: ADP ratio by glucose inhibits ATP-sensitive K+ (KATP) channels, followed by depolariza-tion of the β-cell membrane, opening of the voltage-dependent Ca2+ channels (VDCCs), and elevation of influx of extracellular Ca2+, which activates insulin granules exocytosis3–7. This KATP channel-dependent triggering pathway is particularly important in the first, acute phase of GSIS. The metabolic amplifying pathway, originally referred to as the KATP channel-independent pathway, contributes similarly to both the first and the second phase of GSIS8. Glucose increases insulin secretion from islets lacking KATP channels, partially contributing to amplifi-cation of the triggering action of Ca2+ 9. The non-electrical effects of glucose on amplification of GSIS depend on the metabolism of glucose10. Several candidates have been proposed in the metabolic amplifying pathway: ATP11, NADPH12–14, AMP-activated protein kinase15, SENP116, 17, and S-AMP18. However, the mechanisms of the process are not fully understood.
Neurohormonal amplifying pathways also have a major role in enhancement of GSIS. The two incretins, gastric inhibitory polypeptide (GIP) and glucagon-like peptide 1 (GLP-1), potentiate GSIS by activation of 3′-5′-cyclic adenosine monophosphate (cAMP) signaling19, 20; elevation of the cAMP concentration acts through both a protein kinase A (PKA)-dependent and a PKA-independent mechanism21, 22, the latter involving the alter-native cAMP sensor Epac223–25.
Recently, we found that SKIP (also called Sphkap) was highly expressed in insulinoma cells, but not in other cell lines. Initially, SKIP was identified as a sphingosine kinase (SPHK) interacting protein in the brain of mice that inhibited SPHK activity in vitro26. SKIP also was reported to be an A-kinase anchoring protein (AKAP) that binds to PKA regulatory subunit I (PKARI) in the heart27, 28, and phosphorylates the inner mitochondrial mem-brane protein ChChd3 (coiled-coil-helix-coiled-coli-helix domain containing 3) via cAMP-mediated signals29. AKAPs are a large group of proteins that anchor PKA to the membrane and cellular organelles. So far, over 70
Department of Diabetes, Endocrinology and Nutrition, Graduate School of Medicine, Kyoto University, Kyoto, 606-8507, Japan. Correspondence and requests for materials should be addressed to S.-i.H. (email: [email protected]) or N.I. (email: [email protected])
Received: 2 December 2016
Accepted: 16 March 2017
Published: xx xx xxxx
OPEN
www.nature.com/scientificreports/
2Scientific RepoRts | 7: 779 | DOI:10.1038/s41598-017-00900-7
molecules have been identified in the AKAP family30, 31. However, the involvement of SKIP in insulin secretion is still unknown.
We therefore examined the role of SKIP in insulin secretion. We show here that SKIP is highly expressed in pancreatic β-cells but not in α-cells and that depletion of SKIP amplifies GSIS by a pathway distinct from the cAMP-, PDE- and sphingosine kinase-dependent pathways.
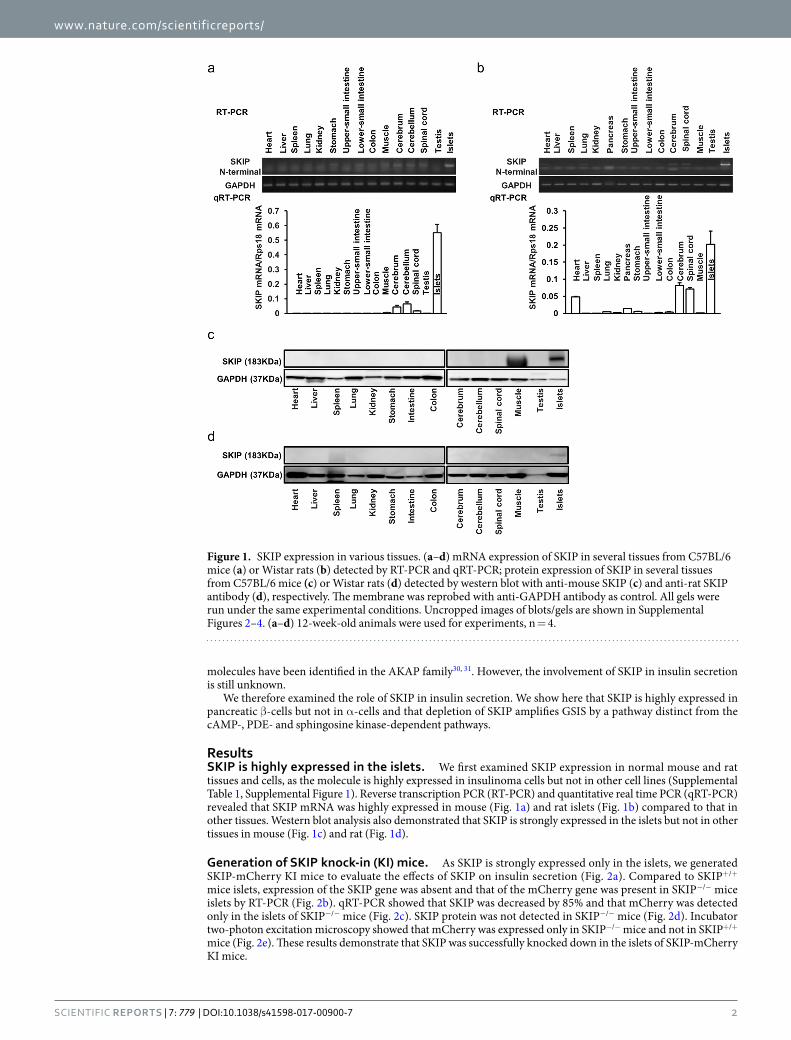
ResultsSKIP is highly expressed in the islets. We first examined SKIP expression in normal mouse and rat tissues and cells, as the molecule is highly expressed in insulinoma cells but not in other cell lines (Supplemental Table 1, Supplemental Figure 1). Reverse transcription PCR (RT-PCR) and quantitative real time PCR (qRT-PCR) revealed that SKIP mRNA was highly expressed in mouse (Fig. 1a) and rat islets (Fig. 1b) compared to that in other tissues. Western blot analysis also demonstrated that SKIP is strongly expressed in the islets but not in other tissues in mouse (Fig. 1c) and rat (Fig. 1d).
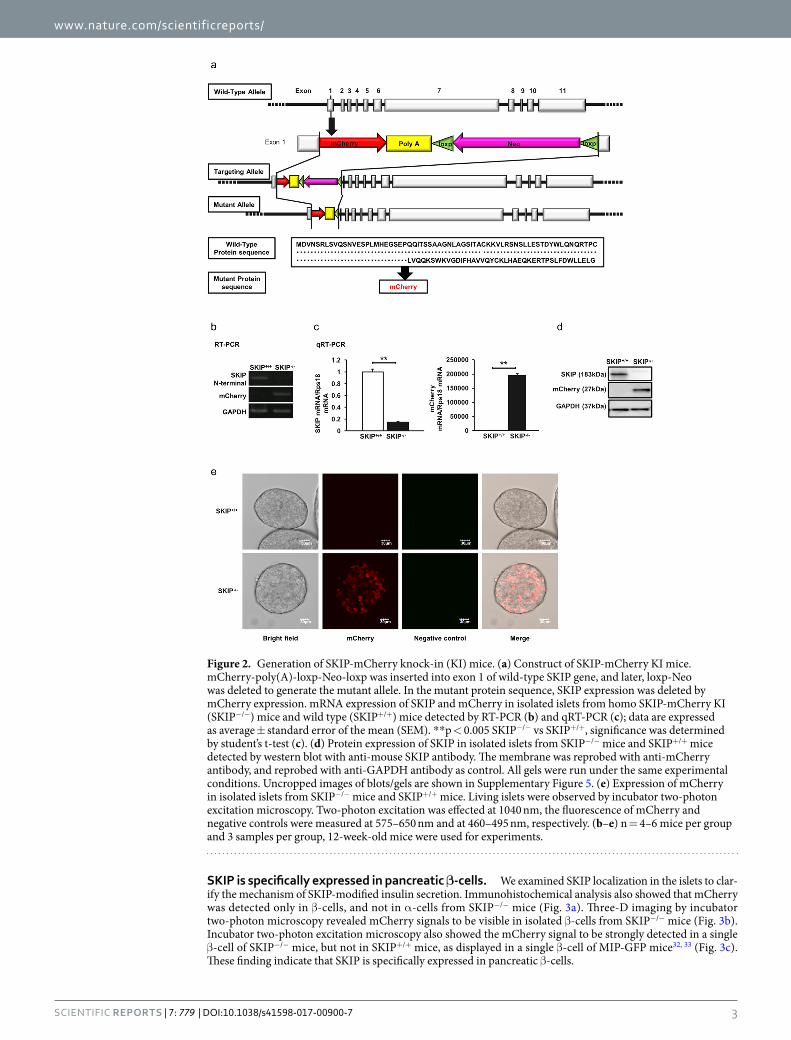
Generation of SKIP knock-in (KI) mice. As SKIP is strongly expressed only in the islets, we generated SKIP-mCherry KI mice to evaluate the effects of SKIP on insulin secretion (Fig. 2a). Compared to SKIP+/+ mice islets, expression of the SKIP gene was absent and that of the mCherry gene was present in SKIP−/− mice islets by RT-PCR (Fig. 2b). qRT-PCR showed that SKIP was decreased by 85% and that mCherry was detected only in the islets of SKIP−/− mice (Fig. 2c). SKIP protein was not detected in SKIP−/− mice (Fig. 2d). Incubator two-photon excitation microscopy showed that mCherry was expressed only in SKIP−/− mice and not in SKIP+/+ mice (Fig. 2e). These results demonstrate that SKIP was successfully knocked down in the islets of SKIP-mCherry KI mice.
Figure 1. SKIP expression in various tissues. (a–d) mRNA expression of SKIP in several tissues from C57BL/6 mice (a) or Wistar rats (b) detected by RT-PCR and qRT-PCR; protein expression of SKIP in several tissues from C57BL/6 mice (c) or Wistar rats (d) detected by western blot with anti-mouse SKIP (c) and anti-rat SKIP antibody (d), respectively. The membrane was reprobed with anti-GAPDH antibody as control. All gels were run under the same experimental conditions. Uncropped images of blots/gels are shown in Supplemental Figures 2–4. (a–d) 12-week-old animals were used for experiments, n = 4.
www.nature.com/scientificreports/
3Scientific RepoRts | 7: 779 | DOI:10.1038/s41598-017-00900-7
SKIP is specifically expressed in pancreatic β-cells. We examined SKIP localization in the islets to clar-ify the mechanism of SKIP-modified insulin secretion. Immunohistochemical analysis also showed that mCherry was detected only in β-cells, and not in α-cells from SKIP−/− mice (Fig. 3a). Three-D imaging by incubator two-photon microscopy revealed mCherry signals to be visible in isolated β-cells from SKIP−/− mice (Fig. 3b). Incubator two-photon excitation microscopy also showed the mCherry signal to be strongly detected in a single β-cell of SKIP−/− mice, but not in SKIP+/+ mice, as displayed in a single β-cell of MIP-GFP mice32, 33 (Fig. 3c). These finding indicate that SKIP is specifically expressed in pancreatic β-cells.
Figure 2. Generation of SKIP-mCherry knock-in (KI) mice. (a) Construct of SKIP-mCherry KI mice. mCherry-poly(A)-loxp-Neo-loxp was inserted into exon 1 of wild-type SKIP gene, and later, loxp-Neo was deleted to generate the mutant allele. In the mutant protein sequence, SKIP expression was deleted by mCherry expression. mRNA expression of SKIP and mCherry in isolated islets from homo SKIP-mCherry KI (SKIP−/−) mice and wild type (SKIP+/+) mice detected by RT-PCR (b) and qRT-PCR (c); data are expressed as average ± standard error of the mean (SEM). **p < 0.005 SKIP−/− vs SKIP+/+, significance was determined by student’s t-test (c). (d) Protein expression of SKIP in isolated islets from SKIP−/− mice and SKIP+/+ mice detected by western blot with anti-mouse SKIP antibody. The membrane was reprobed with anti-mCherry antibody, and reprobed with anti-GAPDH antibody as control. All gels were run under the same experimental conditions. Uncropped images of blots/gels are shown in Supplementary Figure 5. (e) Expression of mCherry in isolated islets from SKIP−/− mice and SKIP+/+ mice. Living islets were observed by incubator two-photon excitation microscopy. Two-photon excitation was effected at 1040 nm, the fluorescence of mCherry and negative controls were measured at 575–650 nm and at 460–495 nm, respectively. (b–e) n = 4–6 mice per group and 3 samples per group, 12-week-old mice were used for experiments.

www.nature.com/scientificreports/
4Scientific RepoRts | 7: 779 | DOI:10.1038/s41598-017-00900-7
Figure 3. Localization of SKIP in the islets. (a) Immunohistochemical images in the pancreas from SKIP−/−mice and SKIP+/+ mice; green, anti-insulin; blue: anti-glucagon; and red, anti-mCherry. (b) 3D imaging by incubator two-photon microscopy in isolated islets from SKIP−/− mice. (c) Incubator two-photon excitation microscopy images of living β-cells from SKIP−/− (SKIP-mCherry KI) mice and MIP-GFP mice; left column, bright field; second column, mCherry; third column, GFP; right column, merged images. 12-week-old mice were used for the experiments, n = 3.

www.nature.com/scientificreports/
5Scientific RepoRts | 7: 779 | DOI:10.1038/s41598-017-00900-7
Glucose-stimulated insulin secretion is augmented by depletion of SKIP. An IpGTT of 1 g glu-cose per kg body weight administration showed that blood glucose levels, blood glucose area under the curve (BG-AUC), plasma insulin levels and insulin area under the curve (insulin-AUC) did not differ in SKIP+/+ and SKIP−/− mice (Fig. 4a–d). Under an IpGTT of 2 g glucose per kg body weight administration, blood glucose levels were significantly lower in SKIP−/− mice than in SKIP+/+ mice at 30 min and 60 min (P < 0.05), and tended to be even lower at 120 min (P = 0.07) (Fig. 4e). BG-AUC also was significantly reduced by 15% (Fig. 4f). Plasma insulin levels were higher in SKIP−/− mice compared to SKIP+/+ mice (Fig. 4g) at 15 and 60 min (P < 0.05), which resulted in an increase of insulin-AUC by 1.24-fold (Fig. 4h).
Next, insulin secretion was compared in the islets from SKIP−/− mice and SKIP+/+ mice. At 2.8 mM and 5.5 mM glucose, insulin secretion was at a similar level in SKIP−/− and SKIP+/+ mice (Fig. 4i). At 11.1 mM and 16.7 mM glucose, insulin secretion was about 2.5-fold higher, respectively, in SKIP−/− mice than in SKIP+/+
Figure 4. SKIP-regulated glucose-stimulated insulin secretion (GSIS). (a–d) Blood glucose levels (a), BG-AUC (b), plasma insulin levels (c) and insulin-AUC (d) during 1 g/kg body weight IpGTT. (e–h) Blood glucose levels (e), BG-AUC (f), plasma insulin levels (g) and insulin-AUC (h) during 2 g/kg body weight IpGTT. (i) GSIS in islets from SKIP+/+ mice and SKIP−/− mice. Insulin secretion was measured at 2.8 mM, 5.5 mM, 11.1 mM, and 16.7 mM glucose. (j) Insulin content in the islets from SKIP+/+ mice and SKIP−/− mice. (a–j) 12-week-old mice were used for the experiments. (a–h) n = 7–8 mice per group, *p < 0.05 vs SKIP+/+, significance was determined by student’s t-test. (i,j) n = 7–8 mice per group and 5–6 samples per group, with 10 islets per sample, *p < 0.05, **p < 0.005 vs SKIP+/+, #p < 0.05, ##p < 0.005 for different glucose conditions in the same genotype mice of insulin secretion, significance was determined by one way ANOVA with Tukey test. All data are expressed as average ± SEM.

www.nature.com/scientificreports/
6Scientific RepoRts | 7: 779 | DOI:10.1038/s41598-017-00900-7
mice (Fig. 4i). Interestingly, GSIS was amplified in islets from SKIP−/− mice compared to SKIP+/+ mice. GSIS in SKIP−/− mice was about 5.5-fold and 14.4-fold increased at 11.1 mM and 16.7 mM glucose, respectively, com-pared to that at 2.8 mM glucose (Fig. 4i, Supplemental Table 2). On the other hand, GSIS was about 3.2-fold and 7.3-fold increased at 11.1 mM and 16.7 mM glucose, respectively, compared to that at 2.8 mM glucose in SKIP+/+ mice (Fig. 4i, Supplemental Table 2). Insulin content was not altered among islets stimulated by the indicated glucose concentrations (Fig. 4j). These results indicate that depletion of SKIP augments GSIS under high glucose conditions.
Exendin-4 (ex-4)-enhanced insulin secretion is absent by depletion of SKIP. Regarding the incre-tin effect, under an IpGTT of 2 g glucose per kg body weight in the presence of 10 nM ex-4, blood glucose levels at each point and the BG-AUC level in SKIP+/+ mice and SKIP−/− mice did not differ (Fig. 5a,b). On the other hand, the plasma insulin levels in the presence of 10 nM ex-4 were significantly lower at 10 min and 15 min (P < 0.05) in SKIP−/− mice than in SKIP+/+ mice (Fig. 5c), while insulin-AUC was similar in SKIP−/− mice and SKIP+/+ mice at 0–120 min (Fig. 5d).
Regarding the role of SKIP in incretin-enhanced insulin secretion, at 2.8 mM glucose, 10 nM ex-4 did not increase GSIS in either SKIP+/+ or SKIP−/− mice islets (Fig. 5e). At 16.7 mM glucose, GSIS in SKIP+/+ mice islets was increased 2.0 fold in the presence of 10 nM ex-4 compared to that in the absence of 10 nM ex-4 (Fig. 5e). On the other hand, GSIS at 16.7 mM glucose in the presence of 10 nM ex-4 was almost the same as that only at 16.7 mM glucose in SKIP−/− mice islets (Fig. 5e).
Furthermore, full-length of rat SKIP with V5 tag was overexpressed in INS-1D cells to examine the role of SKIP in GSIS and ex-4-enhanced insulin secretion. SKIP expression was about 3 fold increased in SKIP-overexpressed INS-1D cells compared to that in control INS-1D cells (Fig. 5f). GSIS was decreased by 25% at 10 mM glucose in SKIP-overexpressed INS-1D cells compared to that in control INS-1D cells (Fig. 5g). However, ex-4-enhanced insulin secretion at 10 mM glucose in SKIP-overexpressed cells was almost the same as that in control cells (Fig. 5g).
These results indicate that GSIS under high glucose conditions may be almost fully amplified by the depletion of SKIP.
The mechanism of regulation of glucose-stimulated insulin secretion by SKIP. The detailed mechanism involved in SKIP-regulated GSIS was then examined. SPHK activity was similar in SKIP−/− mice and SKIP+/+ mice islets at 2.8 mM and 16.7 mM glucose (Fig. 6a). Neither SKIP−/− mice nor SKIP+/+ mice islets showed an increase in glucose-stimulated insulin secretion in the presence of non-metabolic glucose (3-OMG) (Fig. 6b). ATP content was equally increased in islets of both SKIP+/+ mice and SKIP−/− mice, but it did not differ between the islets at 2.8 mM and 16.7 mM glucose (Fig. 6c). Potassium-induced insulin secretion also was found not to differ between the islets of SKIP+/+ mice and SKIP−/− mice (Fig. 6d). The intracellular calcium con-centration did not differ by stimulation with 16.7 mM glucose or 30 mM KCl between the groups of islets from SKIP+/+ mice and SKIP−/− mice (Fig. 6e). The cAMP content was similar between the islets from SKIP+/+ mice and SKIP−/− mice stimulated with 16.7 mM glucose for 0 min, 15 min and 60 min (Fig. 6f). cAMP content did not differ at 2.8 mM glucose levels, and was equally increased by 10 nM ex-4 in islets of both SKIP+/+ mice and SKIP−/− mice (Fig. 6g). In addition, cAMP signaling did not affect enhancement of GSIS in SKIP−/− mice islets compared to SKIP+/+ mice islets, nor did the Epac2 selective activator ESCA enhance GSIS (Fig. 6h), and the protein kinase-A inhibitor PKI did not decrease GSIS (Fig. 6i). Furthermore, 500 µM 3-isobutyl-1-metylxantine (IBMX), a non-selective phosphodiesterase (PDE) inhibitor, promoted GSIS at 16.7 mM glucose, but the total amount of GSIS was not significantly different between SKIP+/+ and SKIP−/− islets (Fig. 6j). The increment of insulin secretion by 16.7 mM glucose + IBMX compared to that by 16.7 mM glucose + DMSO also did not signif-icantly differ between SKIP+/+ and SKIP−/− islets (Fig. 6j).
DiscussionWe show here that SKIP is a novel protein expressed in pancreatic β-cells and that depletion of SKIP augments glucose-stimulated insulin secretion (GSIS). Glucose metabolism was necessary for amplification of GSIS, but it was not depolarization-evoked or cAMP-enhanced, and PDE-involved insulin secretion differed in the islets with or without the SKIP molecule. Although the detailed mechanism remains unknown, our results demonstrate that depletion of SKIP exaggerates GSIS under high glucose conditions.
Initially, SKIP was identified as a sphingosine kinase (SPHK) interacting protein in the brain of mice that inhibited SPHK activity in vitro26. It was reported that SPHK increased insulin secretion due to an increase in sphingosine 1-phosphate (S1-P) levels by glucose in pancreatic β-cells34. However, our data show that SPHK activity did not differ between islets of SKIP+/+ mice and SKIP−/− mice. SKIP also was reported to be an A-kinase anchoring protein (AKAP) that binds to PKA regulatory subunit I (PKARI) in the heart27, 28. Previous studies reported that disruption of PKA-AKAP interaction decreased only cAMP-mediated insulin secretion35, 36 and did not affect GSIS37. On the other hand, recent study on PKARI subunit-deleted mice showed a dramatic increase in GSIS38. Our data also demonstrate that depletion of SKIP augments GSIS under high glucose conditions. However, cAMP-mediated signals in GSIS were the same in SKIP−/− mice islets as those in SKIP+/+ mice islets. cAMP content at low glucose and at high glucose did not differ in SKIP+/+ and SKIP−/− mice islets. A PKA inhibitor and an Epac2 activator did not modify GSIS in SKIP−/− mice islets. PDEs as regulators of intracellular cyclic nucleotide concentrations can trigger multiple cellular signaling events39. PDE3B, 5, 7, 8, 9, 10, and 11 are expressed in rodent and human islets40–42, and inhibition of PDE3B and PDE8 potentiates insulin secretion43. However, in our study, a general PDE inhibitor IBMX enhanced GSIS at 16.7 mM glucose, although there was no significant difference in insulin secretion levels between SKIP+/+ and SKIP−/− islets. This evidence clearly

www.nature.com/scientificreports/
7Scientific RepoRts | 7: 779 | DOI:10.1038/s41598-017-00900-7
indicates that another pathway distinct from the cAMP-, PDE- and sphingosine kinase-dependent pathways is related to augmentation of GSIS in depletion of SKIP.
GSIS is the principal process of insulin secretion44. Glucose is metabolized to pyruvate followed by an increase in the ATP concentration, closure of KATP channels, depolarization of the β-cell membrane, opening of the voltage-dependent Ca2+ channels (VDCCs), and promotion of Ca2+ influx6. This process is the main pathway of
Figure 5. Exendin-4-enhanced Insulin secretion in SKIP+/+ mice and SKIP−/− mice. (a–d) Blood glucose levels (a), BG-AUC (b), plasma insulin levels (c) and insulin-AUC (d) during 2 g/kg body weight IpGTT 30 min after administration of 10 nM ex-4. (e) Ex-4-induced insulin secretion in the islets from SKIP+/+ mice and SKIP−/−mice. Insulin secretion from isolated islets measured at 2.8 mM and 16.7 mM glucose with or without 10 nM ex-4. (f) Protein expression of SKIP in control and SKIP-overexpressed INS-1D cells after 48 h transfection detected by western blot with anti-rat SKIP antibody. The membrane was reprobed with anti-V5 antibody, and reprobed with anti-GAPDH antibody as control. All gels were run under the same experimental conditions. Uncropped images of blots/gels are shown in Supplemental Figure 6 (n = 3). (g) Insulin secretion in SKIP-overexpressed INS-1D cells measured at 2 mM and 10 mM glucose with or without 10 nM ex-4. (a–e) 12-week-old mice were used for the experiments. (a,c) #p < 0.05 SKIP−/− ex-4 vs SKIP+/+ ex-4. (b,d) *p < 0.05, **p < 0.005 SKIP−/− saline vs SKIP+/+ saline, #p < 0.05, ##p < 0.005 for different stimulated conditions in the same genotype mice. (e) n = 7–8 mice per group and 5–6 samples per group, with 10 islets per sample, *p < 0.05, **p < 0.005 vs SKIP+/+, #p < 0.05, ##p < 0.005 for different stimulated conditions in the same genotype mice of insulin secretion. (g) Data from 4 experiments are shown, *p < 0.05 vs control, #p < 0.05, ##p < 0.005 for different stimulated conditions in the same cells. All data are expressed as average ± SEM. Significance was determined by one way ANOVA with Tukey test (a–e,g) and student’s t-test (f).

www.nature.com/scientificreports/
8Scientific RepoRts | 7: 779 | DOI:10.1038/s41598-017-00900-7
Figure 6. The mechanism of SKIP-involved insulin secretion. (a) Sphingosine kinase activity from isolated islets measured at 2.8 mM and 16.7 mM glucose. (b) Insulin secretion measured at 2.8 mM, 16.7 mM glucose and 2.8 mM with 13.9 mM non-metabolic glucose (3-OMG). (c) ATP content from isolated islets measured at 2.8 mM and 16.7 mM glucose. (d) Potassium-evoked insulin secretion in isolated islets from SKIP−/− mice. Insulin secretion measured at 2.8 mM, 16.7 mM glucose and 2.8 mM with 50 mM KCl. (e) Calcium influx measured in islets from SKIP+/+ and SKIP−/− mice. (f) cAMP content in isolated islets from SKIP+/+ and SKIP−/− mice stimulated at 16.7 mM glucose for 0 min, 15 min, 60 min. (g) cAMP content in isolated islets from SKIP+/+ and SKIP−/− mice at 2.8 mM glucose with or without 10 nM ex-4. (h) Epac2 selective activator (ESCA)-stimulated insulin secretion in islets from SKIP+/+ and SKIP−/− mice. Insulin secretion measured at 2.8 mM or 16.7 mM glucose with or without 10 μM ESCA in the isolated islets. (i) PKA-dependent insulin secretion in islets from SKIP+/+ and SKIP−/− mice. Insulin secretion from isolated islets measured at 2.8 mM or 16.7 mM glucose with or without 10 nM PKI. (j) GSIS treated with 3-isobutyl-1-metylxantine (IBMX) in islets from SKIP+/+ and SKIP−/− mice. Insulin secretion was measured at 2.8 mM or 16.7 mM glucose with or without 500 μM IBMX in the isolated islets. (a–j) 12-week-old mice were used for the experiments. *p < 0.05, **p < 0.005 vs SKIP+/+, #p < 0.05, ##p < 0.005 for different stimulated conditions in the same genotype mice of insulin secretion. (a–d, h–j) n = 7–8 mice per group and 5–6 samples per group, 10 islets per sample. (e) n = 3 mice per group and 3 samples per group, 12–20 islets per sample. (f,g) n = 6–7 mice per group and 5–6 samples, 25 islets per group. Data are expressed as average ± SEM. Significance was determined by one way ANOVA with Tukey test (a–d, f–j) and student’s t-test (e).

www.nature.com/scientificreports/
9Scientific RepoRts | 7: 779 | DOI:10.1038/s41598-017-00900-7
GSIS. However, ATP content and depolarization-evoked insulin secretion did not differ between SKIP−/− mice and SKIP+/+ mice islets.
The metabolic amplifying pathway also is an important pathway for GSIS2, 3. Glucose was reported to increase insulin secretion from mouse islets lacking KATP channels, and the effect could be attributed partially to amplifi-cation of the triggering action of Ca2+. Although the mechanisms of the process are not yet clear, ATP, adenine nucleotides, and other messengers could be involved in the pathway. However, in our study, the ATP content and intracellular Ca2+ concentration did not differ between islets of SKIP+/+ mice and SKIP−/− mice. Recently sen-trin/SUMO-specific protease 1 (SENP1) and adenylosuccinate (S-AMP) signals were reported to be important for the metabolic amplifying pathway18. SENP1 knockout mice showed a decrease in GSIS without any changes in intracellular Ca2+ responses compared to wild type mice17. Addition of S-AMP to the interior of patch-clamped human β-cells was found to amplify exocytosis dependent on SENP1 expression17, 18. In our data, the amplifica-tion of GSIS in SKIP−/− mice was distinct from KATP channels and cAMP-mediated signals, implying that the metabolic amplification pathway is somehow involved in SKIP-modulated insulin secretion.
Glutamate also is a signal linking glucose metabolism and incretin/cAMP action to amplify insulin secre-tion45, 46. Glucose increases cytosolic glutamate and the cAMP/PKA signal promotes glutamate transport into insulin-containing secretory granules, leading to amplified insulin secretion46. However, in SKIP−/− islets, PKI did not affect insulin secretion despite the requirement of glucose metabolism in GSIS. Epac2A promotes insulin secretion of glutamate-containing insulin granules, but ESCA, an Epac2 selective activator, did not amplify GSIS in SKIP−/− islets. This suggests that glutamate is not a major factor in the amplification of GSIS in SKIP−/− islets.
In conclusion, SKIP is highly expressed in pancreatic β-cells but not in α-cells, and depletion of SKIP amplifies GSIS under high glucose conditions by a pathway distinct from the cAMP-, PDE- and sphingosine kinase-dependent pathways. Reduction of glucose sensitivity is pathognomonic of the β-cell defect in type 2 diabetes (T2DM)47. T2DM also is associated with reduced expression of key exocytosis proteins48, although this does not reduce depolarization-evoked exocytosis. In fact, GSIS in T2DM is more impaired than insulin secretion induced by sulfonylureas or high K+ in vitro49, 50. These findings indicate that the functional defect of β-cells lies upstream in the stimulus-secretion pathway of intracellular Ca2+ elevation and the generation of electrical activity in T2DM. To develop novel drugs for treatment of the disease, it is essential to understand the detailed processes involved in the triggering pathway, the metabolic amplifying pathway, and the neurohormonal amplifying path-way of glucose-stimulated insulin secretion. Our present data suggest that modulation of SKIP expression in the β-cells may represent a novel target for clinical treatment of T2DM.
Materials and MethodsGeneration of SKIP-mCherry knock-in mouse. We designed target vector constructs as short-mCherry-SV40polyA-loxP-Neo-loxP-long-DTA cassettes using mouse BAC clone (identification number RP23-401A20 or RP23-227N4). The F1 mice were mated with CAG-Cre mice to generate the F2 hetero mice not having the neomycin sequence, and then removed the Cre sequence by mating the F2 hetero mice with wild type mice to generate F3-SKIP+/− mice hetero mutant mice.
Animals. Animal care and procedures were approved by the Animal Care Committee of Kyoto University. The methods were carried out in accordance with the Animal Care Committee of Kyoto University. Twelve-week old male homo SKIP-mCherry knock-in (KI) mice (SKIP−/−) and wild type (SKIP+/+) littermates were used in all experiments. MIP-GFP knock-in mice were kindly provided by Dr. Minami Hara32, 33, and 12-week-old mice were used for experiments.
Islet isolationn. Mouse and rat islets were isolated using the collagenase digestion method. In brief, 0.5 mg/mL collagenase dissolved in Hanks’ balanced salt solution was injected through the bile duct into the pancreas. Then, the pancreases were manually isolated and incubated in Krebs-Ringer bicarbonate buffer (KRBB) at 37 °C for 30 min. After homogenizing the pancreas with KRBB, the islets were separated by centrifugation in Ficoll gradient. Separated islets were resuspended in KRBB on a dish and handpicked under a light microscope for the experiments that followed.
Cell lines. To examine glucose-stimulated and exendin-4-enhanced insulin secretion by overexpression or knock down of SKIP, a rat insulinoma cell line, INS-1D cells, was maintained in RPMI 1640 medium containing 11.1 mM glucose (Invitrogen) supplemented with 10% heat-inactivated FBS, 10 mM Hepes, 1 mM sodium pyru-vate, 23.8 mM sodium bicarbonate, 50 μM 2-mercaptoethanol, 100 IU/ml penicillin, and 100 μg/ml streptomycin at 37 °C in a humidified atmosphere with 5% CO2 and 95% air.
RT-PCR. Primers of target molecules were designed as follows. Mouse SKIP forward primer: 5′-ACCATGGATGTCAACTCCCGGCTT; mouse SKIP reverse primer: 5′-TTCTCTGTGATGCAGGCATC; mouse GAPDH forward primer: 5′-AACTTTGGCATTGTGGAAGG; mouse GAPDH reverse primer: 5′-ACACATTGGGGGTAGGAACA; rat SKIP forward primer: 5′-ACCATGGATGTCAACTCCCGGCTT; rat SKIP reverse primer : 5 ′-AGCT TCAACACGCTGGTCTC; rat GAPDH for ward primer : 5′-AGACAGCCGCATCTTCTTGT; rat GAPDH Reverse primer: 5′-CTTGCCGTGGGTAGAGTCAT.
Quantitative Real Time-PCR. Primers of target molecules were designed as fol-lows. Rat SKIP forward primer: 5′-AGCTGGGCATCCCAACAATC; rat SKIP reverse primer: 5′-ATCCTAGTTCCAGGAGCCAGTCAA; rat Rps18 Forward primer: 5′-AAGTTTCAGCACATCCTGCGAGTA; rat Rps18 Reverse primer: 5′-TTGGTGAGGTCAATGTCTGCTTTC; mouse SKIP forward primer: 5′-ACCATGGATGTCAACTCCCGGCTT; mouse SKIP reverse primer: 5′-GTTTTCTGACTCATCTTCCACAAAC; mouse Rps18 Forward primer: 5′-CCAGTGGTCTTGGTGTGCTGA; Mouse Rps18 Reverse primer:

www.nature.com/scientificreports/
1 0Scientific RepoRts | 7: 779 | DOI:10.1038/s41598-017-00900-7
5′-TTCTGGCCAACGGTCTAGACAAC; mCherry forward primer: 5′-CCTGTCCCCTCAGTTCATGT; mCherry reverse primer: 5′-CCCATGGTCTTCTTCTGCAT. For gene typing primer, forward primer: 5′-GTAGAGGACAAATAGAGGGTCTTCA; reverse primer: 5′-GGAGTTTGAGAGACATCACATTAGG.
Western blot. Tissue and cells protein was extracted by homogenization in lysis buffer (Sigma). Twenty micrograms of total protein were resolved by SDS-PAGE on 4–12% acrylamide gels (Invitrogen) and transferred to PVDF membranes (Invitrogen), followed by immunoblotting with antibody. Quantification of bands on west-ern blot was accomplished by scanning the blots, then determining the densities of the bands using ImageJ soft-ware (National Institutes of Health, Bethesda, Maryland, USA).
Plasmid preparation and transfection. The forward and reverse primer sequences for rat full-length SKIP were 5′-ACCATGGATGTCAA CTCCCGGCTT and 3′-TCCTAGTTCCAGGAGCCAGTCAAA, respec-tively. PCR products were inserted into pEF6/V5-His vector by TA cloning. All plasmids were sequenced and no mutations were found. pEF6/V5-His SKIP was transferred into 1 × 10⁵ INS-1D cells by Lipofectamine LTX (Invitrogen) and the cells were then cultured with antibiotic-free complete medium for 48 h for the following experiments.
Antibodies. The following antibodies were used for western blot and immunohistochemistry: guinea pig polyclonal to insulin (Abcam, ab7842); rabbit monoclonal [D16G10] to glucagon (Cell signaling, #8233); mouse monoclonal to GAPDH (Santa cruz, sc-32233); mouse monoclonal [1C51] to mCherry (Abcam, ab125096).
We generated rabbit polyclonal anti-rat SKIP (amino acid 355–369; EQGSNHRDHDATPNS) antibody (SCRUM, Japan) and anti-mouse SKIP (amino acid 248–264; KETTQEGWDYHKEKLHC) antibody (Sigma, Japan).
Immunohistochemical analysis. Rehydrated paraffin sections from pancreas samples (12-week-old SKIP+/+ mice and SKIP−/− mice) were incubated overnight at 4 °C with primary anti-mCherry antibody (1:250), anti-insulin antibody (1:100) and anti-glucagon antibody (1:200). Images of islets were obtained by confocal microscopy (LSM 510 META system- Carl Zeiss Co., Ltd., Jena, Germany) at 40x magnification.
Insulin secretion. Isolated islets were washed by KRBB containing 2.8 mM glucose, 0.2% BSA, and 10 mM Hepes (pH 7.4) and preincubated 37 °C for 1 h in the buffer. Ten islets were handpicked and exposed to four batches with different glucose concentrations (2.8 mM, 5.5 mM, 11.1 mM or 16.7 mM glucose) in 1 mL of the buffer and incubated at 37 °C for 1 h with or without 3-O-Methyl-D-glucose (non-metabolic glucose, 3-OMG) (Catalog number 135–10413, Wako, Japan), 50 mM potassium chloride (KCl) (Nacalai, Japan), 10 nM exendin-4 (ex-4, Catalog number E7144, Sigma), 10 μM Epac-selective activator 8-(4-chlorophenylthio)-2′-O-methyladenosine-3′, 5′-cyclic monophosphate, acetoxymethyl ester(ESCA, Catalog number C051, Biolog Life Science Institute), 10 nM PKA specific inhibitor myristolated PKA inhibitor (PKI, Catalog number 77-409, Invitrogen) and 500 μM non-selective phosphodiesterases (PDEs) inhibitor 3-isobutyl-1-metylxantine (IBMX, Catalog number I5879, Sigma). Insulin concentration and insulin content were measured by radioimmunoassay (Aloka Accuflex g7000; Hitachi, Tokyo, Japan). The amount of insulin secretion was normalized by cellular insu-lin content. For insulin secretion in INS-1D cells, the cells were cultured on 24-well plates coated with 0.001% poly-L-ornithine for 48 h, and washed with KRBH composed of 140 mM NaCl, 3.6 mM KCl, 0.5 mM MgSO4, 5 mM NaH2PO4, 1.5 mM CaCl2, 2 mM NaHCO3, 0.1% BSA and 10 mM Hepes (pH 7.4) with 2 mM glucose. The cells were then preincubated at 37 °C for 30 min in KRBH with 2.0 mM glucose, and further incubated at 37 °C for 30 min in KRBH with 2.0 mM or 10.0 mM glucose with or without 10 nM ex-4. Insulin concentration and insulin content were measured by radioimmunoassay. The amount of insulin secretion was normalized by the protein content.
Glucose tolerance test in mice. Twelve-week-old mice were used for intraperitoneal glucose tolerance test (IpGTT). Glucose was administered by intraperitoneal injection at the dose of 1 g/kg body weight and 2 g/kg body weight after 18 h of fasting. Blood samples were obtained at the following time intervals: 0 (fasting levels), 15, 30, 60, and 120 min. Ex-4 was administered 30 min prior to IpGTT. Blood glucose levels were measured by glucose oxidase method (Sanwa Kagaku Kenkyusho, Nagoya, Japan). Insulin was measured by insulin ELISA kit (Morinaga, Japan).
Measurement of ATP content. Isolated islets were washed with KRBB containing 2.8 mM glucose, 0.2% BSA, and 10 mM Hepes (pH 7.4) and preincubated at 37 °C for 1 h in the buffer. Ten islets were then handpicked and exposed in two batches having different glucose concentrations (2.8 mM, 16.7 mM glucose) in the buffer, and incubated at 37 °C for 1 h. The amount of ATP was measured with GLOMAX20/20 luminometer (Promega) and normalized by the protein content.
Measurement of cAMP content. Isolated islets were preincubated at 37 °C for 1 h in KRBB containing 2.8 mM glucose, 0.2% BSA, and 10 mM Hepes (pH 7.4). Twenty-five islets were handpicked and exposed in 2.8 mM glucose with or without 10 nM ex-4 and incubated at 37 °C for 1 h, or incubated at 16.7 mM glucose at 37 °C for 0 min, 15 min or 60 min. cAMP content in supernatant was measured by using Direct cAMP ELISE kit (Enabling Discovery in Life Science, ENZO). The amount of cAMP content was normalized by the number of islets.

www.nature.com/scientificreports/
1 1Scientific RepoRts | 7: 779 | DOI:10.1038/s41598-017-00900-7
Sphingosine kinase (SPHK) activity. Isolated islets were preincubated at 37 °C for 1 h in KRBB containing 2.8 mM glucose, 0.2% BSA, and 10 mM Hepes (pH 7.4). The islets were then stimulated by 2.8 mM or 16.7 mM glucose for 1 h. Lysed islets were used to measure sphingosine kinase activity using sphingosine kinase activity assay kit (Echelon). The amount of SPHK activity was normalized by the protein content.
Calcium influx. Isolated islets were loaded with 5 μm Fura-2AM (Dojindo, Japan) at 37 °C for 30 min, placed in a heat-controlled chamber on the stage of an inverted microscope kept at 37 °C, superfused with KRBB con-taining 2.8 mM glucose, 0.2% BSA, and 10 mM Hepes (pH 7.4), and subsequently exposed to the buffer con-taining 16.7 mM glucose and then to buffer containing 2.8 mM glucose with 30 mM KCl. The islets were excited successively at 340 and 380 nm, and the fluorescence emitted at 510 nm was captured by an Olympus IX-70 microscope coupled to an ImagEM camera (Hamamatsu Photonics, Hamamatsu, Japan). The images were ana-lyzed with the AQUACOSMOS analyzing system (Hamamatsu Photonics). The 340 nm (F340) and 380 nm (F380) fluorescence signals were detected every 20 seconds, and ratios (F340/F380) were calculated.
Incubator two-photon excitation microscopy. Isolated islets were cultured in RPMI 1640 with 11.1 mM glucose overnight, and observed under incubation using incubator two-photon excitation microscopy (Olympus LCV110-MPE) at 37 °C in a humidified atmosphere (5% CO2 and 95% air). Two-photon excitation was effected at 1040 nm, the mCherry fluorescence was measured at 575–650 nm, the GFP fluorescence was measured at 515–560 nm, and negative control fluorescence was measured at 460–495 nm. Digital images (512 × 512 pixels) were taken and analyzed using IMARIS software.
Statistics. Statistical analysis was performed with JMP software (Japan); all results are expressed as aver-ages ± standard errors of the mean (SEM). Where appropriate, one way analysis of variance (ANOVA) with Tukey test or student t-test was used to calculate difference between groups. P-values < 0.05 were considered statistically significant*, P-values < 0.005 were considered extremely significant**.
References 1. Rorsman, P. & Braun, M. Regulation of insulin secretion in human pancreatic islets. Annu Rev Physiol 75, 155–79 (2013). 2. Henquin, J. C. Triggering and amplifying pathways of regulation of insulin secretion by glucose. Diabetes 49, 1751–1760 (2000). 3. Henquin, J. C. Regulation of insulin secretion: A matter of phase control and amplitude modulation. Diabetologia 52, 739–751 (2009). 4. Inagaki, N. et al. Reconstitution of IKATP: an inward rectifier subunit plus the sulfonylurea receptor. Science 270, 1166–1170 (1995). 5. Bryan, J., Crane, A., Vila-Carriles, W. H., Babenko, A. P. & Aguilar-Bryan, L. Insulin secretagogues, sulfonylurea receptors and
K(ATP) channels. Curr Pharm Des 11, 2699–2716 (2005). 6. Ashcroft, F. M. & Rorsman, P. K(ATP) channels and islet hormone secretion: new insights and controversies. Nat Rev Endocrinol 9,
660–9 (2013). 7. Ashcroft, F. M. & Rorsman, P. Diabetes mellitus and b cell: The last ten years. Cell 148, 1160–1171 (2012). 8. Henquin, J. C., Ravier, M. A., Nenquin, M., Jonas, J. C. & Gilon, P. Hierarchy of the beta-cell signals controlling insulin secretion. Eur
J Clin Invest 33, 742–750 (2003). 9. Nenquin, M., Szollosi, A., Aguilar-Bryan, L., Bryan, J. & Henquin, J. C. Both triggering and amplifying pathways contribute to fuel-
induced insulin secretion in the absence of sulfonylurea receptor-1 in pancreatic b-cells. J Biol Chem 279, 32316–32324 (2004). 10. Henquin, J. C. ATP-sensitive K+ channels may control glucose-induced electrical activity in pancreatic B-cells. Biochem Biophys Res
Commun 156, 769–775 (1988). 11. Detimary, P., Gilon, P., Nenquin, M. & Henquin, J. C. Two sites of glucose control of insulin release with distinct dependence on the
energy state in pancreatic B-cells. The Biochemical J 297, 455–61 (1994). 12. Ivarsson, R., Quintens, R., Dejonghe, S., Tsukamoto, K. & In’t Veld, P. Redox control of exocytosis: Regulatory role of NADPH,
thioredoxin, and glutaredoxin. Diabetes 54, 2132–2142 (2005). 13. Jensen, M. V. et al. Metabolic cycling in control of glucose-stimulated insulin secretion. American journal of physiology. Endocrinol
Metab 295, E1287–E1297 (2008). 14. Panten, U. & Rustenbeck, I. Fuel-induced amplification of insulin secretion in mouse pancreatic islets exposed to a high sulfonylurea
concentration: role of the NADPH/NADP+ ratio. Diabetologia 51, 101–109 (2008). 15. Rutter, G. A. & Leclerc, I. The AMP-regulated kinase family: Enigmatic targets for diabetes therapy. Mol Cell Endocrinol 297, 41–49 (2009). 16. Vergari, E., Plummer, G., Dai, X. & MacDonald, P. E. DeSUMOylation Controls Insulin Exocytosis in Response to Metabolic Signals.
Biomolecules 2, 269–281 (2012). 17. Ferdaoussi, M. et al. Isocitrate-to-SENP1 signaling amplifies insulin secretion and rescues dysfunctional β cells. J Clin Invest 125,
3847–3860 (2015). 18. Gooding, J. R. et al. Adenylosuccinate is an insulin secretagogue derived from glucose-induced purine metabolism. Cell Rep 13,
157–167 (2015). 19. Szecowka, J., Grill, V., Sandberg, E. & Efendic, S. Effect of GIP on the secretion of insulin and somatostatin and the accumulation of
cyclic AMP in vitro in the rat. Acta Endocrinol (Copenh) 99, 416–421 (1982). 20. Drucker, D. J., Philippe, J., Mojsov, S., Chick, W. L. & Habener, J. F. Glucagon-like peptide I stimulates insulin gene expression and
increases cyclic AMP levels in a rat islet cell line. Pro Natl Acad Sci USA 84, 3434–8 (1987). 21. Seino, S. & Shibasaki, T. PKA-dependent and PKA-independent pathways for cAMP-regulated exocytosis. Physiol Rev 85,
1303–1342 (2005). 22. Eliasson, L. et al. SUR1 regulates PKA-independent cAMP-induced granule priming in mouse pancreatic B-cells. J Gen Physiol 121,
181–97 (2003). 23. Kashima, Y. et al. Critical Role of cAMP-GEFII Rim2 Complex in Incretin-potentiated Insulin Secretion*. J Biol Chem 276,
46046–46053 (2001). 24. Chepurny, O. & Kelley, G. PKA-dependent potentiation of glucose-stimulated insulin secretion by Epac activator 8-pCPT-2-O-Me-
cAMP-AM in human islets of Langerhans. Am J Physiol Endocrinol Metab 298, E622–E633 (2010). 25. Shibasaki, T. et al. Essential role of Epac2/Rap1 signaling in regulation of insulin granule dynamics by cAMP. Pro Natl Acad Sci USA
104 (2007). 26. Lacaná, E., Maceyka, M., Milstien, S. & Spiegel, S. Cloning and characterization of a protein kinase A anchoring protein (AKAP)-
related protein that interacts with and regulates sphingosine kinase 1 activity. J Biol Chem 277, 32947–32953 (2002). 27. Scholten, A. et al. Analysis of the cGMP/cAMP interactome using a chemical proteomics approach in mammalian heart tissue validates
sphingosine kinase type 1-interacting protein as a genuine and highly abundant AKAP. J Proteome Res 5, 1435–1447 (2006).

www.nature.com/scientificreports/
1 2Scientific RepoRts | 7: 779 | DOI:10.1038/s41598-017-00900-7
28. Kovanich, D. et al. Sphingosine kinase interacting protein is an A-kinase anchoring protein specific for type I cAMP-dependent protein kinase. Chembiochem 11, 963–971 (2010).
29. Means, C. K. et al. An entirely specific type I A-kinase anchoring protein that can sequester two molecules of protein kinase A at mitochondria. Pro Natl Acad Sci USA 108, E1227–35 (2011).
30. Michel, J. J. C. & Scott, J. D. AKAP mediated signal transduction. Annu Rev Pharmacol Toxicol 42, 235–257 (2002). 31. Wong, W. & Scott, J. D. AKAP signalling complexes: focal points in space and time. Nat Rev Mol Cell Biol 5, 959–970 (2004). 32. Hara, M. et al. Transgenic mice with green fluorescent protein-labeled pancreatic beta-cells. Am J Physiol Endocrinol Metab 284,
E177–E183 (2003). 33. Katsuta, H. et al. Subpopulations of GFP-marked mouse pancreatic b-cells differ in size, granularity, and insulin secretion.
Endocrinology 153, 5180–5187 (2012). 34. Cantrell Stanford, J. et al. Sphingosine 1-phosphate (S1P) regulates glucose-stimulated insulin secretion in pancreatic beta cells. J
Biol Chem 287, 13457–64 (2012). 35. Lester, L. B., Langeberg, L. K. & Scott, J. D. Anchoring of protein kinase A facilitates hormone-mediated insulin secretion. Pro Natl
Acad Sci USA 94, 14942–14947 (1997). 36. Fraser, L. D. C. et al. A novel lipid-anchored A-kinase anchoring protein facilitates cAMP-responsive membrane events. EMBO J 17,
2261–2272 (1998). 37. Faruque, O. & Le-Nguyen, D. Cell-permeable peptide-based disruption of endogenous PKA-AKAP complexes: a tool for studying
the molecular roles of AKAP-mediated PKA subcellular. Am J Physiol Cell Physiol 296, C306–C316 (2009). 38. Song, W. J. et al. Snapin mediates incretin action and augments glucose-dependent insulin secretion. Cell Metab 13, 308–319 (2011). 39. Maurice, D. H., Ke, H., Ahmad, F., Wang, Y. & Chung, J. Advances in targeting cyclic nucleotide phosphodiesterases. Nat Rev Drug
Discov 13, 290–314 (2014). 40. Wierup, N. et al. b-Cell-targeted overexpression of phosphodiesterase 3B in mice causes impaired insulin secretion, glucose
intolerance, and deranged islet morphology*. J Biol Chem 279, 15214–15222 (2004). 41. Waddleton, D. et al. Phosphodiesterase 3 and 4 comprise the major cAMP metabolizing enzymes responsible for insulin secretion
in INS-1 (832/13) cells and rat islets. Biochem Pharmacol 76, 884–893 (2008). 42. Manganiello, V. C., Stenson, L., Heimann, E., Jones, H. A. & Resjo, S. Expression and regulation of cyclic nucleotide
phosphodiesterases in human and rat pancreatic islets. PLoS One 5, 1–8 (2010). 43. Tian, G. et al. Role of phosphodiesterases in the shaping of sub-plasma-membrane cAMP oscillations and pulsatile insulin secretion.
J Cell Sci 5084–5095 (2012). 44. Seino, S., Shibasaki, T. & Minami, K. Dynamics of insulin secretion and the clinical implications for obesity and diabetes. J Clin
Invest 121, 2118–2125 (2011). 45. Maechler, P. & Wollheim, C. B. Mitochondrial glutamate acts as a messenger in glucose-induced insulin exocytosis. Nature 402,
685–689 (1999). 46. Gheni, G. et al. Glutamate acts as a key signal linking glucose metabolism to incretin/cAMP action to amplify insulin secretion. Cell
Rep 9, 661–673 (2014). 47. Leibowitz, G., Kaiser, N. & Cerasi, E. β-Cell failure in type 2 diabetes. J Diabetes Investig 2, 82–91 (2011). 48. Ostenson, C., Gaisano, H., Sheu, L., Tibell, A. & Bartfai, T. Impaired gene and protein expression of exocytotic soluble N-ethylmaleimide
attachment protein receptor complex proteins in pancreatic islets of type 2 diabetic patients. Diabetes 55, 435–440 (2006). 49. Del Guerra, S. et al. Functional and molecular defects of pancreatic islets in human type 2 diabetes. Diabetes 54, 727–735 (2005). 50. Deng, S. et al. Structural and Functional Abnormalities in the Islets Isolated From Type 2 Diabetic Subjects. Diabetes 53, 624–632 (2004).
AcknowledgementsThis work was supported by Japan Society for the Promotion of Sciences (JSPS) KAKENHI Grant Number 24591325 and 15K09384. We thank Prof. Shimpei Fujimoto (Kochi University) for helpful advice to guide our manuscript. Incubator two-photon excitation microscopy analysis using Olympus LCV110-MPE was performed at the Fluorescent Live Imaging Core Facility of Medical Research Support Center, Graduate School of Medicine, Kyoto University, and was supported by Platform for Drug Discovery, Informatics, and Structural Life Science from the Ministry of Education, Culture, Sport, Science and Technology, Japan.
Author ContributionsY.W. and S.H. designed and performed all the experiments, contributed to discussion, and wrote, reviewed, and edited the manuscript. Y.L. researched data and contributed to discussion. R.U. confirmed experiments for insulin secretion and performed the calcium influx. N.I. contributed to discussion and wrote, reviewed, and edited the manuscript. S.H. and N.I. are the guarantors of this work and, as such, have full access to all the data in the study and take responsibility for the integrity of the data and the accuracy of the data analysis. All authors reviewed the manuscript.
Additional InformationSupplementary information accompanies this paper at doi:10.1038/s41598-017-00900-7Competing Interests: The authors declare that they have no competing interests.Publisher's note: Springer Nature remains neutral with regard to jurisdictional claims in published maps and institutional affiliations.
Open Access This article is licensed under a Creative Commons Attribution 4.0 International License, which permits use, sharing, adaptation, distribution and reproduction in any medium or
format, as long as you give appropriate credit to the original author(s) and the source, provide a link to the Cre-ative Commons license, and indicate if changes were made. The images or other third party material in this article are included in the article’s Creative Commons license, unless indicated otherwise in a credit line to the material. If material is not included in the article’s Creative Commons license and your intended use is not per-mitted by statutory regulation or exceeds the permitted use, you will need to obtain permission directly from the copyright holder. To view a copy of this license, visit http://creativecommons.org/licenses/by/4.0/. © The Author(s) 2017