title hydrothermal reactions of formaldehyde and formic
TRANSCRIPT
RIGHT:
URL:
CITATION:
AUTHOR(S):
ISSUE DATE:
TITLE:
Hydrothermal reactions offormaldehyde and formic acid:Free-energy analysis of equilibrium
Matubayasi, N; Nakahara, M
Matubayasi, N ...[et al]. Hydrothermal reactions of formaldehyde and formic acid: Free-energy analysis of equilibrium. JOURNAL OF CHEMICAL PHYSICS 2005, 122(7): 074509.
2005-02-15
http://hdl.handle.net/2433/50355
Copyright 2005 American Institute of Physics. This article may bedownloaded for personal use only. Any other use requires priorpermission of the author and the American Institute of Physics.
Hydrothermal reactions of formaldehyde and formic acid:Free-energy analysis of equilibrium
Nobuyuki Matubayasia! and Masaru NakaharaInstitute for Chemical Research, Kyoto University, Uji, Kyoto 611-0011, Japan
sReceived 2 November 2004; accepted 23 November 2004; published online 10 February 2005d
The chemical equilibria concerning formaldehyde and formic acid are computationally investigatedin water over a wide range of thermodynamic conditions. The free energy is evaluated in the methodof energy representation for the solvent effect on the decomposition processes of these twocompounds. The solvation is found to suppress the production of nonpolar species from a polar. Inthe two competitive decomposition reactions of formic acid, the solvent strongly inhibits thedecarboxylationsHCOOH→CO2+H2d and its effect is relatively weak for the decarbonylationsHCOOH→CO+H2Od. The equilibrium weights for the two decomposition pathways of formicacid are determined by the equilibrium constant of the water-gas-shift reactionsCO+H2O→CO2
+H2d, which is an essential and useful process in fuel technology. The reaction control by thesolvent is then examined for the water-gas-shift reaction. Through the comparison of the equilibriumconstants in the absence and presence of solvent, even the favorable side of the reaction is shownto be tuned by the solvent density and temperature. The reaction equilibrium is further treated foraldehyde disproportionation reactions involving formaldehyde and formic acid. Thedisproportionation reactions are found to be subject to relatively weak solvent effects and to bedominated by the electronic contribution. ©2005 American Institute of Physics.fDOI: 10.1063/1.1849165g
I. INTRODUCTION
Water is potentially a useful medium for organic chemi-cal reactions.1,2At ambient conditions, however, the utility ofwater as a reaction medium is restricted by the low solubilityof organic compounds. Supercritical and subcritical water isa promising medium to overcome this restriction. When thetemperature is elevated and the density is not too high, watermixes well with organic compounds and often acts in a re-action both as an environment and as a reactant.3–8A distinc-tive feature of supercritical and subcritical water is the avail-ability of a wide range of density and temperature, and therole of water in an organic chemical reaction may be stronglydependent on the thermodynamic state. The reaction controlin hydrothermal conditions is then possible only by clarify-ing the effect of the aqueous medium at the molecular level.Especially, the role of water in simplest organic reactions isthe first subject to be investigated in detail toward a system-atic construction of hydrothermal organic chemistry.
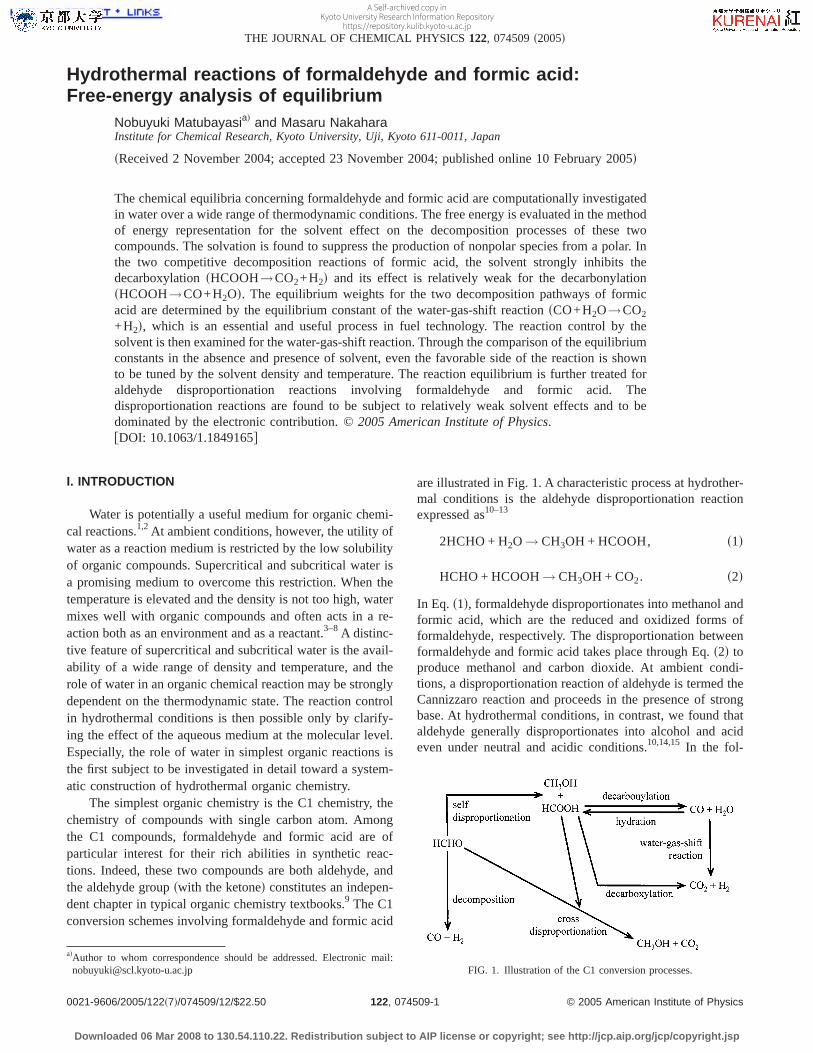
The simplest organic chemistry is the C1 chemistry, thechemistry of compounds with single carbon atom. Amongthe C1 compounds, formaldehyde and formic acid are ofparticular interest for their rich abilities in synthetic reac-tions. Indeed, these two compounds are both aldehyde, andthe aldehyde groupswith the ketoned constitutes an indepen-dent chapter in typical organic chemistry textbooks.9 The C1conversion schemes involving formaldehyde and formic acid
are illustrated in Fig. 1. A characteristic process at hydrother-mal conditions is the aldehyde disproportionation reactionexpressed as10–13
2HCHO + H2O → CH3OH + HCOOH, s1d
HCHO + HCOOH→ CH3OH + CO2. s2d
In Eq. s1d, formaldehyde disproportionates into methanol andformic acid, which are the reduced and oxidized forms offormaldehyde, respectively. The disproportionation betweenformaldehyde and formic acid takes place through Eq.s2d toproduce methanol and carbon dioxide. At ambient condi-tions, a disproportionation reaction of aldehyde is termed theCannizzaro reaction and proceeds in the presence of strongbase. At hydrothermal conditions, in contrast, we found thataldehyde generally disproportionates into alcohol and acideven under neutral and acidic conditions.10,14,15 In the fol-
adAuthor to whom correspondence should be addressed. Electronic mail:[email protected] FIG. 1. Illustration of the C1 conversion processes.
THE JOURNAL OF CHEMICAL PHYSICS122, 074509s2005d
0021-9606/2005/122~7!/074509/12/$22.50 © 2005 American Institute of Physics122, 074509-1
Downloaded 06 Mar 2008 to 130.54.110.22. Redistribution subject to AIP license or copyright; see http://jcp.aip.org/jcp/copyright.jsp
A Self-archived copy inKyoto University Research Information Repository
https://repository.kulib.kyoto-u.ac.jp
lowing, we call Eqs. s1d and s2d the self- and cross-disproportionation reactions, respectively, in accordance withthe number of reactant aldehyde species involved. Anotherreactions of importance in Fig. 1 are the decompositions offormaldehyde and formic acid through
HCHO→ CO + H2, s3d
HCOOH→ CO + H2O, s4d
HCOOH→ CO2 + H2. s5d
Equationss4d and s5d represent two competitive pathwaysfor formic acid and generate carbon monoxide and carbondioxide, respectively.11,16–19In a recent series of papers, weshowed that the competition between the decarbonylationsdehydrationd and decarboxylationsdehydrogenationd of for-mic acid depends delicately on the condition of the systemand that the decarbonylation is reversible in hydrothermalcondition.19,20 Formic acid is then a key intermediate of thewater-gas-shift reaction20–26 given by
CO + H2O → CO2 + H2, s6d
and its usage is suggested as a “chemical reservoir” for aclean fuel, H2.
In the present work, we focus on the equilibrium con-stants of C1 reactions in water over a wide range of thermo-dynamic conditions. We evaluate the solvation free energiesof the species in Fig. 1, and elucidate the effect of solventdensity and temperature on the equilibria of the C1conversions.27 As shown in Fig. 1, nonpolar and polar com-pounds are involved in the conversion schemes. In supercriti-cal water, a general tendency was reported for the solvationfree energiessexcess chemical potentialsd of various types ofsolutes.28 The solvation free energy of a nonpolar solute is asteeply increasing function of the solvent density. When thesolute is polar, on the other hand, the solvation free energy isnot a monotonic function of the density. It decreases in thelow-density region, and the dependence is reversed in thehigh-density region with a minimum in the medium-densityregion. We construct the equilibrium constant in solution bycombining the solvation free energies of the species of inter-est with their standard free energies of formation in the ab-sence of solvent. A quantitative treatment is then required forthe solvation free energy since its difference between thereactant and product sides describes the solvent effect on theequilibrium constant in solution.
When the temperature is high, the reversibility is oftenattained for a chemical reaction and the thermodynamic con-dition can be designed to control the yields of desired spe-cies. Toward this control, the key information is the equilib-rium constant as a function of the thermodynamic condition.The equilibrium constant is notorious, however, for its diffi-culty of experimental determination, especially at extremeconditions. A theoretical-computational method is then in-valuable for the analysis and design of a chemical process ifit is accurate and efficient. Once the equilibrium constant issystematically constructed over a wide range of thermody-namic conditions, the reaction control by the solvent will bepossible for a reversible process in solution.
In order to explore a wide range of thermodynamic con-ditions, we calculate the solvation free energy using themethod of energy representation developed in previousworks.28–31 In the method of energy representation, the sol-vation free energy is provided exactly to second order insolvent density and its accuracy as an approximation is wellestablished for both supercritical and ambient aqueous solu-tions. Since the approximate method needs the simulationsonly at the initial and final states of the process of soluteinsertion, its computational cost is much smaller compared tothat in thesformally exactd free energy perturbation or ther-modynamic integration method.32 Thus, the method of en-ergy representation is suitable for studying the solvation ef-fect over an extensive set of thermodynamic states includingsupercritical. In the present work, the solvation free energiesof the reactive species appearing in Fig. 1 are computation-ally obtained at hydrothermal conditions. The solvent effecton the equilibrium constants is then determined for the reac-tions expressed as Eqs.s1d–s6d, and the dependence on thessolventd density and temperature is discussed in connectionto the interaction with the solvent water.
II. THEORETICAL BACKGROUND
A chemical reaction is a conversion of a set of reactantspecies into a set of product species. To approach the equi-librium constant, the explicit treatment is necessary only forthe reactant and product species. When the overall positionand orientation is fixed for theith reactive species, we letE0i
denote its intramolecular free energy at isolationsin the ab-sence of solventd and Dmi describe the solvent effect in thechemical potential.33 In the present work, we assume that theelectronic structure and molecular geometry of the reactivespeciesssoluted are not coupled with the solvent degrees offreedom. In this approximation,Dmi is the solvation freeenergy evaluated under theseffectived solute-solvent interac-tion, with an appropriate correction toE0i if needed.27 Withinthe classical statistical mechanics, the solvation free energyDm is expressed as
exps− bDmd =e dX exph− bfVsXd + UsXdgj
e dX expf− bUsXdg, s7d
whereX represents the solvent configuration collectively, thesolute-solvent and solvent-solvent interaction energies areVsXd and UsXd, respectively, andb is the inverse ofkBTwith the Boltzmann constantkB and the temperatureT.
When the molarity of theith reactive species isri andthe stoichiometric coefficient isni, the condition of chemicalequilibrium is written as
oi:product
nifE0i + Dmi + kBT lnsri/lidg
= oi:reactant
nifE0i + Dmi + kBT lnsri/lidg, s8d
whereli is the contribution from the overall translational androtational energy of theith species. In the classical approxi-mation for the overall translation and rotation,l is given by
074509-2 N. Matubayasi and M. Nakahara J. Chem. Phys. 122, 074509 ~2005!
Downloaded 06 Mar 2008 to 130.54.110.22. Redistribution subject to AIP license or copyright; see http://jcp.aip.org/jcp/copyright.jsp
A Self-archived copy inKyoto University Research Information Repository
https://repository.kulib.kyoto-u.ac.jp
l =5S2pMkBT
h2 D3/28p2IkBT
sh2 for linear molecule,
S2pMkBT
h2 D3/2Îp
spS8p2IkBT
h2 D1/2
for nonlinear molecule,6 s9d
with the symmetry numbers, the total massM, the momentof inertia I of the molecule, and the Planck constanth. Theproduct of Eq.s9d is taken over the rotational degrees offreedom, andI may vary with the rotational degree. Theequilibrium constantK in the molarity unit is then expressedas34
K =pi:product
rini
pi:reactantri
ni=
pi:productli
ni
pi:reactantli
niexpf− bsDE0 + DWdg,
s10d
whereDE0 andDW are introduced, respectively, as
DE0 = oi:product
niE0i − oi:reactant
niE0i , s11d
DW= oi:product
niDmi − oi:reactant
niDmi . s12d
In Eq. s10d, the preexponential factor carries the dimensionof the equilibrium constantK and depends only on the tem-peratureT. Since the intramolecular free energy of the reac-tive species is assumed to be unaffected by the presence ofsolvent, the density dependence ofK is solely determined bythe differenceDW in the sum of the solvation free energiesbetween the reactant and product sides. In the present treat-ment, the reactive species is considered to be either at infinitedilution or coincident with the solvent species. In this case,Kdepends only on the solvent density and temperature. Evenwhen the solvent molecule appears as a reactive species, it ispresent in excess in the system and does not violate the va-lidity of Eq. s10d as an expression for the equilibriumconstant.35
To highlight the solvent effect on the reaction equilib-rium, it is convenient to rewrite Eq.s10d as
K = K0 exps− bDWd, s13d
whereK0 is defined as
K0 =pi:product
lini
pi:reactantli
niexps− bDE0d. s14d
K0 is the equilibrium constant of the reaction in the absenceof solvent at the temperature of interest. It can be obtainedfrom a handbook of thermodynamics with an appropriateconversion of the concentration units into molarity.34
III. COMPUTATIONAL PROCEDURES
The solvent is water. The water molecule was treated asrigid and nonpolarizable, and the SPC/E model was adopted
as the intermolecular potential function between watermolecules.36 The thermodynamic states of interest are speci-fied by the water density and temperature and are listed inTable I. Below the critical temperature, two groups of ther-modynamic states were examined. In one of the groups, thetemperature is varied at a fixed density of 1.00 g/cm3, and inthe other, the system is on the liquid branch of thesexperi-mentald saturation curve of H2O.37 Above the critical tem-perature, the thermodynamic state was explored at a fixedtemperature of 400 °C over a wide density range in Table I.
The solutes are formaldehydesHCHOd, formic acidsHCOOHd, methanol sCH3OHd, water sH2Od, hydrogensH2d, carbon monoxidesCOd, and carbon dioxidesCO2d.They appear as the reactive species in Fig. 1 and Eqs.s1d–s6d. The intermolecular interaction was assumed to bepairwise additive and was described with Coulombic andLennard-Jones terms. The molecular geometry and the po-tential parametersspartial charges and Lennard-Jonese andsd for HCHO were set to those given in Ref. 38. When thesolute is HCOOH, thecis geometry in the notation of Ref. 39was adoptedsin which the carbonyl O and the hydroxy H areon the same sided and the revised potential parameter set inRef. 40 was employed. At the transition state of the formicacid decomposition, the structure of the formic acid-watercomplex was a focus of previous works.41–43 In the presentwork, HCOOH is either an initial or final species in the re-action and its most stable geometry was explicitly treated.The parameters for CH3OH and H2 were taken from Refs. 44and 45, respectively. Note that a single-site Lennard-Jonesinteraction was used for the H2 molecule. CO and CO2 weredescribed as two- and three-site molecules, respectively, andthe interaction sites were placed at the C and O positions.The C–O bond length was fixed at the gas-phase experimen-tal value of 1.128 Å for CO and 1.160 Å for CO2.
46 TheLennard-Jonese ands for the C and O sites were set at theEPM values in Table I of Ref. 47, and the charge on theoxygen site was 0.02 for CO and −0.32 for CO2 in the unit ofelementary charge. These charges were determined to repro-duce the gas-phase experimental dipole46 and quadrupole48
moments, respectively, and the charge neutrality led to thevalue of the C-site charge. The Lennard-Jones part of thesolute-water potential function was then constructed by thestandard Lorentz–Berthelot combining rule.49
For each solute and at each thermodynamic state, MonteCarlo simulations of the solution and pure solvent systemswere conducted in the canonical ensemble. In the simulationof the solution system, the standard Metropolis samplingscheme was implemented by locating one solute molecule ofinterest and 500 water molecules in a cubic unit cell.32 Thesimulation length was 500 K passes, where one pass corre-
074509-3 Hydrothermal reactions J. Chem. Phys. 122, 074509 ~2005!
Downloaded 06 Mar 2008 to 130.54.110.22. Redistribution subject to AIP license or copyright; see http://jcp.aip.org/jcp/copyright.jsp
A Self-archived copy inKyoto University Research Information Repository
https://repository.kulib.kyoto-u.ac.jp
sponds to the generation of 500 configurations, and themethod of preferential sampling was not adopted. The peri-odic boundary condition was employed in the minimum im-age convention, and the electrostatic potential was handledby the Ewald method with the surrounding medium of infi-nite dielectric constant. The screening parameter was then setto 5/L, whereL is the length of the unit cell, and 514 recip-rocal lattice vectors were used. The truncation atL /2 wasapplied on the site-site basis to the real-space part of theelectrostatic interaction in the Ewald method and theLennard-Jones part of the intermolecular interaction. Tosimulate the pure solvent system, 500 water molecules werelocated in a cubic unit cell and were sampled for 100 Kpasses with the Metropolis scheme. The size of the unit cellwas identical to that of the corresponding simulation of thesolution system consisting of one solute molecule and 500water molecules, and the boundary condition and Ewald sumparameters were the same as those for the solution system.The solvation free energy was then approximately evaluatedin the method of energy representation according to the pro-cedure presented in previous papers.28,30
IV. RESULTS AND DISCUSSION
A. Solvation free energy
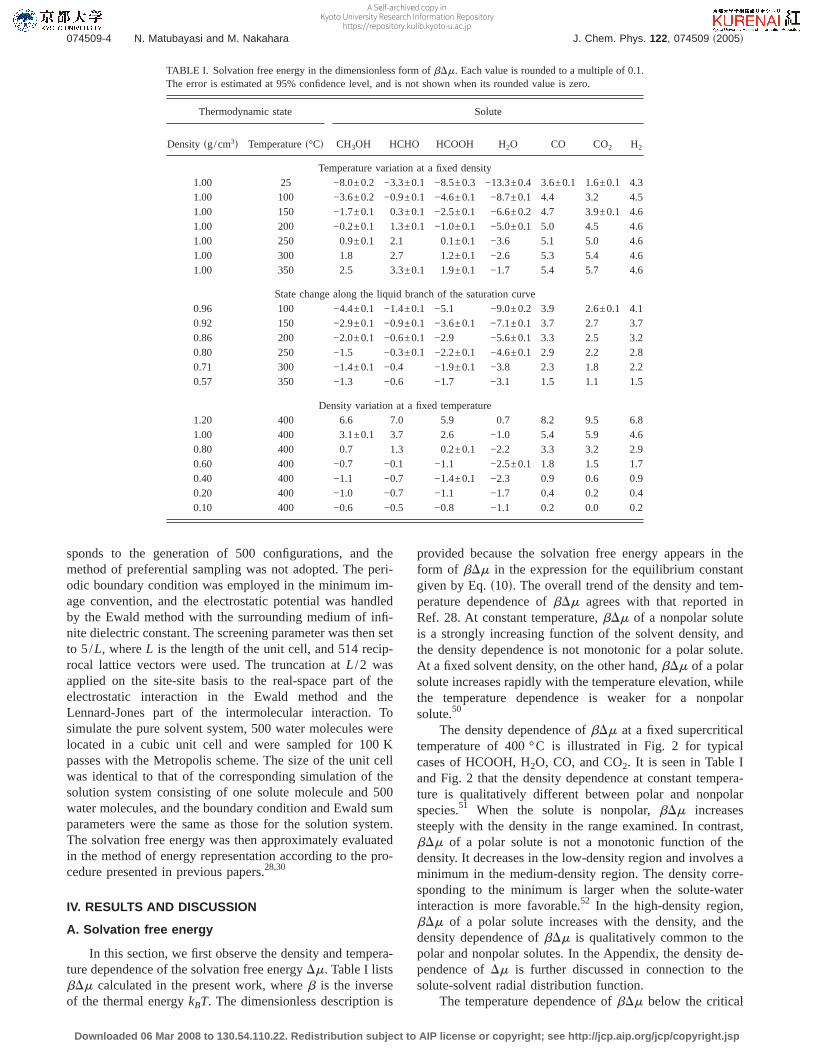
In this section, we first observe the density and tempera-ture dependence of the solvation free energyDm. Table I listsbDm calculated in the present work, whereb is the inverseof the thermal energykBT. The dimensionless description is
provided because the solvation free energy appears in theform of bDm in the expression for the equilibrium constantgiven by Eq.s10d. The overall trend of the density and tem-perature dependence ofbDm agrees with that reported inRef. 28. At constant temperature,bDm of a nonpolar soluteis a strongly increasing function of the solvent density, andthe density dependence is not monotonic for a polar solute.At a fixed solvent density, on the other hand,bDm of a polarsolute increases rapidly with the temperature elevation, whilethe temperature dependence is weaker for a nonpolarsolute.50
The density dependence ofbDm at a fixed supercriticaltemperature of 400 °C is illustrated in Fig. 2 for typicalcases of HCOOH, H2O, CO, and CO2. It is seen in Table Iand Fig. 2 that the density dependence at constant tempera-ture is qualitatively different between polar and nonpolarspecies.51 When the solute is nonpolar,bDm increasessteeply with the density in the range examined. In contrast,bDm of a polar solute is not a monotonic function of thedensity. It decreases in the low-density region and involves aminimum in the medium-density region. The density corre-sponding to the minimum is larger when the solute-waterinteraction is more favorable.52 In the high-density region,bDm of a polar solute increases with the density, and thedensity dependence ofbDm is qualitatively common to thepolar and nonpolar solutes. In the Appendix, the density de-pendence ofDm is further discussed in connection to thesolute-solvent radial distribution function.
The temperature dependence ofbDm below the critical
TABLE I. Solvation free energy in the dimensionless form ofbDm. Each value is rounded to a multiple of 0.1.The error is estimated at 95% confidence level, and is not shown when its rounded value is zero.
Thermodynamic state Solute
Density sg/cm3d Temperatures°Cd CH3OH HCHO HCOOH H2O CO CO2 H2
Temperature variation at a fixed density1.00 25 −8.0±0.2 −3.3±0.1 −8.5±0.3 −13.3±0.4 3.6±0.1 1.6±0.1 4.31.00 100 −3.6±0.2 −0.9±0.1 −4.6±0.1 −8.7±0.1 4.4 3.2 4.51.00 150 −1.7±0.1 0.3±0.1 −2.5±0.1 −6.6±0.2 4.7 3.9±0.1 4.61.00 200 −0.2±0.1 1.3±0.1 −1.0±0.1 −5.0±0.1 5.0 4.5 4.61.00 250 0.9±0.1 2.1 0.1±0.1 −3.6 5.1 5.0 4.61.00 300 1.8 2.7 1.2±0.1 −2.6 5.3 5.4 4.61.00 350 2.5 3.3±0.1 1.9±0.1 −1.7 5.4 5.7 4.6
State change along the liquid branch of the saturation curve0.96 100 −4.4±0.1 −1.4±0.1 −5.1 −9.0±0.2 3.9 2.6±0.1 4.10.92 150 −2.9±0.1 −0.9±0.1 −3.6±0.1 −7.1±0.1 3.7 2.7 3.70.86 200 −2.0±0.1 −0.6±0.1 −2.9 −5.6±0.1 3.3 2.5 3.20.80 250 −1.5 −0.3±0.1 −2.2±0.1 −4.6±0.1 2.9 2.2 2.80.71 300 −1.4±0.1 −0.4 −1.9±0.1 −3.8 2.3 1.8 2.20.57 350 −1.3 −0.6 −1.7 −3.1 1.5 1.1 1.5
Density variation at a fixed temperature1.20 400 6.6 7.0 5.9 0.7 8.2 9.5 6.81.00 400 3.1±0.1 3.7 2.6 −1.0 5.4 5.9 4.60.80 400 0.7 1.3 0.2±0.1 −2.2 3.3 3.2 2.90.60 400 −0.7 −0.1 −1.1 −2.5±0.1 1.8 1.5 1.70.40 400 −1.1 −0.7 −1.4±0.1 −2.3 0.9 0.6 0.90.20 400 −1.0 −0.7 −1.1 −1.7 0.4 0.2 0.40.10 400 −0.6 −0.5 −0.8 −1.1 0.2 0.0 0.2
074509-4 N. Matubayasi and M. Nakahara J. Chem. Phys. 122, 074509 ~2005!
Downloaded 06 Mar 2008 to 130.54.110.22. Redistribution subject to AIP license or copyright; see http://jcp.aip.org/jcp/copyright.jsp
A Self-archived copy inKyoto University Research Information Repository
https://repository.kulib.kyoto-u.ac.jp
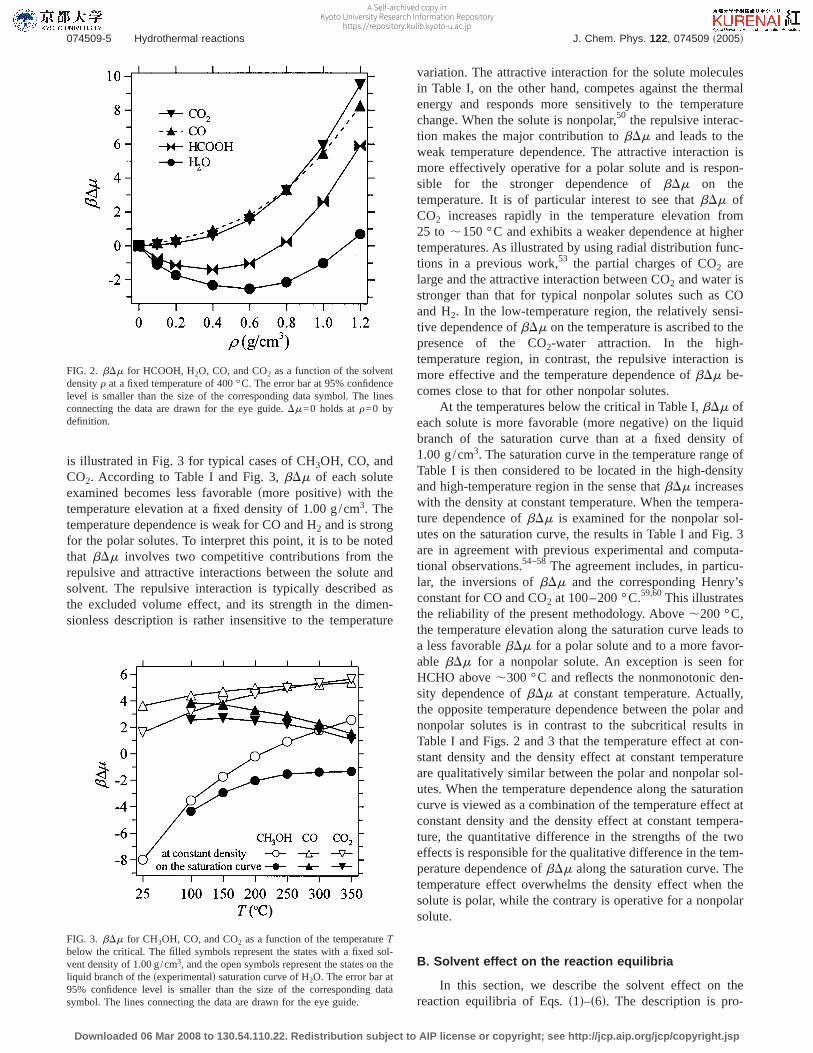
is illustrated in Fig. 3 for typical cases of CH3OH, CO, andCO2. According to Table I and Fig. 3,bDm of each soluteexamined becomes less favorablesmore positived with thetemperature elevation at a fixed density of 1.00 g/cm3. Thetemperature dependence is weak for CO and H2 and is strongfor the polar solutes. To interpret this point, it is to be notedthat bDm involves two competitive contributions from therepulsive and attractive interactions between the solute andsolvent. The repulsive interaction is typically described asthe excluded volume effect, and its strength in the dimen-sionless description is rather insensitive to the temperature
variation. The attractive interaction for the solute moleculesin Table I, on the other hand, competes against the thermalenergy and responds more sensitively to the temperaturechange. When the solute is nonpolar,50 the repulsive interac-tion makes the major contribution tobDm and leads to theweak temperature dependence. The attractive interaction ismore effectively operative for a polar solute and is respon-sible for the stronger dependence ofbDm on thetemperature. It is of particular interest to see thatbDm ofCO2 increases rapidly in the temperature elevation from25 to ,150 °C and exhibits a weaker dependence at highertemperatures. As illustrated by using radial distribution func-tions in a previous work,53 the partial charges of CO2 arelarge and the attractive interaction between CO2 and water isstronger than that for typical nonpolar solutes such as COand H2. In the low-temperature region, the relatively sensi-tive dependence ofbDm on the temperature is ascribed to thepresence of the CO2-water attraction. In the high-temperature region, in contrast, the repulsive interaction ismore effective and the temperature dependence ofbDm be-comes close to that for other nonpolar solutes.
At the temperatures below the critical in Table I,bDm ofeach solute is more favorablesmore negatived on the liquidbranch of the saturation curve than at a fixed density of1.00 g/cm3. The saturation curve in the temperature range ofTable I is then considered to be located in the high-densityand high-temperature region in the sense thatbDm increaseswith the density at constant temperature. When the tempera-ture dependence ofbDm is examined for the nonpolar sol-utes on the saturation curve, the results in Table I and Fig. 3are in agreement with previous experimental and computa-tional observations.54–58 The agreement includes, in particu-lar, the inversions ofbDm and the corresponding Henry’sconstant for CO and CO2 at 100–200 °C.59,60This illustratesthe reliability of the present methodology. Above,200 °C,the temperature elevation along the saturation curve leads toa less favorablebDm for a polar solute and to a more favor-able bDm for a nonpolar solute. An exception is seen forHCHO above,300 °C and reflects the nonmonotonic den-sity dependence ofbDm at constant temperature. Actually,the opposite temperature dependence between the polar andnonpolar solutes is in contrast to the subcritical results inTable I and Figs. 2 and 3 that the temperature effect at con-stant density and the density effect at constant temperatureare qualitatively similar between the polar and nonpolar sol-utes. When the temperature dependence along the saturationcurve is viewed as a combination of the temperature effect atconstant density and the density effect at constant tempera-ture, the quantitative difference in the strengths of the twoeffects is responsible for the qualitative difference in the tem-perature dependence ofbDm along the saturation curve. Thetemperature effect overwhelms the density effect when thesolute is polar, while the contrary is operative for a nonpolarsolute.
B. Solvent effect on the reaction equilibria
In this section, we describe the solvent effect on thereaction equilibria of Eqs.s1d–s6d. The description is pro-
FIG. 2. bDm for HCOOH, H2O, CO, and CO2 as a function of the solventdensityr at a fixed temperature of 400 °C. The error bar at 95% confidencelevel is smaller than the size of the corresponding data symbol. The linesconnecting the data are drawn for the eye guide.Dm=0 holds atr=0 bydefinition.
FIG. 3. bDm for CH3OH, CO, and CO2 as a function of the temperatureTbelow the critical. The filled symbols represent the states with a fixed sol-vent density of 1.00 g/cm3, and the open symbols represent the states on theliquid branch of thesexperimentald saturation curve of H2O. The error bar at95% confidence level is smaller than the size of the corresponding datasymbol. The lines connecting the data are drawn for the eye guide.
074509-5 Hydrothermal reactions J. Chem. Phys. 122, 074509 ~2005!
Downloaded 06 Mar 2008 to 130.54.110.22. Redistribution subject to AIP license or copyright; see http://jcp.aip.org/jcp/copyright.jsp
A Self-archived copy inKyoto University Research Information Repository
https://repository.kulib.kyoto-u.ac.jp
vided in terms of a free-energy changeDW introduced by Eq.s12d. We present the dependence ofbDW on the ssolventddensity and temperature. The dimensionless presentation isadopted since the equilibrium constant given by Eq.s10dinvolves the solvent effect in the form ofbDW.
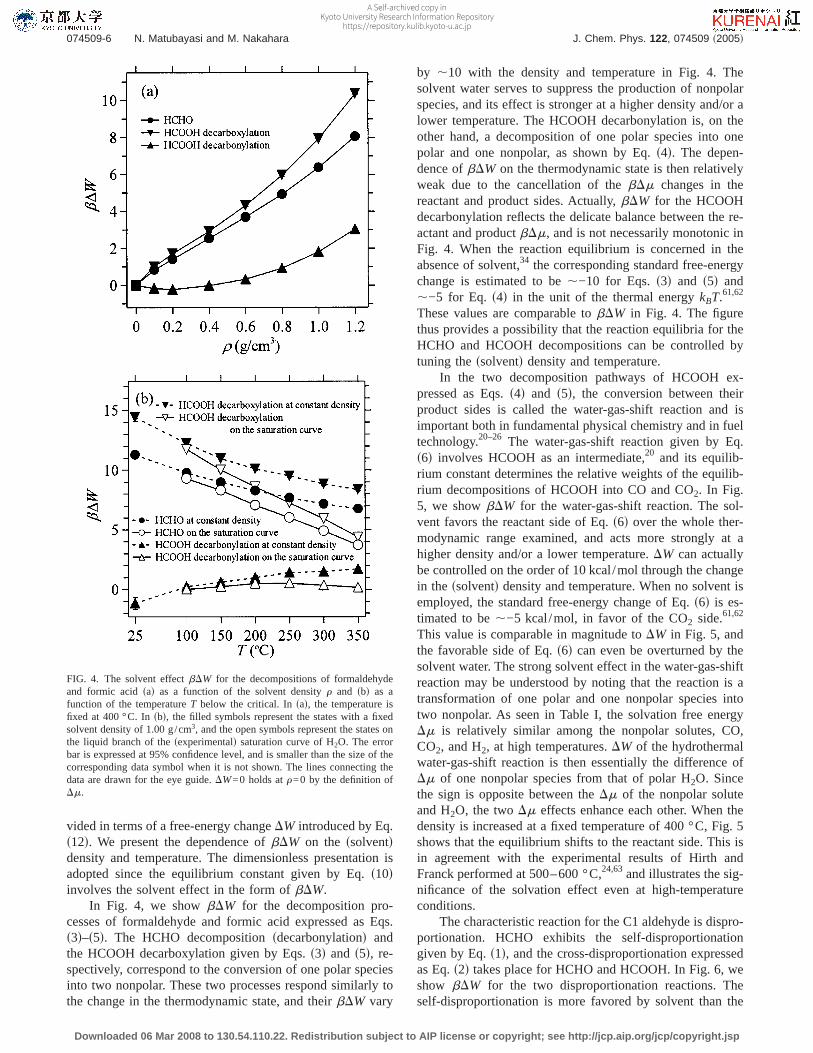
In Fig. 4, we showbDW for the decomposition pro-cesses of formaldehyde and formic acid expressed as Eqs.s3d–s5d. The HCHO decompositionsdecarbonylationd andthe HCOOH decarboxylation given by Eqs.s3d and s5d, re-spectively, correspond to the conversion of one polar speciesinto two nonpolar. These two processes respond similarly tothe change in the thermodynamic state, and theirbDW vary
by ,10 with the density and temperature in Fig. 4. Thesolvent water serves to suppress the production of nonpolarspecies, and its effect is stronger at a higher density and/or alower temperature. The HCOOH decarbonylation is, on theother hand, a decomposition of one polar species into onepolar and one nonpolar, as shown by Eq.s4d. The depen-dence ofbDW on the thermodynamic state is then relativelyweak due to the cancellation of thebDm changes in thereactant and product sides. Actually,bDW for the HCOOHdecarbonylation reflects the delicate balance between the re-actant and productbDm, and is not necessarily monotonic inFig. 4. When the reaction equilibrium is concerned in theabsence of solvent,34 the corresponding standard free-energychange is estimated to be,−10 for Eqs.s3d and s5d and,−5 for Eq. s4d in the unit of the thermal energykBT.61,62
These values are comparable tobDW in Fig. 4. The figurethus provides a possibility that the reaction equilibria for theHCHO and HCOOH decompositions can be controlled bytuning thessolventd density and temperature.
In the two decomposition pathways of HCOOH ex-pressed as Eqs.s4d and s5d, the conversion between theirproduct sides is called the water-gas-shift reaction and isimportant both in fundamental physical chemistry and in fueltechnology.20–26 The water-gas-shift reaction given by Eq.s6d involves HCOOH as an intermediate,20 and its equilib-rium constant determines the relative weights of the equilib-rium decompositions of HCOOH into CO and CO2. In Fig.5, we showbDW for the water-gas-shift reaction. The sol-vent favors the reactant side of Eq.s6d over the whole ther-modynamic range examined, and acts more strongly at ahigher density and/or a lower temperature.DW can actuallybe controlled on the order of 10 kcal/mol through the changein the ssolventd density and temperature. When no solvent isemployed, the standard free-energy change of Eq.s6d is es-timated to be,−5 kcal/mol, in favor of the CO2 side.61,62
This value is comparable in magnitude toDW in Fig. 5, andthe favorable side of Eq.s6d can even be overturned by thesolvent water. The strong solvent effect in the water-gas-shiftreaction may be understood by noting that the reaction is atransformation of one polar and one nonpolar species intotwo nonpolar. As seen in Table I, the solvation free energyDm is relatively similar among the nonpolar solutes, CO,CO2, and H2, at high temperatures.DW of the hydrothermalwater-gas-shift reaction is then essentially the difference ofDm of one nonpolar species from that of polar H2O. Sincethe sign is opposite between theDm of the nonpolar soluteand H2O, the twoDm effects enhance each other. When thedensity is increased at a fixed temperature of 400 °C, Fig. 5shows that the equilibrium shifts to the reactant side. This isin agreement with the experimental results of Hirth andFranck performed at 500–600 °C,24,63and illustrates the sig-nificance of the solvation effect even at high-temperatureconditions.
The characteristic reaction for the C1 aldehyde is dispro-portionation. HCHO exhibits the self-disproportionationgiven by Eq.s1d, and the cross-disproportionation expressedas Eq.s2d takes place for HCHO and HCOOH. In Fig. 6, weshow bDW for the two disproportionation reactions. Theself-disproportionation is more favored by solvent than the
FIG. 4. The solvent effectbDW for the decompositions of formaldehydeand formic acidsad as a function of the solvent densityr and sbd as afunction of the temperatureT below the critical. Insad, the temperature isfixed at 400 °C. Insbd, the filled symbols represent the states with a fixedsolvent density of 1.00 g/cm3, and the open symbols represent the states onthe liquid branch of thesexperimentald saturation curve of H2O. The errorbar is expressed at 95% confidence level, and is smaller than the size of thecorresponding data symbol when it is not shown. The lines connecting thedata are drawn for the eye guide.DW=0 holds atr=0 by the definition ofDm.
074509-6 N. Matubayasi and M. Nakahara J. Chem. Phys. 122, 074509 ~2005!
Downloaded 06 Mar 2008 to 130.54.110.22. Redistribution subject to AIP license or copyright; see http://jcp.aip.org/jcp/copyright.jsp
A Self-archived copy inKyoto University Research Information Repository
https://repository.kulib.kyoto-u.ac.jp
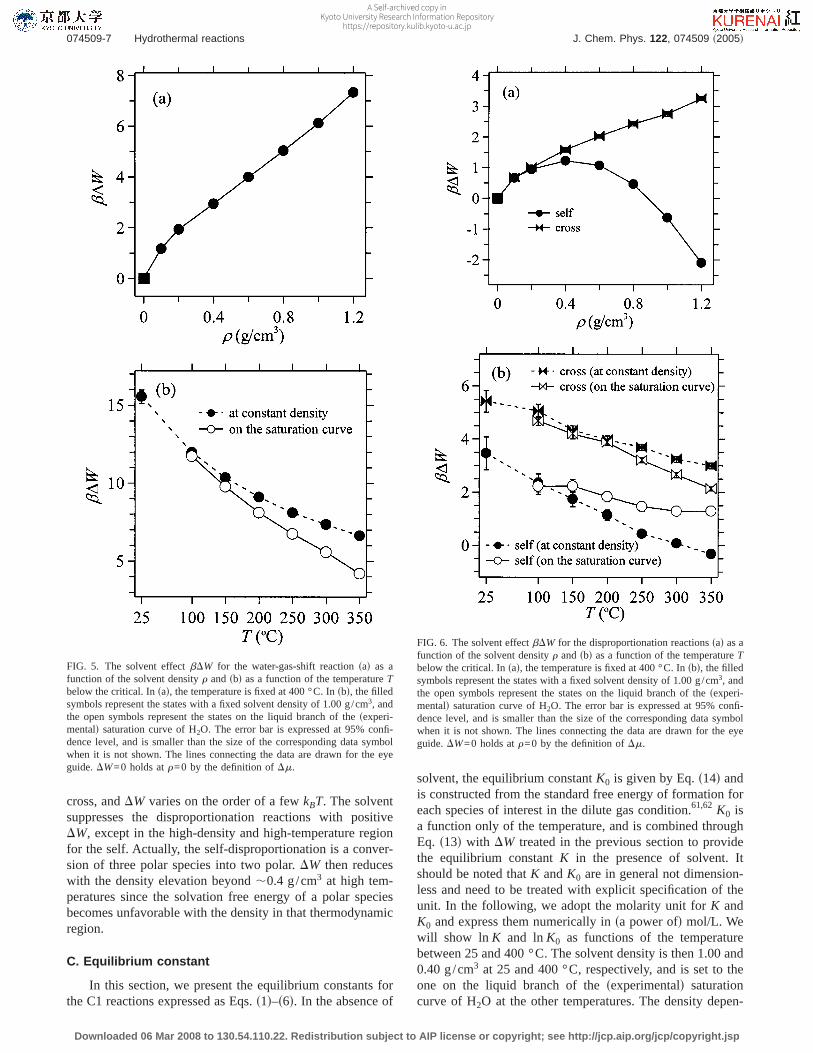
cross, andDW varies on the order of a fewkBT. The solventsuppresses the disproportionation reactions with positiveDW, except in the high-density and high-temperature regionfor the self. Actually, the self-disproportionation is a conver-sion of three polar species into two polar.DW then reduceswith the density elevation beyond,0.4 g/cm3 at high tem-peratures since the solvation free energy of a polar speciesbecomes unfavorable with the density in that thermodynamicregion.
C. Equilibrium constant
In this section, we present the equilibrium constants forthe C1 reactions expressed as Eqs.s1d–s6d. In the absence of
solvent, the equilibrium constantK0 is given by Eq.s14d andis constructed from the standard free energy of formation foreach species of interest in the dilute gas condition.61,62 K0 isa function only of the temperature, and is combined throughEq. s13d with DW treated in the previous section to providethe equilibrium constantK in the presence of solvent. Itshould be noted thatK andK0 are in general not dimension-less and need to be treated with explicit specification of theunit. In the following, we adopt the molarity unit forK andK0 and express them numerically insa power ofd mol/L. Wewill show ln K and lnK0 as functions of the temperaturebetween 25 and 400 °C. The solvent density is then 1.00 and0.40 g/cm3 at 25 and 400 °C, respectively, and is set to theone on the liquid branch of thesexperimentald saturationcurve of H2O at the other temperatures. The density depen-
FIG. 5. The solvent effectbDW for the water-gas-shift reactionsad as afunction of the solvent densityr andsbd as a function of the temperatureTbelow the critical. Insad, the temperature is fixed at 400 °C. Insbd, the filledsymbols represent the states with a fixed solvent density of 1.00 g/cm3, andthe open symbols represent the states on the liquid branch of thesexperi-mentald saturation curve of H2O. The error bar is expressed at 95% confi-dence level, and is smaller than the size of the corresponding data symbolwhen it is not shown. The lines connecting the data are drawn for the eyeguide.DW=0 holds atr=0 by the definition ofDm.
FIG. 6. The solvent effectbDW for the disproportionation reactionssad as afunction of the solvent densityr andsbd as a function of the temperatureTbelow the critical. Insad, the temperature is fixed at 400 °C. Insbd, the filledsymbols represent the states with a fixed solvent density of 1.00 g/cm3, andthe open symbols represent the states on the liquid branch of thesexperi-mentald saturation curve of H2O. The error bar is expressed at 95% confi-dence level, and is smaller than the size of the corresponding data symbolwhen it is not shown. The lines connecting the data are drawn for the eyeguide.DW=0 holds atr=0 by the definition ofDm.
074509-7 Hydrothermal reactions J. Chem. Phys. 122, 074509 ~2005!
Downloaded 06 Mar 2008 to 130.54.110.22. Redistribution subject to AIP license or copyright; see http://jcp.aip.org/jcp/copyright.jsp
A Self-archived copy inKyoto University Research Information Repository
https://repository.kulib.kyoto-u.ac.jp
dence of lnK will not be shown explicitly since it is solelycarried bybDW and is parallel to the density dependence of−bDW with an offset of lnK0.
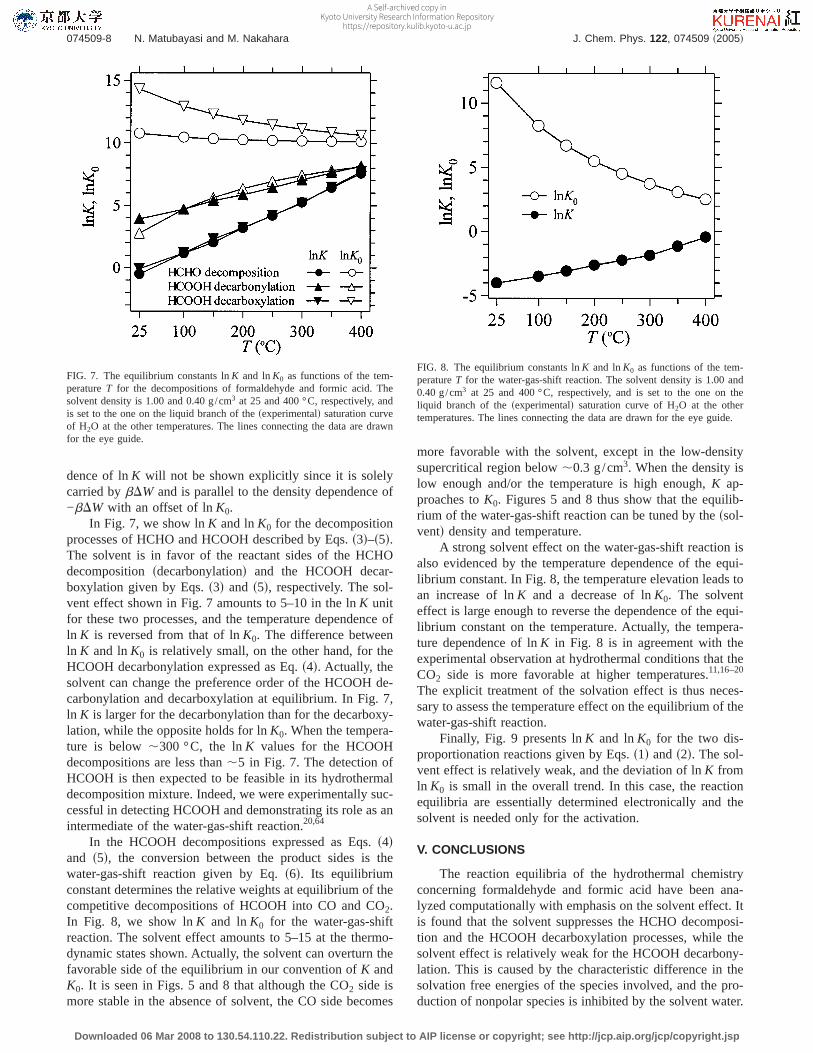
In Fig. 7, we show lnK and lnK0 for the decompositionprocesses of HCHO and HCOOH described by Eqs.s3d–s5d.The solvent is in favor of the reactant sides of the HCHOdecompositionsdecarbonylationd and the HCOOH decar-boxylation given by Eqs.s3d and s5d, respectively. The sol-vent effect shown in Fig. 7 amounts to 5–10 in the lnK unitfor these two processes, and the temperature dependence ofln K is reversed from that of lnK0. The difference betweenln K and lnK0 is relatively small, on the other hand, for theHCOOH decarbonylation expressed as Eq.s4d. Actually, thesolvent can change the preference order of the HCOOH de-carbonylation and decarboxylation at equilibrium. In Fig. 7,ln K is larger for the decarbonylation than for the decarboxy-lation, while the opposite holds for lnK0. When the tempera-ture is below,300 °C, the lnK values for the HCOOHdecompositions are less than,5 in Fig. 7. The detection ofHCOOH is then expected to be feasible in its hydrothermaldecomposition mixture. Indeed, we were experimentally suc-cessful in detecting HCOOH and demonstrating its role as anintermediate of the water-gas-shift reaction.20,64
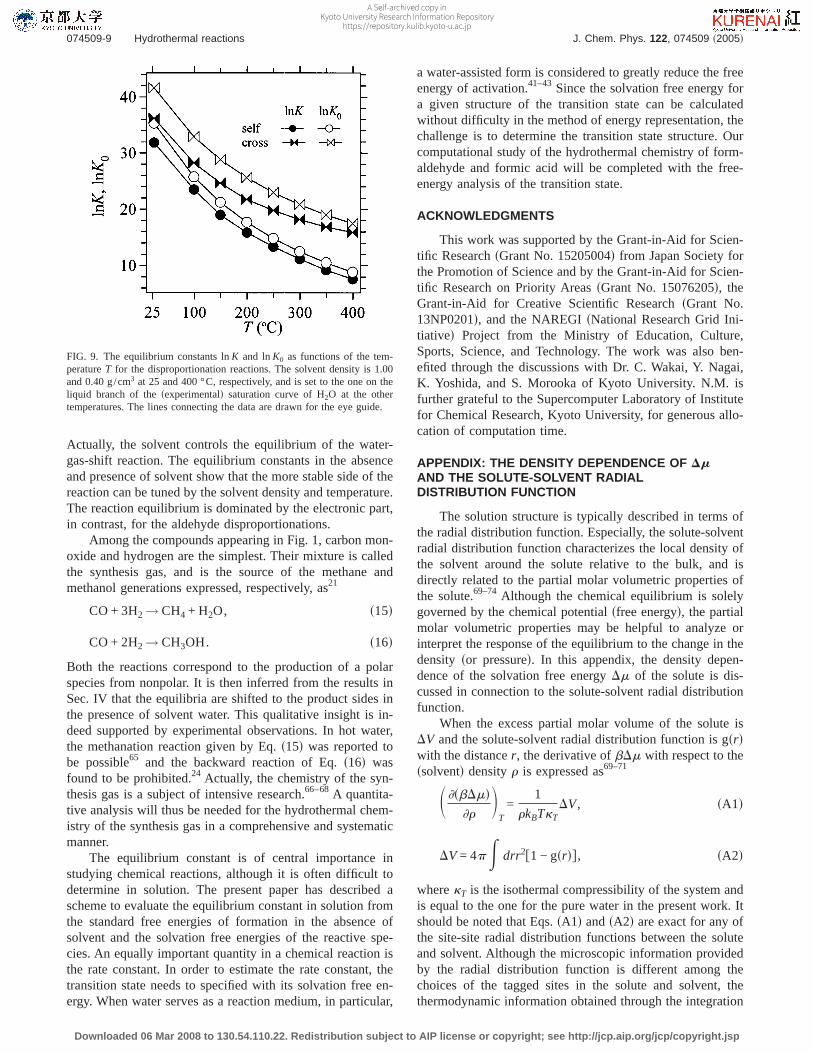
In the HCOOH decompositions expressed as Eqs.s4dand s5d, the conversion between the product sides is thewater-gas-shift reaction given by Eq.s6d. Its equilibriumconstant determines the relative weights at equilibrium of thecompetitive decompositions of HCOOH into CO and CO2.In Fig. 8, we show lnK and lnK0 for the water-gas-shiftreaction. The solvent effect amounts to 5–15 at the thermo-dynamic states shown. Actually, the solvent can overturn thefavorable side of the equilibrium in our convention ofK andK0. It is seen in Figs. 5 and 8 that although the CO2 side ismore stable in the absence of solvent, the CO side becomes
more favorable with the solvent, except in the low-densitysupercritical region below,0.3 g/cm3. When the density islow enough and/or the temperature is high enough,K ap-proaches toK0. Figures 5 and 8 thus show that the equilib-rium of the water-gas-shift reaction can be tuned by thessol-ventd density and temperature.
A strong solvent effect on the water-gas-shift reaction isalso evidenced by the temperature dependence of the equi-librium constant. In Fig. 8, the temperature elevation leads toan increase of lnK and a decrease of lnK0. The solventeffect is large enough to reverse the dependence of the equi-librium constant on the temperature. Actually, the tempera-ture dependence of lnK in Fig. 8 is in agreement with theexperimental observation at hydrothermal conditions that theCO2 side is more favorable at higher temperatures.11,16–20
The explicit treatment of the solvation effect is thus neces-sary to assess the temperature effect on the equilibrium of thewater-gas-shift reaction.
Finally, Fig. 9 presents lnK and lnK0 for the two dis-proportionation reactions given by Eqs.s1d ands2d. The sol-vent effect is relatively weak, and the deviation of lnK fromln K0 is small in the overall trend. In this case, the reactionequilibria are essentially determined electronically and thesolvent is needed only for the activation.
V. CONCLUSIONS
The reaction equilibria of the hydrothermal chemistryconcerning formaldehyde and formic acid have been ana-lyzed computationally with emphasis on the solvent effect. Itis found that the solvent suppresses the HCHO decomposi-tion and the HCOOH decarboxylation processes, while thesolvent effect is relatively weak for the HCOOH decarbony-lation. This is caused by the characteristic difference in thesolvation free energies of the species involved, and the pro-duction of nonpolar species is inhibited by the solvent water.
FIG. 7. The equilibrium constants lnK and lnK0 as functions of the tem-peratureT for the decompositions of formaldehyde and formic acid. Thesolvent density is 1.00 and 0.40 g/cm3 at 25 and 400 °C, respectively, andis set to the one on the liquid branch of thesexperimentald saturation curveof H2O at the other temperatures. The lines connecting the data are drawnfor the eye guide.
FIG. 8. The equilibrium constants lnK and lnK0 as functions of the tem-peratureT for the water-gas-shift reaction. The solvent density is 1.00 and0.40 g/cm3 at 25 and 400 °C, respectively, and is set to the one on theliquid branch of thesexperimentald saturation curve of H2O at the othertemperatures. The lines connecting the data are drawn for the eye guide.
074509-8 N. Matubayasi and M. Nakahara J. Chem. Phys. 122, 074509 ~2005!
Downloaded 06 Mar 2008 to 130.54.110.22. Redistribution subject to AIP license or copyright; see http://jcp.aip.org/jcp/copyright.jsp
A Self-archived copy inKyoto University Research Information Repository
https://repository.kulib.kyoto-u.ac.jp
Actually, the solvent controls the equilibrium of the water-gas-shift reaction. The equilibrium constants in the absenceand presence of solvent show that the more stable side of thereaction can be tuned by the solvent density and temperature.The reaction equilibrium is dominated by the electronic part,in contrast, for the aldehyde disproportionations.
Among the compounds appearing in Fig. 1, carbon mon-oxide and hydrogen are the simplest. Their mixture is calledthe synthesis gas, and is the source of the methane andmethanol generations expressed, respectively, as21
CO + 3H2 → CH4 + H2O, s15d
CO + 2H2 → CH3OH. s16d
Both the reactions correspond to the production of a polarspecies from nonpolar. It is then inferred from the results inSec. IV that the equilibria are shifted to the product sides inthe presence of solvent water. This qualitative insight is in-deed supported by experimental observations. In hot water,the methanation reaction given by Eq.s15d was reported tobe possible65 and the backward reaction of Eq.s16d wasfound to be prohibited.24 Actually, the chemistry of the syn-thesis gas is a subject of intensive research.66–68A quantita-tive analysis will thus be needed for the hydrothermal chem-istry of the synthesis gas in a comprehensive and systematicmanner.
The equilibrium constant is of central importance instudying chemical reactions, although it is often difficult todetermine in solution. The present paper has described ascheme to evaluate the equilibrium constant in solution fromthe standard free energies of formation in the absence ofsolvent and the solvation free energies of the reactive spe-cies. An equally important quantity in a chemical reaction isthe rate constant. In order to estimate the rate constant, thetransition state needs to specified with its solvation free en-ergy. When water serves as a reaction medium, in particular,
a water-assisted form is considered to greatly reduce the freeenergy of activation.41–43 Since the solvation free energy fora given structure of the transition state can be calculatedwithout difficulty in the method of energy representation, thechallenge is to determine the transition state structure. Ourcomputational study of the hydrothermal chemistry of form-aldehyde and formic acid will be completed with the free-energy analysis of the transition state.
ACKNOWLEDGMENTS
This work was supported by the Grant-in-Aid for Scien-tific ResearchsGrant No. 15205004d from Japan Society forthe Promotion of Science and by the Grant-in-Aid for Scien-tific Research on Priority AreassGrant No. 15076205d, theGrant-in-Aid for Creative Scientific ResearchsGrant No.13NP0201d, and the NAREGIsNational Research Grid Ini-tiatived Project from the Ministry of Education, Culture,Sports, Science, and Technology. The work was also ben-efited through the discussions with Dr. C. Wakai, Y. Nagai,K. Yoshida, and S. Morooka of Kyoto University. N.M. isfurther grateful to the Supercomputer Laboratory of Institutefor Chemical Research, Kyoto University, for generous allo-cation of computation time.
APPENDIX: THE DENSITY DEPENDENCE OF DmAND THE SOLUTE-SOLVENT RADIALDISTRIBUTION FUNCTION
The solution structure is typically described in terms ofthe radial distribution function. Especially, the solute-solventradial distribution function characterizes the local density ofthe solvent around the solute relative to the bulk, and isdirectly related to the partial molar volumetric properties ofthe solute.69–74 Although the chemical equilibrium is solelygoverned by the chemical potentialsfree energyd, the partialmolar volumetric properties may be helpful to analyze orinterpret the response of the equilibrium to the change in thedensity sor pressured. In this appendix, the density depen-dence of the solvation free energyDm of the solute is dis-cussed in connection to the solute-solvent radial distributionfunction.
When the excess partial molar volume of the solute isDV and the solute-solvent radial distribution function is gsrdwith the distancer, the derivative ofbDm with respect to thessolventd densityr is expressed as69–71
S ]sbDmd]r
DT
=1
rkBTkTDV, sA1d
DV = 4pE drr2f1 − gsrdg, sA2d
wherekT is the isothermal compressibility of the system andis equal to the one for the pure water in the present work. Itshould be noted that Eqs.sA1d andsA2d are exact for any ofthe site-site radial distribution functions between the soluteand solvent. Although the microscopic information providedby the radial distribution function is different among thechoices of the tagged sites in the solute and solvent, thethermodynamic information obtained through the integration
FIG. 9. The equilibrium constants lnK and lnK0 as functions of the tem-peratureT for the disproportionation reactions. The solvent density is 1.00and 0.40 g/cm3 at 25 and 400 °C, respectively, and is set to the one on theliquid branch of thesexperimentald saturation curve of H2O at the othertemperatures. The lines connecting the data are drawn for the eye guide.
074509-9 Hydrothermal reactions J. Chem. Phys. 122, 074509 ~2005!
Downloaded 06 Mar 2008 to 130.54.110.22. Redistribution subject to AIP license or copyright; see http://jcp.aip.org/jcp/copyright.jsp
A Self-archived copy inKyoto University Research Information Repository
https://repository.kulib.kyoto-u.ac.jp
of Eq. sA2d is identical.rkBTkT is a dimensionless expres-sion for the compressibility and approaches unity in the limitof zero densitysideal gas limitd. Since rkBTkT is alwayspositive, the sign of Eq.sA1d is coincident with that ofDV.According to Eq.sA2d, the region ofr in which the localdensity is larger than in the bulkfgsrd.1g contributes nega-tively to DV, and the region in which gsrd,1 contributespositively. It should be noted that whilefgsrd−1g at largerbecomes small in amplitude, its weight is enhanced due tothe 4pr2 factor in the integral.
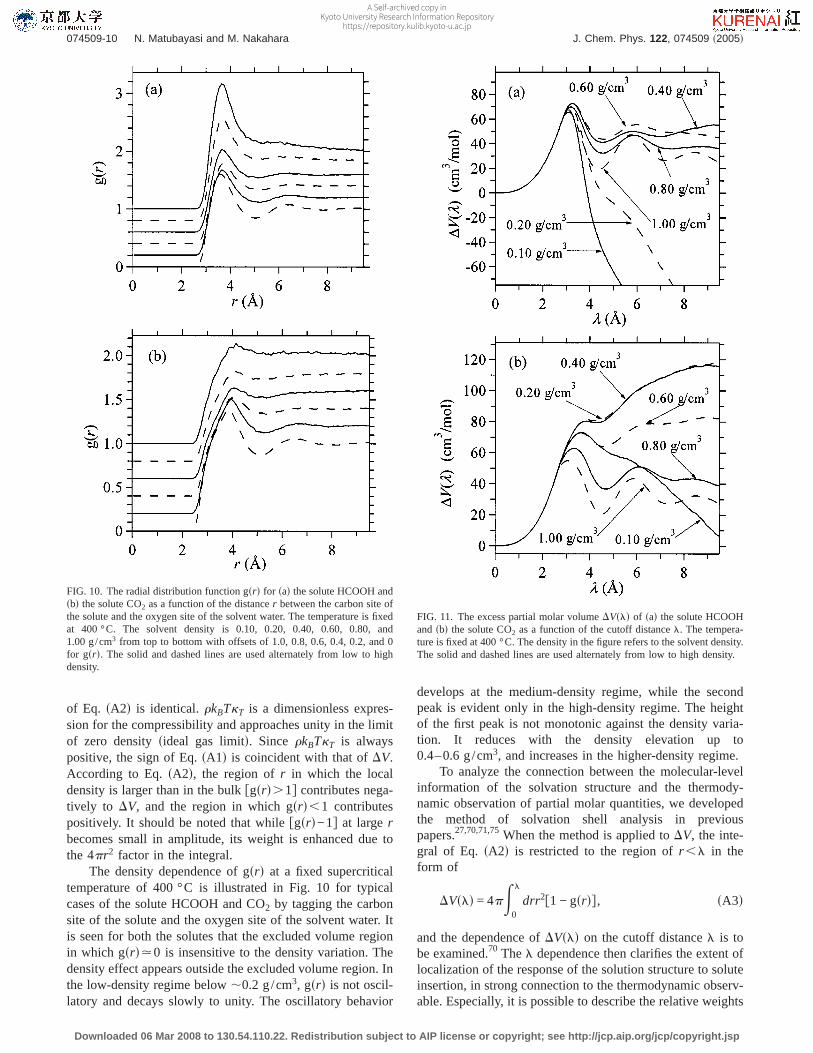
The density dependence of gsrd at a fixed supercriticaltemperature of 400 °C is illustrated in Fig. 10 for typicalcases of the solute HCOOH and CO2 by tagging the carbonsite of the solute and the oxygen site of the solvent water. Itis seen for both the solutes that the excluded volume regionin which gsrd.0 is insensitive to the density variation. Thedensity effect appears outside the excluded volume region. Inthe low-density regime below,0.2 g/cm3, gsrd is not oscil-latory and decays slowly to unity. The oscillatory behavior
develops at the medium-density regime, while the secondpeak is evident only in the high-density regime. The heightof the first peak is not monotonic against the density varia-tion. It reduces with the density elevation up to0.4–0.6 g/cm3, and increases in the higher-density regime.
To analyze the connection between the molecular-levelinformation of the solvation structure and the thermody-namic observation of partial molar quantities, we developedthe method of solvation shell analysis in previouspapers.27,70,71,75When the method is applied toDV, the inte-gral of Eq. sA2d is restricted to the region ofr ,l in theform of
DVsld = 4pE0
l
drr2f1 − gsrdg, sA3d
and the dependence ofDVsld on the cutoff distancel is tobe examined.70 Thel dependence then clarifies the extent oflocalization of the response of the solution structure to soluteinsertion, in strong connection to the thermodynamic observ-able. Especially, it is possible to describe the relative weights
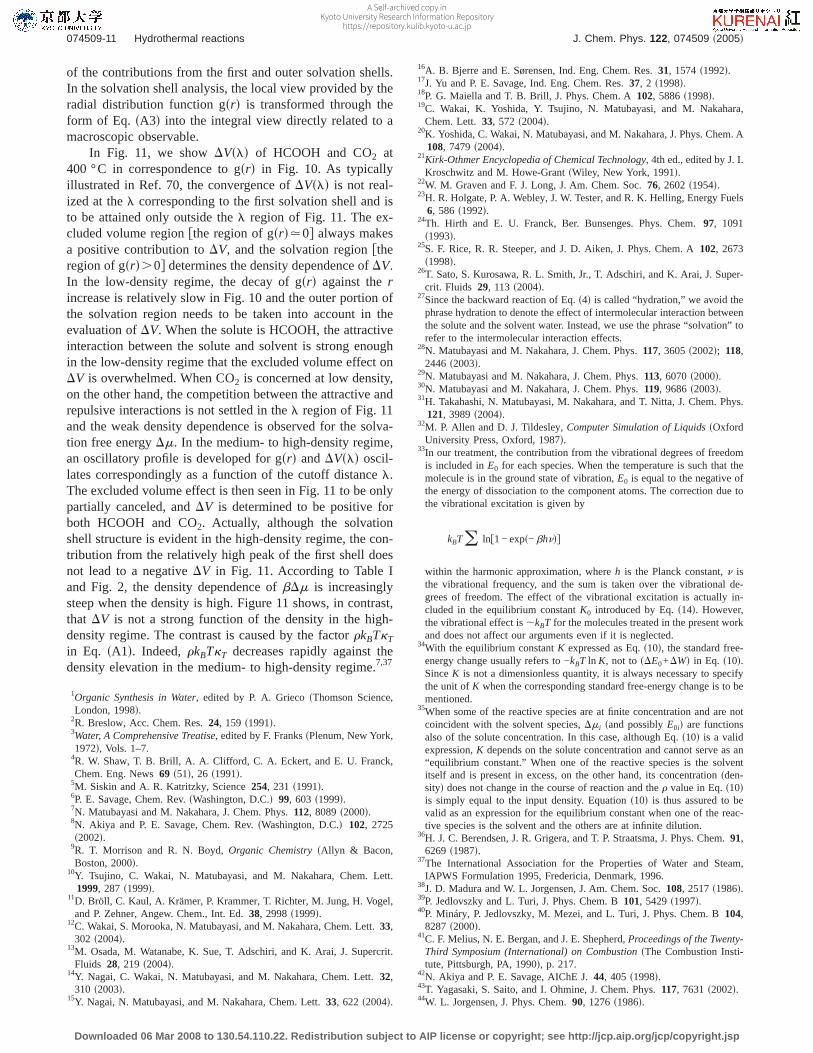
FIG. 11. The excess partial molar volumeDVsld of sad the solute HCOOHandsbd the solute CO2 as a function of the cutoff distancel. The tempera-ture is fixed at 400 °C. The density in the figure refers to the solvent density.The solid and dashed lines are used alternately from low to high density.
FIG. 10. The radial distribution function gsrd for sad the solute HCOOH andsbd the solute CO2 as a function of the distancer between the carbon site ofthe solute and the oxygen site of the solvent water. The temperature is fixedat 400 °C. The solvent density is 0.10, 0.20, 0.40, 0.60, 0.80, and1.00 g/cm3 from top to bottom with offsets of 1.0, 0.8, 0.6, 0.4, 0.2, and 0for gsrd. The solid and dashed lines are used alternately from low to highdensity.
074509-10 N. Matubayasi and M. Nakahara J. Chem. Phys. 122, 074509 ~2005!
Downloaded 06 Mar 2008 to 130.54.110.22. Redistribution subject to AIP license or copyright; see http://jcp.aip.org/jcp/copyright.jsp
A Self-archived copy inKyoto University Research Information Repository
https://repository.kulib.kyoto-u.ac.jp
of the contributions from the first and outer solvation shells.In the solvation shell analysis, the local view provided by theradial distribution function gsrd is transformed through theform of Eq. sA3d into the integral view directly related to amacroscopic observable.
In Fig. 11, we showDVsld of HCOOH and CO2 at400 °C in correspondence to gsrd in Fig. 10. As typicallyillustrated in Ref. 70, the convergence ofDVsld is not real-ized at thel corresponding to the first solvation shell and isto be attained only outside thel region of Fig. 11. The ex-cluded volume regionfthe region of gsrd.0g always makesa positive contribution toDV, and the solvation regionftheregion of gsrd.0g determines the density dependence ofDV.In the low-density regime, the decay of gsrd against therincrease is relatively slow in Fig. 10 and the outer portion ofthe solvation region needs to be taken into account in theevaluation ofDV. When the solute is HCOOH, the attractiveinteraction between the solute and solvent is strong enoughin the low-density regime that the excluded volume effect onDV is overwhelmed. When CO2 is concerned at low density,on the other hand, the competition between the attractive andrepulsive interactions is not settled in thel region of Fig. 11and the weak density dependence is observed for the solva-tion free energyDm. In the medium- to high-density regime,an oscillatory profile is developed for gsrd andDVsld oscil-lates correspondingly as a function of the cutoff distancel.The excluded volume effect is then seen in Fig. 11 to be onlypartially canceled, andDV is determined to be positive forboth HCOOH and CO2. Actually, although the solvationshell structure is evident in the high-density regime, the con-tribution from the relatively high peak of the first shell doesnot lead to a negativeDV in Fig. 11. According to Table Iand Fig. 2, the density dependence ofbDm is increasinglysteep when the density is high. Figure 11 shows, in contrast,that DV is not a strong function of the density in the high-density regime. The contrast is caused by the factorrkBTkT
in Eq. sA1d. Indeed,rkBTkT decreases rapidly against thedensity elevation in the medium- to high-density regime.7,37
1Organic Synthesis in Water, edited by P. A. GriecosThomson Science,London, 1998d.
2R. Breslow, Acc. Chem. Res.24, 159 s1991d.3Water, A Comprehensive Treatise, edited by F. FrankssPlenum, New York,1972d, Vols. 1–7.
4R. W. Shaw, T. B. Brill, A. A. Clifford, C. A. Eckert, and E. U. Franck,Chem. Eng. News69 s51d, 26 s1991d.
5M. Siskin and A. R. Katritzky, Science254, 231 s1991d.6P. E. Savage, Chem. Rev.sWashington, D.C.d 99, 603 s1999d.7N. Matubayasi and M. Nakahara, J. Chem. Phys.112, 8089s2000d.8N. Akiya and P. E. Savage, Chem. Rev.sWashington, D.C.d 102, 2725s2002d.
9R. T. Morrison and R. N. Boyd,Organic ChemistrysAllyn & Bacon,Boston, 2000d.
10Y. Tsujino, C. Wakai, N. Matubayasi, and M. Nakahara, Chem. Lett.1999, 287 s1999d.
11D. Bröll, C. Kaul, A. Krämer, P. Krammer, T. Richter, M. Jung, H. Vogel,and P. Zehner, Angew. Chem., Int. Ed.38, 2998s1999d.
12C. Wakai, S. Morooka, N. Matubayasi, and M. Nakahara, Chem. Lett.33,302 s2004d.
13M. Osada, M. Watanabe, K. Sue, T. Adschiri, and K. Arai, J. Supercrit.Fluids 28, 219 s2004d.
14Y. Nagai, C. Wakai, N. Matubayasi, and M. Nakahara, Chem. Lett.32,310 s2003d.
15Y. Nagai, N. Matubayasi, and M. Nakahara, Chem. Lett.33, 622 s2004d.
16A. B. Bjerre and E. Sørensen, Ind. Eng. Chem. Res.31, 1574s1992d.17J. Yu and P. E. Savage, Ind. Eng. Chem. Res.37, 2 s1998d.18P. G. Maiella and T. B. Brill, J. Phys. Chem. A102, 5886s1998d.19C. Wakai, K. Yoshida, Y. Tsujino, N. Matubayasi, and M. Nakahara,
Chem. Lett. 33, 572 s2004d.20K. Yoshida, C. Wakai, N. Matubayasi, and M. Nakahara, J. Phys. Chem. A
108, 7479s2004d.21Kirk-Othmer Encyclopedia of Chemical Technology, 4th ed., edited by J. I.
Kroschwitz and M. Howe-GrantsWiley, New York, 1991d.22W. M. Graven and F. J. Long, J. Am. Chem. Soc.76, 2602s1954d.23H. R. Holgate, P. A. Webley, J. W. Tester, and R. K. Helling, Energy Fuels
6, 586 s1992d.24Th. Hirth and E. U. Franck, Ber. Bunsenges. Phys. Chem.97, 1091
s1993d.25S. F. Rice, R. R. Steeper, and J. D. Aiken, J. Phys. Chem. A102, 2673
s1998d.26T. Sato, S. Kurosawa, R. L. Smith, Jr., T. Adschiri, and K. Arai, J. Super-
crit. Fluids 29, 113 s2004d.27Since the backward reaction of Eq.s4d is called “hydration,” we avoid the
phrase hydration to denote the effect of intermolecular interaction betweenthe solute and the solvent water. Instead, we use the phrase “solvation” torefer to the intermolecular interaction effects.
28N. Matubayasi and M. Nakahara, J. Chem. Phys.117, 3605s2002d; 118,2446 s2003d.
29N. Matubayasi and M. Nakahara, J. Chem. Phys.113, 6070s2000d.30N. Matubayasi and M. Nakahara, J. Chem. Phys.119, 9686s2003d.31H. Takahashi, N. Matubayasi, M. Nakahara, and T. Nitta, J. Chem. Phys.
121, 3989s2004d.32M. P. Allen and D. J. Tildesley,Computer Simulation of LiquidssOxford
University Press, Oxford, 1987d.33In our treatment, the contribution from the vibrational degrees of freedom
is included inE0 for each species. When the temperature is such that themolecule is in the ground state of vibration,E0 is equal to the negative ofthe energy of dissociation to the component atoms. The correction due tothe vibrational excitation is given by
kBTo lnf1 − exps− bhndg
within the harmonic approximation, whereh is the Planck constant,n isthe vibrational frequency, and the sum is taken over the vibrational de-grees of freedom. The effect of the vibrational excitation is actually in-cluded in the equilibrium constantK0 introduced by Eq.s14d. However,the vibrational effect is,kBT for the molecules treated in the present workand does not affect our arguments even if it is neglected.
34With the equilibrium constantK expressed as Eq.s10d, the standard free-energy change usually refers to −kBT ln K, not to sDE0+DWd in Eq. s10d.SinceK is not a dimensionless quantity, it is always necessary to specifythe unit ofK when the corresponding standard free-energy change is to bementioned.
35When some of the reactive species are at finite concentration and are notcoincident with the solvent species,Dmi sand possiblyE0id are functionsalso of the solute concentration. In this case, although Eq.s10d is a validexpression,K depends on the solute concentration and cannot serve as an“equilibrium constant.” When one of the reactive species is the solventitself and is present in excess, on the other hand, its concentrationsden-sityd does not change in the course of reaction and ther value in Eq.s10dis simply equal to the input density. Equations10d is thus assured to bevalid as an expression for the equilibrium constant when one of the reac-tive species is the solvent and the others are at infinite dilution.
36H. J. C. Berendsen, J. R. Grigera, and T. P. Straatsma, J. Phys. Chem.91,6269 s1987d.
37The International Association for the Properties of Water and Steam,IAPWS Formulation 1995, Fredericia, Denmark, 1996.
38J. D. Madura and W. L. Jorgensen, J. Am. Chem. Soc.108, 2517s1986d.39P. Jedlovszky and L. Turi, J. Phys. Chem. B101, 5429s1997d.40P. Mináry, P. Jedlovszky, M. Mezei, and L. Turi, J. Phys. Chem. B104,
8287 s2000d.41C. F. Melius, N. E. Bergan, and J. E. Shepherd,Proceedings of the Twenty-
Third Symposium (International) on CombustionsThe Combustion Insti-tute, Pittsburgh, PA, 1990d, p. 217.
42N. Akiya and P. E. Savage, AIChE J.44, 405 s1998d.43T. Yagasaki, S. Saito, and I. Ohmine, J. Chem. Phys.117, 7631s2002d.44W. L. Jorgensen, J. Phys. Chem.90, 1276s1986d.
074509-11 Hydrothermal reactions J. Chem. Phys. 122, 074509 ~2005!
Downloaded 06 Mar 2008 to 130.54.110.22. Redistribution subject to AIP license or copyright; see http://jcp.aip.org/jcp/copyright.jsp
A Self-archived copy inKyoto University Research Information Repository
https://repository.kulib.kyoto-u.ac.jp
45T. A. Bruce, Phys. Rev. B5, 4170s1972d.46Kagaku Binran (Dictionary of Chemistry), 5th ed., edited by Chemical
Society of JapansMaruzen, Tokyo, 2004d sin Japanesed srevised editiond.47J. G. Harris and K. H. Yung, J. Phys. Chem.99, 12021s1995d.48A. D. Buckingham and R. L. Disch, Proc. R. Soc. London, Ser. A273,
275 s1963d.49J. P. Hansen and I. R. McDonald,Theory of Simple Liquids, 2nd ed.
sAcademic, London, 1986d.50Since the dipole moment is small, CO is categorized as nonpolar.51When the solvent density is low enough, the density derivative ofbDm at
constant temperature has the same sign asedxh1−expf−bvsxdgj, wherexis the solvent configuration relative to the solute andvsxd is the solute-solvent interaction. The excluded volume region, wherevsxd is very large,always makes a positive contribution to the density derivative ofbDm.The density derivative is reduced by the attractivesnegatived portion ofvsxd, and is not necessarily positive at low temperatures. In Table I andFig. 2, the density derivative ofbDm of a polar solute is negative at400 °C in the low-density region. In other words, 400 °C is not highenough in the sense that the contribution from the attractive part of thesolute-solvent interaction is not overwhelmed by that from the repulsivepart. It should be noted that the attractive contribution is more sensitive tothe temperature variation than the repulsive contribution and that the re-pulsive contribution dominates at a high enough temperature.
52It is a rather rough statement that the density corresponding to the mini-mum bDm is larger when the solute-water interaction is stronger. Indeed,the interaction strength is not a uniquely definable concept, but expressesthe “intuitive feeling” about the molecule.
53H. Sato, N. Matubayasi, M. Nakahara, and F. Hirata, Chem. Phys. Lett.323, 257 s2000d.
54R. Crovetto, R. Fernández-Prini, and M. L. Japas, J. Chem. Phys.76,1077 s1982d.
55R. Fernandez-Prini, R. Crovetto, M. L. Japas, and D. Laria, Acc. Chem.Res. 18, 207 s1985d.
56R. Fernández Prini and R. Crovetto, J. Phys. Chem. Ref. Data18, 1231s1989d.
57R. Fernández-Prini, J. L. Alvarez, and A. H. Harvey, J. Phys. Chem. Ref.Data 32, 903 s2003d.
58B. Guillot and Y. Guissani, J. Chem. Phys.99, 8075s1993d.59In the present treatment, the Henry’s constant is given byrkBT expsbDmd,
wherer is the density of the solvent water.60According to Ref. 57, the experimentally determined value ofbDm is 3.7,
3.9, 3.6, 3.2, 2.8, 2.3, and 1.5 for CO at 25, 100, 150, 200, 250, 300, and350 °C on the liquid branch of the saturation curve, respectively. Simi-larly, the experimental value ofbDm is 0.2, 1.1, 1.3, 1.2, 1.0, 0.7, and 0.4for CO2 and 4.0, 3.8, 3.4, 3.0, 2.5, 1.9, and 1.2 for H2. A good agreementis thus observed between these experimental values and the correspondingcalculated values in Table I, while the calculated values are more unfavor-able by,1 kcal/mol for CO2.
61NASA Glenn thermodynamic database, URL: http://cea.grc.nasa.gov62As done in Ref. 61, the standard free energy of formation is typically listed
at the pressure of 1 atm or 1 bar. The pressure equilibrium constantKP isthen obtained through a chemical equation and is related to the equilib-rium constantK0 of Eq. s14d by
ln K0 = ln KP − S oi:product
ni − oi:reactant
niDlnskBTd
in the dilute gas condition.63According to Ref. 24,bDW of the water-gas-shift reaction at a pressure of
400 bar is estimated to be 0.5–1.0 and 1.3–1.7 at temperatures of 500 and600 °C, respectively. The Arrhenius extrapolation of the data then leads tobDW.0 at 400 °C. The solvent density at the temperature of 400 °Cneeds to be treated with care, however, in such an extrapolation. At thepressure of 400 bar, the density is 0.52, 0.18, and 0.12 g/cm3 at 400, 500,and 600 °C, respectivelysRef. 37d, and the variation is too large between400 and 500 °C for an isobaric reference to the density in the extrapola-tion. A reasonable view is to refer to a density of 0.2–0.3 g/cm3 when theextrapolation to 400 °C is performed. In this view, the extrapolatedbDWat 400 °C is in good agreement with the correspondingbDW value givenby Figs. 5 and 8.
64According to Ref. 20, lnK for the HCOOH decarbonylation is,4 at250 °C on the liquid branch of the saturation curve in our unit convention.This is in good agreement with the result shown in Fig. 7. The comparisonis not attempted for the HCOOH decarboxylation, on the other hand, sincethe equilibrium is not achieved yet for the decarboxylation within thereaction time of Ref. 20. The experimental determination of the equilib-rium constant for the HCOOH decarboxylation might be difficult due to along reaction time required and a possible leakage of H2 through thequartz vessel used.
65T. Minowa and Z. Fang, J. Chem. Eng. Jpn.31, 488 s1998d.66I. Wender, Fuel Process. Technol.48, 189 s1996d.67C. B. Roberts and N. O. Elbashir, Fuel Process. Technol.83, 1 s2003d.68M. Stelmachowski and L. Nowicki, Appl. Energy74, 85 s2003d.69J. G. Kirkwood and F. P. Buff, J. Chem. Phys.19, 774 s1951d.70N. Matubayasi and R. M. Levy, J. Phys. Chem.100, 2681s1996d.71N. Matubayasi, E. Gallicchio, and R. M. Levy, J. Chem. Phys.109, 4864
s1998d.72T. Imai, M. Kinoshita, and F. Hirata, J. Chem. Phys.112, 9469s2000d.73T. Imai, H. Nomura, M. Kinoshita, and F. Hirata, J. Phys. Chem. B106,
7308 s2002d.74T. Imai and F. Hirata, J. Chem. Phys.119, 5623s2003d.75N. Matubayasi, L. H. Reed, and R. M. Levy, J. Phys. Chem.98, 10640
s1994d.
074509-12 N. Matubayasi and M. Nakahara J. Chem. Phys. 122, 074509 ~2005!
Downloaded 06 Mar 2008 to 130.54.110.22. Redistribution subject to AIP license or copyright; see http://jcp.aip.org/jcp/copyright.jsp
A Self-archived copy inKyoto University Research Information Repository
https://repository.kulib.kyoto-u.ac.jp