"timing and duration of subsidence due to longwall mining" · providing for the enjoyment...
TRANSCRIPT

REPORT OF INVESTIGATIONS11995 . . . .- .. - - . . .- . . . .
Timing and Duration of Subsidence Due to Longwall Mining
U. S. Department of the Interior Mission Statement
As the Nation's principal conservation agency, the Department of the Interior has responsibility for most of our nationally-owned public lands and natural resources. This includes fostering sound use of our land and water resources; protecting our fish, wildlife, and biological diversity; preserving the environmental and cultural values of our national parks and historical places; and providing for the enjoyment of life through outdoor recreation. The Department assesses our energy and mineral resources and works to ensure that their development is in the best interests of all our people by encouraging stewardship and citizen participa- tion in their care. The Department also has a major responsibility for American Indian reservation communities and for people who live in island territories under U.S. administration.

Report of Investigations 9552
Timing and Duration of Subsidence Due to Longwall Mining
By Paul W. Jeran and Michael A. Trevits
UNITED STATES DEPARTMENT OF THE INTERIOR Bruce Babbitt, Secretary
BUREAU OF MINES Rhea Lydia Graham, Director

International Standard Serial Number ISSN 1066-5552

CONTENTS
bbstract . . . . . . . . . . . . . . . . . . . . . . . . . . . . . . . . . . . . . . . . . . . . . . . . . . . . . . . . . . . . . . . . . . . . . . . . . . . Introduction . . . . . . . . . . . . . . . . . . . . . . . . . . . . . . . . . . . . . . . . . . . . . . . . . . . . . . . . . . . . . . . . . . . . . . . . Fieldstudies . . . . . . . . . . . . . . . . . . . . . . . . . . . . . . . . . . . . . . . . . . . . . . . . . . . . . . . . . . . . . . . . . . . . . . . . IDeformations . . . . . . . . . . . . . . . . . . . . . . . . . . . . . . . . . . . . . . . . . . . . . . . . . . . . . . . . . . . . . . . . . . . . . . .
. . . . . . . . . . . . . . . . . . . . . . . . . . . . . . . . . . . . . . . . . . . . . . . . . . . . . . . . . . . . . . . . . . . . . . . . . . Summary I References . . . . . . . . . . . . . . . . . . . . . . . . . . . . . . . . . . . . . . . . . . . . . . . . . . . . . . . . . . . . . . . . . . . . . . . . .
1 ILLUSTRATIONS
. . . . . . . . . . . . . . . . . . . . . . . . . . . . . . . . . . . . . . . . . . . . . . . . . . . . . . . . . . . . . . . . . Monitoringarray . . . . . . . . . . . . . . . . . . . . . . . . . . . . . . . . . . . . . . . . . . . Subsidence during long-term study versus time
. . . . . . . . . . . . . . . . . . . . . . . . . . . . . . . . . . . . . . . . . . . . . . . . . . . . . . . Subsidence during first 60 days . . . . . . . . . . . . . . . . . . . . . . . . . . . . . . . . . . . . . . . . . . . . . . . . . . Final subsidence versus face position
. . . . . . . . . . . . . . . . . . . . . . . . . . . . . . . . . . . . . . . . . . . . . . . . . . . . . . . . Final subsidence versus time . . . . . . . . . . . . . . . . . . . . . . . . . . . . . . . . . . . . . . . . . . . . . . . . . . . . . . . . . . . . . . . . Locationofmines
Faceadvances . . . . . . . . . . . . . . . . . . . . . . . . . . . . . . . . . . . . . . . . . . . . . . . . . . . . . . . . . . . . . . . . . . . . . . . . . . . . . . . . . . . . . . . . . . . . . . . . . . . . . . . . . . . . . . . . . Subsidence at centerline points versus time
. . . . . . . . . . . . . . . . . . . . . . . . . . . . . . . . . . . . . . . . Subsidence at centerline points versus face position . . . . . . . . . . . . . . . . . . . . . . . . . . . Subsidence at centerline points versus face position-overburden ratio
. . . . . . . . . . . . . . . . . . . . . . . . . . . . . . . . . . . . . . . . . . Subsidence 30.48 m from centerline versus time Subsidence 30.48 m from centerline versus face position . . . . . . . . . . . . . . . . . . . . . . . . . . . . . . . . . . . . Subsidence 30.48 m from centerline versus face position-overburden ratio . . . . . . . . . . . . . . . . . . . . . . .
. . . . . . . . . . . . . . . . . . . . . . . . . . . . . . . . . . . . . . . . . . . . . . . Subsidence 30.48 m inside rib versus time Subsidence 30.48 m inside rib versus face position . . . . . . . . . . . . . . . . . . . . . . . . . . . . . . . . . . . . . . . . . Subsidence 30.48 m inside rib versus face position-overburden ratio . . . . . . . . . . . . . . . . . . . . . . . . . . . .
. . . . . . . . . . . . . . . . . . . . . . . . . . . . . . . . . . . . . . . . . . . . . . . . . . . Subsidence at rib points versus time Subsidence at rib points versus face position . . . . . . . . . . . . . . . . . . . . . . . . . . . . . . . . . . . . . . . . . . . . . Subsidence at rib points versus face position-overburden ratio . . . . . . . . . . . . . . . . . . . . . . . . . . . . . . . . Inclination difference at mine A . . . . . . . . . . . . . . . . . . . . . . . . . . . . . . . . . . . . . . . . . . . . . . . . . . . . . . Inclination difference at mine B . . . . . . . . . . . . . . . . . . . . . . . . . . . . . . . . . . . . . . . . . . . . . . . . . . . . . . Inclination difference at mine C . . . . . . . . . . . . . . . . . . . . . . . . . . . . . . . . . . . . . . . . . . . . . . . . . . . . . . Inclination difference at mine D . . . . . . . . . . . . . . . . . . . . . . . . . . . . . . . . . . . . . . . . . . . . . . . . . . . . . .
1 TABLE
. . . . . . . . . . . . . . . . . . . . . . . . . . . . . . . . . . . . . . . . . . . . . . . . . . . . . . . . . . . . . 1 1 Study sites information

UNIT OF MEASURE ABBREVIATIONS USED IN THIS REPORT
Metric Units
m meter mm/m millimeter per minute
m/d meter per day Pet percent
U. S. Customary Units
ft foot ft/d foot per day
TIMING AND DURATION OF SUBSIDENCE DUE TO LONGWALL MINING
By Paul W. ~eran' and Michael A. rev its*
ABSTRACT
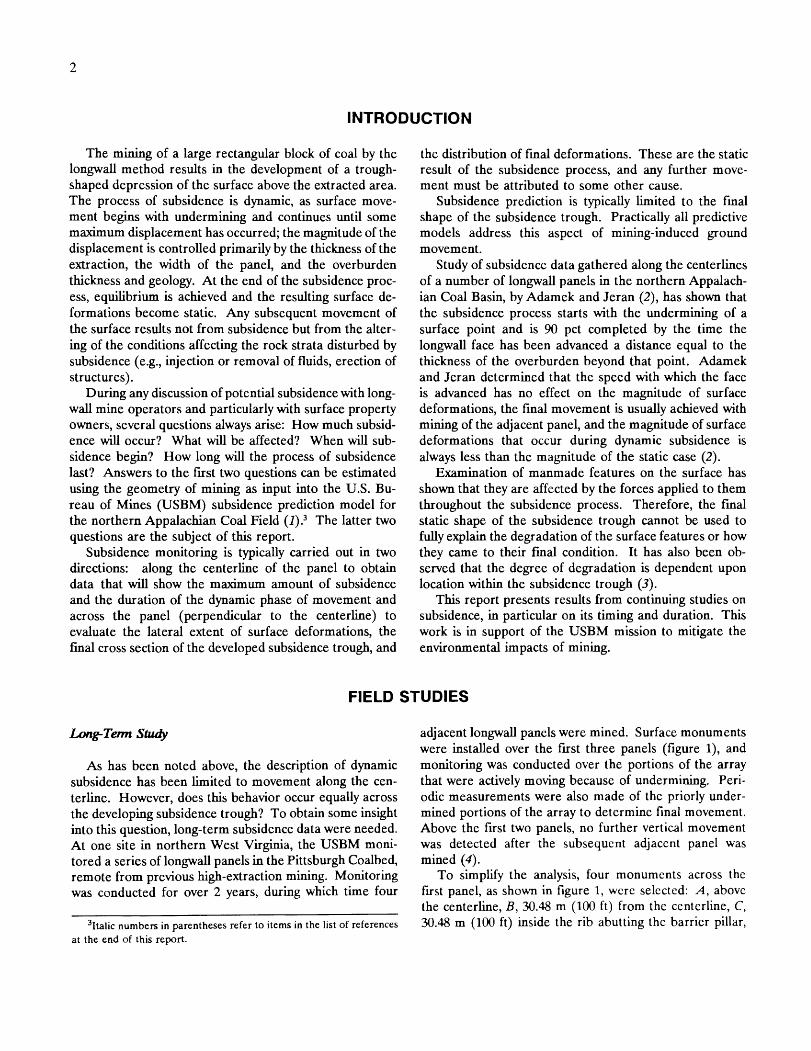
Subsidence data gathered by the U.S. Bureau of Mines over a series of longwall panels in the Pittsburgh Coalbed were studied to obtain insight as to the role of time in the subsidence process. It was found that subsidence began essentially with undermining and was completed within 1 year. The progress of the subsidence was dependent upon location above the panel. Subsidence in the central area of the subsidence trough, where subsidence is the greatest, was about 90 pct complete by the time the face had progressed a distance equal to one overburden thickness beyond a particular surface point. For a point over the rib of the longwall panel, the subsidence was only about 60 pct complete at this time. Data from three other sites in the northern Appalachian Coal Basin were analyzed to determine if an anomaly or the true characteristics of the subsidence process had been observed. All sites behaved similarly in the central portion of the subsidence trough. However, the subsidence of points over and adjacent to the ribs of the longwall panels was site specific. The fact that movement across the width of the panel was not uniform should be taken into account in assessing damages or the potential for damages resulting from mining-induced subsidence.
' ~ e o l o ~ i s t . 2 ~ u p e ~ s o r y geologist. Pittsburgh Research Center, U.S. Bureau of Mines, Pittsburgh, PA.
INTRODUCTION
The mining of a large rectangular block of coal by the longwall method results in the development of a trough- shaped depression of the surface above the extracted area. The process of subsidence is dynamic, as surface move- ment begins with undermining and continues until some maximum displacement has occurred; the magnitude of the displacement is controlled primarily by the thickness of the extraction, the width of the panel, and the overburden thickness and geology. At the end of the subsidence proc- ess, equilibrium is achieved and the resulting surface de- formations become static. Any subsequent movement of the surface results not from subsidence but from the alter- ing of the conditions affecting the rock strata disturbed by subsidence (e.g., injection or removal of fluids, erection of structures).
During any discussion of potential subsidence with long- wall mine operators and particularly with surface property owners, several questions always arise: How much subsid- ence will occur? What will be affecte.d? When will sub- sidence begin? How long will the process of subsidence last? Answers to the first two questions can be estimated using the geometry of mining as input into the U.S. Bu- reau of Mines (USBM) subsidence prediction model for the northern Appalachian Coal Field The latter two questions are the subject of this report.
Subsidence monitoring is typically carried out in two directions: along the centerline of the panel to obtain data that will show the maximum amount of subsidence and the duration of the dynamic phase of movement and across the panel (perpendicular to the centerline) to evaluate the lateral extent of surface deformations, the final cross section of the developed subsidence trough, and
the distribution of final deformations. These are the static result of the subsidence process, and any further move- ment must be attributed to some other cause.
Subsidence prediction is typically limited to the final shape of the subsidence trough. Practically all predictive models address this aspect of mining-induced ground movement.
Study of subsidence data gathered along the centerlines of a number of longwall panels in the northern Appalach- ian Coal Basin, by Adamek and Jeran (2), has shown that the subsidence process starts with the undermining of a surface point and is 90 pct completed by the time the longwall face has been advanced a distance equal to the thickness of the overburden beyond that point. Adamek and Jeran determined that the speed with which the face is advanced has no effect on the magnitude of surface deformations, the final movement is usually achieved with mining of the adjacent panel, and the magnitude of surface deformations that occur during dynamic subsidence is always less than the magnitude of the static case (2).
Examination of manmade features on the surface has shown that they are affected by the forces applied to them throughout the subsidence process. Therefore, the final static shape of the subsidence trough cannot be used to fully explain the degradation of the surface features or how they came to their final condition. It has also been ob- served that the degree of degradation is dependent upon location within the subsidence trough (3).
This report presents results from continuing studies on subsidence, in particular on its timing and duration. This work is in support of the USBM mission to mitigate the environmental impacts of mining.
FIELD STUDIES
Lfm~Temz study
As has been noted above, the description of dynamic subsidence has been limited to movement along the cen- terline. However, does this behavior occur equally across the developing subsidence trough? To obtain some insight into this question, long-term subsidence data were needed. At one site in northern West Virginia, the USBM moni- tored a series of longwall panels in the Pittsburgh Coalbed, remote from previous high-extraction mining. Monitoring was conducted for over 2 years, during which time four
3~talic numbers in parentheses refer to items in the list of references
adjacent longwall panels were mined. Surface monuments were installed over the first three panels (figure I), and monitoring was conducted over the portions of the array that were actively moving because of undermining. Peri- odic measurements were also made of the priorly under- mined portions of the array to determine final movement. Above the first two panels, no further vertical movement was detected after the subsequent adjacent panel was mined (4).
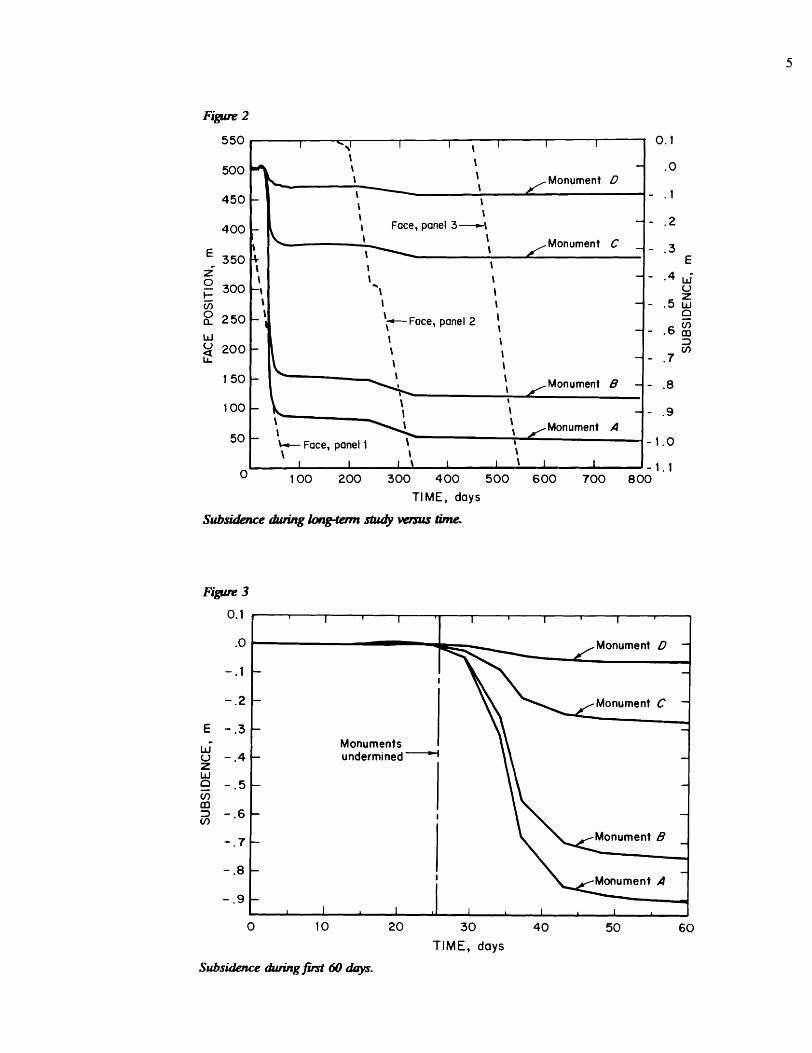
To simphfy the analysis, four monuments across the first panel, as shown in figure 1, were selected: A, above the centerline, B, 30.48 m (100 ft) from the centerline, C, 30.48 m (100 ft) inside the rib abutting the barrier pillar,
at the end of this report.

and D, above the rib abutting the barrier pillar. Figure 2 shows a plot of the subsidence of these four monuments versus time. Also included are the face positions showing the progress of mining for the studied panels. The last measurement was made after mining of the fourth panel was completed. Each face position line indicates the lo- cation of each face during the study. From this, we can see that each monument experienced most of its move- ment with the mining of panel 1 and had completed move- ment with the mining of panel 2. Figure 3 shows the first 60 days of the study. From this, it can be observed that the monuments were undermined on the 25th day and some minor movement had been detected as much as 10 days earlier. Furthermore, most movement occurred within 30 days after undermining.
Since each monument subsided a different amount, the percentage of final movement for each measurement was computed to provide some basis of comparison. Negative values of time and face position, where they occur on graphs, indicate data acquired prior to undermining of the monuments. When the percentages of final subsidence are plotted against face position (figure 4), it can be seen that the three interior monuments (A, B, and C ) subsided more than 85 pct of their final movement by the time the face was 245.44 m (800 ft) past the monument line. Movement of the monument over the rib (D) was only 70 pct complete at this time. Plotting the percentage of final sub- sidence against time (figure 5) shows that all of the mon- uments behaved similarly for the first 10 days after un- dermining. After that period, the two central monuments (A and B) behaved similarly and the behavior of the mon- ument 30.48 m (100 ft) inside the rib (C) lagged slightly behind. The rib monument (D) behaved differently.
From the above, it can be concluded that subsidence of the monuments within the panel limits is governed by face position and time. Subsidence of the monument over the rib, after its initial movement, is governed more by time.
Since these observations represent information from only one site, other sites, with shorter durations of study, were investigated to confirm or deny our observations.
Three mine sites were selected, one in each of three coal- beds: Pittsburgh, Lower Kittanning, and Freeport. Fig- ure 6 shows the locations of these sites, and table 1 contains data describing the panel width, overburden thick- ness, average rate of face advance, and coalbcd for the sites. Mine A is the site of the original, long-tcrin I 1:dy. The Pittsburgh Coalbed site, mine B, was choscn to JCI, r- mine if the observations were limited to operation\ in I his coalbed (the original site was in the Pittsburgh Cnalhcd). Overburdens, extracted thicknesses, rates of face advance and geometries varied among the sites. Figure 7 is a plot of face advance for each of the sites. The average rates of mining ranged from 3.05 m/d (10.0 ft/d) at mine B to 11.83 m/d (38.8 ft/d) at mine D.
In all cases, the monuments chosen were from the pro- file line extending from the centerline outward, away from subsequently mined panels. Sincc the extracted thick- nesses were different, which resulted in differing magni- tudes of subsidence, the percentage of the fmal movement of each monument was calculated and used in the compari- sons. It should be noted that the process of subsidence at all sites was completed within 1 year of undermining.
Data from the centerline monuments at each of the four sites plotted against time (figure 8) show that sub- sidence at mines C and D generally agreed with that at mine A, while at mine B subsidence was much slower. Mine B had the slowest face advance and greatest over- burden thickness. Considering that dynamic subsidence is proportional to face advance and inversely proportional to overburden thickness (2), a slower rate of subsidence for mine B could be the expected result. When the percent- age of final subsidence was plotted against face position (figure 9), mines A and B (Pittsburgh Coalbed) were in agreement, with mines C and D differing. It should be noted, however, that mines C and D had lesser overburden thicknesses. When plotted against face position in terms of overburden thickness (figure lo), all sites were in closer agreement. Note, in figure 10, for the centerline monu- ments, subsidence at all sites was about 90 pct complete when the face had advanced the thickness of the overbur- den beyond the monument location. These observations agree with the findings of the earlier study by Adamek and Jeran (2).
Table 1.--Study sites information
Panel Mine width
m f i
A .. . . . 190.5 625 8 . . . . . 182.9 600 C . . . . . 289.6 950 D . . . . . 182.9 600
Over- Average burden face advance Coalbed
m ft m/d R/d
210.3-213.4 690-700 6.55 21.5 Pittsburgh. 277.4-298.7 91 0-980 3.05 10.0 Pittsburgh. 118.9126.5 3-15 4.94 16.2 Kittanning. 143.3-155.4 470-510 11 -83 38.8 Freeport.

The same plots were made for the monuments 30.48 m (100 ft) from the centerline for the four sites under study (figures 11-13). Again, as for the centerline points, the plot of subsidence versus face position in terms of over- burden thickness shows the closest agreement, and again, over 90 pct of the final subsidence was completed when the face had advanced the thickness of the overburden past each point.
Plots for subsidence at the monuments 30.48 m (100 ft) inside the rib versus time and face position (figures 14-15) are similar to those for the more centrally located monu- ments. However, the plot of the percentage of final sub- sidence versus face position-overburden ratio (figure 16) shows that this location at mine D lagged behind the same location at the other three mines, indicating retardation of the subsidence process. The overburden at this site
I
I Panel 1 I
I I I Panel 2 I 1 I 1 1
contains ~ i ~ c a n t l y more and thicker sandstone units. These stiffer members bridge farther over the gob than the less resistant strata at the other sites. Additional time is needed for the stiffer units to bend into the gob area.
The similar plots for the rib monuments (figures 17-19) show a different characteristic. Plots of the percentage of final subsidence versus face position (figure 18) and face position in terms of overburden thickness (figure 19) do not show the same trends as observed for subsidence at the other points. The plot of percentage of final subsid- ence versus time (figure 17), however, shows that within a month of undermining, these monuments had completed from 40 to 70 pct of their final subsidence. This indicates that the process of subsidence over the rib is very much site dependent and time appears to play a very si&icant role.
I I Panel I I I T
Panel
u Scale, m
15 \ r /
\ 100 - 1
I \ - - .9 \ \ : /Monument A
lo - \& Face, panel I \ \ t - -1.0 \ \ \
1 1 I \ I r \ I 1 0 - 1 . 1
100 200 300 400 500 600 700 800
TIME, days
Subsi&nce cfiuing lovtgtenn study wmus time-
1 I 1 I I I 1 1 I 1 +
Monument D - -
I -
- Monument C - - -
Monuments - undermined - - - - - -
- -
I
- I 1 1 I L
0 10 20 30 40 50 60
TIME, days
Subsidence muingjkt 60 dizys.

F i p 4
0 50 100 150 200 2 50 300
FACE POSITION, m
1 1 I I 1 I 1 1 I I I I 1
- KEY
- A
- -0- c ....... D -
- -
- -
- -
- -
-
Final subsidence versus faepos i th .
F i p 5
TIME, days
Final subsidence versus time.

u Scale, miles
F i , 7
- KEY
- - Mine A -
Mine 6 - - + Mine C -
Mine D - - - - - - - -
- - - - -
TIME, days
Face advances.

KEY - Mine A - 0 - 0 Mine B -a - Mine C
a a a a Mine D
TIME, days
Subsidence a t c ~ p o i n b versus rimerime
KEY - Mine A 0 0 0 - Mine B -* - Mine C a a a a Mine D
0 50 1 00 1 50 200 250 300
FACE POSITION, m
Subsideme at centertine p&s vlersus face position.

Fi' 10
FACE POSITION-OVERBURDEN RATIO
Subsidence at centerlLte pub& vlersus face p o s j t i o v t - t w d M d o -
Fi' ll
KEY - Mine A ---- Mine B -0- Mine C o o o o o o o Mine D
TIME, days
Subsidence 30.48 rn jiwn centerline versus time.

F i p z 12
0 50 1 00 1 50 200 250 300
FACE POSITION, m
I I 1 1 1 I 1 1 1 I r I
- * . * 1
I
- - - -
- - Mine A - ---- Mine B - -* - Mine C -
- . . . . . . a Mine D -
- - -
-
- I I I I I I I I I I 1 1 1
Subsidence 30.48 m jiwn cenhdhw versus face position.
F i p z 13
- 0.5 0 0.5 1 .O 1.5
FACE POSITION-OVERBURDEN RATIO
1
- - KEY - Mine A
- 00.. - Mine B -a- Mine C
-
- ..mamma Mine D -
- -
- - - -
- - - -
C . . . . . . a f - - 1 I I I I I 1 1
Subsidence 30.48 m jiwn centerIine vmsus face position-overburden mtio.

KEY - Mine A - 0 0 0 Mine B -*- Mine C ....... Mine D
TIME, days
Subdime 30.48 m inside rib vmw lime-
Fi' 15
I 1 1 I 1 1 I 1 1 I 1 I I
- I
pa-.-*-• - - - - - - - - - Mine A -
0 0 0- Mine B -
- -*- Mine C ....... Mine D -
- -
-
- .. 1 I I 1 1 I 1 I 1 I 1 I 1
. -
- 50 0 50 1 00 1 50 200 250 300
FACE POSITION, m
Subdime 30.48 m inside rib versus fme podium

Figure 16
KEY - Mine A -0-0 Mine 6 -0- Mine C ....... Mine D
FACE POSITION-OVERBURDEN RATIO
Subdimce 30.48 rn inside rib versus face position&M mtio.
Figure 17
-40 -30 -20 -10 0 10 20 30 40 50
TIME, days
I I l ' l ' l r l ' l ' l ' l '
- -
- KEY - - Mine A - ---- Mine 6 -.- Mine C - *.***** Mine D
-
-
- - - -
- - ** . . - -
Subdhce at rib pi& w m u time.

Figam 18
100 I I I I 1 I 1 I 1 I I I
90 - - KEY
80 - - Mine A C
0-0- g 70- Mine B -*- Mine C
6 0 - e e e o e e o Mine D
-
V)
1 30 - -
-
- -
-50 0 50 1 00 1 50 2 00 250 300
FACE POSITION, m
Subdknce at rib points v m w f m e p d o a
Figam 19
100 - 1 I 1 1 1 I 1 1 I I 1
90 - - 80 - KEY - Mine A
t
g 7 0 - ---- Mine B -*- Mine C *.**..* Mine D 6 0 -
Z 5 0 - s
- V)
40 - v> 1 30 - a - 20- LL
- -
-
-1 .O -0.5 0 0.5 1 .O 1.5 2 .O
FACE POSITION-OVERBURDEN RATIO
Subsidence at rib points versus fme position+vetburden nab.
DEFORMATIONS
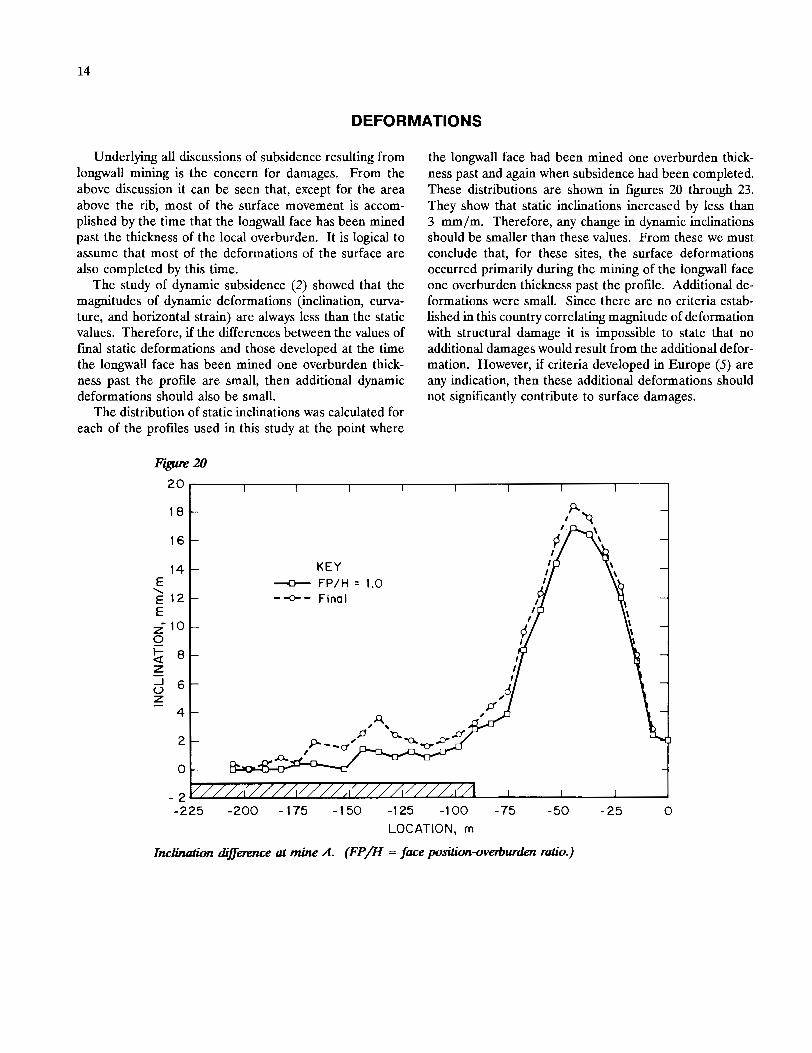
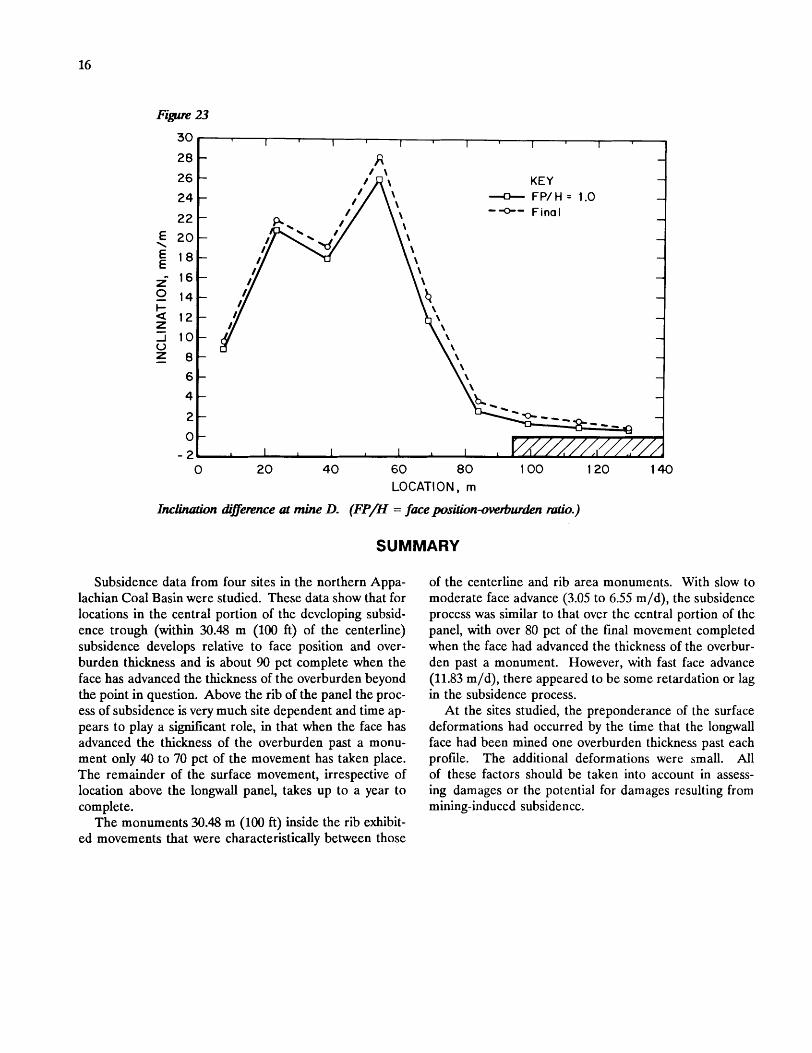
Underlying all discussions of subsidence resulting from longwall mining is the concern for damages. From the above discussion it can be seen that, except for the area above the rib, most of the surface movement is accom- plished by the time that the longwall face has been mined past the thickness of the local overburden. It is logical to assume that most of the deformations of the surface are also completed by this time.
The study of dynamic subsidence (2) showed that the magnitudes of dynamic deformations (inclination, curva- ture, and horizontal strain) are always less than the static values. Therefore, if the differences between the values of final static deformations and those developed at the time the longwall face has been mined one overburden thick- ness past the profile are small, then additional dynamic deformations should also be small.
The distribution of static inclinations was calculated for each of the profiles used in this study at the point where
the longwall face had been mined one overburden thick- ness past and again when subsidence had been completed. These distributions are shown in figures 20 through 23. They show that static inclinations increased by less than 3 mm/m. Therefore, any change in dynamic inclinations should be smaller than these values. From these we must conclude that, for these sites, the surface deformations occurred primarily during the mining of the longwall face one overburden thickness past the profile. Additional de- formations were small. Since there are no criteria estab- lished in this country correlating magnitude of deformation with structural damage it is impossible to state that no additional damages would result from the additional defor- mation. However, if criteria developed in Europe (5) are any indication, then these additional deformations should not significantly contribute to surface damages.
20 - I 1 I 1 1 I 1 I
18 - P -
16 -
14 - KEY E + FP/H = 1.0 \ E 12 - -*- Final E il0 -
8 - z - 6 = - Z -
4 -
2 -
i lh'z'K///',l ////;////'I /"l I / /
I I I I -225 -200 -175 -150 -125 -100 -75 -50 -25 0
LOCATION, m
Ix1-n a 3 j J m e ai mine A. (FP/N = face position+durden mtio-)

-2 0 25 5 0 7 5 1 0 0 1 2 5
LOCATION, m
+ FP/H = 1.0 -4- Final
Im- d@mmce at mine B. (FP/H = face position+vwburden ruth.)
Figure 22
26
,200 -150 -100 -50 0 50 100 150 200 250 300 LOCATION, m
-0- FP/H = 1.0 - +- Final
Inc- d @ m e at mine C (FP/H = facejmiiion-ovwbwden ralio.)
I I 1 I 1 I I I I 1 1 r
- f i - 1 \ - KEY -
- + FP/H = 1.0 - -*- Final -
- - d
- - - -
- - - - - -
0 20 40 60 80 1 00 1 20 1 4 0 LOCATION, m
Im&u&on d$ktmce at mine D. ( F P D = foce position-ove~wden mtio.)
SUMMARY
Subsidence data from four sites in the northern Appa- lachian Coal Basin were studied. These data show that for locations in the central portion of the developing subsid- ence trough (within 30.48 m (100 ft) of the centerline) subsidence develops relative to face position and over- burden thickness and is about 90 pct complete when the face has advanced the thickness of the overburden beyond the point in question. Above the rib of the panel the proc- ess of subsidence is very much site dependent and time ap- pears to play a si@icant role, in that when the face has advanced the thickness of the overburden past a monu- ment only 40 to 70 pct of the movement has taken place. The remainder of the surface movement, irrespective of location above the longwall panel, takes up to a year to complete.
The monuments 30.48 m (100 ft) inside the rib exhibit- ed movements that were characteristically between those
of the centerline and rib area monuments. With slow to moderate face advance (3.05 to 6.55 m/d), the subsidence process was similar to that over the central portion of the panel, with over 80 pct of the final movement completed when the face had advanced the thickness of the overbur- den past a monument. However, with fast face advance (11.83 m/d), there appeared to be some retardation or lag in the subsidence process.
At the sites studied, the preponderance of the surface deformations had occurred by the time that the longwall face had been mined one overburden thickness past each profile. The additional deformations were small. All of these factors should be taken into account in assess- ing damages or the potential for damages resulting from mining-induced subsidence.
REFERENCES
1. Jeran, P. W., V. Adamek, and M. A. Trevits. A Subsidence Prediction Model for Longwall Mine Design. Paper in Proceedings of the Longwall USA Conference (Pittsburgh, PA, June 1986). Maclean Hunter Publ., 1986, pp. 101-112.
2. Adamek, V., P. W. Jeran, and M. A. Trevits. Static and Dynamic Subsidence Prediction in the Northern Appalachian Ckal Region Based on the Use of a Variable Subsidence Coefficient. Paper in Proceedings 3rd Workshop on Subsidence Due to Underground Mining (WV Univ., Morgantown, WV, June 1-5, 1992). WV Univ., 1992, pp. 10-21.
3. Walker, J. S., and M. A. Trevits. Effects of Longwall Mining on Surface Structures. Paper in Proceedings Mine Subsidence-Prediction
and Control (33rd Annu. Meet. Assoc. Eng. Geol., Pittsburgh, PA, Oct. 1990). AAPG, 1990, pp. 141-143.
4. Jeran, P. W., and V. Adamek. Subsidence Due to Undermining of Sloping Terrain: A Case Study. USBM RI 9205, 1988, 10 pp.
5. Adamek, V., and P. W. Jeran. Evaluation of Surface Deformation Characteristics Over Longwall Panels in the Northern Appalachian Coal- field. Paper in Proceedings of First Conference on State-of-the-Art of Ground Control in Longwall Mining and Mining Subsidence (Honolulu, HI, Sept. 5-9, 1982). Soc. Min. Eng. AIME, 1982, pp. 18S198.