time-domain reflectometry (tdr) in graduate courses...
TRANSCRIPT

1
Proceedings of the 2012 ASEE North-Central Section Conference Copyright © 2012, American Society for Engineering Education
Time-Domain Reflectometry (TDR) in Graduate Courses
Andrew Rusek, Subramanian Ganesan, Barbara Oakley, Daniel Aloi
Oakland University, School of Engineering and Computer Science, Rochester, MI 48309
[email protected], [email protected], [email protected], [email protected]
Abstract:
A time-domain reflectometer is an instrument composed of a fast pulse generator and a broad-
band oscilloscope, usually a coherent sampling oscilloscope. Most textbooks used for graduate
courses involving high frequency electronics and electromagnetic compatibility do not cover
Time Domain Reflectometry (TDR). This is a significant omission, as TDR measurements form
a popular and important method for signal integrity verification of transmission lines in
broadband radio-frequency and microwave systems, including high frequency printed circuits.
TDR methods are also important in non-electrical areas such as geology and optics. This paper
presents a brief description of TDR issues, as taught in graduate level electrical engineering
courses at Oakland University to make up for the gap in standard textbooks. We also include a
discussion of the demonstrations we have developed with TDR; these include software
simulations which enhance the interpretation of measurement results. Instrumentation involving
two major types of TDR are described here: short pulse time-domain, and step pulse time-
domain. Each type is involved in measurements of discontinuities of various types of cables, and
is used to evaluate measurement errors and limitations.
I. Introduction A time-domain reflectometer is an instrument composed of a fast pulse generator and a broad-
band oscilloscope, (often this latter device is a coherent sampling oscilloscope) [1-3].
Surprisingly, TDR methodologies are not covered in most standard textbooks related to high
frequency electronics and electromagnetic compatibility [4-7]. The time domain reflectometer
can be used in two ways—as a short pulse or a step pulse. The short pulse time domain
reflectometer sends fast, very short pulses into the transmission line network under
investigation—the resultant incident and reflected pulses are observed on the scope to determine
the transmission line delay and possible network discontinuity locations. When the transmission
line is properly matched, no reflections are observed. The time resolution of such a system is
limited to the incident pulse width, which is close to a doubled value of the incident pulse rise
time. Discontinuity types can be determined from the shape of the reflected pulses, although the
interpretation process can be difficult.
In contrast to short pulse TDR, step pulse TDR sends long, step-like pulses into the network
under investigation—the resultant reflected waves are observed superimposed atop the incident
pulses. Time resolution for this approach is limited only by the rise time of the incident pulses.
This improves the system resolution—an improvement over the constraints of the short pulse
approach. In step-pulse TDR, it is easier to interpret discontinuity types. Moreover, in modern
TDR systems, supporting software can be used to help identify discontinuities.

2
Proceedings of the 2012 ASEE North-Central Section Conference Copyright © 2012, American Society for Engineering Education
At Oakland University, we have integrated material related to TDR into two graduate courses—
High Frequency Electronics, and Electromagnetic Compatibility (see Appendices A and B).
Indeed, concepts of TDR have become vital, “backbone” subjects for these courses.
II. Principles of Time Domain Reflectometry
Figure 1 shows the basic structure of TDR as implemented using a high input-impedance
oscilloscope. A step generator sends its pulse into the transmission system under test. The step
generator’s impedance matches that of the transmission-line connection, so the only reflections
expected are from the circuit under test. The incident wave, which is one-half the open-circuit
step voltage, is transmitted toward the circuit under test. When this signal encounters any
discontinuity, including unmatched impedance of the circuit under test, a reflected voltage wave
is produced. This reflected voltage is propagated back to the generator and added to the incident
wave. The reflected wave can be positive or negative.
Figure 1: Basic structure of TDR.
III. Applications of Time Domain Reflectometry and Time Domain Transmissometry
As early as 1939, geologists identified a relationship between the dielectric properties of soil,
rock, and their moisture content. Time domain reflectometry offers a methodology for
capitalizing on these dielectric relationships [8-13]. Primary applications of time domain
reflectometry and transmissometry include the following [1-3].
1. Conductor length and return loss determination
2. Finding short and open connections in cables
3. Location of bad splices, loose connectors, and crimps
4. Location of moisture and water in cables
5. Measurement of cable parameters, such as characteristic impedance, losses, and
propagation velocity
6. Determining signal integrity, and performing failure analysis of printed circuit boards
used in high speed digital and analog circuits
7. Evaluation of micro strip connections
8. Computer network cable tests
3
Proceedings of the 2012 ASEE North-Central Section Conference Copyright © 2012, American Society for Engineering Education
9. Characterization of integrated circuit packages
10. Sensing liquid levels.
IV. Simulation
As shown in the accompanying figures, simulation provides unparalleled ability to explain the
dynamics underlying TDR. The line length used to reproduce the waveforms for all of the figures
shown here is 14 meters; the unit delay is 23.3 cm/ns. Figure 2a shows a PSpice/MultiSim
simulation circuit for a matched source. Figure 2b shows the temporal simulation result. Figure
2c provides an oscilloscope screen picture of the waveforms affiliated with an open ended
transmission line input. In Figure 2c the input – Channel 2 (upper curve) shows the incident step
and reflected step. The time between the incident and reflected step is the delay time introduced
by signal as it passes through length of the line and then returns the length of the line—a doubled
TL delay. The “Output – Channel 4” signal, (the lower curve), shows the doubled incident wave
level with a long pulse applied by the source, delayed about 60 ns due to the length of the line.
The distance between steps of Channel 2 is double the transmission line delay time.
Figure 3 reveals similar results in relation to an unmatched load. Figure 4 shows the use of a
narrow pulse reflectometer to test the signal integrity of longer cables applied in computer
networks.
Figures 5a to 5i show input and output waveforms affiliated with various loads. In Figure 5a, the
results pertain to step pulse TDR in relation to an open ended transmission line. “Input – Channel
2” shows both the incident and reflected step, separated by a doubled transmission line delay—
the source is matched to the line. “Output – Channel 4” shows the doubled incident wave level,
delayed (60 ns or 23.3 cm distance from generator), with a long pulse applied by the signal
generator. The distance between steps of Channel 2 are twice the transmission line delay time.
(Again, as with all these measurements, the line length is 14 meters, and the unit delay is 23.3
cm/ns.)
Figure 5b shows step pulse TDR in relation to a reflection from the shorted load of the
transmission line, where the source is matched to the line (in this case, Rload is a short consisting
of one inch of wire).
Figure 5c shows a screen shot in relation to an open-ended transmission line, with a short pulse
applied to show a “radar effect,” or echo. (Channel 2 – input; a doubled amplitude output is
observed on Channel 4). Note the effects of the losses due to the transmission line, the echo is
slower and smaller. The distance between pulses of Channel 2 are twice the transmission line
delay time. The measured unit delay yields 20cm/ns.
Figure 5d shows a shorted transmission line, observed using narrow pulse TDR. Note that the
“short” (Channel 4) is not really a short at high frequencies. Also observe the change of polarity
of the reflected pulse (Channel 2 – Input). Figure 5e shows the transmission line results with an
inductive load, while the source resistance is matched (50-Ω). Figure 5f shows the transmission
line with capacitive load; the source resistance is matched (50-Ω), with the display adjusted to
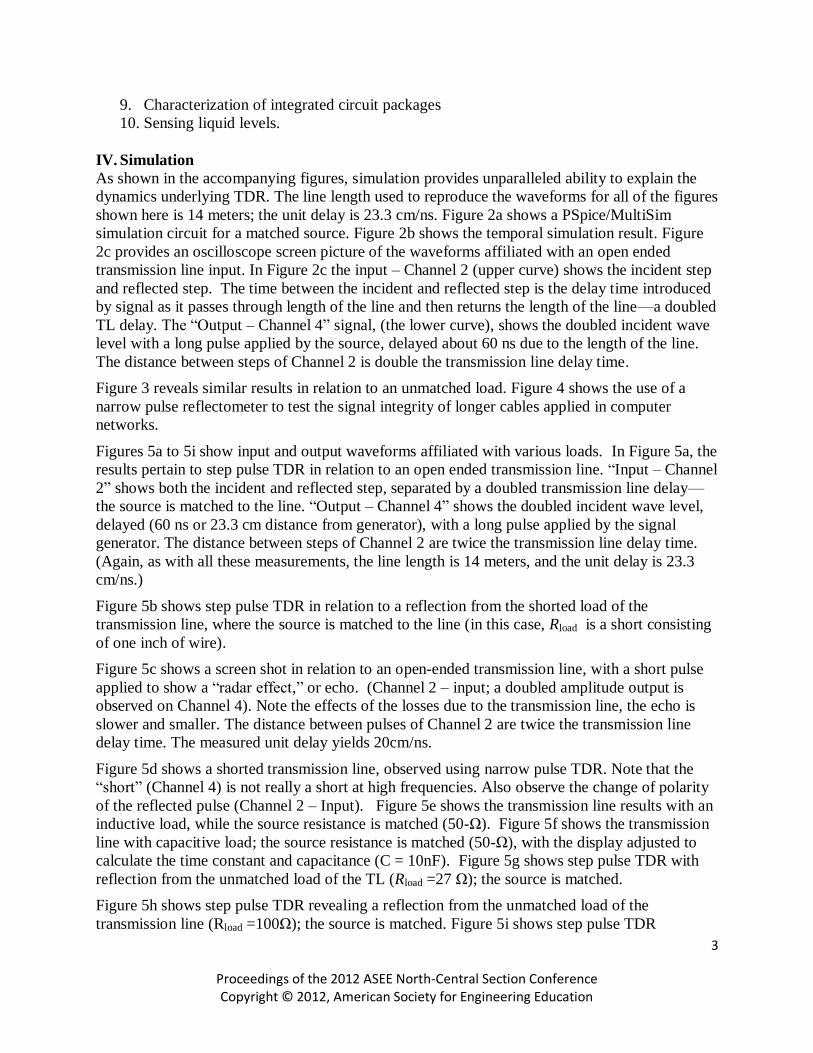
calculate the time constant and capacitance (C = 10nF). Figure 5g shows step pulse TDR with
reflection from the unmatched load of the TL (Rload =27 Ω); the source is matched.
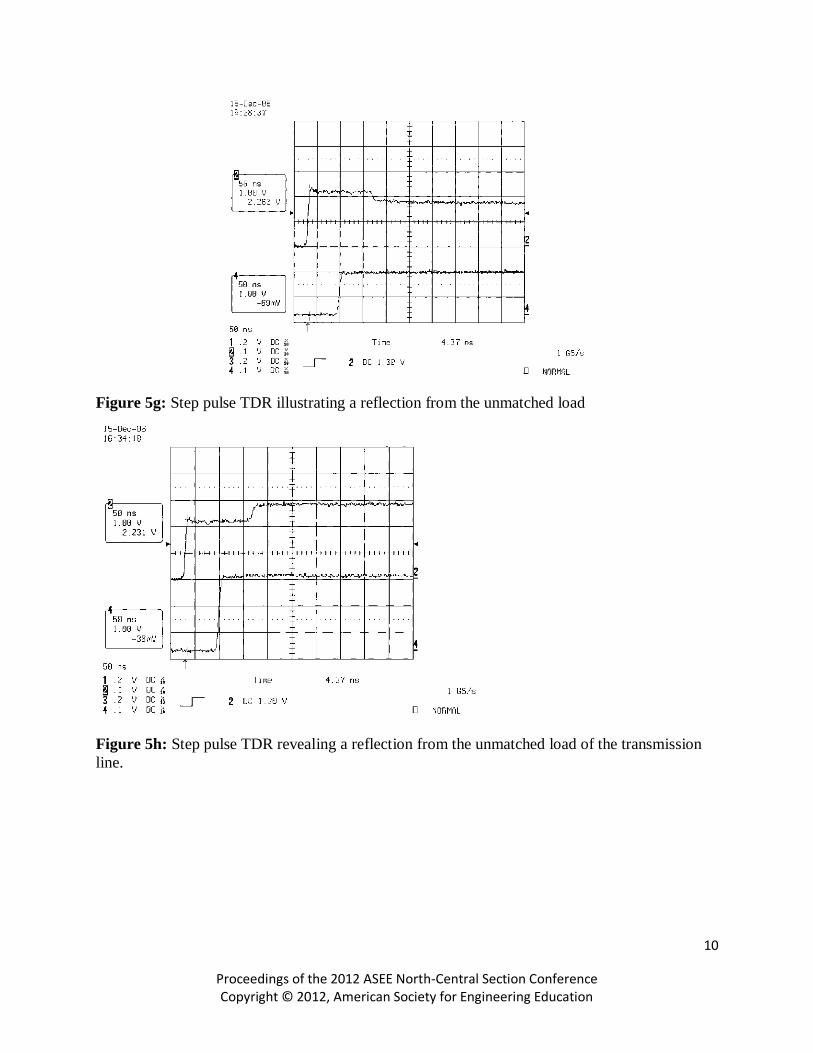
Figure 5h shows step pulse TDR revealing a reflection from the unmatched load of the
transmission line (Rload =100Ω); the source is matched. Figure 5i shows step pulse TDR

4
Proceedings of the 2012 ASEE North-Central Section Conference Copyright © 2012, American Society for Engineering Education
revealing the reflection from the shorted load of the transmission line, (the source is matched,
Rload is a short consisting of one inch of wire). Observe the effects of the transmission line losses:
an elevated “tail” follows the pulse, and there is also the step of the output signal. Figure 6a
shows simulated TDR (PSpice), where block HB1 comprises a step generator and a PSpice
calculator which evaluates the value of the capacitance in volts (pV corresponds to pF). Block
HB2 is used to evaluate the impedance.
Figure 2a: PSpice/MultiSim model of an open ended transmission line (TL) with a long pulse
applied. The source is matched.
Figure 2b: PSpice/Multisim simulation results for the circuit shown in Figure 2a.

5
Proceedings of the 2012 ASEE North-Central Section Conference Copyright © 2012, American Society for Engineering Education
Figure 2c: Oscilloscope scope screen shot of voltage waves affiliated with an open-ended
transmission line with a matched source.
Figure 3a: PSpice/Multisim circuit to test reflection from the unmatched load of the
transmission line (Rload =100Ω). The source is matched.
Figure 3b: Temporal simulation of the circuit of Figure 3a using PSpice/Multisim.

6
Proceedings of the 2012 ASEE North-Central Section Conference Copyright © 2012, American Society for Engineering Education
Figure 3c: Oscilloscope screen shot of waveforms affiliated with the circuit of Figure 3a.
Figure 4: Test signal related to a narrow pulse TDR to test the signal integrity of longer
cables applied in computer networks using a Tektronix oscilloscope.

7
Proceedings of the 2012 ASEE North-Central Section Conference Copyright © 2012, American Society for Engineering Education
Figure 5a: Step pulse TDR for an open ended transmission line.
Figure 5b: Step pulse TDR in relation to reflection from the shorted load of the transmission
line, where the source is matched to the line (Rload = a short consisting of one inch of wire).

8
Proceedings of the 2012 ASEE North-Central Section Conference Copyright © 2012, American Society for Engineering Education
Figure 5c: Narrow pulse TDR in relation to an open-ended transmission line.
Figure 5d: Shorted transmission line, narrow pulse TDR. Note that the “short” is not really short
at high frequencies (Channel 4).

9
Proceedings of the 2012 ASEE North-Central Section Conference Copyright © 2012, American Society for Engineering Education
Figure 5e: Step pulse TDR with an inductive load.
Figure 5f: Step pulse TDR with capacitive load.
10
Proceedings of the 2012 ASEE North-Central Section Conference Copyright © 2012, American Society for Engineering Education
Figure 5g: Step pulse TDR illustrating a reflection from the unmatched load
Figure 5h: Step pulse TDR revealing a reflection from the unmatched load of the transmission
line.

11
Proceedings of the 2012 ASEE North-Central Section Conference Copyright © 2012, American Society for Engineering Education
Figure 5i: Step pulse TDR revealing the reflection from the shorted load of the transmission
line.
Figure 6a A simulated TDR generation system in PSpice. Block HB1 comprises a step generator
and a PSpice calculator which evaluates the value of the capacitance, calculated in volts (pV
corresponds to pF). Block HB2 is used to evaluate the impedance.

12
Proceedings of the 2012 ASEE North-Central Section Conference Copyright © 2012, American Society for Engineering Education
Fig. 6b: Recorded wave V(Cap) indicates the value of the capacitance. The “pV” units recorded
by the PSPICE probe correspond to Pico farads (pF).
V. Assessment and Evaluation
Our graduate electromagnetics and high frequency electronics courses (ECE 546 and ECE 527,
respectively) include short projects in which the students can appreciate real applications of TDR
involving fast pulse generators, high-frequency oscilloscopes, and spectrum analyzers. In both
courses, TDR helps in analysis of signal integrity issues in transmission line communication
circuits.
Pulse transmission issues in transmission lines are initially introduced during lectures by
applying basic tools such as bouncing wave diagrams (for linear source and load resistances),
and the graphical method based on the Bergeron diagrams (for both linear and nonlinear sources
and load resistances). In addition, we like to provide practical demonstrations of the various
effects related to sinusoidal and pulse operations in transmission lines, as outlined in the various
illustrations below.
This material also serves as a background for short student projects in which the students identify
the transmission line load character and load locations based on the shapes and parameters of
observed pulses. Single and multiple transmission line discontinuities are also detected and
identified. Simple transmission lines, such as twisted pair lines, are constructed and measured
using TDR methods so that students are able to learn more about transmission line parameters.
Measurements are also simulated using PSPICE in order to help elucidate processes of
transmission line load identification.
Use of TDR reinforces the learning objectives for both the courses. Appendix A gives the ECE
546 Electromagnetic compatibility course outline. One of the key outcomes is the “Ability to
evaluate parameters of electronic components, including transmission lines at high frequency.”
Appendix B gives the ECE 527 High Frequency Electronics course outline. Here, one of the key
outcomes is “Understand the operation of transmission lines, both in frequency and time domain,
including TDR.” End of course evaluations and student evaluations show that teaching TDR has
helped students meet learning objectives and improve their understanding of a practical and useful
electrical engineering phenomenon.

13
Proceedings of the 2012 ASEE North-Central Section Conference Copyright © 2012, American Society for Engineering Education
Conclusion
Time domain reflectometry is a critical, and underrated, component of electrical engineering
education. Yet it is a relatively straightforward matter to provide students with the fundamentals
they need to understand and use these important techniques. This paper provides an overview of
how these fundamentals are taught at Oakland University, and provides a template for
widespread dissemination of TDR in modern electrical engineering coursework.
VI. References:
1. Howard Johnson, Martin Graham, High-Speed Digital Design: A Handbook of Black Magic, Prentice Hall, 1993.
2. TDR Primer, Application Note, TDA Systems, 2002,
www.gigaprobestek.com/images/TDR_Test_primer.pdf.
3. Andrew Rusek, “Reflectometers, Time_Domain,” Wiley Encyclopedia of Electrical and Electronics
Engineering, Volume 18, John Wiley & Sons, 1999.
4. Clayton Paul, Introduction to Electromagnetic Compatibility, 2nd Ed, John Wiley & Sons, 2006.
5. David M. Pozar, Microwave Engineering, Addison-Wesley, 2004.
6. Reinhold Ludwig, Gene Bogdanow, RF Circuit Design, Theory and Applications, 2nd Ed, Pearson
Education, 2009.
7. Michael Steer, Microwave and RF Design, A System Approach, Scitech Publishing, 2010.
8. K. Noborio, "Measurement of soil water content and electrical conductivity by time domain reflectometry: a review," Computers and Electronics in Agriculture, vol. 31, pp. 213-237, 2001.
9. P. Hoekstra and A. Delaney, "Dielectric properties of soils at UHF and microwave frequencies," Journal of
Geophysical Research, vol. 79, pp. 1699-1708, 1974.
10. G. Clarke Topp and W. D. Reynolds, "Time domain reflectometry: A seminal technique for measuring
mass and energy in soil," Soil and Tillage Research, vol. 47, pp. 125-132, 1998.
11. E. Pettinelli, et al., "Time domain reflectrometry: Calibration techniques for accurate measurement of the
dielectric properties of various materials," Review of Scientific Instruments, vol. 73, pp. 3553-3562, 2002.
12. G. Topp and T. Ferre, "Water content, In, Methods of Soil Analysis. Part 4.(Ed. JH Dane and GC Topp),
SSSA Book Series No. 5," Soil Science Society of America, Madison WI, 2002.
13. D. Robinson, et al., "A review of advances in dielectric and electrical conductivity measurement in soils
using time domain reflectometry," Vadose Zone Journal, vol. 2, p. 444, 2003.
Appendix A
Re: ECE 546 Electromagnetic Compatibility Course Level: Graduate, Total Credits: 4
Textbook: C. R. Paul, Introduction to Electromagnetic Compatibility, J. Wiley, Recent Edition.
Topics:
Overview of EMC
EMC Requirements (i, j)
Review of Electromagnetic Principles (a, e)
Distributed and Lumped Components
Signal Spectra and Spectrum Measurements (a, e, k)
Intro to EMC Pre-compliance and Compliance Tests, Component and System Level
Measurements (e, k)
Radiated Emissions and Susceptibility (a, e)

14
Proceedings of the 2012 ASEE North-Central Section Conference Copyright © 2012, American Society for Engineering Education
Conducted Emissions and Susceptibility (a, e)
Crosstalk (a)
Shielding and Guarding (a)
Electrostatic Discharge (a)
Introduction to System Design (a, e, i, j, k)
Introduction to Signal Integrity (a)
Course Outcomes:
The students obtain the following competencies:
- Understanding of US and foreign EMC standards.
- Understanding of time and frequency representations of signals.
- Ability to evaluate parameters of electronic components, including transmission lines at high
frequency.
- Ability to evaluate the design factors that contribute to conducted emissions, radiated
emissions, and crosstalk.
Appendix B
ECE527 “High Frequency Electronics”
Catalog Course Description:
Transmission lines with sinusoidal and pulse excitation. Passive and active circuit components at
high frequency. High frequency amplifiers, communications circuits, waveform generators and
digital circuits. Introduction to high frequency measurements.
Course Contents:
1. Passive lumped components at high frequencies
2. Transmission lines with sinusoidal and pulse excitation, TDR
3. Active devices operating at high frequencies
4. Pulse operation of active devices
5. High frequency amplifiers
6. High frequency oscillators
7. High frequency communication circuits
8. Introduction to high frequency measurements and instrumentation
Software Applied: PSPICE, Serenade, MATLAB, SMITH 191, APPCAD
RE: ABET outcomes:
Engineering programs must demonstrate that their graduates have:
(a) an ability to apply knowledge of mathematics, science, and engineering
(b) an ability to design and conduct experiments, as well as to analyze and interpret data
(c) an ability to design a system, component, or process to meet desired needs
(d) an ability to function on multi-disciplinary teams
(e) an ability to identify, formulate, and solve engineering problems
(f) an understanding of professional ethical responsibility
(g) an ability to communicate effectively

15
Proceedings of the 2012 ASEE North-Central Section Conference Copyright © 2012, American Society for Engineering Education
(h) the broad education necessary to understand the impact of engineering solutions in a global
and societal context
(i) a recognition of the need for, and an ability to engage in, life-long learning
(j) a knowledge of contemporary issues
(k) an ability to use the techniques, skills, and modern engineering tools necessary for
engineering practice.
Course Objectives (related to ABET outcomes: a, b, c, e, j, k)
By completing the course students will be able to:
1. Analyze the influence of parasitic parameters of passive components, such as resistors,
capacitors and inductors on high frequency circuit performance (a, b).
2. Understand the operation of transmission lines, both in frequency and time domain,
including TDR (a, b).
3. Understand the processes involving design and analysis of high frequency filters(a, b, c, e).
4. Analyze and design high frequency amplifiers, based on scattering matrix parameters of
active components (a, b, c, e).
5. Verify the analytical problem solutions using PSPICE, Serenade, and/or MATLAB (k).
6. Understand the functions and analyze basic high frequency system blocks, such as mixers,
demodulators, and voltage-controlled oscillators (a, b, c, k).
7. Understand operation and limitations of fundamental high frequency measurement
instruments, including spectrum and network analyzers (b, j, k).
Biography
Andrew Rusek ([email protected]) is a Professor of Engineering at
Oakland University in Rochester, Michigan. He received an M.S. in
Electrical Engineering from Warsaw Technical University in 1962, and
a PhD. in Electrical Engineering from the same university in 1972. His
post-doctoral research involved sampling oscillography, and was
completed at Aston University in Birmingham, England, in 1973-74.
Dr. Rusek is very actively involved in the automotive industry with
research in communication systems, high frequency electronics, and
electromagnetic compatibility. He is the recipient of the 1995- 96
Oakland University Teaching Excellence Award

16
Proceedings of the 2012 ASEE North-Central Section Conference Copyright © 2012, American Society for Engineering Education
Subra Ganesan ([email protected]) is a Professor of Electrical
and Computer Engineering at Oakland University and Director of Real
Time Embedded DSP Systems Lab. He joined the university in 1984.
After graduating from Indian Institute of Sciences Bangalore India, he
served at universities in Germany, and Canada and Indian research
laboratory as a scientist. He does research work in collaboration with
TI, Free Scale, and a few other semiconductor companies and US
army. His research areas include DSP, Embedded Systems, Real Time
Systems, Condition-based Maintenance, and Optimization.
Barbara Oakley is an associate professor of engineering at Oakland
University in Michigan—she has won national awards from the
National Science Foundation and others for her teaching. Dr. Oakley’s
research focuses on the complex relationship between neurocircuitry
and social behavior. Among her varied experiences, she has worked for
several years as a Russian translator on Soviet trawlers in the Bering
Sea during the height of the Cold War; she met her husband while
working as a radio operator at the South Pole station in Antarctica; and
she has gone from private to regular Army Captain in the U.S. military.
Oakley is a recent vice president of the IEEE Engineering in Medicine
and Biology Society, the world’s largest bioengineering society, as well
as a Fellow of the American Institute of Medical and Biological
Engineering. Her books include Pathological Altruism (lead editor, Oxford University Press,
2012), Cold-Blooded Kindness (Prometheus Books, 2011), Career Development in
Bioengineering and Biotechnology (co-edited, Springer, 2008), Evil Genes: Why Rome Fell,
Hitler Rose, Enron Failed, and My Sister Stole My Mother’s Boyfriend (Prometheus Books,
2007), and Hair of the Dog: Tales from Aboard a Russian Trawler (WSU Press, 1996).
Daniel N. Aloi ([email protected]) received the B.S.E.E., M.S.E.E.,
and Ph.D. degrees (in electrical engineering) in 1992, 1996, and 1999,
respectively, all from the School of Electrical Engineering and
Computer Science, Ohio University, Athens. He is currently Chair of
the Department of Electrical and Computer Engineering at Oakland
University. His research interests have focused on antenna modeling
and various aspects of location technology in the aviation and
automotive telematics industries. In addition, he serves as a key
technical advisor to the Federal Aviation Administration’s Satellite
Program Office for the Local Area Augmentation System. He is a
coinventor on three patents related to automotive navigation.