thorvaldur gylfason course on external vulnerabilities and policies tunis, march 2–13, 2009
TRANSCRIPT

Thorvaldur Gylfason
Course on External Vulnerabilities and Policies
Tunis, March 2–13, 2009

Aid and other capital flowsHistory, theory, evidence
Foreign aid and economic growthEffectiveness: Does aid work?Macroeconomic challenges
Dutch disease Aid volatility
Policy options in managing aid flows and lessons from recent experience Preparing for scaling up aid Vulnerabilities Monetary and fiscal policy options Debt sustainability Governance issues
Conclusions and guidelines

Unrequited transfers from donor to country designed to promote the economic and social development of the recipient Excluding commercial deals and military aid
Concessional loans and grants included, by tradition Grant element ≥ 25%

Development aid can bePublic (ODA) or privateBilateral (from one country to another) or multilateral (from international organizations)
Program, project, technical assistance
Linked to purchase of goods and services from donor country, or in kind
Conditional in nature IMF conditionality, good governance
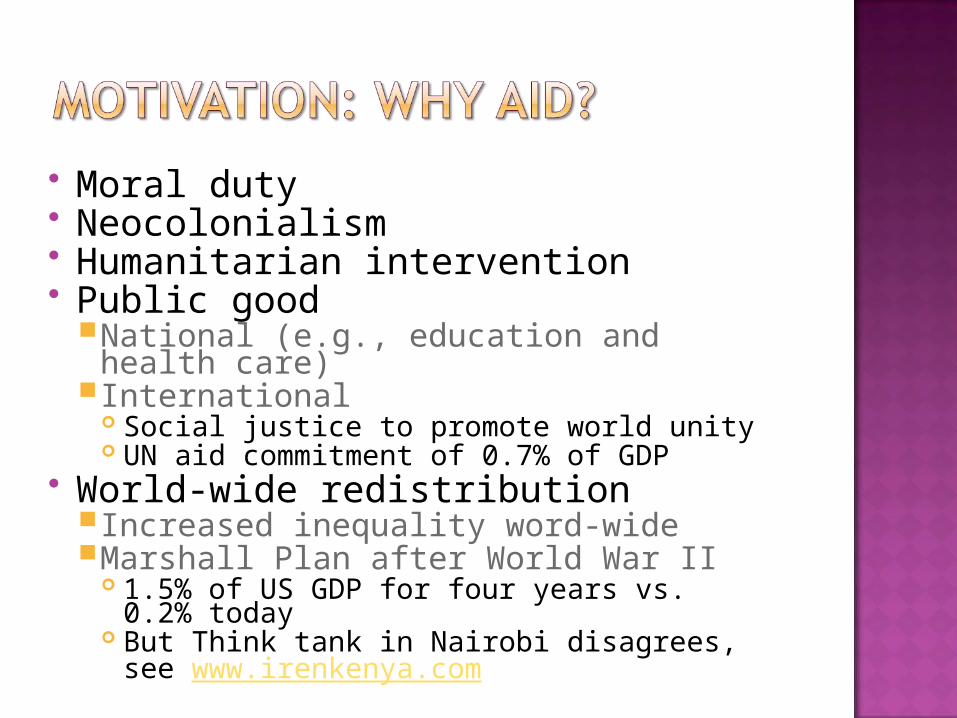
Moral duty Neocolonialism Humanitarian intervention Public good
National (e.g., education and health care)
International Social justice to promote world unity UN aid commitment of 0.7% of GDP
World-wide redistributionIncreased inequality word-wideMarshall Plan after World War II
1.5% of US GDP for four years vs. 0.2% today
But Think tank in Nairobi disagrees, see www.irenkenya.com
ObjectivesIndividuals in donor countries vs. governments in recipient countriesWho should receive the aid?
Today’s poor vs. tomorrow’s poorAid for consumption vs. investment
ConflictsBeneficiaries’ needsDonors’ interests

Aid is a recent phenomenon Four major periods since 1950
1950s: Fast growth (US, France, UK)1960s: Stabilization and new donors
Japan, Germany, Canada, Australia1970s: Rapid growth in aid again due to oil shocks, recession, cold war
1980s: Stagnation, aid fatigue, new methods, new thinking

Rapid growth of development aid US provided 50% of total ODA
To countries ranging from Greece to South Korea along the frontier of the “Sino-Soviet bloc”
France provided 30%To former colonies, mainly in West
Africa UK provided 10%
To Commonwealth countries

Stabilization of aid from traditional donors and emergence of new donors US contribution decreased considerably
after the Kennedy presidency (1961-63) The French contribution decreased
starting from the early 1960s New donors included Japan,
Germany, Canada, and Australia

Rapid growth in aid from industrial countries in response to the needs of developing countries due to Oil shocksSevere drought in the Sahel
The donor governments promised to deliver 0.7% of GNI in ODA at the UN General Assembly in 1970The deadline for reaching that target
was the mid-1970s

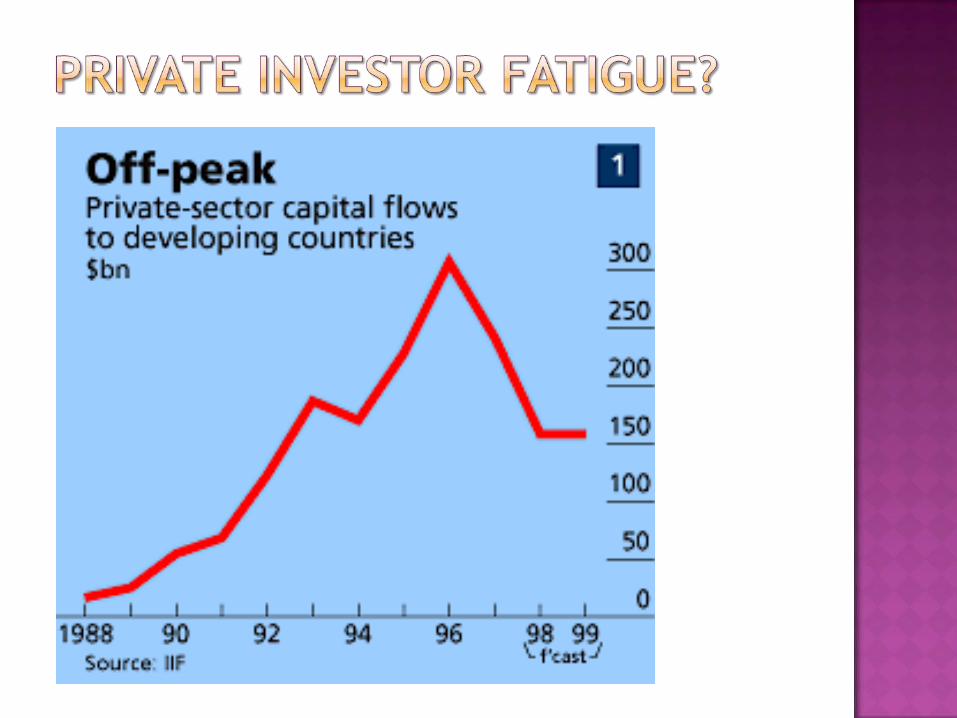
Stagnation of development assistanceDonor fatigue?Private investor fatigue?

12

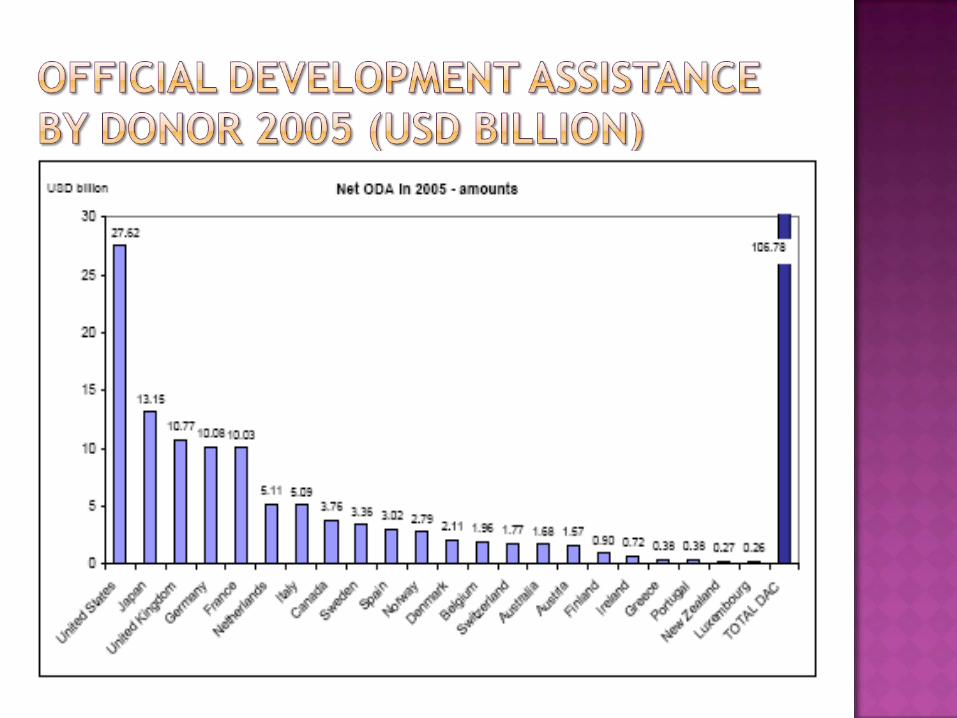
United States: largest donor in volume, but low in relation to GDPUS aid amounts to 0.2% of GDP
Japan: second-largest donor in volume
Nordic countries, Netherlands Major donors to multilateral programsSole countries whose assistance
accounts for 0.7% of GDP EU: leading multilateral donor

Even though targets and agendas have been set, year after year, almost all rich nations have constantly failed to reach their agreed obligations of the 0.7% target
Instead of 0.7% of GNI, the amount of aid has been around 0.4% (on average), some $100 billion short

0
5
10
15
20
25
30
35
40
sub-Saharan Africa
Asia Oceania MEDA Latin America Europe
1985 1990 2000
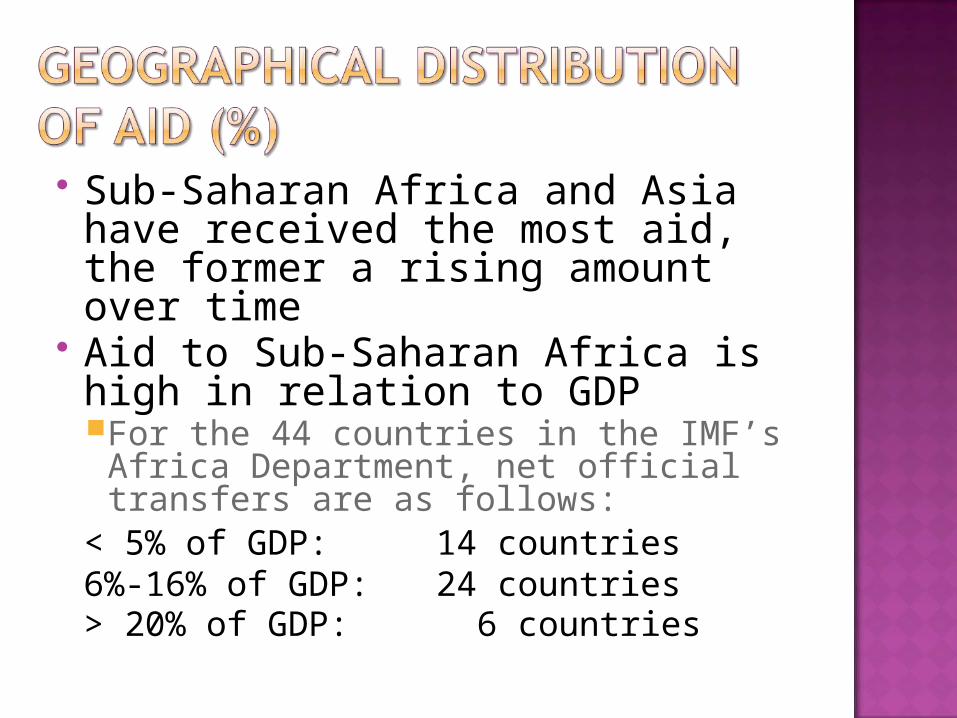
Sub-Saharan Africa and Asia have received the most aid, the former a rising amount over time
Aid to Sub-Saharan Africa is high in relation to GDPFor the 44 countries in the IMF’s
Africa Department, net official transfers are as follows:
< 5% of GDP: 14 countries6%-16% of GDP: 24 countries> 20% of GDP: 6 countries
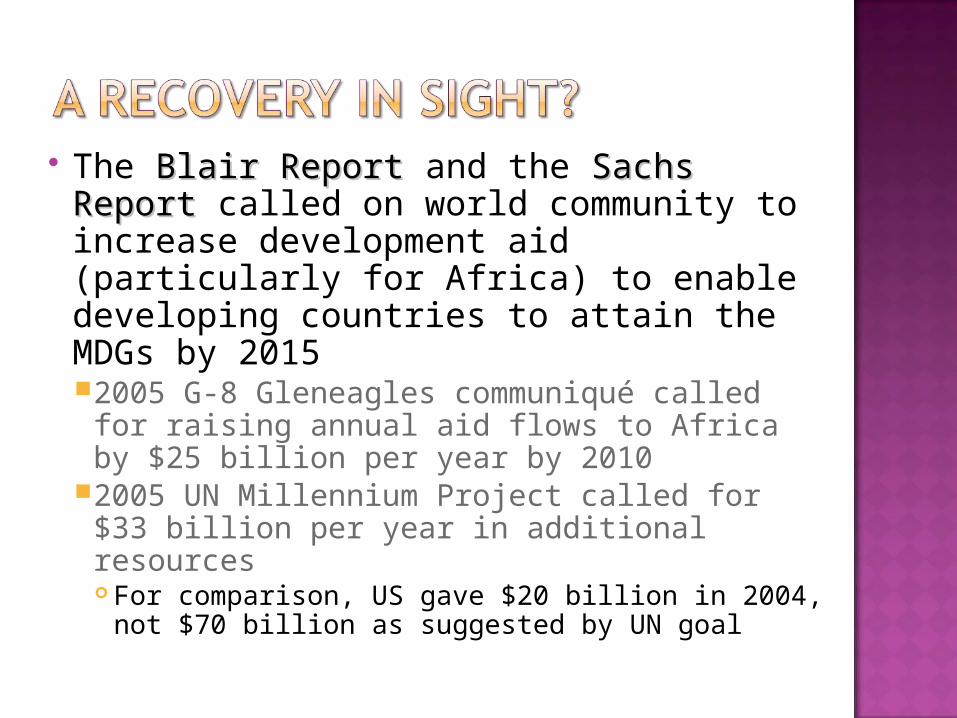
The Blair Report Blair Report and the Sachs Sachs ReportReport called on world community to increase development aid (particularly for Africa) to enable developing countries to attain the MDGs by 2015 2005 G-8 Gleneagles communiqué called
for raising annual aid flows to Africa by $25 billion per year by 2010
2005 UN Millennium Project called for $33 billion per year in additional resources For comparison, US gave $20 billion in 2004,
not $70 billion as suggested by UN goal

The recent increase in aid flows toward developing countries (particularly Africa) poses crucial questions for both recipient countries and donorsWhat is the role of aid? What is the macroeconomic impact of
aid? Is the impact of aid necessarily positive,
or could aid have adverse consequences?
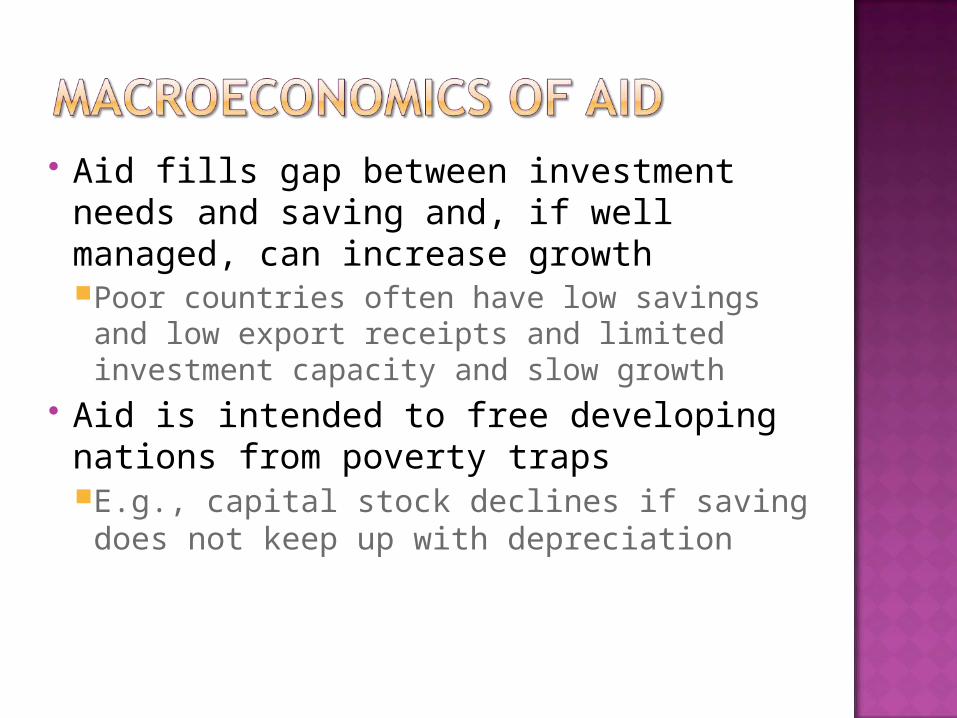
Aid fills gap between investment needs and saving and, if well managed, can increase growthPoor countries often have low savings
and low export receipts and limited investment capacity and slow growth
Aid is intended to free developing nations from poverty trapsE.g., capital stock declines if saving does not keep up with depreciation
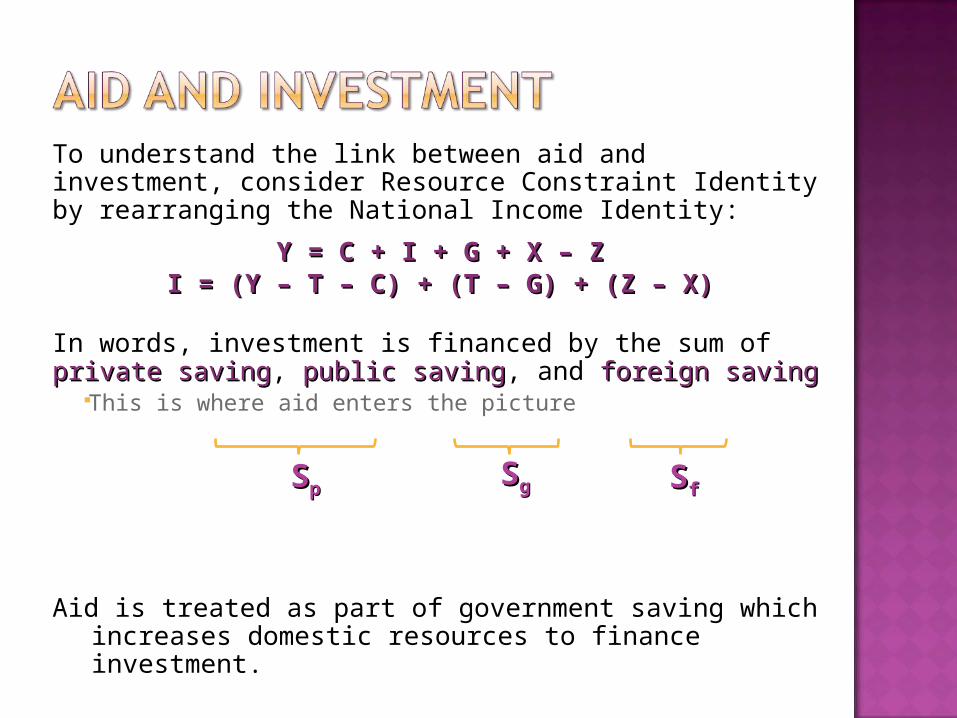
To understand the link between aid and investment, consider Resource Constraint Identity by rearranging the National Income Identity:
Y = C + I + G + X – ZY = C + I + G + X – ZI = (Y – T – C) + (T – G) + (Z – X)I = (Y – T – C) + (T – G) + (Z – X)
In words, investment is financed by the sum of private private savingsaving, public savingpublic saving, and foreign savingforeign saving
This is where aid enters the picture
Aid is treated as part of government saving which increases domestic resources to finance investment.
SSpp SSgg SSff

Rearrange again:
Y + Z = E + XY + Z = E + X
where EE is expenditure
E = C + I + GE = C + I + G
Total supply from domestic and foreign sources YY ++ ZZ equals total demand EE ++ XX
Aid increases recipient’s ability to import: ZZ rises with increased X, incl. TRX, incl. TR
Aid is treated as part of government saving which increases domestic resources to finance investment.
Poor countries are trapped by povertyDriving forces of growth (saving,
technological innovation, accumulation of human capital) are weakened by poverty
Countries become stuck in poverty traps Aid enables poor countries to free
themselves of poverty by enabling them to cross the necessary thresholds to launch growthSavingTechnologyHuman capital

Is it feasible to lift allall above a dollar a day? How much would it cost to eradicate
extreme poverty? Let’s do the arithmetic (Sachs)
Number of people with less than a dollar a day is 1.1 billion
Their average income is 77 cents a day, they need 1.08 dollarsDifference amounts to 31 cents a day, or
113 dollars per year Total cost is 124 billion dollars per year,
or 0.6% of GNP in industrial countriesLess than they promised! – and didn’t
deliver

Several empirical studies have assessed the impact of aid on growth, saving, and investment
The results are somewhat inconclusiveMost studies have shown that aid has no
significant statistical impact on growth, saving, or investment
However, aid has positive impact on growth when countries pursue “sound policies”Burnside and Dollar (2000)
Regression analysis to measure the impact of aid onSavingInvestmentPublic finance Economic growth
Saving Negative effect on saving
Substitution effect? I.e., crowding out? Boone 1996; Reiche 1995
Positive effect for good performers E.g., South-East Asia, Botswana
InvestmentNo impact on private investmentPositive impact for good performers
Public financeUncertain effect on public investmentPositive effect on public consumption

Growth: Mixed results Most early studies showed no statistically significant impact
Some more recent studies show negative impact Selection bias and endogeneity
issues Need to distinguish between
different types of aidLeakages, cash vs. aid in kind

Foreign aid has sometimes been compared to natural resource discoveries
Aid and growth are inversely related across countries
Cause and effect 156 countries,
1960-2000
-8
-6
-4
-2
0
2
4
6
-20 0 20 40 60 80
Foreign aid (% of GDP)
Per
cap
ita g
row
th a
djus
ted
for
initi
al in
com
e (%
) r = -0.36
r = rank correlation
Other people’s
money
No robust relationship between aid and growth
Aid works in “countries with good policies”
Aid works if measured correctly Distinction between fast impact aid
(infrastructure projects) and slow impact aid (education)Infrastructure: High financial returnsEducation and health: High social
returns
So, empirical evidence is mixed Need to distinguish between
different types of aid Need to acknowledge diminishing
returns to aid as well as limits to domestic absorptive capacity
Need to clarify interaction with governance and good policies
Special case: Post-conflict situations
Aid may lead to corruption Aid may be misused, by donors as
well as recipients Donors: Excessive administrative costsRecipients: Mismanagement,
expropriation Aid may be badly distributed,
sometimes for strategic reasonsSupporting government against
political opposition

Aid increases public consumption, not public investment
Aid is procyclicalWhen it rains, it pours
Aid leads to “Dutch disease”Labor-intensive and export industries
contract relative to other industries in countries receiving high aid inflows
Dutch disease may undermine external sustainability
Aid volatility and unpredictability may undermine economic stability in recipient countriesEconomic vs. social impact
Growth is perhaps not the best yardstick for the usefulness of aidLong run vs. short run
E.g., increased saving reduces level of level of GDP GDP in short run, but increases growth of GDPgrowth of GDP in long run

Appreciation of currency in real terms, either through inflation or nominal appreciation, leads to a loss of export competitiveness
In 1960s, Netherlands discovered natural resources (gas deposits)Currency appreciated Exports of manufactures and services
suffered, but not for long Not unlike natural resource discoveries,
aid inflows could trigger the Dutch Disease in receiving countries
See my “Dutch Disease” in the New Palgrave Dictionary of Economics Online

Foreign exchange is converted into local currency and used to buy domestic goods
Fixed Fixed exchange rate regimeExpansion of money supply leads to
inflation and an appreciation of real exchange rate
FlexibleFlexible exchange rate regimeIncrease in the supply of foreign
exchange leads to an appreciation of the nominal exchange rate, so the real exchange rate also appreciates
Review theory of Dutch disease in two roundsDemand and supply modelTwo-sector model
Demand effectsSupply effectsExchange rate volatility

Foreign exchange
Real exch
an
ge r
ate
Imports
Exports
Earnings from exports of goods, services, and capital
Payments for imports of goods, services, and capital
Equilibrium
*P
ePQ
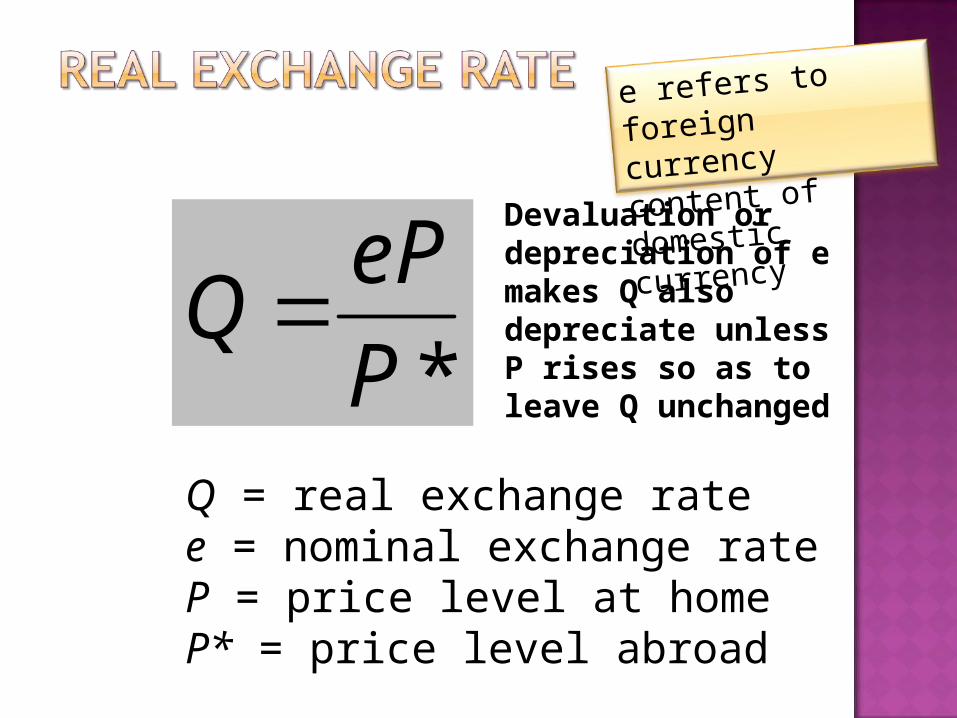
Q = real exchange ratee = nominal exchange rateP = price level at homeP* = price level abroad
Devaluation or depreciation of e makes Q also depreciate unless P rises so as to leave Q unchanged
e refers to foreign
currency content
of domestic
currency
*P
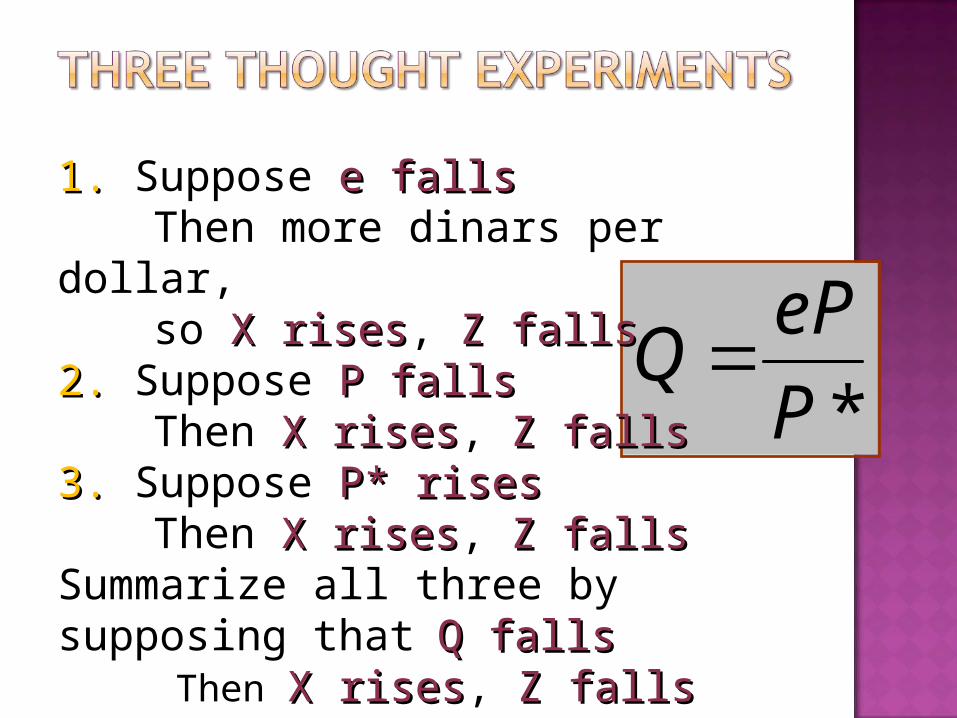
ePQ
1.1. Suppose e fallse fallsThen more dinars per dollar, so X risesX rises, Z fallsZ falls
2.2. Suppose P fallsP fallsThen X risesX rises, Z fallsZ falls
3.3. Suppose P* risesP* risesThen X risesX rises, Z fallsZ falls
Summarize all three by supposing that Q fallsQ falls
Then X risesX rises, Z fallsZ falls

Foreign exchange
Real exch
an
ge r
ate
Imports
Exports
Exports plus aidaid
Aid leads to appreciation, and thus reduces exports
A
C B

Foreign exchange
Real exch
an
ge r
ate
Imports
Exports
Exports plus oiloil
Oil discovery leads to appreciation, and reduces nonoil exports
A
C B

Foreign exchange
Real exch
an
ge r
ate
Imports
Exports
Exports plus oiloil
Composition of exports matters
A
C B
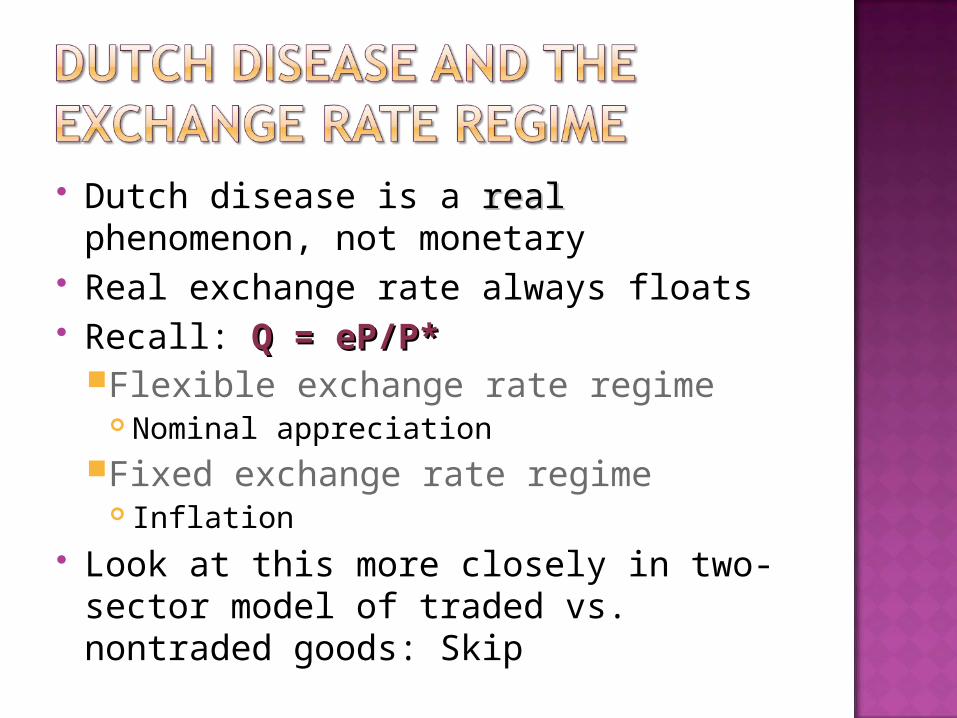
Dutch disease is a realreal phenomenon, not monetary
Real exchange rate always floats Recall: Q = eP/P*Q = eP/P*
Flexible exchange rate regime Nominal appreciation
Fixed exchange rate regime Inflation
Look at this more closely in two-sector model of traded vs. nontraded goods: Skip

A large inflow of foreign aid -- like a natural resource discovery -- can trigger a bout of Dutch disease in countries receiving aid
A real appreciation reduces the competitiveness of exports and might thus undermine economic growthExports have played a pivotal role in the
economic development of many countries
An accumulation of “know-how” often takes place in the export sector, which may confer positive externalities on the rest of the economy
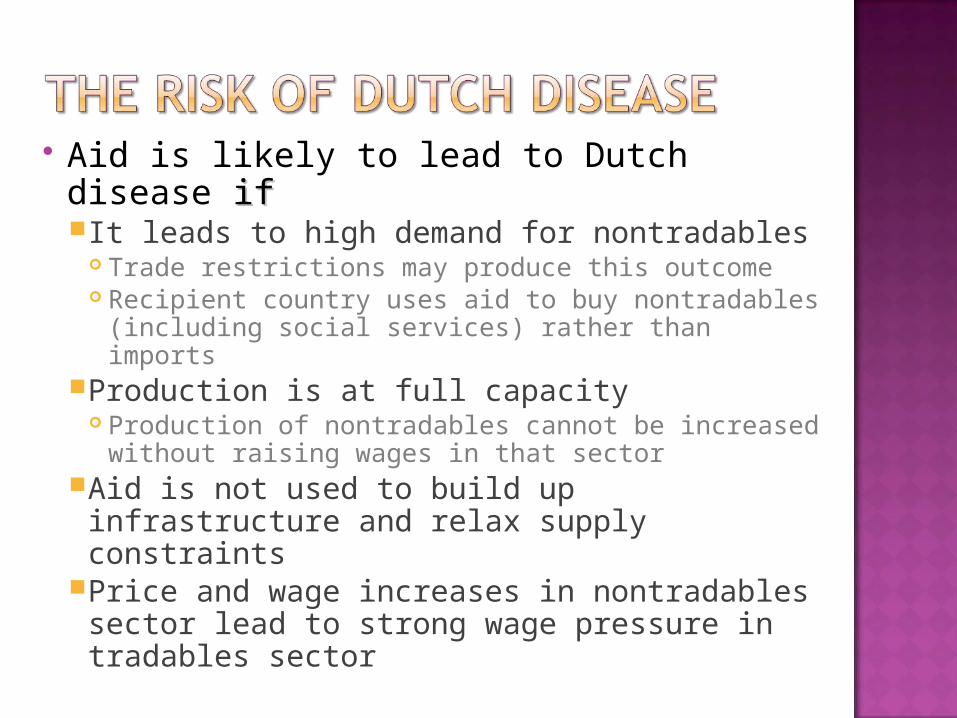
Aid is likely to lead to Dutch disease ifif It leads to high demand for nontradables
Trade restrictions may produce this outcome Recipient country uses aid to buy
nontradables (including social services) rather than imports
Production is at full capacity Production of nontradables cannot be
increased without raising wages in that sectorAid is not used to build up infrastructure
and relax supply constraints Price and wage increases in
nontradables sector lead to strong wage pressure in tradables sector
The risk that aid flows might have an adverse impact on the economy as a result of aid-induced Dutch Disease crucially depends on how aid is used in the recipient countries
We can identify fourfour different cases on the basis of how the aid is spent, and in which the macroeconomic implications of aid flows are different
Aid spending can take several forms, with different macroeconomic implications:Case 1Case 1: Aid received is savedsaved by
recipient country government Case 2Case 2: Aid is used to purchase used to purchase
imported goodsimported goods that would not have been purchased otherwise (grants in kind)
Case 3Case 3: Aid is used to buy nontradables used to buy nontradables with infinitely elastic supply with infinitely elastic supply
Case 4Case 4: Aid is used to buy nontradables used to buy nontradables for which there are supply constraintsfor which there are supply constraints
Aid received is saved by recipient country governmentAid receipts leads to accumulation of
foreign exchange reserves in Central Bank … and, unlike increased aid that is spent, are
not allowed to enter the spending streamNo effect on money supplyNo inflationNo appreciation of nominal exchange
rateNo risk of Dutch disease
Aid is used to purchase imported goods that would not have been purchased otherwise (grants in kind)Import purchases lead to transfer of real
resources from abroad, but not to increased spending at home
No effect on money supplyNo inflationNo appreciation of nominal exchange rateNo risk of Dutch disease
Aid is used to buy domestic nontradables with infinitely elastic supply due to underutilized resources (labor and capital) in economy Increased demand for nontradablesBecause some resources are unemployed,
greater demand leads to increased supplyThis has a positive impact on production
without increasing the price of nontradables
No risk of Dutch disease

Aid is used to buy nontradables for which there are supply constraints, since all available resources are already in use (e.g., social services)Increased demand for nontradablesIncreased prices for nontradablesShift of resources away from the
tradables (exports) and into nontradables
Real appreciation of the currencyDutch disease!

Monetary policy response determines if real appreciation of currency will be caused by inflation or by nominal appreciationIf foreign currency is used to increase the
reserves of the Central Bank, aid spending on nontradables leads to an increase in money supply and to inflation
If Central Bank sterilizes the impact of aid spending in nontradables on money supply by selling foreign exchange, currency appreciates in nominal termsSo, in either case,
currency appreciates in
real terms
To recapitulate, the risk of Dutch disease varies, and depends onHow aid is used (saved or spent) –
CASE 1CASE 1The presence of an aid absorption
constraint – CASE 2CASE 2The impact of aid on productivity in
the nontradable goods sector – CASE 3CASE 3The existence of externalities in the
nontradable goods sector affecting the rest of the economy – CASE 4CASE 4

Aid can give rise to Dutch disease when the recipient country’s government uses the aid to purchase nontradables rather than imported goods and when there are constraints on increasing production in the nontradables sectors
The risk of Dutch disease is greater when aid is used in social sectors that face constraints on increasing their production due to resource scarcity (aid absorption constraint)

How can recipient countries avoid translating aid into Dutch disease? Save aid received and increase
central bank reserves (gross, not net) by not allowing the increased aid to enter the spending stream
Use aid to purchase imported goodsBoost aid absorption capacity in the
nontradables sector

Policymakers in recipient countries need to pay attention to potential early warning signals of aid-induced Dutch disease such asA tendency for wages and prices in
the nontradables sector to increase A decline in the profitability and
sales of the export and import-competing industries
Once more, the macroeconomic impact of aid depends critically on the policy response to aidInteraction between fiscal policy and
monetary policy is crucial To highlight this interaction, apply
two related but distinct concepts AbsorptionAbsorption: Monetary policySpendingSpending: Fiscal policy

AbsorptionExtent to which the non-aid current
account deficit widens with increased aid Captures the amount of net imports financed
by an increase in aid Given fiscal policy, absorption is
controlled by Central Bank’s decision about how much of the aid-induced foreign exchange to sell in the markets If Central Bank uses the full increment of aid-
induced foreign exchange to bolster reserves, aid will not be absorbed

SpendingExtent to which the non-aid fiscal deficit
widens with increased aid Captures the extent to which the
government uses aid to finance an increase in expenditures
Given monetary policy, spending is controlled by the government’s decision about how much of the aid to spend, on either imports or non-traded goods If the government decides to save the full
increment in aid, aid will not enter the spending stream

Different combinations of absorption and spending define the policy response to a surge in aid inflowsAbsorption and spending are equivalentequivalent if
aid is in kind or if it is spent on importsAbsorption and spending differdiffer when the
government provides the aid-related foreign exchange to Central Bank and chooses how much to spend on domestic goods while the Central Bank decides how much of the aid-related foreign exchange to sell in markets

Studies assessing empirical relevance of Dutch disease as caused by aid flows have produced mixed resultsAid was associated with real
appreciationappreciation in Malawi and Sri Lanka
Aid was associated with with real depreciationdepreciation in Ghana, Nigeria, and Tanzania
Ethiopia, Ghana, Tanzania, Mozambique, and Uganda experienced a surge in aid 1998-2003 (Berg et al. 2007)The net aid increment ranged from 2% of
GDP in Tanzania to 8% of GDP in EthiopiaHigh everywhere, from 7% to 20 % of GDP
In Ghana, sharp increase in 2001 followed by a slump in 2002 and another surge in 2003 In all other countries, the surge in aid was
persistent, i.e., after the initial jump, aid inflows remained higher than before

In the five countries, no evidence of aid-induced Dutch-DiseaseReal exchange rates did not appreciate
during the aid surgesOnly Ghana had a small real
appreciation while the others experienced a real depreciation From 1.5% in Mozambique (2000) to 6.5%
in Uganda (2001) Why?
The macroeconomic policy response was meant to avoid a real appreciation
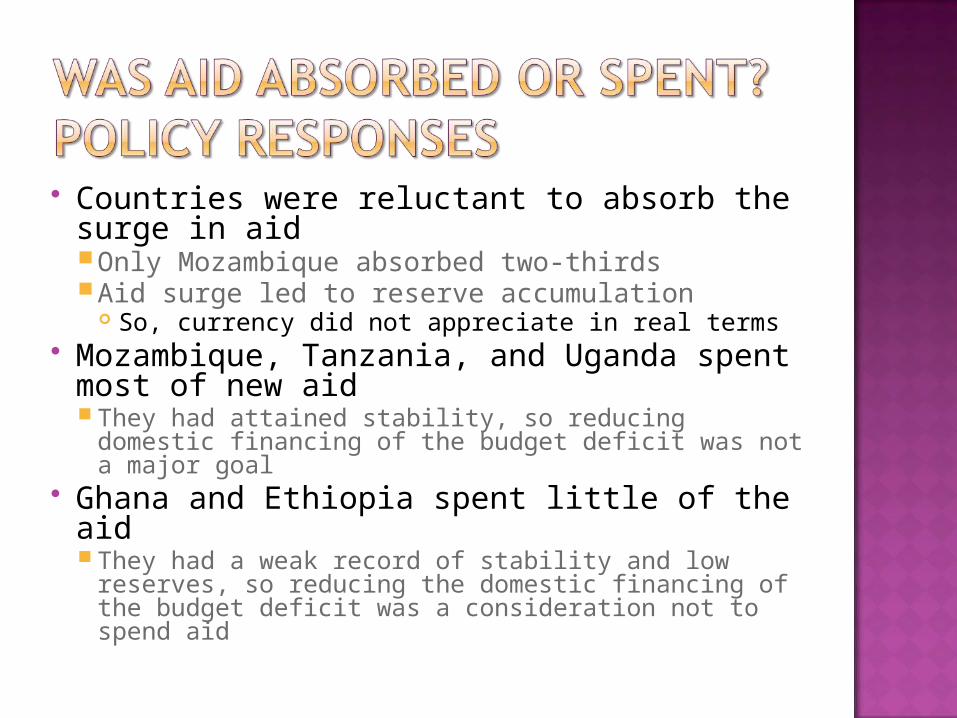
Countries were reluctant to absorb the surge in aidOnly Mozambique absorbed two-thirdsAid surge led to reserve accumulation
So, currency did not appreciate in real terms Mozambique, Tanzania, and Uganda
spent most of new aid They had attained stability, so reducing domestic
financing of the budget deficit was not a major goal Ghana and Ethiopia spent little of the aid
They had a weak record of stability and low reserves, so reducing the domestic financing of the budget deficit was a consideration not to spend aid
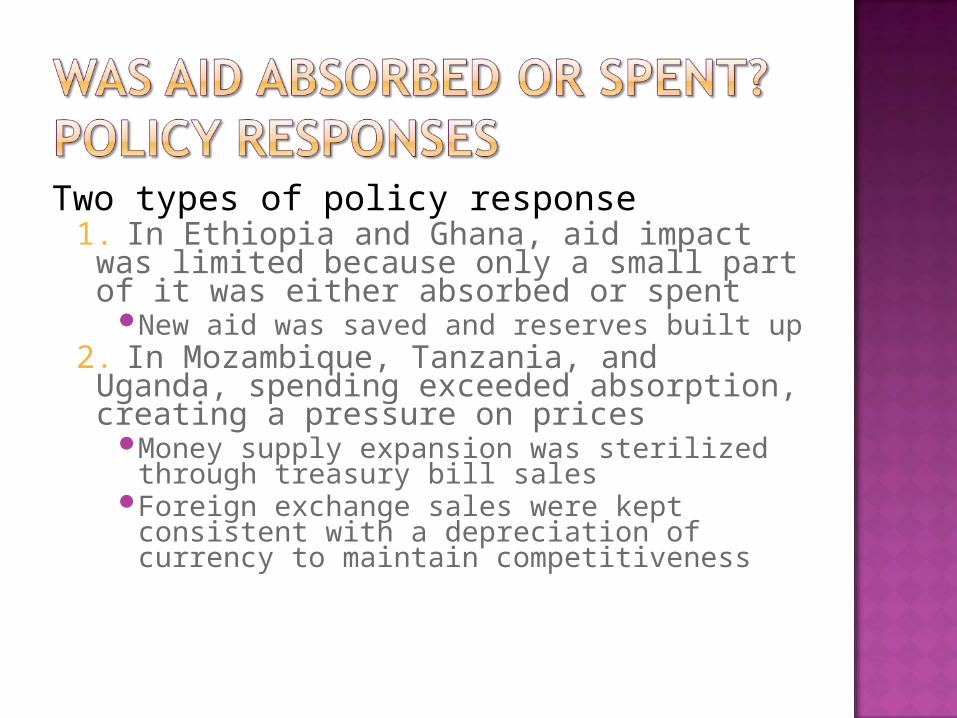
Two types of policy response1. In Ethiopia and Ghana, aid impact was limited because only a small part of it was either absorbed or spent
New aid was saved and reserves built up2. In Mozambique, Tanzania, and Uganda, spending exceeded absorption, creating a pressure on prices
Money supply expansion was sterilized through treasury bill sales
Foreign exchange sales were kept consistent with a depreciation of currency to maintain competitiveness

Was aid-induced Dutch disease a problem?
No evidence of significant real appreciation following surge in aidMacroeconomic policy response (fiscal
and monetary policy mix) avoided real appreciation
“Not absorb and not spend” vs. “spend more than absorb”

The choice in some countries to “not absorb and not spend” new aid preserved competitiveness while allowing the replenishing of international reserves
The choice in some other countries to “spend more than absorb” went along with sterilization of public spending that contained inflationary pressures

Aid can play a key role in the development of recipient countries, but it can also generate macroeconomic vulnerabilities
Recipients need to implement appropriate policies to manage aid flows to avoid macroeconomic hazardsThe appropriate policy response needs to
take into account Potential impact of aid on competitiveness Existence of constraints to aid absorption Risks linked to aid volatility and to external debt
sustainability

Aid is increasingly volatile and unpredictableAid flows are 6-40 times more volatile than
fiscal revenueVolatility is largest for aid dependent
countries (Bulir and Hamann 2003, 2007)Volatility increased in the 1990sAid delivery falls short of pledges by over
40% Reasons for aid volatility
Donors: Changes in priorities; administrative and budgetary delays
Recipients: Failure to satisfy conditions IMF conditionality often guides donors, helping
them decide if the country’s policies are on track

Impact of large sudden inflowsSupply constraints in absorbing aidReal exchange rate overshooting and
volatilityNegative impact on budget managementNegative impact on export industriesRatcheting up spending commitments
without adequate consideration of exit strategy
Infrastructure investment without adequate planning for recurrent expenditure Maintenance
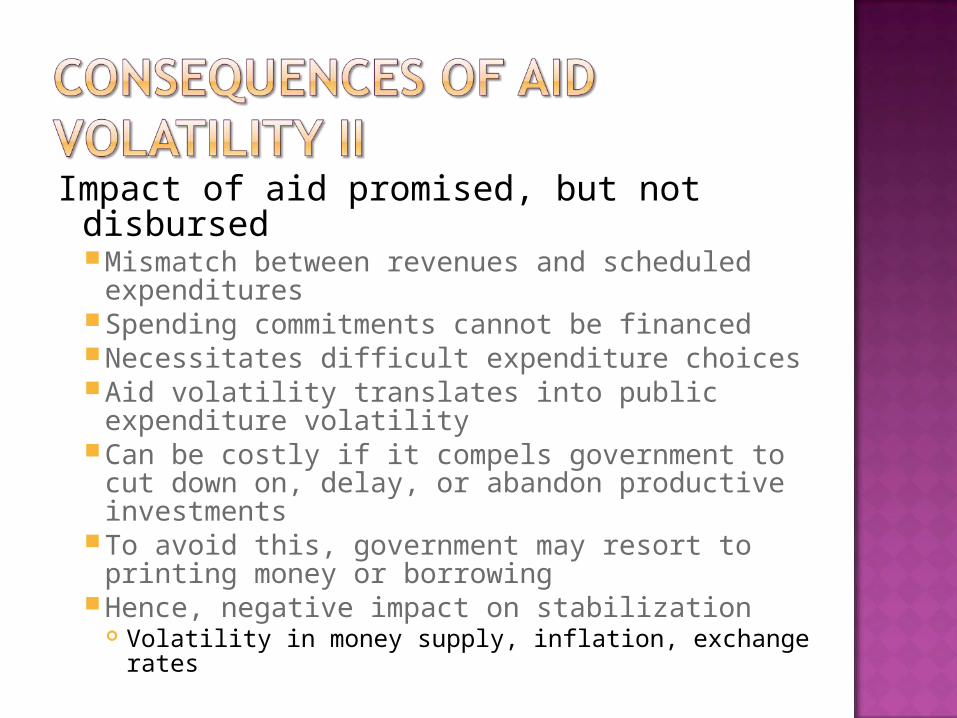
Impact of aid promised, but not disbursedMismatch between revenues and scheduled
expendituresSpending commitments cannot be financedNecessitates difficult expenditure choicesAid volatility translates into public
expenditure volatilityCan be costly if it compels government to cut
down on, delay, or abandon productive investments
To avoid this, government may resort to printing money or borrowing
Hence, negative impact on stabilization Volatility in money supply, inflation, exchange
rates

Donors need to disburse aid according to the agreed schedule and increase transparency toward recipient country governments
Recipient countries need to respect the conditionality of development aid disbursements
Recipients need to be granted more flexibility in their choices to spend or save aid flows, specifically in light of the time span for the aid they receiveE.g., during 2000-03, Ghana chose to save
unexpected aid increases and to supplement its Central Bank reserves

A substantial acceleration in aid flows could adversely affect the external debt sustainability of recipients
Development aid may take the form of grantsgrants or concessional loansloansGrants are unrequited transfersConcessional loans increase outstanding
debt and the amount of resources needed to service that debt

Studies have shown that debt sustainability may deteriorate even if loans are concessional Daseking and Joshi (2005)
It is crucial for donors to choose an appropriate mix of grants and loans in order for recipients to achieve the MDGs without undermining their external debt sustainability

Advantages of grantsDo not increase debt burdenUseful for social projects with uncertain
or delayed returns (health care, education)
Advantage of concessional loansMobilize more resourcesIncrease debt management capacityUseful for projects yielding quick
returns (infrastructure)
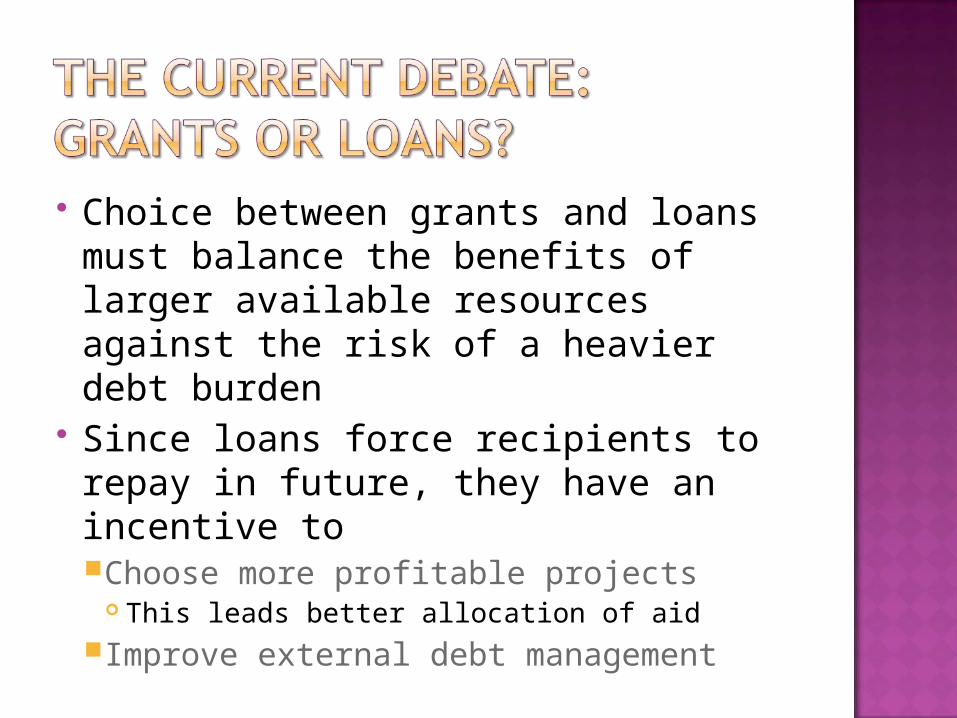
Choice between grants and loans must balance the benefits of larger available resources against the risk of a heavier debt burden
Since loans force recipients to repay in future, they have an incentive toChoose more profitable projects
This leads better allocation of aidImprove external debt management

Efforts to find an appropriate balance between loans and grants can be based onProject-based approachCountry-based approach

Grants To finance investments with a significant social impact social impact but whose return is uncertain or difficult to appropriate or which need a longer period to be profitable E.g., education and health care
Loans To finance projects that yield profitsprofits more quickly E.g., infrastructure

An appropriate balance between grants and loans is determined case by case Based on the sustainability of recipient’s
debt as well as its exposure to revenue/growth volatility
Poorest countries receive a larger proportion of aid through grants
Countries with higher growth rates and sound economic policies receive a larger proportion of loans
Corruption and economic performanceImpact on growthLikelihood of disbursement
Anticorruption strategiesReduce state roleImprove regulatory environmentPunish offendersLiberalize and reform institutions
Improving public expenditure management systems

From aid fatigue to new initiatives Aid effectiveness is ambiguous
Positive results likely with better policies and governance
Five Primary GuidelinesMinimize risks of Dutch diseaseEnhance growth – Always a good idea!Assess the policy mixPromote good governance and reduce
corruptionPrepare an exit strategy

Bulir and Hamann 2003, “Aid volatility: An empirical Assessment,” IMF Staff Papers.
______, 2007, “Volatility of Development Aid: An Update,” IMF Staff Papers.
Daseking and Joshi, 2005, Debt and New Financing in Low-Income Countries, IMF.
Isard, Lipschitz, Mourmouras, and Yontcheva, 2006, Macroeconomic Management of Foreign Aid: Opportunities and Pitfalls, IMF.
Gupta, Powell, and Yang, 2006, Macroeconomic Challenges of Scaling up Aid to Africa: A Checklist for Practitioners, IMF.
Rajan and Subramanian, 2005, “Aid and Growth: What Does the Cross-Country Evidence Really Show?,” IMF Working Paper.
______, 2005, “What Undermines Aid’s Impact on Growth?,” IMF Working Paper.

Aid can play an important role in the growth and development of recipient countries …… but it can also create macroeconomic
vulnerabilities Recipient countries need to
manage aid flows so as to avoid hazardsNeed to consider potential impact of aid on
Competitiveness Constraints to aid absorption Risks linked to aid volatility and to external
debt sustainability
THE END
These slides will be posted on my website: www.hi.is/~gylfason