thinking outside the lake: multiple scales of …
TRANSCRIPT

THINKING OUTSIDE THE LAKE: MULTIPLE SCALES OF
AMPHIPOD RECOVERY
by
Brian William Kielstra
A thesis submitted to the Department of Biology
In conformity with the requirements for
the degree of Master of Science
Queen’s University
Kingston, Ontario, Canada
(January, 2014)
Copyright ©Brian William Kielstra, 2014

ii
Abstract
Tracking recovery in disturbed environments requires the consideration of many spatial
and temporal scales. A sensitive indicator organism, Hyalella azteca, was used to assess
lake recovery at multiple scales in the region of Sudbury, Canada. A 40-lake presence-
absence survey was conducted over a period of 23 years to track colonization history and
chemical factors that limit this typically ubiquitous organism. A six-lake study was used
to investigate the importance of spatially varying watershed characteristics within lakes,
which could provide habitat hot spots for colonization during early stages of recovery. An
intensive single-lake study examined the effects of local-scale chemistry (e.g.,
bioavailable metals, waterborne organic matter) and adjacent subcatchment terrestrial
features on the availability of suitable habitat for colonizing amphipods. At the regional
scale, presence-absence models suggested that colonization probability increased with
lake water conductivity and alkalinity. Within lakes, subcatchment confluence sites
appeared to be important habitats in the early stages of colonization. Site-specific
features, such as macrophyte and woody debris cover, increased and decreased H. azteca
abundance, respectively, and yet these relationships were influenced by adjacent
terrestrial subcatchment characteristics. For example, with more terrestrial vegetation, the
relative increase in abundance due to macrophyte cover was further increased. Within the
intensively-studied lake, larger subcatchments with more terrestrially-derived waterborne
organic matter had higher abundances of H. azteca. Using H. azteca as an indicator of
aquatic ecosystem health, these relationships suggest that as lakes recover, subcatchment
confluence sites can be hot-spots for colonization, and their suitability improves with
interactions between local habitat characteristics and terrestrial characteristics.

iii
Acknowledgements
Many people helped to complete this thesis and throughout my MSc research. I would
like to thank my co-advisors Shelley Arnott and John Gunn for allowing me the freedom
to explore and develop my ideas around this project, even if it meant having to rope me
back in from time to time. Your personal anecdotes, the time you spend with students,
and the genuine commitment you show for their success is something for which I have a
great deal of respect. To the Arnott Lab (past and present) with whom I spent many lab
lunches crammed around that table getting to know you: Derek Gray, Patrick Turko,
Amanda Bresnehan, Mike Yuille, James Sinclair, Shakira Azan, Sarah Hasnain, and Alex
Ross. To Anneli Jokela, and Celia Symons for friendship and the good times in and out of
school. To my co-conspirator Kimberley Lemmen for being a good friend and
hilarity/sanity check. To members (past and present) of the Cooperative Freshwater
Ecology Unit, a place I called home for an amazing 4 summers; particularly Erik
Szkokan-Emilson, Caroline Sadlier, Michelle Gillespie, Andrew Corston, Ashley Stasko,
Karen Oman, Jocelyne Heneberry, Bill Keller, Tom Johnston, Kim Fram, Chantal
Sarrazin-Delay, Lynne Witty. Your commitment to helping others out is exceptional. To
Alan Lock, Bjørn Rosseland, and Graeme Spiers for assistance with DGTs. To Colleen
Smith for all of the encouragement. To my parents, Peter and Judy, for offering their
support through everything and always calling just to check in and ask about how ‘my
aztecas are doing’. To my siblings, David and Wendy, for doing the same. Finally to the
most important person in the world to me, Corina, I thank you for being beside me the
whole time.

iv
Table of Contents
Abstract ............................................................................................................................... ii
Acknowledgements............................................................................................................ iii
List of Figures .................................................................................................................... vi
List of Tables ................................................................................................................... viii
List of Abbreviations ......................................................................................................... ix
Chapter 1 Introduction ........................................................................................................ 1
Chapter 2 Materials and Methods ....................................................................................... 7
2.1 Regional presence-absence survey............................................................................ 7
2.1.1 H. azteca collection ............................................................................................ 7
2.1.2 Water Chemistry................................................................................................. 9
2.1.3 Statistical analyses ............................................................................................ 10
2.2 Six lake abundance survey ...................................................................................... 12
2.2.1 Study design and lakes ..................................................................................... 12
2.2.2 H. azteca collection and site characterization .................................................. 14
2.2.3 Statistical analyses ............................................................................................ 22
2.3 Single lake abundance survey ................................................................................. 26
2.3.1 Daisy Lake........................................................................................................ 26
2.3.2 H. azteca collection and site characterization .................................................. 26
2.3.3 Water chemistry................................................................................................ 27
2.3.4 Statistical analysis............................................................................................. 33
Chapter 3 Results .............................................................................................................. 37
3.1 Regional presence-absence survey.......................................................................... 37
3.2 Six-lake abundance survey...................................................................................... 40
3.3 Single-lake abundance survey................................................................................. 46
Chapter 4 Discussion ........................................................................................................ 52
Chapter 5 Summary .......................................................................................................... 62
References......................................................................................................................... 63
Appendix A Sampling details for regional presence-absence survey............................... 74
Appendix B Elution efficiencies and diffusion coefficients for DGT calculations .......... 75

v
Appendix C Summary statistics and Wilcoxon tests for chemical variables in Daisy Lake
........................................................................................................................................... 76
Appendix D GLMM modelling results from Daisy Lake study ....................................... 78

vi
List of Figures
FIGURE 1 - Hyalella azteca specimen collected in August 2012 from Little Raft Lake in
Sudbury, Ontario. Adults are typically 5–7 mm in length. This image was used with
permission from Lynne Witty, Senior Invertebrate Taxonomist. ....................................... 5
FIGURE 2 - Colonization history of Hyalella azteca through time from surveys
conducted in 1990/1991, 2003, 2010, and 2011/2012. Note the 2010 survey was
conducted on Bibby, Broder 23, Camp, Clearwater, Crooked, Daisy, Dill, Lohi, and
Silver lakes for Babin-Fenske et al. (2012). Hazen, Hidden, Honda, and Swan lakes were
not sampled in 2003. No H. azteca were found in Clearwater Lake using survey
protocols, however, there were 5 detected using alternative methods presented in this
study. Note the regions of barren and semi-barren areas delineated by McCall et al.
(1995). ................................................................................................................................. 8
FIGURE 3 – Photographs of modified Hester-Dendy artificial substrates. Photographs
were taken A) prior to deployment, B) underwater immediately after deployment, and C)
following three weeks of deployment. Note that photographs are not of the same sampler.
........................................................................................................................................... 15
FIGURE 4 – Depiction of subcatchment characteristics. CTWI is Compound
Topographic Wetness Index where lighter values indicate more potential soil water
saturation. For impermeable/bare soils, dark pixels are impermeable/bare soils and light
pixels are vegetation. TCT WI is Tasseled Cap Transformation Wetness Index where
lighter values indicate less vegetation/soil water content. NDVI is Normalized Difference
Vegetation Index where lighter values indicate higher vegetation density. ..................... 18
FIGURE 5 - Daisy Lake subcatchment and lake sites. The star denotes a subcatchment
that was historically limed. ............................................................................................... 27
FIGURE 6 - The number of lakes colonized (shaded) by H. azteca has increased over
time ................................................................................................................................... 38
FIGURE 7 - Biplots of the first two axes of the PCA for chemistry separated by survey
year. PC1 and PC2 generally represent a conductivity/alkalinity gradient and metal
gradient, respectively. Points that are closer together in space are more similar in
chemical condition ............................................................................................................ 38

vii
FIGURE 8 - Boxplots of site means separated by lake and into subcatchment and lake
site categories (left). Expected abundance and 95% confidence intervals at lake and
subcatchment sites from GLMM model separated by lakes (right). In both figures, note
the natural logarithm scale. Lakes are Clearwater (C), Daisy (D), Lohi (L), Hannah (H),
Middle (M), and Richard (R). The vertical lines separate lakes into lakes colonized
between 2003–2012, colonized between 1990–2003, and colonized before 1990........... 41
FIGURE 9- The interactions of NDVI with standardized predictor variables on
abundance. Left plots show expected marginal abundance with predictor variables at
different NDVI values. Shaded polygons show 95% confidence intervals of the predicted
relationship. Means and standard deviations of predictor variables presented in plots in
right column. Plots in right column are three dimensional scatterplots of standardized
predictor variables (x-axis), standardized NDVI (z-axis), and subcatchment abundance
means scaled by their respective lake means. Mean and standard deviation of NDVI:
0.67, 0.07........................................................................................................................... 45
FIGURE 10 - Predicted marginal (i.e., not accounting for random effects) relationship
between subcatchment area and H. azteca abundance (left) and after incorporating the
fluorescence index (FI) (right). Sites are plotted as site mean ± 1 SD on the natural
logarithmic scale. Shaded polygons show the 95% CI about the predicted relationship.
Note that smaller dotted lines and lighter polygons (right) above and below the average
relationship represent are for a -1 SD and +1 SD shift, respectively................................ 48
FIGURE 11- Predicted marginal relationship between mean TCT WI and H. azteca
abundance (left) and after FI (right). Sites are plotted as mean ± 1SD on the natural
logarithmic scale. Shaded polygons show the 95% CI about the predicted relationship.
Lighter polygons (right) and smaller dotted lines represent the change in relationship for
a ±1 SD shift in FI............................................................................................................. 50
FIGURE 12 - Predicted marginal relationship between medium CTWI and H. azteca
abundance (left) and after incorporating Cd (right). Sites are plotted as mean ± 1SD on
the natural logarithmic scale. Shaded polygons show the 95% CI about the predicted
relationship. Darker polygons represent the average marginal relationship. Thin dotted
lines indicate the relationship between medium CTWI and H. azteca for a ± 1 SD change
in the % impermeable/bare soils (positive slope = low %)............................................... 51

viii
List of Tables
TABLE 1 - Limnological variables from six lake abundance surveys. Values are
averaged from monthly epilimnion/metalimnion composite samples taken from May–
August 2011 (Ontario Ministry of the Environment). Richard Lake samples are from
2010. Abbreviations used are: alkalinity (Alk.), conductivity (Cond.), and total
phosphorus (TP)................................................................................................................ 13
TABLE 2- Model results from hierarchical partitioning and binomial GLMs. Models
were fit for each survey. Model coefficients and 95% confidence intervals (CI) are
expressed using ln(odds ratio). AUC represents the area under the ROC curve where
values approaching 1 indicated a near perfect separation among groups (presence-
absence)............................................................................................................................. 39
TABLE 3 - Site and dendy information for all lakes. Mean and standard deviation (SD)
calculated from pooling all dendies in each lake. ............................................................. 40
TABLE 4 - Model results from the GLMMs comparing abundances between
subcatchment and lake sites, and between subcatchments. Model coefficients and 95%
credible intervals (CrI) are shown on the scale of the linear predictor (natural logarithm).
Variables with 95% CrI not overlapping zero are bolded. The null intercept-only model
with random effects is presented for comparison. Abbreviations used are: subcatchment
(Sub), macrophytes (Mac), woody debris (Wood), subcatchment area (Area),
impermeable/bare soils (Imp), and high CTWI (H CTWI). The % variance component
(VC) reduction compares to the variance estimate from the null model. DIC is Deviance
Information Criteria. Marginal GLMM R2 is explained variance using fixed effects only.
Conditional GLMM R2 uses random effects. ................................................................... 42
TABLE 5- Model results from null and best candidate GLMMs associating H. azteca
abundance with landscape, chemistry, and macrophyte variables. Coefficients and 95%
CI are given on the scale of the linear predictor (natural log), bolded when not
overlapping zero. The 2site compares the estimate to the null model. The dispersion
parameter, ω, is given. Marginal R2 is explained variance using fixed effects only.
Conditional R2 incorporates random effects. .................................................................... 49
ix
List of Abbreviations
AICc Akaike information criterion, small sample size correctionAUC Area under curve (ROC curve)Aw Akaike weightCI Confidence intervalCOC Chemical of concernCrI Credible intervalCTWI Compound topographic wetness indexDEM Digital elevation modelDGT Diffuse gradients in thin filmsDOC Dissolved organic carbonDOM Dissolved organic matterFI Fluorescence indexFRI Forest resources inventoryGIS Geographic information systemGLM Generalized linear modelGLMM Generalized linear mixed modelHIX Humification indexICP-MS Inductively coupled plasma mass spectrometryLC50 Median lethal concentration, 50% of population deathMCMC Markov chain Monte CarloNDVI Normalized difference vegetation indexOM Organic matterPCA Principal components analysisROC Receiver operating characteristicRMSE Root-mean-square errorSD Standard deviationTDS Total dissolved solidsTKN Total Kjeldahl nitrogenTP Total phosphorusVIF Variance inflation factor

1
Chapter 1
Introduction
Landscape processes affect aquatic ecosystems at multiple spatial and temporal
scales (Soranno et al. 2009). Anthropogenic and natural stressors also act at multiple
scales and can alter the physical, chemical, and biological components of receiving
waters because lakes, rivers, streams, and wetlands are products of their basins and
valleys (Hynes 1975; Schindler 2009). The flow of materials and organisms across
habitats within the landscape can have direct and indirect effects on recipient ecosystems
(Polis et al. 1997). For example, input of terrestrial carbon to lakes may provide an
energy source to heterotrophic bacteria yet attenuate and limit light access to autotrophic
organisms (Jones et al. 2012). The export of this carbon source can be strongly associated
with wetland area in the adjacent catchment, which is a result of other physical properties
of the catchment (Creed et al. 2008; Gergel et al. 1999). Furthermore, export could be
driven by larger-scale patterns such as regional temperature patterns (Creed et al. 2008).
Recognizing and quantifying patterns at pertinent scales is crucial for understanding how
landscapes affect aquatic processes, and therefore, the occurrence and abundance of
aquatic species (Levin 1992).
In lakes, regional-scale factors such as landscape position and geology influence
lake morphometry, ionic strength, pH, buffering capacity, and dispersal pathways. These
can affect biotic community composition, but also resilience to, and recovery from,
multiple stressors (Havel et al. 2002; Keller et al. 2007; Riera et al. 2000). Similarly,
catchment-scale features including land use, vegetation density, and wetland cover affect

2
input of nutrients including, phosphorus, nitrogen, and dissolved and particulate organic
carbon, all of which are important resources for structuring lake food webs (Creed et al.
2008; Dillon and Molot 1997; Gergel et al. 1999; Cole et al. 2006; Jansson et al. 2007;
Solomon et al. 2011). In contrast to these larger-scale influences, less attention has been
paid to local-scale factors, such as the chemical and biological elements at subcatchment
confluence sites, which are the delta areas where drainage streams enter lakes. These
stream discharge areas are affected by a proportionally larger amount of landscape than
are adjacent littoral habitats at the land-water interface and may have a disproportionally
large influence on local habitat conditions and, therefore, the organisms in those habitats.
My research question is: In landscapes recovering from multiple stressors, do
subcatchment characteristics influence biological recovery by affecting local habitat
conditions and the quality of water discharged into littoral zones at smaller spatial scales?
Industrial barrens resulting from historic acid or metal deposition host many
complex and often extreme environmental gradients within the landscape. These
environments can serve as natural laboratories for testing fundamental questions related
to ecosystem resilience and recovery (Kozlov and Zvereva 2006). Over a century of
mining operations impacted local and regional ecosystems to varying degrees in Sudbury,
Canada. Many interacting factors including geology, historical logging, forest fires,
sulphur dioxide fumigation, and metal deposition resulted in one of the world’s largest
industrial barren landscapes with 17000 – 19000 ha of barren and 70000 – 80000 ha of
semi-barren zones (Gunn 1995). A 90% reduction in sulphur dioxide emissions, coupled
with large-scale land restoration efforts since the 1970s, have allowed for widespread
chemical recovery in lakes (i.e., increased pH, decreased metal concentration) (Gunn

3
1995; Keller et al. 2007). Biological recovery, however, has lagged considerably behind
chemical recovery at many trophic levels (Keller et al. 2007). As a result, acid- and
metal-tolerant taxa remain dominant in many stressed systems despite general chemical
improvements (Luek et al. 2010; Luek et al. 2013; Wesolek et al. 2010a).
Delays in biological recovery are likely the result of interacting ecological and
toxicological factors. These may include such factors as biological resistance from
established communities (Binks et al. 2005), dispersal limitation (Gray et al. 2012), time
since chemical thresholds have been met (Snucins 2003; Wesolek 2010a), residual metal
contamination (Valois et al. 2011), and lack of organic matter (OM) inputs and other
resource subsidies from terrestrial environments (Keller 2009). Some taxa recover faster
than others; for example, in crustacean zooplankton communities, copepod populations
have recovered in many lakes whereas cladoceran populations have been slow to return
(Yan et al. 2004).
Benthic invertebrates have been used extensively as sensitive indicators of
ecosystem health in a variety of environmental applications (Bonada et al. 2006). The
functional and species diversity of benthic invertebrates across environmental gradients
provide a means to investigate community- and population-level hypotheses related to
recovery barriers, particularly in Sudbury (Carbone et al. 1998; Davidson and Gunn
2012; Gunn and Keller 1990; Griffiths and Keller 1992; McNicol et al. 1995; Snucins
2003; Szkokan-Emilson et al. 2011; Wesolek et al. 2010a,b). For example, regional
surveys and intensive within lake surveys were used to track recovery of two species of
mayfly (Stenonema femoratum, S. interpunctatum) and an amphipod (Hyalella azteca)
(Snucins 2003). As colonization proceeded, occurrence and abundance patterns suggested

4
that habitat hot spots existed that may represent preferred areas or areas with relatively
high survival rates. Recent studies have suggested that at the community level,
subcatchment discharge sites may be high quality patches for benthic invertebrates
depending on delta and subcatchment characteristics, such as delta area and wetland
cover (Wesolek et al. 2010b; Szkokan-Emilson et al. 2011). Here, in the context of
regional population recovery, I investigate how these sites might influence an important
indicator of ecosystem health at the population-level across multiple scales.
Observations of Hyalella azteca (Saussure, 1858) (Figure 1) colonization in many
damaged lakes across the Sudbury region, provide a unique opportunity to investigate
factors controlling population recovery at multiple scales (Babin-Fenske et al. 2012;
Mantysaari and Vine 2004; Watson 1992). This species complex is widely distributed
throughout aquatic ecosystems in North America and is an important food source for fish
and waterfowl (Wellborn et al. 2005; Witt and Hebert 2000). Hyalella azteca is often
used in toxicological assays; therefore its chemical requirements and sensitivities are
well-documented (Borgmann 1996; Borgmann et al. 2005; Environment Canada 2013).
Phylogenetic analyses indicate that H. azteca is a cryptic species complex, with similar
physical characteristics but significant genetic divergence, across regions and even within
lakes (Dionne et al. 2011; Pitt and Hebert 2000; Wellborn et al. 2005; Wellborn and
Broughton 2008). Genetic differences may lead to differences in chemical tolerance and
survival in contaminated environments (Duan et al. 2001). Phenotypic differences have
been associated with predation conditions; larger ecomorphs have been observed in
fishless habitats due to size-specific predation (Milstead and Threlkeld 1986; Wellborn
1994). Given this range of genotypes and phenotypes, it is intriguing that a recent study

5
indicated that only a single, large-bodied phylogenetic clade is colonizing historically
damaged lakes across the region in Sudbury (Babin-Fenske et al. 2012).
FIGURE 1 - Hyalella azteca specimen collected in August 2012 from Little Raft Lake inSudbury, Ontario. Adults are typically 5–7 mm in length. This image was used withpermission from Lynne Witty, Senior Invertebrate Taxonomist.
The absence of H. azteca across lakes is an important indicator of acidification
and low alkalinity (Grapentine and Rosenberg 1992; Stephenson and Mackie 1986). In
addition to acidity, H. azteca is sensitive to metals such that its recovery in the Sudbury
area may also be confounded by elevated metal concentrations (Keller et al. 2007). It has
been noted that pH, alkalinity, and dissolved organic carbon (DOC) are increasing and
metals are declining in these lakes (CFEU 2006). These chemical changes may mitigate
the effects of the declining but still relatively high metal concentrations by acting as ion
competitors at the gill surface of amphipods or as metal-complexing anions, reducing
metal bioavailability (Doig and Liber 2006; Stephenson and Mackie 1988). Demographic

6
responses of abundance, production, and biomass of benthic invertebrates have also been
associated with gradients of water hardness, substrate particle size, and sediment organic
matter across many types of habitats (Gibbons and Mackie 1991). Terrestrial processes
occurring on the landscape surrounding the lakes influence many of these water and
sediment properties.
What factors are currently limiting the distribution of H. azteca between and
within Sudbury lakes? Are subcatchment confluence sites actually hot spots for
colonizing amphipods? Do terrestrial subcatchment characteristics reflect suitable habitat
for H. azteca in associated receiving waters? I used three spatial and temporal scales to
explore these questions: 1) a regional scale synoptic survey of 40 lakes tracking presence
and absence of amphipods as water chemistry improved during a 23 year period; 2) a
seasonal six-lake study in 2011 that assessed sampling variability of amphipods across a
range of disturbance conditions; and 3) an intensive site-specific study in 2012 in a single
lake examining the effect of local chemistry (i.e., bioavailable metals) and associated
subcatchment terrestrial characteristics in creating habitat conditions suitable for
colonizing amphipods.
7
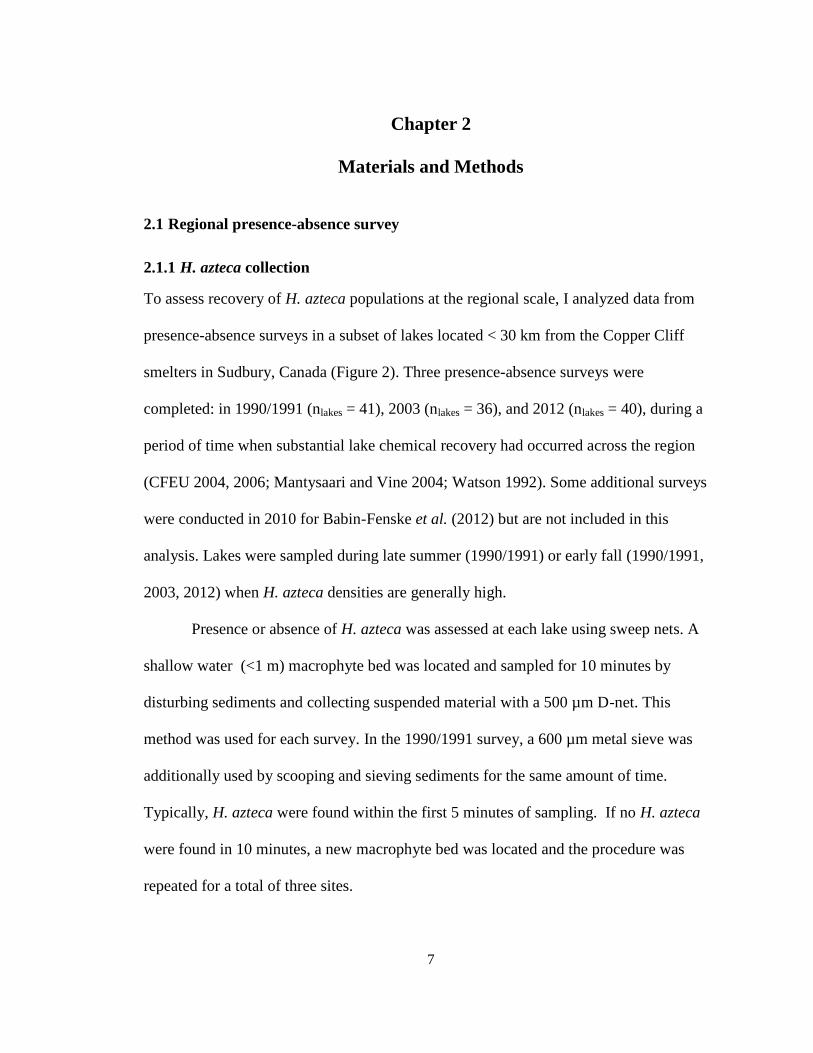
Chapter 2
Materials and Methods
2.1 Regional presence-absence survey
2.1.1 H. azteca collection
To assess recovery of H. azteca populations at the regional scale, I analyzed data from
presence-absence surveys in a subset of lakes located < 30 km from the Copper Cliff
smelters in Sudbury, Canada (Figure 2). Three presence-absence surveys were
completed: in 1990/1991 (nlakes = 41), 2003 (nlakes = 36), and 2012 (nlakes = 40), during a
period of time when substantial lake chemical recovery had occurred across the region
(CFEU 2004, 2006; Mantysaari and Vine 2004; Watson 1992). Some additional surveys
were conducted in 2010 for Babin-Fenske et al. (2012) but are not included in this
analysis. Lakes were sampled during late summer (1990/1991) or early fall (1990/1991,
2003, 2012) when H. azteca densities are generally high.
Presence or absence of H. azteca was assessed at each lake using sweep nets. A
shallow water (<1 m) macrophyte bed was located and sampled for 10 minutes by
disturbing sediments and collecting suspended material with a 500 µm D-net. This
method was used for each survey. In the 1990/1991 survey, a 600 µm metal sieve was
additionally used by scooping and sieving sediments for the same amount of time.
Typically, H. azteca were found within the first 5 minutes of sampling. If no H. azteca
were found in 10 minutes, a new macrophyte bed was located and the procedure was
repeated for a total of three sites.

8
FIGURE 2 - Colonization history of Hyalella azteca through time from surveysconducted in 1990/1991, 2003, 2010, and 2011/2012. Note the 2010 survey wasconducted on Bibby, Broder 23, Camp, Clearwater, Crooked, Daisy, Dill, Lohi, andSilver lakes for Babin-Fenske et al. (2012). Hazen, Hidden, Honda, and Swan lakes werenot sampled in 2003. No H. azteca were found in Clearwater Lake using surveyprotocols, however, there were 5 detected using alternative methods presented in thisstudy. Note the regions of barren and semi-barren areas delineated by McCall et al.(1995).
Honda
Copper CliffSmelter
ConistonSmelter
Long
Kelly
Ramsey
Raft
Chief
Brodill
McFarlane
Laurentian
Nepahwin
Dill
Richard
Tilton
Lohi
Clearwater
DaisyPerch
Bethel
Crowley
Middle
LintonPine
St. Charles
Silver
Robinson
Broder 23
Camp
Hannah
Crooked
Bibby
Forest
Minnow
Little Raft
Bennett
Grant
Hazen
Swan
Hidden
Johnny
Still
1990 / 1991 Survey2003 Survey2010 Survey2011 / 2012 SurveyUncolonized LakesSudbury Barrens
«Sudbury
Newfoundland and Labrador / Terre-Neuve-et-Labrador
Quebec / QuébecOntario
Manitoba
0 1,000500Kilometres
0 52.5Kilometres
BARREN BARRENSEMI-BARREN
SR SR

9
2.1.2 Water Chemistry
Water chemistry samples were collected using several different methods. In each lake,
water was collected away from the near-shore area at a single deep basin. For the
1990/1991 survey, composite samples were collected using a 2.5 cm diameter x 5 m long
Tygon® tube through the ice in January and February. For the 2003 survey, composite
samples were collected through the epilimnion/metalimnion using a 1.27 cm inner
diameter Tygon® tube during midsummer (CFEU 2004). For the 2012 survey, water was
collected as a whole-lake volume-weighted composite sample, filtered using an 80 μm
mesh, for Clearwater, Lohi, Middle, and Hannah lakes. For Daisy, Richard, and
Nepahwin lakes, samples were not volume-weighted and not filtered, but were collected
from the surface to the euphotic zone (2 x secchi depth) for nutrients or to the bottom of
the metalimnion for other parameters. These samples were collected in September 2012.
For the remaining lakes, surface water grab samples (0.5 m below surface) were collected
in September and October for the 2012 survey except for Crooked, Silver, Swan, and
Tilton, lakes where samples were collected in July, and McFarlane Lake, where the
sample was collected in June 2011 (Appendix A).
Water chemistry variables are listed in the statistical analysis section, 2.1.3. All
chemical analyses were performed by the Ontario Ministry of the Environment (OMOE
1983). In some cases, presence-absence or chemistry data were unavailable for lakes in a
given survey. A complete record refers to a lake having all data for all three surveys. In
the dataset, 67.5% had a complete record.

10
2.1.3 Statistical analyses
I modelled the probability of occurrence as a function of water chemistry. Chemistry
variables included pH, conductivity, alkalinity (total inflection point, as CaCO3),
dissolved organic carbon (DOC), Ca, Cl, K, Mg, Na, SO4, Al, Cu, Fe, Mn, Ni, Zn, total
phosphorus (TP), and Total Kjeldahl Nitrogen (TKN). TKN refers to a method in which
nitrogen is represented by the sum of organic nitrogen, ammonia, and ammonium.
Camp, Perch, Pine, and Swan lakes were removed because of missing chemical values in
1990/1991.
An ordination using Principal Components Analysis (PCA) was used to aggregate
many potentially correlated chemical variables into a new, smaller subset of variables,
representing linear combinations of the original chemicals. These variables (or principal
component axes) can be considered chemical gradients; scores can be derived to
represent a lake’s position along a given gradient (Quinn and Keough 2002). We used
derived component scores in binomial Generalized Linear Models (GLMs) to model the
probability of amphipod occurrence.
To account for multiple censored reporting levels (e.g., reporting levels of
< 30 µgL-1 vs. <60 µgL-1 of Al depending on analytical procedures through time), the
PCA was performed using the correlation matrix of ranked u-scores according to Helsel
(2012). A u-score is calculated by comparing each lake observation, i, to each of the
observations, k, from other lakes for a given variable
(1)
where ‘sign’ indicates that a positive difference is assigned a value of +1, a
negative difference is assigned a value of -1, and no difference is 0. The values are
ki
kii xxsignu ),(

11
summed to give the u-score. Upper limits (e.g., < 30 µgL-1) are difficult to use in
statistical tests and often values are substituted (e.g., ½ detection limit) causing bias
(Helsel 2012). This u-score method accounts for the inability to distinguish between, for
example, values of x = 3 and x < 30. When comparing xi = 3 to observations x1 < 30, x2 <
20, x3 = 3, each would receive a zero and the u-score would sum to zero. Comparing
xi = 10 to the same values, the individual comparisons would be 0, 0, and +1,
respectively, and sum to 1 (Helsel 2011). U-scores were then ranked and the PCA was
conducted using the full dataset, combining all 1990, 2003, and 2012 chemistry data, to
maintain the same interpretation of components through time, using the package ‘vegan’
(Oksanen et al. 2013) in R version 3.0.2 (R Core Team 2013).
I selected PCA axes with eigenvalues > 1 to represent the strong chemical
gradients of water chemistry (Quinn and Keough 2002). The lake scores along these axes
were used in the hierarchical partitioning framework, separated by survey year, to
identify those axes independently explaining a significant proportion of variance in
amphipod occurrence, using the Z ≥ 1.65 criterion based on permutation tests (Mac Nally
2002). Axes meeting this criterion were used in the binomial GLM for that year.
Predictive accuracy of the occurrence models was assessed comparing the fitted to
observed probabilities using the area under the receiver operating characteristic (ROC)
curve (AUC), an assessment of binary classification, where values approaching 1 indicate
a complete separation of groups (presence or absence) based on the model, and values
approaching 0.5 indicate a lack of predictive ability (Fielding and Bell 1997). This was
done using the ROCR package in R (Sing et al. 2005).

12
2.2 Six lake abundance survey
2.2.1 Study design and lakes
I selected six lakes across spatial and temporal gradients of recovery to investigate within
lake distribution of H. azteca. Here, spatial gradients of recovery refer to the degree of
historical watershed disturbance (i.e., from barren – semi-barren – less-impacted zones),
derived from aerial photographs (McCall et al. 1995). See Figure 2. Similarly, temporal
gradients refer to the magnitude and trajectory of chemical recovery (e.g., time since pH
> 6) and estimated time since H. azteca colonization. I compared H. azteca abundance
between subcatchment sites and non-subcatchment sites (hereafter referred to as ‘lake’
sites). I used Geographical Information Systems (GIS) to characterize subcatchments
using satellite-derived indices, topographic indices, and aerial photograph classification
for modelling relationships between abundance of H. azteca and landscape
characteristics.
The six lakes included an uncolonized lake (Clearwater), two lakes colonized
between 2010 and 2012 (Lohi and Daisy), two lakes colonized between 1990 and 2003
(Hannah and Middle), and one colonized before 1990/1991 (Richard). The lakes are
small (surface area range: 27–79 ha) with circumneutral pH (6.6–7.45) and varying
alkalinity (2.5–24.6 mgL-1 CaCO3) (Table 1). These lakes have been used in numerous
studies and their recovery history is well-documented. Clearwater Lake was historically
acidified and has been used for describing natural chemical and biological recovery
(Keller et al. 2007; Winter et al. 2008). Lohi, Hannah, and Middle lakes were
experimentally limed in 1973, 1974, and 1975, respectively. Lohi Lake re-acidified by
1979 even after multiple whole-lake liming additions from 1973–1975 (Yan and Dillon

13
1984; Yan et al. 1996). The watersheds of Hannah and Middle lakes were fertilized and
limed as part of a municipal land reclamation program (1983–1984) (Yan and Dillon
1984; Yan et al. 1996). Two of these lakes (Hannah and Lohi) were stocked with
smallmouth bass (Micropterus dolomieu) in 2006 and 2008, respectively, as part of a
whole-lake piscivorous fish manipulation experiment (CFEU 2008; Luek et al. 2010).
Daisy Lake has been used in studies evaluating benthic invertebrate community
responses to subcatchment land cover and carbon export gradients (Szkokan-Emilson et
al. 2011; Wesolek et al. 2010b). Richard Lake has been used in regional
paleolimnological studies (Dixit et al. 1992; Shuhaimi-Othman et al. 2006). Sediment
cores from Richard Lake have been used to track changes in metal concentrations in
sediments, the water exposed to those sediments, and H. azteca exposed to both sediment
and overlying water (Borgmann and Norwood 2002).
TABLE 1 - Limnological variables from six lake abundance surveys. Values areaveraged from monthly epilimnion/metalimnion composite samples taken from May–August 2011 (Ontario Ministry of the Environment). Richard Lake samples are from2010. Abbreviations used are: alkalinity (Alk.), conductivity (Cond.), and totalphosphorus (TP).
Lake pH DOC(mgL-1)
Alk.(mgL-1)
Cond.(µScm-1)
TP(µgL-1)
Mean/ Max.Depth
(m)
Lake Area(ha)
Clearwater 6.63 3.08 2.52 59.5 3.8 8.4 / 21.5 75.6Daisy 6.71 2.50 3.18 33.7 7.8 5.2 / 14.0 36.1Hannah 7.45 3.95 21.80 353.3 9.9 4.0 / 8.5 27.2Lohi 6.64 3.50 3.96 66.0 6.0 6.2 / 19.5 40.8Middle 7.17 4.35 17.03 277.8 7.1 6.2 / 15.0 28.0Richard(2010)
7.00 4.00 24.60 174.0 17.0 3.9 / 9.5 79.4
Median 6.85 3.73 10.50 120 6.55 5.7 / 14.5 38.50

14
2.2.2 H. azteca collection and site characterization
Shoreline mapping of dominant littoral substrates was first conducted by cruising along
the shoreline in a boat out to a depth of approximately 1 m, documenting changes at
approximately 10–15 m intervals using a handheld GPS unit (Garmin eTrex Legend C,
Garmin Ltd.). A map of major substrate type including soft/organic, cobble/boulder, and
bedrock substrates was generated using GIS (ESRI ArcGIS version 9.3, Redlands, CA).
From this map I randomly selected two sites from each previously mentioned category.
Subcatchment sites of various substrate types were identified as those at the mouth of
inflowing streams or at the mouth of seasonally dry streambeds. Hereafter, ‘subcatchment
sites’ refer to those at the delta of inflowing streams and ‘lake sites’ other sites within the
lake’s littoral zone.
In each lake, H. azteca were collected using artificial substrates at 5-6
subcatchment sites and the six random lake sites. I deployed eight modified Hester-
Dendy artificial substrates (hereafter referred to as dendies) per site at the stream
discharge point within the lake, generally following the North Temperate Lakes Long
Term Ecological Research protocol (NTL-LTER 2005). Each dendy was constructed of a
plastic scouring pad surrounded by alternating fine mesh (3 mm, 3 pieces) and coarse
mesh (5 mm, 2 pieces) plastic screen material cut to 7.6 cm squares, and 7.6 cm x 7.6 cm
x 0.3 cm tempered hardboard on each side. Dendies were held together by a 12.7 cm x
0.64 cm diameter galvanized steel bolt, and anchored with a chain (Figure 3). For lake
sites, dendies were deployed in a line at 0.75 m depth at 1 m intervals. For subcatchment
sites, dendies were deployed at 0.75 m depth unless a shallow delta extended well into
the lake. In this case, dendies were placed along the depth contour 5 m from the outlet.

15
The samplers were deployed in August 2011 for approximately 25 days, allowing
suitable time for algal growth and invertebrate colonization. Dendies were carefully
retrieved by snorkeling or from a boat by placing the sampler into 1L plastic buckets
underwater. In the lab, all contents > 500 µm were retained using a sieve. These contents
were scooped and rinsed into sample jars and preserved in 70% ethanol. A Leica MZ16
dissecting microscope (Leica Microsystems, Wetzlar, Germany) was used to count the
H. azteca from each dendy.
FIGURE 3 – Photographs of modified Hester-Dendy artificial substrates. Photographswere taken A) prior to deployment, B) underwater immediately after deployment, and C)following three weeks of deployment. Note that photographs are not of the same sampler.

16
To estimate macrophyte and woody debris cover at sites, point transects were
conducted at 2 m intervals along a 10 m length of rope that followed the depth contours
at 0.5, 1, 1.5, and 2 times the depth at which dendies were placed. This was done before
deploying dendies. I expressed cover as a proportion, calculated as the number of sites of
the 24 visited points that had submergent or emergent macrophytes or woody debris
within a 20 cm radius of the point. Woody debris was defined as a piece of wood greater
than 10 cm long, including logs and fallen trees. These features received the same score
regardless of size.
Subcatchment delineation:
Digital elevation models (DEM) were generated around each lake using 10 m
contours and elevation points. The 10 m contours were from Ontario Basic Mapping
(http://www.geographynetwork.ca/website/obm/viewer.htm). The elevation points were
remotely-sensed with 5 m grid spacing. These were provided as a digital surface model
product generated using a Leica ADS40 Airborne Digital Sensor flown in spring 2007
(Leica Geosystems). This was part of the Ontario Ministry of Natural Resources Forest
Resources Inventory (FRI) Project aerial photograph campaign. Only those points
classified as ‘bare earth’ were used. A 10 m cell size DEM was interpolated with the
‘Topo to Raster’ function in ArcMap using these point and line features. Due to potential
misclassification from the ADS40 points (e.g., classifies as bare earth when really is a
taller tree), higher weighting was given to contour lines. A strong correlation (t122 =
88.87, r = 0.99) was found comparing DEM values with OBM spot heights not used in
generating the DEM (accuracy of spot heights = ±5 m). Using these spot heights as

17
reference, the vertical accuracy for each lake DEM was calculated as 1.96·RMSE and the
mean accuracy was (2.9 ± 0.3) m.
Subcatchments were delineated using hydrological algorithms in the software
Whitebox Geospatial Analysis Tools version 2.0.3 (Lindsay 2012) followed by field-
based validation when delineations were uncertain due to land use uncertainty. To ensure
continuous flow, spurious depressions from the interpolation process were filled first and
a D8 flow routing algorithm was applied to model all cells draining to a given
subcatchment outlet point (O’Callaghan and Mark 1984). Finer-scale delineations of
Daisy Lake subcatchments were used for consistency with previous studies, although
boundaries generally overlapped with the method outlined here (Szkokan-Emilson et al.
2011). These were clipped to the DEM cell size for consistency with the other
subcatchments used in this study. After ground-truthing, it was necessary to manually
adjust some boundaries due to land use change (e.g., new roads, culverts, housing
development). Subsequent analyses were conducted on raster files that were clipped to
the subcatchment boundary from the depression-filled DEM.
Subcatchment characterization:
To describe subcatchment characteristics we used a combination of digital terrain
analyses, aerial photograph classification, and satellite indices. Although hydrological
basins are complex units, the goal was to apply simple landscape characterizations that
could capture variation in drainage and landscape composition for associating these
characteristics with H. azteca abundance. See Figure 4 for a graphical representation of
the methods outlined below.

18
FIGURE 4 – Depiction of subcatchment characteristics. CTWI is CompoundTopographic Wetness Index where lighter values indicate more potential soil watersaturation. For impermeable/bare soils, dark pixels are impermeable/bare soils and lightpixels are vegetation. TCT WI is Tasseled Cap Transformation Wetness Index wherelighter values indicate less vegetation/soil water content. NDVI is Normalized DifferenceVegetation Index where lighter values indicate higher vegetation density.
To describe potential distribution of water on the landscape, the widely-used
Compound Topographic Wetness Index (CTWI) was calculated (Beven and Kirkby
1979). The CTWI, with a pixel size of 10 m, was calculated and divided into categories
representing areas of low, medium, and high areas of potential water accumulation. This

19
has been correlated with soil attributes such as organic matter content, soil phosphorus
concentration, and horizon depth (Moore et al. 1993). I used the index to estimate the
proportion of land occupied by potentially saturated and unsaturated soils. The CTWI,
proportional to upslope area and inversely proportional to slope, is calculated as
(2)
where As is the pixel-specific upslope contributing area (i.e., number of cells flowing into
a given cell) and β is the local slope in radians (Beven and Kirkby 1979). High and low
values indicate areas of high and low of potential water accumulation, respectively.
Upslope contributing area was calculated using the D∞ flow routing and accumulation
algorithms in Whitebox (Tarboton 1997). These algorithms are a useful intermediate
between single flow-routing (i.e., all flow exits a cell in one direction) which may
underestimate flow divergence on hill slopes, and multiple flow direction algorithms (i.e.,
flow is routed to all down slope neighbours) which may overestimate flow divergence at
lower elevations (Erskine et al. 2006). Then, using all subcatchments and their CTWI
values collectively, the ESRI ArcMap implementation of the Fisher-Jenk’s optimization
algorithm was applied to group CTWI values into the three categories that minimize
within-group variance and maximize between-group variance (Jenks 1967). Low,
medium, and high values ranged from 0.83–6.67, 6.67–10.76, and 10.76–20.93,
respectively. I define these as ‘Low CTWI’, ‘Medium CTWI’, and ‘High CTWI’
categories.
To describe finer-scale landscape features (e.g., impermeable/bare soils and
vegetation), multi-spectral aerial photographs were categorized. The pixel size of the
aerial photographs was 0.4 m. Subcatchment boundaries were used to extract four multi-
tan
AlnCTWI s

20
spectral image bands from each of multiple FRI aerial photographs. Subtle spectral
properties may change within and between images so an unsupervised clustering
algorithm (ISODATA – Iteratively Self-Organizing Data Analysis Technique) was
implemented in ArcGIS to assign pixels to 12 groupings. These were visually evaluated
and combined into the impermeable/bare soils and vegetation categories. When an area
was obscured by tree shadows, the surrounding features were used to estimate what could
not be seen using the ‘Fill No Data’ interpolation routine in Quantum GIS (QGIS
Development Team 2012). Spurious classification of pixels is likely present but
contributes little to our coarse classification of land cover. When I assessed the accuracy
of this technique using 600 randomly selected points, based on visual inspection, I found
84% agreement (11% misclassified as vegetated when it was observed to be
impermeable/bare soils, 5% misclassified as impermeable/bare soils when it was
observed to be vegetated). Therefore, impermeable/bare soils may be underestimated. It
should be noted that although these images are of high resolution, the classifications are
meant to provide coarse representations of land cover. The primary goal was to estimate
impermeable surfaces since Davidson and Gunn (2012) and Bruns (2005) found negative
associations with benthic invertebrate metrics and increasing impermeable surfaces at
multiple scales in mining impacted landscapes.
I also characterized subcatchments using two satellite-derived indices in a similar
fashion: the Normalized Difference Vegetation Index (NDVI) and the Tasseled Cap
Transformation Wetness Index (TCT WI). These indices were derived from Landsat 5
TM images with a 30 m pixel size. The NDVI is a widely used index that is correlated
with vegetation density and plant biomass and ranges from -1 (little to no green

21
vegetation) to +1 (high vegetation density) (Pettorelli et al. 2005; Treitz and Howarth
1999). It operates on the principle that plant chlorophyll absorbs photosynthetically-
active radiation and reflects near-infrared radiation (Jackson and Huete 1991; Tucker
1979). The TCT WI is similar to a Principal Components Analysis in that it takes many
of the correlated Landsat 5 image bands and generates orthogonal axes of the bands to
represent interpretable indices (Crist and Cicone 1984; Huang et al. 2002). In this study, I
used the TCT WI as an index of soil/surface/plant volumetric water content (Crist and
Cicone 1984). The NDVI and TCT WI were calculated for 11 cloud-free Landsat 5 TM
images of the Sudbury region from March 27 – October 5, 2011 (USGS 2013). Landsat 5
TM digital numbers (DN) were first converted to Landsat 7 DN and then converted to
‘top-of-atmosphere’ reflectance values (Vogelmann et al. 2001; NASA 2011). NDVI and
TCT WI were calculated as
(3)
(4)
where ‘Band’ refers to reflectance values for their respective Landsat TM bands. For
NDVI, values approaching 1 and -1 indicate areas of high vegetation density and low
vegetation density, respectively. For TCT WI, higher values indicate higher water
content. The indices were calculated for each of the 11 images. For NDVI, maximum
value compositing was used to combine images: only the maximum value for a pixel is
Band34Band
3Band4BandNDVI
Band7) x(-0.5388Band5) x(-0.7629Band4) x(0.0656
Band3) x(0.926Band2) x(0.2141Band1) x(0.2626 WITCT

22
retained across all images to minimize potential image-specific atmospheric effects (e.g.,
cloud cover) and obtain an estimate of the highest productivity/density during the time
period (Pettorelli et al. 2005). For TCT WI, the mean value was taken to represent
average seasonal moisture conditions. All pixels within a subcatchment boundary were
then averaged for NDVI and TCT WI for use in H. azteca abundance models.
2.2.3 Statistical analyses
I used Generalized Linear Mixed Models (GLMMs) to investigate differences in
H. azteca abundance between subcatchment confluence sites and lake sites. GLMMs
were also used to model abundance between confluence sites based on subcatchment
characteristics.
The analyses were conducted in a Bayesian statistical framework using Markov
Chain Monte Carlo (MCMC) simulations with the package ‘MCMCglmm’ in R (Hadfield
2010). GLMMs provide a useful modeling framework for the current study as they
account for hierarchical structure of sampling designs (dendies within sites within lakes);
allow for non-normal error distributions (counts of H. azteca per dendy); and quantify
random variation between different levels of the hierarchy after accounting for covariates
of interest (random variation due to differences between lakes, between sites, and
between dendies) (Bolker et al. 2008; Zuur et al. 2009; Zuur et al. 2012; Zuur et al.
2013). Clearwater Lake was excluded from the analysis as few amphipods were found (5
at only two sites), potentially biasing statistical models.
I assumed that, conditional on their respective means (µ ijk), the number of
amphipods (nijk) counted on dendy i of site j in lake k followed a Poisson distribution.

23
The mean counts (µ ijk) were modelled depending on covariates, the lake, and the sites
within the lake. The general conditional GLMM Poisson model is expressed as
222
1
ijk
,0~,,0~,,0~
...ln
~abundance
NNNa
xx
Poisson
ijksiteklakej
ijkkjijknijkijk
ijk
(5)
where α represents a global intercept, and β1 … βn are regression parameters to be
estimated as fixed effects. The random effects αj and αk allow shifts in the intercept for
each lake and site, respectively (Zuur et al. 2009). The latent variable εijk captures
variation that cannot be attributed to covariates, Poisson errors, or random variation
around lake and site means (Elston et al. 2001). The estimates for 2σlake ,2σ site , and 2σdendy
allow for partitioning of aggregation, where large estimates imply large variation between
lakes, sites, and dendies, respectively. Because covariates are measured at the site-scale,
lower σ2site estimates are expected after accounting for the fixed effects.
I first investigated the differences between subcatchment confluence sites and
lake sites. Preliminary plotting suggested that strength of the difference may vary from
lake to lake. Abundance was modelled as
2222
1
ijk
,0~,,0~,,0~,,0~
...ln
~abundance
NNNbNa
ntSubcatchmebntSubcatchmex
Poisson
ijksiteklakeklakej
ijkkijkjjijknijkijk
ijk
(6)
where Subcatchmentijk is an indicator variable (1,0) and bk is an estimated deviation from
the average subcatchment effect for a given lake. For this analysis, there were

24
approximately eight dendies nested within 10–13 sites per lake (total of 28 subcatchment
and 30 lake sites) for a total sample size of 449 dendies.
I then investigated potential differences in abundance based on subcatchment
characteristics. Variance Inflation Factors (VIFs) were used to reduce collinearity of
predictor variables by sequentially eliminating variables with VIFs >3 following the
protocol of Zuur et al. (2010). Given that we eliminated collinear variables, the analysis
becomes more exploratory in nature and mechanisms may be similarly explained by
excluded variables (Zuur et al. 2012). I constructed three different models: (1) including
the estimates of impermeable/bare soils and high CTWI (uplands) (T-I); (2) including the
estimates of impermeable/bare soils and low CTWI (wetlands) (T-II); and (3) including
satellite indices (S). All models included within-lake site-specific effects of macrophytes
and woody debris, and also subcatchment area. I differentiated satellite indices and
topographic wetness/aerial photography since CTWI and aerial photograph interpretation
describe more ‘static’ features on the landscape and satellite-derived metrics may provide
models that reflect current yearly conditions (e.g., CTWI may suggest potential wetlands
but TCT WI may indicate dry conditions in a given year). Separating topography models
(T-I and T-II) was necessary for reducing initial model complexity. For each model
analysis, there were approximately eight dendies nested within 5–6 sites per lake (total of
28 subcatchment sites) for a total sample size of 220 dendies.
I used the following model selection strategy for all models. I began with a full model
that included all terms, their 1st order interactions and random effects. Regression
parameters with 95% Credible Intervals (CI) overlapping zero were removed
sequentially. In the case of multiple CIs overlapping zero, the term with the largest

25
pMCMC (similar to frequentist p-value) from the MCMCglmm output was removed.
Three independent models (chains) were fit per selection round for diagnostic tests. I
assessed mixing and convergence of chains using trace-plots and Geweke diagnostics and
used the Gelman-Rubin statistic to assess across chain convergence agreement in the
package ‘coda’ version 0.16-1 in R (Plummer et al. 2006). Chains were run for at least
1,400,000 iterations with a thinning rate of 500 and burn-in period of 100,000 to reduce
within-chain correlations and have 2,500 posterior samples from chain 1. Uninformative
priors were used. The assumption of a normal distribution of the random effects was
assessed using normal quantile-quantile plots. The assumption of a Poisson distribution
was assessed using the simulation procedure outlined in Elston et al. (2001). All
covariates were first standardized to mean 0 and unit variance to improve MCMC chain
mixing and comparison of effect sizes. GLMM R2 is presented as a marginal R2 (the
variance explained by fixed effects only) and as a conditional R2 (the variance explained
by the entire model including random effects) following Nakagawa and Schielzeth
(2013). The formulae are
)1)exp(1ln((R
02222
22
lakesitedendyf
fm
(7)
)1)exp(1ln((R
02222
2222
lakesitedendyf
lakesitefm
(8)

26
2.3 Single lake abundance survey
2.3.1 Daisy Lake
I collected H. azteca at multiple sites within Daisy Lake to better resolve how abundance
patterns relate to landscape characteristics, and how high-resolution chemistry can further
improve these models. Daisy Lake is located approximately 3 km southwest of the
historically operated Coniston smelter in Sudbury (Figure 2). The watershed floral
composition began to shift in the 1940s from primarily spruce and pine to the early-
colonizing birch, based on paleolimnological analysis (Dixit et al. 1996). Lake chemistry
shifted during the same period, with drastic increases in sedimentation rate, metal
concentrations, and decreases in pH, making the lake acidic (<5.5) from approximately
1965 onwards (Dixit et al. 1996). The lake was acidic until approximately 1996 (Ontario
Ministry of the Environment data, not shown). Lake chemistry has improved over the
past two decades, correlating strongly with watershed vegetation density recovery
(Sauder 2012). Daisy Lake was recently colonized by H. azteca in 2010 (Babin-Fenske et
al. 2010). Because an earlier study revealed that OM content in subcatchment
streamwater (Szkokan-Emilson 2011) could explain observed differences in
macroinvertebrate community along gradients of watershed characteristics (e.g., wetland
and forest cover), this lake may provide an important testing ground for developing
landscape recovery models using a sensitive indicator.
2.3.2 H. azteca collection and site characterization
Eight subcatchment confluence sites in Daisy Lake were chosen varying in their
landscape characteristics (i.e., forest cover, wetland cover) based on past studies
(Szkokan-Emilson et al. 2011; Wesolek et al. 2010b). For lake sites, three points were

27
randomly generated within a 15 m buffer from the shoreline using ArcMap (Figure 5).
Six dendies were placed at each site following the methods described in Section 2.2.2.
Forest cover generally increases from east to west (K – D), and the Coniston smelter is
located 3.5 km northeast of the J subcatchment. I classified sites as having low (<50%)
and high (>50%) macrophyte cover based on visual inspection. I used identical values for
subcatchment characteristics as those derived for the six-lake study.
FIGURE 5 - Daisy Lake subcatchment and lake sites. The star denotes a subcatchmentthat was historically limed.
2.3.3 Water chemistry
Water chemistry was sampled at sites using two methods, described in detail within the
next two subsections. First, I collected water at a depth of 0.5 m below the surface on two

28
occasions at each site and at the mid-lake/deep basin for total metal and major ion
concentrations (hereafter referred to as grab samples). Second, I deployed time-integrated
in situ metal samplers for two weeks. The in situ samplers, Diffuse Gradients in Thin
Films (DGTs®, DGT Research Ltd., Lancaster, United Kingdom) use a Chelex®
resin/hydrogel layer that binds the labile and free metal ions that diffuse through a
hydrogel and filter layers (Davison and Zhang 1994; DGT Research Ltd. 2005). Labile
metals may represent the bioavailable forms available for H. azteca to uptake from the
water column.
Grab sample collection and processing:
Water was collected twice, approximately two weeks apart, during the weeks of
August 6th and August 20th, 2012. We collected water in acid-cleaned 300mL brown
Nalgene® bottles at each site and from the mid-lake/deep basin. To account for potential
bottle contamination, a field blank consisting of ultrapure Type 1 Milli-Q® water was
filled from a dedicated jug using the same above procedure (18.2 MΩ·cm at 25ºC, total
organic carbon < 10 ppb) (EMD Millipore Corp., Billerica, MA). All samples were stored
in a cooler when in the field and a refrigerator when in the lab until filtering and analysis.
In the laboratory, grab samples were measured for pH, total dissolved solids
(TDS), total metal concentration, and dissolved organic matter (DOM) composition.
Samples were first allowed to equilibrate to room temperature. A portion of the sample
was measured for pH using an accumet® model 15 pH meter (Thermo Fisher Scientific
Inc., Waltham, MA) and for TDS using a Primo 3® TDS Tester (1 mgL-1 resolution,
Hanna Instruments, Woonsocket, RI). The remaining water was filtered through a 0.2 µm

29
Millipore Isopore® membrane filter (EMD Millipore Corp., Billerica, MA). A 20 mL
portion of filtrate was transferred to a new glass scintillation vial and sealed, ensuring no
air headspace, for dissolved DOM fluorescence scans mentioned below. A 50 mL portion
of filtrate was transferred to a sterile polypropylene Corning® centrifuge tube (Corning
Inc., Corning, NY) and acidified with trace metal grade concentrated (70%) HNO3
(Sigma-Aldrich Co., St. Louis, MO) for total metal concentration analysis. The
procedure was repeated for each water sample within one day of the sample being
collected. All labware was thoroughly rinsed with ultrapure Milli-Q® water between
samples. Because samples were filtered on different days, a quality control filter blank
consisting of only Milli-Q® water was run at the beginning and end of each sample run
following the above procedure.
Absorbance and fluorescence spectroscopy were used to estimate the amount of
DOC and properties of DOM. Absorbance and fluorescence properties can be related to
molecular compositional changes; indices are in active development to describe the
complex nature of DOM (Fellman et al. 2010). For some of these calculations, a measure
of DOC is necessary. Therefore, we used data from Beauclerc and Gunn (2001) from 58
lakes to estimate the relationship between the specific absorbance coefficient at 320 nm
(Ka320 in m-1) and DOC (mgL-1). The model was a good fit to the original data, explaining
86% of the variation in measured DOC (F2,55 = 171.9, p < 0.001). The resulting estimate
of DOC was then calculated for each grab sample, i, using the following
m01.0
303.2AbsAbsK blank320,320,
a320,
i
i(9)

30
757192.0K563127.0K01449.0DOC a320,2
a320, iii (10)
where Absblank is the mean absorbance of all filter and field blanks. These estimates were
used as predictors of H. azteca abundance and also in calculating DOM compositional
indices outlined below.
To estimate DOM properties, three-dimensional fluorescence scans were used to
generate the following three DOM compositional indices of interest (Fellman et al.
2010). The humification index (HIX) relies on the assumption that DOM fluoresces at
longer wavelengths as H:C ratios decrease with humification (Ohno 2002; Zsolnay et al.
1999). The fluorescence index (FI) estimates the source of DOM, bacterial/algal
compared to terrestrially-derived (Cory and McKnight 2005; McKnight et al. 2001). The
β:α index estimates DOM decomposition, where high values indicate more recently
derived OM (Parlanti et al. 2000; Wilson and Xenopoulos 2009).
To calculate the previously mentioned indices, index-specific values are taken
from an excitation-emission matrix constructed while scanning a water sample. To
construct this matrix, samples were sequentially excited using wavelengths ranging from
220–450 nm by 5 nm steps and light intensity was recorded at wavelengths ranging from
300–600 nm at 2 nm steps. Scans were run at room temperature using an Agilent Cary
Eclipse fluorescence spectrophotometer (Agilent Technologies, Santa Clara, CA).
Samples were corrected for inner-filter effects using correction curves provided by
Agilent. Absorbance scans were done with an Agilent Cary 60 UV-Vis
spectrophotometer (Agilent Technologies, Santa Clara, CA).

31
Diffuse Gradients in Thin Films (DGT) collection and processing:
DGT samplers were deployed in situ at each site and at the mid-lake point for the
two week duration between water collection periods. Dendies were set out one week prior
to DGT deployment to minimize site disturbance with the DGTs in place. At this time,
when dendies were installed, a temperature logger was fixed to a submerged rock placed
in the middle of the dendies. At DGT deployment, the sampler was attached to the rock
using a fishing line and hair clip. At dendy retrieval, DGTs were carefully collected,
minimizing DGT and dendy disturbance. DGTs were rinsed in the field with Milli-Q®
water and placed into individual sterile Whirl-Pak® bags.
In the laboratory, DGTs were dismantled and analysed for total metal
concentration. Metals were eluted using the following procedure outlined in Garmo et al.
(2003). The Chelex® gel layer was placed into acid-rinsed 15 mL polypropylene
Corning® centrifuge tubes and 1 mL of 70% HNO3. At this time, 9 mL of Milli-Q® was
added to the tube, the tube was shaken for approximately 10 s, and the solution was
poured into a new centrifuge tube leaving the Chelex® resin in the first tube. This
procedure prevents back-absorption of metals to the Chelex® gel. The final solution was
analyzed for metals. As a means of quality control, I also analyzed 2 fresh DGTs,
unexposed to lake water, using the above procedure.
Grab samples and DGT samples were analyzed by the Elliot Lake Research Field
Station of Laurentian University (ISO 17025) using a Varian 810 ICP-MS (Agilent

32
Technologies, Santa Clara, CA). Within lab quality control samples consisted of a blank,
a duplicate, and certified reference materials for every group of 20 samples submitted.
Calculation of DGT-measured labile metal concentration:
The lab concentrations were blank-corrected by subtracting the average
concentration of the two fresh DGTs for each metal, and multiplied by a factor of 10 to
account for the dilution of the 1 mL HNO3/ metal solution. The mass accumulated over
the two week period, Mmetal, was calculated as
fe
VVCeM gelHNO
metal3
(11)
where Ce is the concentration of metal (µgL-1) in the concentrated nitric acid solution,
VHNO3 is the volume of nitric acid added to the gel, Vgel is the volume of the gel, and fe is
the elution factor, representing the elution/metal recovery efficiency using 70% HNO3,
for a given metal. The value for VHNO3 + Vgel in this case was 1.16 · 10-3 L (DGT
Research Ltd. 2005). Elution factors for each metal were taken from Garmo et al. (2003)
as the study demonstrated high elution efficiency with concentrated nitric acid (Table
B.1). Time-averaged concentration for a metal, CDGT (ugL-1), was calculated using the
following series of equations
T109
25T000836.025T37023.1ln
2
T
0
(12)

33
0
00TT
T
D
T
D
(13)
A timeD
gMC
T
metalDGT
(14)
where equation (12) is a temperature correction for water viscosity, equation (13) is the
Stokes-Einstein equation used to apply a temperature correction for the diffusion
coefficient of the metal, and equation (14) is the time-averaged metal concentration
(Garmo et al. 2003). The diffusion coefficients, DT, are dependent on temperature (T) and
viscosity (η); the values of D0 and η0 represent the diffusion coefficients and viscosity at
25ºC (T0). Equations (12) and (13) are combined to calculate diffusion coefficient (DT)
(cm2 second-1) for a given metal at the temperature averaged over the sampling period.
For consistency, diffusion coefficients were taken at 25ºC from DGT Research Ltd.
(2005), or Garmo et al. (2003) when not available from this source (Table B.1). The
time-averaged concentration is then calculated using equation (14), where Δg is the
thickness of the hydrogel and filter (0.094 cm), time is the deployment time expressed in
seconds, and A is the exposure area (3.14 cm2). This value represents the average labile
metal concentration in the lake water over the two week deployment period.
2.3.4 Statistical analysis
I first tested whether littoral sites were different in chemistry than a mid-lake sample
taken in the deep basin. I used a non-parametric one-sample Wilcoxon signed rank test,
adjusting for Type I error rate using the Bonferroni correction (p<0.004) (Quinn and
Keough 2002). Metal variables were reduced to those identified as chemicals of concern

34
(COCs) in the Sudbury Area Risk Assessment (SARA Group 2009). The COCs were As,
Cd, Co, Cu, Pb, Ni, and Se. These metals are also toxic to H. azteca, with
Cd>Pb>Co>Cu>Ni>As, as LC50 (ugL-1), in a standardized soft-water medium
(Borgmann et al. 2005). DGT samplers did not accumulate As or Se above the detection
limit (DL) in Daisy Lake and so these variables were excluded. For Co, 4 of 11 sites were
<DL, therefore the ranked u-score metric was constructed as outlined in Section 2.1.2.
The final dataset consisted of Al, Cd, Co, Cu, Mn, Ni, Pb, Ca, Na, HIX, FI, β:α, and the
estimate of DOC. See Table C.1 for summary statistics.
For water chemistry samples, preliminary screening suggested that sample bottles
were a source of metal contamination that could not be corrected for by using field
blanks, therefore, only DGT-measured labile concentrations were used in models.
Fluorescence samples were measured improperly from the first sampling occasion due to
a program error. Although samples were re-measured, too little volume was available for
methodological consistency (i.e., pre-rinsing vials), and prolonged air exposure (i.e.,
headspace while in storage) could alter the measurement. I used the sample from the
second week only. Major ion concentrations (> 1 mgL-1), however, were generally
consistent across the two sampling occasions and with Ontario Ministry of the
Environment mid-lake samples taken at approximately the same time period (Section
1.1.2). These concentrations were averaged.
GLMMs were used to explore associations between H. azteca abundance,
landscape characteristics, site chemistry, and the two macrophyte categories (low, high)
at lake sites and subcatchment sites. Preliminary plotting of data revealed that the
abundance data were overdispersed (variance > mean). Therefore, I assumed the mean

35
abundance per dendy followed a ‘linear parameterized’ negative binomial distribution
(alternatively, NB1 or quasi-likelihood Poisson), where overdispersion is modelled by a
multiplicative parameter, ω, accounting for the mean-variance relationship (Hilbe 2011).
Abundance was expected to depend on covariates and the sites within the lake. The
general formulae for the models are:
),(NB1~Abundance ijij
siteijnijij X...X)ln( 1 (15)
,0N~ 2sitesite
where α represents a global intercept of abundance, β1 … βn are fixed effects parameters
to be estimated, and the random effect αsite allow shifts in the intercept for each site.
The Information Theoretic (IT) approach was used to develop sets of a priori
candidate models associating H. azteca abundance with predictor variables (Burnham and
Anderson 2012; Zuur et al. 2013). I limited the number of predictor variables to four plus
the intercept, but most contained < 3 parameters. Using all sites, I first developed models
assessing the influence of macrophyte cover. Then I evaluated if adding one chemical
predictor, high-resolution DGT metal concentrations or OM, improved predictions of
H. azteca abundance. Using subcatchment sites only, I developed a priori landscape
models of interest. Predictor variables were added to the top landscape models
sequentially to assess whether macrophyte cover or chemistry improved these models.
All models and summaries can be found in Appendix D.
The evidence for best candidate models was assessed using Akaike’s Information
Criterion corrected for small sample size (AICc) and Akaike weights (Aw) (Burnham and

36
Anderson 2002; Zuur et al. 2012; Zuur et al. 2013). The model with the lowest AICc is
considered the best and most parsimonious fit to the data. For models with similar AICc,
large Aw indicate the weight of evidence in favor of a given model, where all Aw sum to 1
(Burnham and Anderson 2002). All models were fit using the ‘glmmADMB’ package
version 0.7.7 in R (Fournier et al. 2012; Skaug et al. 2013). Model fit was assessed by
examining residual and quantile plots. Similar to Section 1.2.4, an analogue for the
coefficient of determination, R2, was calculated on the natural logarithmic (latent) scale.
A marginal R2 (i.e., variance explained by fixed effects only) and conditional R2 (i.e.,
variance explained by fixed and random effects) were calculated (Nakagawa and
Schielzeth 2010, 2013). These were calculated as
)1)exp(1ln((R
022
22
sitef
fm (16)
)1)exp(1ln(R
022
222
sitef
sitefc (17)
where 2f is the variance of the fitted values from the model using only the fixed effects,
2site is the random effect variances with mean of 0, is the dispersion parameter, and 0
is the latent-scale estimate of the intercept.

37
Chapter 3
Results
3.1 Regional presence-absence survey
The number of lakes colonized by H. azteca increased through time and the probability of
successful establishment appears to be positively related to both lake water
conductivity/alkalinity and negatively related to metal concentration. However, the
importance of conductivity/alkalinity increased over time and the importance of total
metal concentration decreased. There were 39%, 55%, and 63% of lakes colonized out of
those surveyed in 1990/1991, 2003, and 2012, respectively (Figure 6).
The PCA ordination produced three axes that were used in hierarchical
partitioning and binomial GLMs. The axes PC1, PC2, and PC3 cumulatively explained
78.9% of the variance in the chemistry dataset and each explained 43.4%, 21.5%, and
14.0%, respectively. PC1 generally represented a gradient of conductivity/alkalinity;
PC2, a gradient of metals; and PC3, a gradient of nutrients (Figure 7, Table 2).
The importance of conductivity/alkalinity in predicting H. azteca presence
increased through time, independently explaining from 55%, to 70%, to 93% of the
variation in H. azteca occurrence (Table 2). The importance of total metal loading
decreased through time from 39%, to 22%, to 6%. In all years, the PC3 nutrient gradient
contributed little to explaining presence of H. azteca (Z < 1.65) using hierarchical
partitioning and was not included in GLM models. All models had high predictive ability
(AUC > 0.95).

38
FIGURE 6 - The number of lakes colonized (shaded) by H. azteca has increased overtime
FIGURE 7 - Biplots of the first two axes of the PCA for chemistry separated by surveyyear. PC1 and PC2 generally represent a conductivity/alkalinity gradient and metalgradient, respectively. Points that are closer together in space are more similar inchemical condition

39
TABLE 2- Model results from hierarchical partitioning and binomial GLMs. Models were fit for each survey. Model coefficients and95% confidence intervals (CI) are expressed using ln(odds ratio). AUC represents the area under the ROC curve where valuesapproaching 1 indicated a near perfect separation among groups (presence-absence).
Model Hierarchical partitioning(binomial GLM)
Model coefficients(binomial GLM)
Hypothesis test( Ho: β = 0)
Model Tests
Independentcontribution
( %)
PermutationZ-score
βln(odds ratio) [95% CI]
z-score p-value χ2, df(full vs.
null)
p AUC
1990Intercept -- -- 0.37 [-0.86, 1.63] 0.59 0.56 29.05, 2 <0.001 0.95
PC1 55.0 9.63 -7.16 [-13.06, -1.27] -2.38 0.02PC2 39.2 7.58 8.93 [1.27, 16.60] 2.26 0.02PC3 5.8 0.49 -- -- --2003
Intercept -- -- 1.51 [-0.76, 3.78] 1.31 0.19 33.11, 2 <0.001 0.99PC1 70.3 17.96 -12.73 [-22.74, -2.72] -2.49 0.01PC2 22.9 5.39 13.36 [-0.26, 26.99] 1.92 0.06PC3 6.8 1.07 -- -- --2012
Intercept -- -- 3.55 [1.03, 1.18 x 10³] 1.98 0.05 28.45, 1 <0.001 0.97PC1 93.2 18.28 -12.91 [1.75 x 10⁻¹¹
, 0.35] -2.13 0.03PC2 6.1 0.45 -- -- --PC3 0.60 -0.58 -- -- --

40
3.2 Six-lake abundance survey
Abundance and occurrence increased with estimated time since colonization (Figure 8,
Table 3). Through this study I report the first H. azteca ever detected in Clearwater Lake.
Subcatchment sites appear to be hot spots for H. azteca abundance in general, although
the magnitude of the difference between lake sites and subcatchment sites varies across
lakes (Subcatchment variance component: 0.77) (Figure 8, Table 4). The average number
of amphipods per dendy was approximately 2.7 times higher at subcatchment sites than at
lake sites (95% Credible Interval (CrI) for subcatchment on linear predictor scale: [-0.06,
2.06]). However, only 13% of the variation in sites can be attributed to subcatchments
alone (Table 4, subcatchment model, % VC change σsite) indicating that there is still a
substantial amount of random variation remaining between sites.
TABLE 3 - Site and dendy information for all lakes. Mean and standard deviation (SD)calculated from pooling all dendies in each lake.
Lake Subcatchmentsites
Lakesites
Dendies Mean (SD) % occurrence
Clearwater 7 6 102 0.05 (0.40) 2Daisy 6 6 96 0.3 (0.7) 16Lohi 6 6 88 2 (6) 27Hannah 5 6 85 7 (11) 76Middle 5 6 85 16 (20) 80Richard 6 6 95 40 (28) 96

41
FIGURE 8 - Boxplots of site means separated by lake and into subcatchment and lake site categories (left). Expected abundance and95% confidence intervals at lake and subcatchment sites from GLMM model separated by lakes (right). In both figures, note thenatural logarithm scale. Lakes are Clearwater (C), Daisy (D), Lohi (L), Hannah (H), Middle (M), and Richard (R). The vertical linesseparate lakes into lakes colonized between 2003–2012, colonized between 1990–2003, and colonized before 1990.

42
TABLE 4 - Model results from the GLMMs comparing abundances between subcatchment and lake sites, and betweensubcatchments. Model coefficients and 95% credible intervals (CrI) are shown on the scale of the linear predictor (natural logarithm).Variables with 95% CrI not overlapping zero are bolded. The null intercept-only model with random effects is presented forcomparison. Abbreviations used are: subcatchment (Sub), macrophytes (Mac), woody debris (Wood), subcatchment area (Area),impermeable/bare soils (Imp), and high CTWI (H CTWI). The % variance component (VC) reduction compares to the varianceestimate from the null model. DIC is Deviance Information Criteria. Marginal GLMM R2 is explained variance using fixed effectsonly. Conditional GLMM R2 uses random effects.
GLMM Fixed effects β [95% CrI] Randomeffects
VC[95% CrI]
% VCchange
DIC GLMM R2
(marginal,conditional)
Sub
catc
hmen
t vs.
lake
sit
es
Null Intercept 0.41 [-2.52, 3.17] LakeSiteDendy
10.32 [0.84, 29.16]2.19 [1.23, 3.36]0.72 [0.54, 0.90]
------
1751.6 0, 0.94
Model InterceptSub
-0.07 [-2.98, 3.03]1.02 [-0.06, 2.06]
LakeSubSiteDendy
12.30 [0.92, 33.64]0.77 [0.00, 3.21]1.90 [1.00, 2.99]0.72 [0.54, 0.90]
+19%
-13%0%
1751.3 0.01, 0.94
Sub
catc
hmen
t com
pari
sons Null Intercept 0.90 [-1.89, 3.47] Lake
SiteDendy
9.51 [0.68, 27.27]1.47 [0.50, 2.83]1.21 [0.82, 1.60]
------
938.3 0, 0.91
T-I InterceptMacWoodArea
Wood x MacWood x Area
0.48 [-1.86, 3.06]1.21 [0.44, 1.99]-0.29 [-0.96, -0.36]0.35 [-0.61, 1.32]
-0.70 [-1.28, -0.08]-1.31 [-2.42, -0.21]
LakeSiteDendy
8.25 [0.00, 23.23]1.10 [0.27, 2.26]1.21 [0.85, 1.65]
+9%-25%0%
934.6 0.19, 0.91

43
TABLE 4 Continued
GLMM Fixed Effects β RandomEffects
VC[95% CrI]
% VCchange
DIC GLMM R2
(marginal,conditional)
Sub
catc
hmen
t com
pari
sons
T-II InterceptMacWoodImpAreaH CTWI
Wood x MacWood x ImpWood x AreaWood x H CTWI
0.41 [-3.2, 4.08]1.75 [1.01, 2.53]-0.64 [-1.42, 0.07]0.15 [-0.39, 0.62]1.00 [-0.16, 2.23]-0.66 [-1.20, -0.12]
-0.80 [-1.31, -0.33]-0.33 [-0.60, -0.05]-1.82 [-3.42, -0.41]0.63 [0.02, 1.31]
LakeSiteDendy
15.5 [0.02, 51.73]0.40 [0.00, 1.14]1.22 [0.86, 1.72]
+63%-73%+1%
932.9 0.21, 0.94
S InterceptMacWoodAreaNDVI
NDVI x MacNDVI x WoodNDVI x Area
1.37 [-1.70, 4.28]0.88 [0.28, 1.43]-0.72 [-1.19, -0.25]0.90 [0.24, 1.56]-0.79 [-1.50, -0.06]
1.50 [0.73, 2.22]0.76 [0.39, 1.14]1.26 [0.48, 1.98]
LakeSiteDendy
10.95 [0.66, 32.70]0.35 [0.00, 0.90]1.23 [0.86, 1.67]
+15%-80%+2%
936.2 0.23,0.92

44
At subcatchment sites, woody debris had a negative effect on H. azteca
abundance (Table 4, subcatchment comparison models). Woody debris also decreased the
positive influence of macrophytes and subcatchment area (T-I 95% CrI for the woody
debris & macrophyte interaction: [-1.28, -0.08]; woody debris & subcatchment area
interaction: [-2.42, -0.21]). These effects were similar for both T-I and T-II, where T-I
originally included the estimate of % upland area (Low CTWI, although excluded
through model selection) and T-II included the estimate of % wetland area (High CTWI).
High woody debris cover and high impermeable/bare soils in the terrestrial subcatchment
area resulted in fewer H. azteca (T-II 95 % CrI for interaction: [-0.60, -0.05]). At low to
average woody debris cover (0–40%), wetland cover in the subcatchment area had a
negative effect on H. azteca abundance, however, at high cover (80%), the effect of
wetland cover was positive. Therefore, when woody debris cover is high there are
generally fewer H. azteca at subcatchment sites but, with more wetland cover in the
subcatchment area, the negative effect of the woody debris cover at the site was reduced.
There appeared to be more H. azteca at subcatchment sites with increasing
terrestrial vegetation density, using NDVI as a surrogate measure (Figure 9, Table 4).
More amphipods were associated with increased macrophyte cover and, as NDVI in the
adjacent subcatchment increased, this effect was stronger (95% CrI for interaction: [0.73,
2.22]). Similarly, the positive effect of subcatchment area on amphipod abundance
increased with NDVI (95% CrI for interaction: [0.48, 1.98]). Fewer amphipods were
found with more woody debris cover, however, this negative relationship decreased again
(as it had with wetland cover) as NDVI increased (95% CrI for interaction: [0.39, 1.14]).

45
FIGURE 9- The interactions of NDVI with standardized predictor variables onabundance. Left plots show expected marginal abundance with predictor variables atdifferent NDVI values. Shaded polygons show 95% confidence intervals of the predictedrelationship. Means and standard deviations of predictor variables presented in plots inright column. Plots in right column are three dimensional scatterplots of standardizedpredictor variables (x-axis), standardized NDVI (z-axis), and subcatchment abundance
High NDVI = 0.79Avg. NDVI = 0.67Low NDVI = 0.45
Expectation at predictor averagesRange of observed data
DaisyHannahLohi
MiddleRichard
Macrophytes
ln(A
bund
ance
)
-10
-5
0
5
10
-2 -1 0 1 2 -2 -1 0 1 201
23
4
-3-2-10 1
Macrophytes (scaled, = 0.83, = 0.15)
ND
VI
Abun
danc
e / L
ake
Mea
n
Woody Debris
ln(A
bund
ance
)
-10
-5
0
5
10
-2 -1 0 1 2 -2 -1 0 1 201
23
4
-3-2-10 1
Woody Debris (scaled, = 0.37, = 0.24)
ND
VI
Abun
danc
e / L
ake
Mea
n
Subcatchment Area
ln(A
bund
ance
)
-10
-5
0
5
10
-1 0 1 2 3 -1 0 1 2 301
23
4
-3-2-10 1
Subcatchment Area (scaled, = 9.7 ha, = 11.3)
ND
VI
Abun
danc
e / L
ake
Mea
n

46
means scaled by their respective lake means. Mean and standard deviation of NDVI:0.67, 0.07.
3.3 Single-lake abundance survey
Comparing the mid-lake to littoral chemistry samples, the mid-lake sample had
significantly higher Cd and Cu concentrations and significantly lower Mn and Na
concentrations than the nearshore areas (Wilcoxon signed rank test p<0.004). There were
no significant differences between mid-lake and littoral Al, Co, Ni, Ca, HIX, β:α, FI, or
estimated DOC concentrations (Table C.1).
The mean abundance of H. azteca in Daisy Lake was 9.5 ± 14.2 (1 SD) per dendy,
pooled across 11 sites and 62 dendies. Evaluating all sites in Daisy Lake, H. azteca did
not increase significantly from low (<50%) to high (>50%) macrophyte cover (95% CrI
on linear predictor scale: [-0.36, 3.91]). From shoreline surveys, macrophyte cover was
generally low and patchy except for near wetland-dominated sites A2 and A6. I evaluated
models that controlled for a single chemical variable (Table D.1) and found weak
evidence (Aw = 0.19) that more H. azteca were found at high macrophyte sites after
controlling for Cd, although the 95% CrI for the high and low abundance estimates
overlapped (not shown). Similar results were found using only subcatchment sites,
although in this case the controlled element was FI (Aw = 0.15) (Table D.2). The Cd
relationship appears to be driven by site A6, which is an extreme outlier for Cd. The 95%
confidence set of candidate models (by summing the Aw of top models until > 0.95)
included nearly all of the chemical variables and some did not indicate the same
relationship. Hence, I conclude that low and high macrophyte sites were not significantly
different in H. azteca abundance, when controlling for a single chemical variable.

47
Using all subcatchment sites, nine a priori candidate landscape models were
generated including the intercept-only null model (Table D.3). The top three landscape
models are reported (Aw = 0.39, 0.14, and 0.12; 2mR = 0.42, 0.52, 0.42; 2
cR = 0.83, 0.83,
0.83, respectively). The first model indicated a positive relationship between H. azteca
abundance and subcatchment area. The second indicated that as the amount of medium
CTWI (moderate accumulation, moderate slope) increased, so did H. azteca abundance
but that this rate declined as the cover of impermeable/bare soils increased. The third
indicated that at low and high levels of subcatchment water content (TCT WI –
soil/vegetation water content), fewer H. azteca were present but that there is an optimal
level of mean subcatchment wetness. I evaluated these competing models to assess how
high-resolution chemistry or macrophyte density improved each model’s predictive
capacity. Overall, there was strong evidence that a model including both subcatchment
area and the organic matter quality in terms of terrestrially-derived organic matter was
the best candidate model (Aw = 0.95; Table D.13, model 1).
More H. azteca occurred at sites with larger subcatchment areas. If subcatchment
area was held constant, more H. azteca were associated with more terrestrially-derived
OM, as indicated by the FI (Figure 10; Table 5). For a 13 ha (1 SD) increase in
subcatchment area, there was an associated 3.8 times increase in H. azteca abundance
(95% CI on natural logarithmic scale: [0.69, 1.95]). Values of ~1.8 for FI are associated
with bacterial/algal derived OM while values close to 1.2 are considered to be more
terrestrially derived (Fellman et al. 2010). The mean FI at subcatchment sites was 1.41
for Daisy Lake, closely aligning with the mean of 1.38 including all sites and the mid-
lake sample. For a 0.06 decrease in FI (1 SD), 5.4 times as many H. azteca are expected,

48
holding subcatchment area constant (95% CI: [-2.52, -0.84]). Incorporating this variable
explained 38% more of the between-site variation than the subcatchment area-only
model, and could not be further improved by incorporating the effect of macrophytes
(ΔAICc with macrophytes = +2.64; Table D.6 model 2).
FIGURE 10 - Predicted marginal (i.e., not accounting for random effects) relationshipbetween subcatchment area and H. azteca abundance (left) and after incorporating thefluorescence index (FI) (right). Sites are plotted as site mean ± 1 SD on the naturallogarithmic scale. Shaded polygons show the 95% CI about the predicted relationship.Note that smaller dotted lines and lighter polygons (right) above and below the averagerelationship represent are for a -1 SD and +1 SD shift, respectively.

49
TABLE 5- Model results from null and best candidate GLMMs associating H. aztecaabundance with landscape, chemistry, and macrophyte variables. Coefficients and 95%CI are given on the scale of the linear predictor (natural log), bolded when notoverlapping zero. The 2
site compares the estimate to the null model. The dispersion
parameter, ω, is given. Marginal R2 is explained variance using fixed effects only.Conditional R2 incorporates random effects.GLMM Fixed effects β [95% CI] 2
siteσ Δ2siteσ ω AICc 2
c2m R,R
Null Intercept 1.11 [-0.26, 2.48] 3.49 -- 2.59 220.1 0, 0.82
BestModel
InterceptAreaFI(terrestrial DOM)
1.75 [1.14, 2.35]1.33 [0.69, 1.95]-1.68 [-2.52, -0.84]
0.43 -88% 2.61 211.6 0.76, 0.88
Alternative model #1:
As the average soil/volumetric water content increased, H. azteca abundance
increased but decreased at the highest levels (satellite-derived TCT WI) (Figure 11; Table
D.3 model 4). This gradient extended from the small K subcatchment to the most wetland
dominated A6 subcatchment and forested A3 subcatchment. The optimal TCT WI value
was approximately -0.07. Holding TCT WI constant, H. azteca abundance was expected
to increase by approximately 5.3 times with a 0.06 decrease in FI (95% CI [-2.90,-0.44])
(Figure 11; Appendix D.12 model 1). Including the FI improved the 2mR by 2% and
including macrophytes did not further improve the model (ΔAICc with macrophytes:
+1.29; Table D.12 model 2), although including macrophytes improved the 2mR by 12%.

50
FIGURE 11- Predicted marginal relationship between mean TCT WI and H. aztecaabundance (left) and after FI (right). Sites are plotted as mean ± 1SD on the naturallogarithmic scale. Shaded polygons show the 95% CI about the predicted relationship.Lighter polygons (right) and smaller dotted lines represent the change in relationship fora ±1 SD shift in FI.
Alternative model #2:
As the amount of medium CTWI (moderate slope, moderate accumulation)
increased in the subcatchment, H. azteca abundance increased. However, as the amount
of impermeable/bare soils increased, this positive effect of medium CTWI on H. azteca
abundance decreased (95% CI for interaction: [-9.10, -2.4]) (Figure 12; Table D.3 model
2). Medium CTWI was positively related to subcatchment area and represents the
dendritic networks linking upland soils to lowland streams and wetlands (Figure 4, grey
CTWI). Incorporating Cd improved the explained between-site variation by 6%. The
effect on H. azteca abundance was not significant (95% CI: [-0.14, 1.83]) but was still

51
selected based on AICc (Table D.8, model 1). Including macrophyte cover instead of Cd
did not improve the model (Δ AICc for macrophytes = + 2.00; Table D.9 model 3).
FIGURE 12 - Predicted marginal relationship between medium CTWI and H. aztecaabundance (left) and after incorporating Cd (right). Sites are plotted as mean ± 1SD onthe natural logarithmic scale. Shaded polygons show the 95% CI about the predictedrelationship. Darker polygons represent the average marginal relationship. Thin dottedlines indicate the relationship between medium CTWI and H. azteca for a ± 1 SD changein the % impermeable/bare soils (positive slope = low %).

52
Chapter 4
Discussion
Our results show that H. azteca has continued to colonize Sudbury lakes over time
(Figures 2 and 6). The important chemical factors controlling occurrence at the landscape
scale are conductivity/alkalinity and metals, but their relative importance changed over
time (Figure 7). I found that metal concentration became less important and
conductivity/alkalinity became more important in predicting H. azteca occurrence in later
years.
Abundance of H. azteca within lakes increased with time since colonization
(Figure 8). Subcatchment confluence sites are hot spots for H. azteca abundance on
average, although the magnitude of the difference between confluence and lake sites is
lake-specific (Figure 8). Our data suggest that the highest quality subcatchment sites are
those with high macrophyte density and low woody debris density. Colonization
suitability increased when the adjacent subcatchment was large and had high terrestrial
vegetation density (i.e., high NDVI, low barren rock cover). When subcatchment sites
have high woody debris density, more wetland cover makes the site more suitable for
colonization. From the single lake study, I found more H. azteca were associated with
increased subcatchment area, and that there were even more H. azteca as the OM
composition in water at subcatchment drainage sites shifted towards more terrestrially-
derived sources.
I provide strong evidence that the chemical environment is still limiting the
distribution of H. azteca across the Sudbury region. This is in agreement with a broad
scale benthic invertebrate survey that found that the abundance of shredder functional

53
feeding group (dominated by Hyalellidae) was correlated with time since pH reached 6.0
(Wesolek 2010a). Chemical gradients could also have indirect food web affects,
preventing H. azteca colonization, by influencing the physiological tolerances of other
organisms. For example, high metal concentrations and low pH may limit occurrence of
piscivorous fish, resulting in higher abundance of benthivores, and consequently, higher
predation pressure on colonizing H. azteca. However, the colonization of Sudbury lakes
is more likely controlled by chemical gradients than fish predation despite high densities
of yellow perch (a potential predator for invertebrates) populations in the Sudbury region
(Luek et al. 2012). Larger ecomorphs of H. azteca have a higher likelihood of being
consumed by fish and invertebrate predators than smaller ecomorphs (Milstead and
Threlkeld 1986; Wellborn 1994). Therefore if excessive fish predation was the primary
barrier to recovery at the regional scale, the large-bodied ecomorph that is currently
colonizing Sudbury urban lakes would be unlikely (Babin-Fenske et al. 2012). The more
likely limitation thus appears to be the chemistry itself. In addition, Daisy Lake has
supported populations of piscivorous walleye (Sander vitreus) and northern pike (Esox
lucius) since at least 2004 yet H. azteca were not detected until 2010 (CFEU 2004)
indicating that there is not a strong relationship between fish predation and H. azteca
occurrence. Furthermore, following the introduction of smallmouth bass (Micropterus
dolomieu) in 2008 to two lakes (Crowley and Lohi) that lacked H. azteca, drastic
reductions in the density of yellow perch populations occurred (Luek, unpublished data);
H. azteca was detected in Lohi Lake in 2010 but Crowley remains uncolonized, likely
because conductivity and major ions are in low concentration (Conductivity: 29
compared to 67 μScm1; Na: 1.0 compared to 5.1 mgL-1 for Crowley and Lohi,

54
respectively). These lake cases suggest that while fish predation could limit colonization,
the more likely barrier to recovery is chemical limitation.
I was surprised to find that a large number of lakes have been colonized in the
historically barren and semi-barren area compared to the less visibly damaged areas in
the region (Figure 2). Given the initial severity of acidification and metal deposition near
smelting complexes, H. azteca populations are therefore now currently occupying lakes
which were reported to be some of the most atmospherically contaminated in the world
(Keller et al. 1999). After pH and alkalinity thresholds have been met, we would expect
colonization time lags of approximately 4–6 years as has been observed in nearby and
less metal-impacted Killarney Park lakes (Snucins and Gunn 1999; Snucins 2003).
However, the currently uncolonized lakes in the southern part of the Sudbury area met
these pH threshold and alkalinity thresholds of 6.0 and 0 meqL-1 at least a decade ago.
Other chemical conditions may explain why these differences in colonization have
occurred. These lakes are low in ionic strength and alkalinity compared to colonized
lakes; the median conductivity and alkalinity were 30 (23–61) μScm-1 and 2.21 (0.22–
5.8) mgL-1 CaCO3 compared to colonized lakes, 297 (32–1350) μScm-1 and 19.9 (2.54–
66) mgL-1 CaCO3, respectively. The low alkalinity and low ionic strength of these lakes
increases the toxicity (and bioavailability) of metals to H. azteca (Borgmann 1996;
Borgmann et al. 2005; Shuhaimi-Othman et al. 2006). This may be exacerbated by the
fact that many of these lakes are underlain by a granitic bedrock zone that is low in
buffering capabilities and may also have naturally high and ‘anomalous’ levels of some
metals (Dyer et al. 2004). For example, the median values of Cu and Ni were 37 ppm and
26 ppm and the 95th percentile was 104 ppm and 134 ppm, respectively (Dyer et al.

55
2004). The lakes with anomalous levels include Bibby, Broder 23, Camp, Chief,
Crowley, Forest, and Pine (Figure 2). Combining both the quantity (i.e., inputs from
bedrock) and relatively high bioavailability of metals (i.e., because of the low levels of
base cations), this may explain the strong effect of the conductivity/alkalinity gradient on
H. azteca presence-absence in this study.
Dispersal limitation is not likely an impediment for colonization on longer time
scales beyond 4–6 year time lags observed (Snucins and Gunn 1999; Snucins 2003).
H. azteca is not likely to be dispersal limited. Although reproductive isolation is
associated with significant genetic divergence across North America, H. azteca is a
paradox because even though it lacks specific dispersal adaptations it is nearly ubiquitous
in freshwater ecosystems (Witt and Hebert 2000; Wellborn and Capps 2013). Across a
prairie region, evidence also suggests that H. azteca can quickly recolonize dried-up and
disconnected wetlands within a year of drought conditions (Swanson 1984). A suggested
dispersal mechanism is overland transport as H. azteca have been found clinging to the
fur of aquatic mammals and feathers of waterfowl (Peck 1975; Swanson 1984). Dispersal
among hydrologically connected waterbodies is also likely. Furthermore, evidence from
laboratory experiments suggests that even if dispersal events were rare, this could be
partially offset by the high probability of establishing viable populations from even a
single gravid colonist (Wellborn and Capps 2013). Therefore, given this apparent ability
to disperse, it is more likely that chemical limitations exist at the regional scale rather
than dispersal barriers. A case in point, Richard Lake has supported a viable population
of amphipods for at least 20 years, yet H. azteca abundance and distribution is still

56
restricted in the readily connected but more metal-contaminated upstream Daisy Lake
(Figure 2, Table 3).
I provide evidence that H. azteca may initially colonize subcatchment confluence
sites in recovering lakes (Figure 8). This adds to a growing body of evidence that
terrestrial controls on OM export to subcatchment confluence sites may result in hot spots
of biological recovery in lakes recovering from regional acidification (Szkokan-Emilson
et al. 2011; Wesolek et al. 2010b). Many studies conducted in unimpacted stream and
river systems have demonstrated the vital role of terrestrial subsidies in providing energy
for organisms at multiple trophic levels (Richardson et al. 2010; Wallace 1999),
suggesting that the subcatchment streams may be important sources of allochthonous
material to lakes. Increased densities, richness, and diversity of fishes have also been
observed at the ecotone of stream mouths entering lakes (Willis and Magnuson 2000).
Local habitat conditions (e.g., macrophyte and woody debris cover) also appear to
be important in determining H. azteca abundance at individual sites from the six-lake
abundance survey. Other studies have demonstrated the importance of local habitat
characteristics to within-lake distribution and H. azteca is often associated with
macrophyte stands (but see Cooper 1965; Lindeman and Momot 1983 for effect of
macrophyte species type). In fact, France (1995) found 20 times more amphipods in
macrophytes than other organic detritus (2000 m-2 compared to 100 m-2) in a nearby
region. Macrophytes likely serve to reduce predation, trap particulate OM, and provide
surface area for epiphytic food sources (Carpenter and Lodge 1986). Our findings suggest
that more amphipods are associated with increased macrophyte cover, and that increased
terrestrial vegetation density (using NDVI as a surrogate measure) enhances this effect.

57
As other studies have demonstrated that NDVI positively correlates with total organic
carbon and phytoplankton richness in lakes (Larsen et al. 2011; Soinen and Luoto 2012),
increased terrestrial vegetation density may result in more terrestrial carbon being
exported, trapped, and processed through epiphyte-macrophyte interactions, enhancing
the positive effects of macrophytes on H. azteca at subcatchment confluence sites.
Woody debris, like macrophytes, may increase the surface area for epiphytic
growth and provide protection from predation (Eggert and Wallace 2007; France 1997).
However, I found that it had a negative effect on amphipod abundance and a negative
effect on how subcatchment variables, like subcatchment area, influenced abundance. In
both topography models woody debris reduced the positive effect of macrophytes and
subcatchment area on H. azteca abundance. Our simple measure of woody debris,
ranging from sticks to logs, provides little information about the mechanisms for declines
in H. azteca abundance. The correlation between woody debris and macrophytes at
subcatchment sites was negative but not significant (Spearman’s ρ: -0.15, p = 0.36)
indicating that competition for space is not a major factor. The presence and amount of
woody debris should decrease predation; this was observed for grass shrimp in field
conditions and aquaria where they evaded capture by taking cover under the wood
(Everett and Ruiz 1993). Experimental removal of coarse woody debris in whole lakes
resulted in rapid declines in yellow perch abundance (Helmus and Sass 2008). Therefore,
it is possible that at the site scale, woody debris increases the prevalence of predatory fish
such that the positive influences of macrophyte and subcatchment area are not as strong,
although Helmus and Sass (2008) failed to detect changes in benthic macroinvertebrates
in their experiments.
58
The proportion of wetlands in the terrestrial catchment is a significant predictor of
dissolved and particulate organic carbon (Creed et al. 2008; Dillon and Molot 1997).
Wetlands are also important in terms of metal mobilization/retention and nutrient input.
For example, drought can control the release of metals from peatlands, which may be
particularly important in the metal-saturated catchments of Sudbury lakes (Adkinson et
al. 2008; Nriagu et al. 1998; Szkokan-Emilson et al. 2013). In a study evaluating
subcatchment influence, fine particulate OM from subcatchments with increased wetland
cover was associated with increased benthic invertebrate diversity (Szkokan-Emilson et
al. 2011). In contrast, I found negative relationships with wetland cover and H. azteca
abundance when woody debris cover was low. When woody debris cover was high, I
found positive relationships with wetland cover and abundance. The negative relationship
would be expected if metal contamination still affects sensitive organisms at
subcatchment confluence sites dominated by wetlands.
In the single lake study, relationships between macrophyte cover, wetland cover,
and NDVI were not found. This may be explained by the fact that the variables measured
for the six-lake survey may be lake dependent. For example, Richard Lake had one of the
highest median terrestrial vegetation densities, the highest macrophyte density, and also
the highest H. azteca abundance. Conversely, Daisy Lake had one of the lowest terrestrial
vegetation densities, macrophyte density, and H. azteca abundance. Using the single lake,
much stronger between-site effects were found (as indicated by > 2mR than in the six-lake
models). More H. azteca were found at larger subcatchments and at sites with more
terrestrially-derived organic matter (OM), as indicated by the FI. This increase is
expected to be a function or more resources being exported into a given habitat, although

59
this was not measured. Subcatchment area was not strongly correlated with any chemical
variable (all Spearman’s signed rank test p>0.05) and strongly, but not significantly,
correlated with export of fine particulate OM (Spearman’s ρ = 0.69, p = 0.08), taken from
Szkokan-Emilson et al. (2011). Therefore, it is unclear whether larger subcatchment areas
provide more OM delivery or another service that provides suitable habitat for colonizing
H. azteca.
The fluorescence index increased abundance of H. azteca when holding
subcatchment area constant, suggesting an important link with DOM quality. The mean
FI in Daisy Lake was 1.38 (1.20–1.48). Since microbially derived DOM typically has an
FI >1.5, this indicates that Daisy Lake DOM is primarily derived from terrestrial sources,
such as the decomposition of terrestrial plant or soil OM, rather than microbial exudates
(McKnight et al. 2001). The amount of terrestrially-derived OM could provide energy
subsidies to organisms at these sites, or provide a protective effect from metal toxicity.
Although the absolute amount of OM can decrease metal toxicity to organisms (Doig and
Liber 2006, the quality of OM can have different protective effects depending on the
source of OM, as measured by the FI and other compositional indices (Al-Reasi et al.
2011). A recent study found that FI was strongly and negatively correlated with a
measure of binding capacity for Cu, Bmax (μM Cu mg-1 C) (Pearson’s r = -0.99), implying
that as terrestrially-derived OM increases so does its ability to bind Cu (Livingstone
2012). Daisy Lake, however, had one of the lowest Bmax values of (0.6 ± 0.1) μM Cu mg-
1 C compared to the highest 1.0 μM Cu mg-1 C, suggesting that overall, Daisy Lake has
poor protection against the effects of Cu toxicity. In the same study, lower 96 hr Cu LC50
values (i.e., the concentration at which 50% of the population is affected, therefore, lower

60
survival) was associated with higher FI values, further demonstrating its protective
effects. If the mechanism that produces a response in H. azteca abundance is toxicity
related, our FI measure suggests that protective effects can also operate at smaller scales.
However, much more study is needed to determine the mechanisms by which H. azteca
increases with this measure in natural populations, and how this effect might vary
spatially and seasonally (Fellman et al. 2010).
In the context of regional population recovery, I investigated the distribution of a
sensitive indicator of ecosystem health across multiple scales. My results support Levin’s
(1992) suggestion that no correct scale exists to model ecosystems; predictions must be
made in the context and scale of the question asked, with assumptions that the relevant
scale integrates broader- and finer-scale processes. At the broader scale, strong and
relatively simple relationships between H. azteca occurrence and water chemistry were
observed, likely related to regional patterns in geology. At the finer scale, H. azteca
occurrence appeared to be related to subcatchment confluence sites representing local
hot-spots for colonization, a relationship observed within multiple lakes. Furthermore,
variation in abundance was associated with the modifying influences of local habitat
features (e.g., macrophyte cover) and their interactions with the local terrestrial
environment (e.g., vegetation density). Increased terrestrial vegetation may increase the
export of OM to confluence site deltas, where H. azteca likely benefit from even smaller-
scale features like reduced local metal toxicity or increased food resources. These
benefits may partially explain why subcatchment confluence sites are suitable hot-spots
for H. azteca colonization. Therefore, the incorporation of cross-scale interactions into
models is a crucial step in predicting how biological recovery may proceed in Sudbury

61
lakes and how organisms and communities will respond to stressors that operate at
multiple scales (Peters et al. 2007).

62
Chapter 5
Summary
The different scales of study (i.e., regional, six-lake, and single-lake) highlight the
dynamic linkages between terrestrial and aquatic environments, using the occurrence of
an important indicator species. In our regional surveys, we found that the probability of
H. azteca occurrence is still largely a function of lake water characteristics, which will be
influenced by larger scale features like bedrock geology. If chemical thresholds are met,
our detailed six-lake study of subcatchment confluence sites suggested that the local
environment is heterogeneous, with confluence sites providing hot spots for recovery
during the early stages of colonization. The quality of these hot spots is further
determined by both within lake characteristics (e.g., macrophyte and woody debris
cover), catchment characteristics (e.g., vegetation density and subcatchment size), and
their interactions (e.g., the relative amount of decomposing organic matter within the
lake). By developing similar models across and within regions, it is expected that critical
features of lake watersheds will be identified, protected, maintained, or altered to provide
suitable resources and conditions for maintaining healthy and resilient recipient aquatic
communities. Using H. azteca as an indicator of aquatic ecosystem health, these
relationships suggest that both terrestrial and aquatic components are important
determinants of biological recovery, in particular, that variation in the terrestrial
environment at smaller spatial scales influences recovery at the land-water interface.

63
References
Adkinson A, Watmough SA, Dillon PJ. 2008. Drought-induced metal release from awetland at Plastic Lake, central Ontario. Can J Fish Aquat Sci 65:834-845.
Babin-Fenske JJ, Merritt TJS, Gunn JM, Walsh T, Lesbarreres D. 2012. Phylogeneticanalysis of Hyalella colonization in lakes recovering from acidification and metalcontamination. Can J Zool 90:624-629.
Beauclerc KB, Gunn JM. 2001. Ultraviolet absorbance in lakes near the metal smelters inSudbury, Canada. Journal of Environmental Monitoring. 3:575-579.
Beven K and Kirkby M. 1979. A physically based, variable contributing area model ofbasin hydrology/Un modèle à base physique de zone d'appel variable de l'hydrologiedu bassin versant. Hydrolog Sci J 24:43-69.
Binks JA, Arnott SE, Sprules WG. 2005. Local factors and colonist dispersal influencecrustacean zooplankton recovery from cultural acidification. Ecol Appl 15:2025-2036.
Bolker BM, Brooks ME, Clark CJ, Geange SW, Poulsen JR, Stevens MHH, White JS.2009. Generalized linear mixed models: A practical guide for ecology and evolution.Trends Ecol Evol 24:127-135.
Bonada N, Prat N, Resh V, Statzner B. 2006. Developments in aquatic insectbiomonitoring: A comparative analysis of recent approaches. Annu Rev Entomol51:495-523.
Borgmann U. 1996. Systematic analysis of aqueous ion requirements of Hyalella azteca:A standard artificial medium including the essential bromide ion. Arch EnvironContam Toxicol 30:356-63.
Borgmann U, Couillard Y, Doyle P, Dixon DG. 2005. Toxicity of sixty‐three metals andmetalloids to Hyalella azteca at two levels of water hardness. Environ Toxicol Chem24:641-652.
Borgmann U and Norwood W. 2002. Metal bioavailability and toxicity through asediment core. Environ Pollut 116:159-168.
Borgmann U, Nowierski M, Dixon D. 2005. Effect of major ions on the toxicity ofcopper to Hyalella azteca and implications for the biotic ligand model. AquaticToxicology 73:268-87.

64
Bruns D. 2005. Macroinvertebrate response to land cover, habitat, and water chemistry ina mining-impacted river ecosystem: A GIS watershed analysis. Aquat Sci 67:403-423.
Burnham KP and Anderson DR. 2002. Model selection and multi-model inference: Apractical information-theoretic approach. Springer-Verlag, New York, US.
Carbone J, Keller W, Griffiths R. 1998. Effects of changes in acidity on aquatic insects inrocky littoral habitats of lakes near Sudbury, Ontario. Restor Ecol 6:376-389.
Carpenter S and Lodge D. 1986. Effects of submersed macrophytes on ecosystemprocesses. Aquat Bot 26:341-370.
Carpenter S, Cole J, Pace M, Van de Bogert M, Bade D, Bastviken D, Gille C, HodgsonJ, Kitchell J, Kritzberg E. 2005. Ecosystem subsidies: Terrestrial support of aquaticfood webs from C-13 addition to contrasting lakes. Ecology 86:2737-2750.
[CFEU] Cooperative Freshwater Ecology Unit. 2004. Recovery of acid- and metal-damaged lakes near Sudbury, Ontario: Trends and status. Sudbury: CooperativeFreshwater Ecology Unit.
[CFEU] Cooperative Freshwater Ecology Unit. 2006. Data report: 25 years of extensivemonitoring of acidified lakes in the Sudbury area. Sudbury: Cooperative FreshwaterEcology Unit.
[CFEU] Cooperative Freshwater Ecology Unit. 2008. Annual report 2008. Sudbury:Cooperative Freshwater Ecology Unit.
Cole J, Carpenter S, Pace M, Van de Bogert M, Kitchell J, Hodgson J. 2006. Differentialsupport of lake food webs by three types of terrestrial organic carbon. Ecol Lett9:558-568.
Cooper WE. 1965. Dynamics and production of a natural population of a fresh-wateramphipod, Hyalella azteca. Ecol Monogr 35:377-394.
Cory RM and McKnight DM. 2005. Fluorescence spectroscopy reveals ubiquitouspresence of oxidized and reduced quinones in dissolved OM. Environ Sci Technol39:8142-8149.
Creed IF, Beall FD, Clair TA, Dillon PJ, Hesslein RH. 2008. Predicting export ofdissolved organic carbon from forested catchments in glaciated landscapes withshallow soils. Global Biogeochem Cycles 22:GB4024.
Crist E and Cicone R. 1984. A physically-based transformation of thematic mapper data -the TM tasseled cap. IEEE Trans Geosci Remote Sens 22:256-263.

65
Davidson J and Gunn J. 2012. Effects of land cover disturbance on stream invertebratediversity and metal concentrations in a small urban industrial watershed. Hum EcolRisk Assess 18:1078-1095.
DGT Research Ltd. 2005. DGT - for measurements in waters, soils, and sediments.Available from: http://www.dgtresearch.com/
Dillon PJ and Molot LA. 1997. Effect of landscape form on export of dissolved organiccarbon, iron, and phosphorus from forested stream catchments. Water Resour Res33:2591-2600.
Dionne K, Vergilino R, Dufresne F, Charles F, Nozais C. 2011. No evidence for temporalvariation in a cryptic species community of freshwater amphipods of the Hyalellaazteca species complex. Diversity 3:390-404.
Dixit AS, Dixit SS, Smol JP. 1996. Setting restoration goals for an acid and metal-contaminated lake: A paleolimnological study of Daisy Lake (Sudbury, Canada).Lake Reserv Manage 12:323-330.
Dixit S, Dixit A, Smol J. 1992. Assessment of changes in lake water chemistry inSudbury area lakes since preindustrial times. Can J Fish Aquat Sci 49:8-16.
Doig L and Liber K. 2006. Influence of dissolved OM on nickel bioavailability andtoxicity to Hyalella azteca in water-only exposures. Aquat Toxicol 76:203-216.
Duan Y, Guttman S, Oris J, Bailer A. 2001. Differential survivorship among allozymegenotypes of Hyalella azteca exposed to cadmium, zinc or low pH. Aquat Toxicol54:15-28.
Dyer RD, Takats PA, Felix VE. 2004. Sudbury area lake sediment geochemical survey;Ontario Geological Survey, Open File Report 6126, 106p.
Eggert SL and Wallace JB. 2007. Wood biofilm as a food resource for streamdetritivores. Limnol Oceanogr 52:1239-1245.
Eimers MC, Watmough SA, Paterson AM, Dillon PJ, Yao H. 2009. Long-term declinesin phosphorus export from forested catchments in south-central Ontario. Can J FishAquat Sci 66:1682-1692.
Elston D, Moss R, Boulinier T, Arrowsmith C, Lambin X. 2001. Analysis of aggregation,a worked example: Numbers of ticks on red grouse chicks. Parasitology 122:563-569.
Environment Canada. 2013. Biological test method: Test for survival and growth insediment and water using the freshwater amphipod Hyalella azteca. Ottawa:Government of Canada. Report nr En49-7/1-33E.

66
Erskine RH, Green TR, Ramirez JA, MacDonald LH. 2006. Comparison of grid-basedalgorithms for computing upslope contributing area. Water Resour Res 42:W09416.
Everett R and Ruiz G. 1993. Coarse woody debris as a refuge from predation in aquaticcommunities - an experimental test. Oecologia 93:475-486.
Fellman JB, Hood E, Spencer RG. 2010. Fluorescence spectroscopy opens new windowsinto dissolved OM dynamics in freshwater ecosystems: A review. Limnol Oceanogr55:2452-2462.
Fielding A and Bell J. 1997. A review of methods for the assessment of prediction errorsin conservation presence/absence models. Environ Conserv 24:38-49.
Fournier DA, Skaug HJ, Ancheta J, Ianelli J, Magnusson A, Maunder MN, Nielsen A,Sibert J. 2012. AD model builder: Using automatic differentiation for statisticalinference of highly parameterized complex nonlinear models. Optim MethodsSoftware 27:233-249.
France R. 1997. Macroinvertebrate colonization of woody debris in Canadian Shieldlakes following riparian clearcutting. Conserv Biol 11:513-521.
France R. 1995. Macroinvertebrate standing crop in littoral regions of allochthonousdetritus accumulation - implications for forest management. Biol Conserv 71:35-39.
Garmo ØA, Røyset O, Steinnes E, Flaten TP. 2003. Performance study of diffusivegradients in thin films for 55 elements. Anal Chem 75:3573-3580.
Gergel SE, Turner MG, Kratz TK. 1999. Dissolved organic carbon as an indicator of thescale of watershed influence on lakes and rivers. Ecol Appl 9:1377-1390.
Gibbons W and Mackie G. 1991. The relationship between environmental variables anddemographic patterns of Hyalella azteca (Crustacea:Amphipoda). J N Am BentholSoc 10:444-454.
Grapentine LC and Rosenberg DM. 1992. Responses of the freshwater amphipodHyalella azteca to environmental acidification. Can J Fish Aquat Sci 49:52-64.
Gray DK, Arnott SE, Shead JA, Derry AM. 2012. The recovery of acid-damagedzooplankton communities in Canadian lakes: The relative importance of abiotic,biotic and spatial variables. Freshwat Biol 57:741-58.
Griffiths R and Keller W. 1992. Benthic macroinvertebrate changes in lakes nearSudbury, Ontario, following a reduction in acid emissions. Can J Fish Aquat Sci49:63-75.

67
Gunn JM, editor. 1995. Restoration and recovery of an industrial region: Progress inrestoring the smelter-damaged landscape near Sudbury, Canada. 1st ed. New York:Springer-Verlag. 358 p.
Gunn J and Keller W. 1990. Biological recovery of an acid lake after reductions inindustrial emissions of sulfur. Nature 345:431-433.
Hadfield JD. 2010. MCMC methods for multi-response generalized linear mixed models:The MCMCglmm R package. J Stat Soft 33:1-22.
Havel JE, Shurin JB, Jones JR. 2002. Estimating dispersal from patterns of spread:Spatial and local control of lake invasions. Ecology 83:3306-3318.
Helmus MR and Sass GG. 2008. The rapid effects of a whole-lake reduction of coarsewoody debris on fish and benthic macroinvertebrates. Freshwat Biol 53:1423-1433.
Helsel DR. 2011. Statistics for censored environmental data using minitab and R. 2nd ed.Hoboken: Wiley.
Huang C, Wylie B, Yang L, Homer C, Zylstra G. 2002. Derivation of a tasselled captransformation based on Landsat 7 at-satellite reflectance. Int J Remote Sens23:1741-1748.
Hynes HBN. 1975. Edgardo baldi memorial lecture: The stream and its valley.Verhandlungen Der Internationalen Vereinigung Fur Theoretische Und AngewandteLimnologie 19:1-15.
Jackson RD and Huete AR. 1991. Interpreting vegetation indices. Prev Vet Med 11:185-200.
Jansson M, Persson L, De Roos AM, Jones RI, Tranvik LJ. 2007. Terrestrial carbon andintraspecific size-variation shape lake ecosystems. Trends Ecol Evol 22:316-322.
Jenks GF. 1967. The data model concept in statistical mapping. International Yearbookof Cartography 7:186-190.
Jones SE, Solomon CT, Weidel BC. 2012. Subsidy or subtraction: How do terrestrialinputs influence consumer production in lakes? Freshwater Reviews 5:37-49.
Keller W. 2009. Limnology in northeastern Ontario: from acidification to multiplestressors. Can J Fish Aquat Sci 66:1189-1198.
Keller WB, Heneberry JH, Gunn JM. 1998. Effects of emission reductions from theSudbury smelters on the recovery of acid-and metal-damaged lakes. J Aquat EcosystStress Recovery 6:189-198.

68
Keller W, Yan ND, Gunn JM, Heneberry J. 2007. Recovery of acidified lakes: Lessonsfrom Sudbury, Ontario, Canada. Water, Air, & Soil Pollution: Focus 7:317-322.
Kozlov MV and Zvereva EL. 2007. Industrial barrens: Extreme habitats created by non-ferrous metallurgy. Rev Environ Sci and Biotechnol 6:231-259.
Larsen S, Andersen T, Hessen DO. 2011. Predicting organic carbon in lakes from climatedrivers and catchment properties. Global Biogeochem Cycles 25:GB3007.
Levin SA. 1992. The problem of pattern and scale in ecology. Ecology 73: 1943-1967.
Likens GE and Buso DC. 2012. Dilution and the elusive baseline. Environ Sci Technol46:4382-4387.
Lindeman D and Momot W. 1983. Production of the amphipod Hyalella azteca(Saussure) in a northern Ontario lake. Canadian J Zool 61:2051-2059.
Lindsay J. 2012. Whitebox: Geospatial analysis tools [computer program]. Version 2.0.3.Guelph, ON.
Luek A, Morgan GE, Wissel B, Gunn JM, Ramcharan CW. 2013. Impaired littoralenergy pathways cause a shift to pelagic resources by fish in recovering lake foodwebs. Ecol Freshwat Fish 22:348-360.
Luek A, Morgan GE, Wissel B, Gunn JM, Ramcharan CW. 2010. Rapid and unexpectedeffects of piscivore introduction on trophic position and diet of perch (Percaflavescens) in lakes recovering from acidification and metal contamination. FreshwatBiol 55:1616-1627.
Mac Nally R. 2002. Multiple regression and inference in ecology and conservationbiology: Further comments on identifying important predictor variables. BiodiversConserv 11:1397-1401.
Mantysaari D and Vine L. 2004. Increasing colonization of the amphipod (Hyalellaazteca) in Sudbury area lakes; Evidence of biological recovery. Sudbury, Ontario:Laurentian University.
McCall J, Gunn J, Struik H. 1995. Photo interpretive study of recovery of damaged landsnear the metal smelters of Sudbury, Canada. Water Air Soil Poll 85:847-852.
McKnight DM, Boyer EW, Westerhoff PK, Doran PT, Kulbe T, Andersen DT. 2001.Spectrofluorometric characterization of dissolved OM for indication of precursororganic material and aromaticity. Limnol Oceanogr 46:38-48.

69
McNicol D, Bendell B, Mallory M. 1995. Evaluating macroinvertebrate responses torecovery from acidification in small lakes in Ontario, Canada. Water Air Soil Poll85:451-456.
Milstead B and Threlkeld ST. 1986. An experimental analysis of darter predation onHyalella azteca using semipermeable enclosures. J N Am Benthol Soc 5:311-318.
Moore I, Gessler P, Nielsen G, Peterson G. 1993. Soil attribute prediction using terrainanalysis. Soil Sci Soc Am J 57:443-452.
[NASA] National Aeronautics and Space Administration. 2011. Landsat 7 science datausers handbook. Washington, DC: Government of the United States of America.
Nakagawa S and Schielzeth H. 2013. A general and simple method for obtaining R2 fromgeneralized linear mixed-effects models. Methods in Ecology and Evolution 4:133-142.
Nakagawa S and Schielzeth H. 2010. Repeatability for Gaussian and non-Gaussian data:A practical guide for biologists. Biol Rev 85:935-956.
Norwood W, Borgmann U, Dixon D, Wallace A. 2003. Effects of metal mixtures onaquatic biota: A review of observations and methods. Hum Ecol Risk Assess 9:795-811.
Nriagu J, Wong H, Lawson G, Daniel P. 1998. Saturation of ecosystems with toxicmetals in Sudbury basin, Ontario, Canada. Sci Total Environ 223:99-117.
[NTL-LTER] North Temperate Lakes LTER: Benthic macroinvertebrates 1981-2004[Internet]. Wisconsin, US: University of Wisconsin Board of Regents; c2005.Available from: http://lter.limnology.wisc.edu/dataset/north-temperate-lakes-lter-benthic-macroinvertebrates-1981-2004 .
O’Callaghan J and Mark D. 1984. The extraction of drainage networks from digitalelevation data. Computer Vision Graphics and Image Processing 28:323-44.
Ohno T. 2002. Fluorescence inner-filtering correction for determining the humificationindex of dissolved OM. Environ Sci Technol 36:742-746.
Oksanen J, Blanchet FG, Kindt R, Legendre P, Minchin PR, O'Hara RB, Simpson GL,Solymos P, Stevens MHH, Wagner H. vegan: Community ecologypackage.[computer program]. Version R package version 2.0-8.
[OMOE] Ontario Ministry of the Environment. 1983. Handbook of analytical methodsfor environmental samples. Rexdale, ON: Government of Ontario.

70
Parlanti E, Wörz K, Geoffroy L, Lamotte M. 2000. Dissolved OM fluorescencespectroscopy as a tool to estimate biological activity in a coastal zone submitted toanthropogenic inputs. Org Geochem 31:1765-1781.
Peck S. 1975. Amphipod dispersal in the fur of aquatic mammals. Can Field-Nat 89:181-182.
Peters DPC, Bestelmeyer BT, Turner MG. 2007. Cross-scale interactions and changingpattern-process relationships: Consequences for system dynamics. Ecosystems10:790-796.
Pettorelli N, Vik J, Mysterud A, Gaillard J, Tucker C, Stenseth N. 2005. Using thesatellite-derived NDVI to assess ecological responses to environmental change.Trends Ecol Evol 20:503-510.
Plummer M, Best N, Cowles K, Vines K. 2006. CODA: Convergence diagnosis andoutput analysis for MCMC. R News 6:7-11.
Polis GA, Anderson WB, Hold RD. 1997. Toward an integration of landscape and foodweb ecology: the dynamics of spatially subsidized food webs. Annu Rev Ecol Syst28: 289-316
Quinn GP and Keough MJ. 2002. Experimental design and data analysis for biologists.1st ed. Cambridge, UK: Cambridge University Press.
R Core Team. 2013. R: A language and environment for statistical computing [computerprogram]. Version 3.0.1. Vienna, Austria: R Foundation for Statistical Computing.
Richardson JS, Zhang Y, Marczak LB. 2010. Resource subsidies across the land-freshwater interface and responses in recipient communities. River Res Applic26:55-66.
Riera JL, Magnuson JJ, Kratz TK, Webster KE. 2000. A geomorphic template for theanalysis of lake districts applied to the Northern Highland Lake District, Wisconsin,USA. Freshwat Biol 43:301-318.
[SARA Group] Sudbury Area Risk Assessment Group. 2009. Volume III: Ecologicalrisk assessment. Available from:http://www.Sudburysoilsstudy.com/EN/indexE.htm.
Sauder J. 2012. The effects of land cover on Daisy Lake’s water quality. Sudbury,Ontario: Laurentian University.
Schindler DW. 2009. Lakes as sentinels and integrators for the effects of climate changeon watersheds, airsheds, and landscapes. Limnol Oceanogr 54:2349-2358.

71
Shuhaimi-Othman M, Pascoe D, Borgmann U, Norwood WP. 2006. Reduced metalsconcentrations of water, sediment and Hyalella azteca from lakes in the vicinity ofthe Sudbury metal smelters, Ontario, Canada. Environ Monit Assess 117:27-44.
Sing T, Sander O, Beerenwinkel N, Lengauer T. 2005. ROCR: Visualizing classifierperformance in R. Bioinformatics 21:3940-3941.
Skaug HJ, Fournier DA, Nielsen A, Magnusson A, Bolker BM. Generalized linear mixedmodels using AD Model Builder [computer program]. Version 0.7.7.
Snucins E. 2003. Recolonization of acid-damaged lakes by the benthic invertebratesStenacron interpunctatum, Stenonema femoratum and Hyalella azteca. Ambio32:225-229.
Soininen J and Luoto M. 2012. Is catchment productivity a useful predictor of taxarichness in lake plankton communities? Ecol Appl 22:624-633.
Solomon CT, Carpenter SR, Clayton MK, Cole JJ, Coloso JJ, Pace ML, Vander ZandenMJ, Weidel BC. 2011. Terrestrial, benthic, and pelagic resource use in lakes: Resultsfrom a three-isotope bayesian mixing model. Ecology 92:1115-1125.
Soranno PA, Webster KE, Cheruvelil KS, Bremigan MT. 2009. The lake landscape-context framework: Linking aquatic connections, terrestrial features and humaneffects at multiple spatial scales. Verh. Internat. Verein. Limnol 30:695-700.
Stephenson M and Mackie G. 1986. Lake acidification as a limiting factor in thedistribution of the fresh-water amphipod Hyalella azteca. Can J Fish Aquat Sci43:288-292.
Stephenson M and Mackie G. 1988. Multivariate-analysis of correlations betweenenvironmental parameters and cadmium concentrations in Hyalella azteca(Crustacea: Amphipoda) from central Ontario lakes. Can J Fish Aquat Sci 45:1705-1710.
Swanson G. 1984. Dissemination of amphipods by waterfowl. J Wildl Manage 48:988-991.
Szkokan-Emilson EJ, Wesolek BE, Gunn JM. 2011. Terrestrial organic matter assubsidies that aid in the recovery of macroinvertebrates in industrially damagedlakes. Ecol Appl 21:2082-2093.
Tarboton D. 1997. A new method for the determination of flow directions and upslopeareas in grid digital elevation models. Water Resour Res 33:309-319.
Treitz P and Howarth P. 1999. Hyperspectral remote sensing for estimating biophysicalparameters of forest ecosystems. Prog Phys Geogr 23:359-390.

72
Tucker CJ. 1979. Red and photographic infrared linear combinations for monitoringvegetation. Remote Sens Environ 8:127-150.
Valois AE, Keller WB, Ramcharan CW. 2011. Recovery in a multiple stressorenvironment: Using the reference condition approach to examine zooplanktoncommunity change along opposing gradients. J Plankton Res 33:1417-1429.
Vogelmann J, Helder D, Morfitt R, Choate M, Merchant J, Bulley H. 2001. Effects ofLandsat 5 thematic mapper and Landsat 7 enhanced thematic mapper plusradiometric and geometric calibrations and corrections on landscapecharacterization. Remote Sens Environ 78:55-70.
Wallace J, Eggert S, Meyer J, Webster J. 1997. Multiple trophic levels of a forest streamlinked to terrestrial litter inputs. Science 277:102-104.
Watson GB. 1992. Factors affecting the distribution of the freshwater amphipod(Hyalella azteca) in Sudbury area lakes. Sudbury, Ontario: Laurentian University.
Wellborn GA, Cothran R, Bartholf S. 2005. Life history and allozyme diversification inregional ecomorphs of the Hyalella azteca (Crustacea: Amphipoda) speciescomplex. Biol J Linn Soc 84:161-175.
Wellborn G. 1994. Size-biased predation and prey life-histories - a comparative-study offresh-water amphipod populations. Ecology 75:2104-2117.
Wellborn GA and Capps E. 2013. Establishment of a new population by a single gravidcolonist: Implications for Hyalella biogeography and speciation. Evol Ecol 27:101-115.
Wellborn GA and Broughton RE. 2008. Diversification on an ecologically constrainedadaptive landscape. Mol Ecol 17:2927-2936.
a) Wesolek BE, Genrich EK, Gunn JM, Somers KM. 2010. Use of littoral benthicinvertebrates to assess factors affecting biological recovery of acid- and metal-damaged lakes. J N Am Benthol Soc 29:572-585.
b) Wesolek BE, Szkokan-Emilson EJ, Gunn JM. 2010. Assessment of littoral benthicinvertebrate communities at the land-water interface in lakes recovering from severeacid- and metal-damage. Hum Ecol Risk Assess 16:536-559.
Willis T and Magnuson J. 2000. Patterns in fish species composition across the interfacebetween streams and lakes. Can J Fish Aquat Sci 57:1042-1052.
Wilson HF and Xenopoulos MA. 2008. Effects of agricultural land use on thecomposition of fluvial dissolved OM. Nature Geoscience 2:37-41.

73
Winter JG, Keller W, Paterson AM, Yan ND. 2008. Three decades of recovery of thephytoplankton community in Clearwater Lake (Sudbury, Canada) from acid andmetal contamination. Verh. Internat. Verein. Limnol 30:247-252.
Witt J and Hebert P. 2000. Cryptic species diversity and evolution in the amphipod genusHyalella within central glaciated North America: A molecular phylogeneticapproach. Can J Fish Aquat Sci 57:687-698.
Yan ND and Dillon PJ. 1984. Experimental neutralization of lakes near Sudbury, Ontario.In: Environmental impacts of smelters. Nriagu JO, editor. New York: John Wiley &Sons, Inc. 417 p.
Yan N, Keller W, Somers K, Pawson T, Girard R. 1996. Recovery of crustaceanzooplankton communities from acid and metal contamination: Comparingmanipulated and reference lakes. Can J Fish Aquat Sci 53:1301-1327.
Yan ND, Girard R, Heneberry JH, Keller WB, Gunn JM, Dillon PJ, Grover J. 2004.Recovery of copepod, but not cladoceran, zooplankton from severe and chroniceffects of multiple stressors. Ecol Lett 7:452-460.
Zhang J, Hudson J, Neal R, Sereda J, Clair T, Turner M, Jeffries D, Dillon P, Molot L,Somers K, et al. 2010. Long-term patterns of dissolved organic carbon in lakesacross eastern Canada: Evidence of a pronounced climate effect. Limnol Oceanogr55:30-42.
Zsolnay A, Baigar E, Jimenez M, Steinweg B, Saccomandi F. 1999. Differentiating withfluorescence spectroscopy the sources of dissolved OM in soils subjected to drying.Chemosphere 38:45-50.
Zuur AF, Ieno EN, Elphick CS. 2010. A protocol for data exploration to avoid commonstatistical problems. Methods in Ecology and Evolution 1:3-14.
Zuur AF, Ieno EN, Walker NJ, Saveliev AA, Smith GM. 2009. Mixed effects models andextensions in ecology with R. Springer.
Zuur AF, Saveliev AA, Ieno EN. 2012. Zero inflated models and generalized linearmixed models with R. UK: Highland Statistics.

74
Appendix A
Sampling details for regional presence-absence survey
TABLE A1- Chemistry, netting samples, and presence-absence for the regional surveys.Available samples are shaded. For the 2012 survey, letters denote samples from surface(s), whole-lake (wl) or whole-lake, non-volumed weighted (wl, nv). For results, presenceis indicated by 1, absence by 0, and a dash indicates no sample
Lake Location Chemistry data Pres.-Abs. data ResultsLongitude Latitude 1990 2003 2012 1990 2003 2012 1990 2003 2012
Bennet -80.97208 46.45751 s 1 1 1Bethel -80.96198 46.47134 s 1 1 1Bibby -80.96955 46.36725 0 0 0Broder23 -80.95676 46.39693 s 0 0 0Brodill -80.93981 46.36882 s 0 0 0Camp -81.00137 46.38228 s 0 0 0Chief -81.01939 46.36145 s 0 0 0Clearwater -81.05049 46.37041 wl 0 0 0Crooked -81.03480 46.42101 s 0 0 0Crowley -80.98265 46.38436 s 0 0 0Daisy -80.88600 46.45168 wl,nv 0 0 1Dill -80.90170 46.38967 s 0 0 1Forest -80.99619 46.39233 s 0 0 0Grant -80.98468 46.41044 s 1 1 1Hannah -81.03831 46.44332 wl 0 1 1Hazen -80.98838 46.42718 0 -- 1Hidden -81.05575 46.37873 0 -- 0Honda -80.95247 46.38406 0 -- 0Johnny -81.03760 46.43080 s 0 1 1Kelly -81.06534 46.44582 1 1 1Laurentian -80.95582 46.44953 s 1 1 1Linton -80.98523 46.37511 s 0 0 0Little Raft -80.96871 46.40023 s 1 1 1Lohi -81.04332 46.38755 s 0 0 1Long -81.09715 46.36328 1 1 1McFarlane -80.95931 46.41731 s, 2011 1 1 1Middle -81.02488 46.43903 wl 0 1 1Minnow -80.95658 46.49250 1 1 1Nepawhin -80.98880 46.45839 wl,nv 1 1 1Perch -80.92797 46.44902 0 1 1Pine -81.02517 46.37607 s 0 0 0Raft -80.94536 46.40967 s 1 1 1Ramsey -80.95214 46.47661 wl,nv 1 1 1Richard -80.91521 46.43820 s 1 1 1Robinson -81.03029 46.45576 1 1 1Silver -81.01478 46.42889 wl,nv 0 0 1St.Charles -81.01653 46.44680 s 1 1 1Still -81.00151 46.44443 s 1 1 1Swan -81.06531 46.36593 s 0 -- 0Tilton -81.07210 46.35693 s 0 0 0Total 40 31 32 40 46 40 16 20 25

75
Appendix B
Elution efficiencies and diffusion coefficients for DGT calculations
TABLE B.1 - Elution efficiencies and diffusion coefficients used to calculate DGT-measured labile metal concentration. Elution efficiencies are based on using concentratednitric acid, and were all taken from Garmo et al. (2003). Diffusion coefficients were firsttaken from DGT Research Ltd. (2005) (*) and remaining metals were taken from Garmoet al. (2003) (†).
Element Elution Efficiency (%) Diffusion Coefficient@ 25 ºC (10-6 cm2 s-1)
Ag 98.4 14.11 †Al 94.7 4.75 *Ba 98.8 4.7 †Cd 98.7 6.09 *Ce 97.7 4.64 †Co 98.6 5.94 *Cr 93.7 5.05 *Cu 97.7 6.23 *Fe 80.8 6.11 *Ga 97.3 6.38 †Gd 97.5 7.49 †La 97.7 4.58 †Lu 97.8 4.97 †Mn 98.3 5.85 *Mo 93.9 1.37 †Nd 97.7 5.4 †Ni 93.5 5.77 *Pb 97.4 8.03 *Pr 97.6 5.75 †Sm 97.6 5.5 †Sr 97.4 4.85 †Tb 97.6 5.46 †U 96.2 4.22 †V 97.7 4.16 †Zn 96.3 6.08 *

76
Appendix C
Summary statistics and Wilcoxon tests for chemical variables in Daisy
Lake
TABLE C.1 – Summary statistics for littoral sites and results of a Wilcoxon Test testingfor chemical differences between the mid-lake and littoral samples. Mean, standarddeviation (SD), coefficient of variation (CV), range, the test statistic (V) and associatedp-value, and the sign of the difference between mid-lake (M) and littoral (L) samples arepresented.
Variabletype
Variable Mean SD CV Range Wilcoxon Test(V, p)
M:LDiff.
Metals(μg/L)
Al 3.93 1.35 0.34 2.82–7.51 56, 0.04 =Cd 0.04 0.02 0.45 0.03–0.08 2, 0.002 +Co 0.11 0.24 2.10 <DL–0.84 28, 0.02 =Cu 1.31 0.29 0.22 1.05–1.99 1, 0.002 +Mn 6.25 10.44 1.67 1.51–38.61 66, 0.001 –Ni 25 7.42 0.30 16.15–45.83 11, 0.05 =Pb 0.08 0.06 0.79 0.02–0.27 11, 0.05 =
Major ions (mg/L) Ca 4.66 1.12 0.24 3.46–6.83 11, 0.05 =Na 2.07 0.796 0.04 1.98–2.19 66, 0.001 –
Organic measures HIX 2.85 0.33 0.11 2.39–3.21 32, 0.97 =FI 1.38 0.10 0.07 1.20–1.48 58, 0.02 =β:α 0.72 0.07 0.09 0.62–0.79 57, 0.03 =
DOCestimate
1.86 0.39 0.21 1.24–2.30 60, 0.01 =

77
TABLE C.2 – Histograms of chemicals from Daisy Lake abundance models. Plotsinclude both subcatchment and lake sites. The mid-lake sample is denoted by the thickvertical dashed line.

78
Appendix D
GLMM modelling results from Daisy Lake study
This appendix includes modelling results from the Daisy Lake study. In all cases, the null
intercept-only models were run that include no predictors except for the intercept (mean)
and the ‘site’ random effect. Table captions describe the dataset and a brief description of
models run. Abbreviations for all tables are: model degrees of freedom (Df), Akaike’s
Information Criterion (AICc), AIC differences between the top and current model
(ΔAICc), Akaike weights (Aw), site variance component (σ2site), marginal and
conditional R2 ( 2c
2m R,R ).
TABLE D.1 –Macrophyte model including an additional chemical variable.
Model Predictors Df AICc ΔAICc Aw σ2site
1 Macro + Cd 5 295.21 0.00 0.19 2.01 0.28 0.682 Macro + Ni 5 295.65 0.43 0.15 2.12 0.26 0.663 Macro + Cu 5 295.89 0.68 0.13 2.14 0.24 0.674 Macro 4 296.26 1.04 0.11 2.76 0.16 0.745 Intercept 3 296.42 1.20 0.10 3.48 0.00 0.826 Macro + HIX 5 297.48 2.27 0.06 2.49 0.21 0.707 Macro + DOC estimate 5 298.09 2.88 0.04 2.60 0.16 0.708 Macro + Mn 5 298.45 3.24 0.04 2.71 0.16 0.739 Macro + rank u-score cobalt 5 298.52 3.31 0.04 2.74 0.16 0.77
10 Macro + FI 5 298.53 3.31 0.04 2.75 0.15 0.7211 Macro + Al 5 298.55 3.34 0.04 2.76 0.16 0.7412 Macro + Pb 5 298.57 3.35 0.03 2.75 0.15 0.7313 Macro + BA 5 298.61 3.39 0.03 2.78 0.15 0.70
2mR 2
cR

79
Models only including subcatchment sites:
TABLE D.2 – Macrophyte model including an additional chemical variable.
Model Predictors Df AICc ΔAICc Aw σ2site
1 Macro + FI 5 219.59 0.00 0.15 1.72 0.42 0.812 Macro + Ni 5 219.89 0.30 0.13 1.81 0.30 0.633 Macro 4 219.92 0.33 0.13 2.52 0.20 0.684 Intercept 3 220.11 0.53 0.12 3.49 0.00 0.835 Macro + Cd 5 220.60 1.02 0.09 1.97 0.27 0.636 Macro + Cu 5 221.07 1.49 0.07 2.11 0.24 0.637 Macro + BA 5 221.63 2.05 0.06 2.20 0.26 0.688 Macro + rank u-score cobalt 5 222.13 2.54 0.04 2.40 0.20 0.599 Macro + Mn 5 222.14 2.55 0.04 2.36 0.24 0.70
10 Macro + Pb 5 222.14 2.55 0.04 2.37 0.11 0.3211 Macro + DOC estimate 5 222.22 2.64 0.04 2.41 0.21 0.6812 Macro + HIX 5 222.24 2.65 0.04 2.43 0.22 0.6713 Macro + Al 5 222.45 2.87 0.04 2.52 0.20 0.68
TABLE D.3 – Landscape candidate models. Abbreviations are: Compound topographicwetness index (CTWI), impermeable/bare soils (Imp./BS) and tasseled captransformation wetness index (TCT WI).
Model Predictors Df AICc ΔAICc Aw σ2site
1 Area 4 218.25 0.00 0.39 1.78 0.42 0.832 Intercept 3 220.11 1.87 0.15 3.49 0.00 0.833 Medium CTWI x Imp./BS 6 220.32 2.08 0.14 1.20 0.52 0.804 TCT WI + TCT WI2
5 220.61 2.37 0.12 1.78 0.42 0.835 Low CTWI x Imp./BS 6 222.11 3.86 0.06 1.53 0.42 0.776 Area x Vegetation 6 222.48 4.23 0.05 1.71 0.39 0.807 Area x NDVI 6 222.67 4.42 0.04 1.74 0.39 0.808 Low CTWI + NDVI 5 223.97 5.73 0.02 2.90 0.13 0.829 High CTWI + NDVI 5 224.66 6.41 0.02 3.28 0.05 0.82
10 (Area x High CTWI) +(Area x Imp./BS) 8 227.04 8.80 0.00 1.36 0.49 0.80
2mR 2
cR
2mR 2
cR

80
Subcatchment area models:
TABLE D.4 – Area and macrophytes.
Model Predictors Df AICc ΔAICc Aw σ2site
1 Area 4 218.25 0.00 0.49 1.84 0.38 0.822 Area + Macro 5 219.11 0.86 0.32 1.49 0.41 0.733 Intercept 3 220.11 1.87 0.19 3.49 0.00 0.83
TABLE D.5 – Area including an additional chemical variable.Model Predictors Df AICc ΔAICc Aw σ2
site
1 Area + FI 5 211.62 0.00 0.80 0.43 0.76 0.882 Area + DOC estimate 5 216.92 5.30 0.06 1.06 0.61 0.833 Area + Al 5 217.78 6.16 0.04 1.13 0.56 0.814 Area 4 218.25 6.63 0.03 1.84 0.38 0.825 Intercept 3 220.11 8.49 0.01 3.49 0.00 0.836 Area + Ni 5 220.38 8.76 0.01 1.71 0.41 0.837 Area + HIX 5 220.51 8.89 0.01 1.78 0.39 0.838 Area + BA 5 220.54 8.92 0.01 1.81 0.38 0.829 Area + Mn 5 220.67 9.05 0.01 1.84 0.38 0.82
10 Area + Cd 5 220.68 9.06 0.01 1.80 0.39 0.8311 Area + Cu 5 220.72 9.11 0.01 1.83 0.38 0.8212 Area + rank u-score Co 5 220.73 9.11 0.01 1.84 0.37 0.7913 Area + Pb 5 220.77 9.15 0.01 1.85 0.40 0.86
TABLE D.6 – Best area candidate modelModel Predictors Df AICc ΔAICc Aw σ2
site
1 Area + FI 5 211.62 0.00 0.75 0.43 0.76 0.882 Area + Macro + FI 6 214.25 2.64 0.20 0.44 0.75 0.873 Area 4 218.25 6.63 0.03 1.84 0.38 0.824 Area + Macro 5 219.11 7.49 0.02 1.49 0.41 0.73
2mR 2
cR
2mR 2
cR
2mR 2
cR

81
Medium CTWI and impermeable/bare soils interaction models:
TABLE D.7 – Medium CTWI x impermeable/bare soils (Imp./BS) interaction andmacrophytes.
Model Predictors Df AICc ΔAICc Aw σ2site
1 (Medium CTWI x Imp./BS) +Macrophytes
6 219.25 0.00 0.46 1.01 0.52 0.70
2 Intercept 3 220.11 0.86 0.30 3.49 0.00 0.833 Medium CTWI x Imp./BS 5 220.61 1.37 0.23 1.78 0.42 0.83
TABLE D.8 – Medium CTWI x impermeable/bare soils (Imp./BS) interaction includingan additional chemical variable
Model Predictors Df AICc ΔAICc Aw σ2site
1 Intercept 3 220.11 0.00 0.17 3.49 0.00 0.832 (Medium CTWI + Imp./BS) 6 220.32 0.21 0.15 1.20 0.52 0.803 (Medium CTWI + Imp./BS) + Cd 7 220.55 0.44 0.14 0.89 0.58 0.784 (Medium CTWI + Imp./BS) + Cu 7 221.64 1.53 0.08 1.01 0.56 0.795 (Medium CTWI + Imp./BS) + Mn 7 221.67 1.56 0.08 1.03 0.57 0.816 (Medium CTWI + Imp./BS) + Ni 7 221.70 1.58 0.08 1.05 0.54 0.78
7(Medium CTWI + Imp./BS) +HIX 7 222.19 2.07 0.06 0.97 0.57 0.80
8(Medium CTWI + Imp./BS) +rank u-score Co 7 222.53 2.42 0.05 1.16 0.44 0.66
9 (Medium CTWI + Imp./BS) + Pb 7 222.93 2.82 0.04 1.21 0.60 0.9110 (Medium CTWI + Imp./BS) + BA 7 222.96 2.84 0.04 1.11 0.55 0.81
11(Medium CTWI + Imp./BS) +DOC estimate 7 223.07 2.96 0.04 1.20 0.52 0.80
12 (Medium CTWI + Imp./BS) + Al 7 223.13 3.01 0.04 1.21 0.52 0.8013 (Medium CTWI + Imp./BS) + FI 7 223.13 3.02 0.04 1.20 0.52 0.79
TABLE D.9 – Best CTWI x impermeable/bare soils (Imp./BS) interaction candidatemodel
Model Predictors Df AICc ΔAICc Aw σ2site
1 Medium CTWI x Imp./BS 6 220.32 0.00 0.45 1.20 0.52 0.802 (Medium CTWI x Imp./BS) + Cd 7 220.55 0.23 0.40 1.16 0.44 0.663 (Medium CTWI x Imp./BS) +
Macrophytes7 222.56 2.23 0.15 1.17 0.49 0.75
2mR 2
cR
2mR 2
cR
2mR 2
cR

82
TCT WI models:
TABLE D.10 – TCT WI and macrophytes.
Model Predictors Df AICc ΔAICc Aw σ2site
1 TCT WI + TCT WI2 + Macro 6 219.25 0.00 0.46 1.01 0.52 0.702 Intercept 3 220.11 0.86 0.30 3.49 0.00 0.833 TCT WI + TCT WI2
5 220.61 1.37 0.23 1.78 0.42 0.83
TABLE D.11 – TCT WI and an additional chemical variable.
Model Predictors Df AICc ΔAICc Aw σ2site
1 TCT WI + TCT WI2 + FI 6 217.96 0.00 0.41 0.78 0.67 0.882 Intercept 3 220.11 2.15 0.14 3.49 0.00 0.833 TCT WI + TCT WI2 5 220.61 2.66 0.11 1.78 0.42 0.834 TCT WI + TCT WI2 + BA 6 222.55 4.59 0.04 1.67 0.44 0.825 TCT WI + TCT WI2 + Al 6 222.70 4.74 0.04 1.65 0.44 0.826 TCT WI + TCT WI2 + HIX 6 222.72 4.76 0.04 1.64 0.44 0.837 TCT WI + TCT WI2 + Mn 6 222.80 4.84 0.04 1.68 0.44 0.81
8TCT WI + TCT WI2 + rank u-score Co 6 222.86 4.90 0.04 1.71 0.39 0.72
9 TCT WI + TCT WI2 + Pb 6 222.92 4.96 0.03 1.70 0.51 0.96
10TCT WI + TCT WI2 + DOCestimate 6 222.99 5.03 0.03 1.74 0.43 0.83
11 TCT WI + TCT WI2 + Ni 6 223.13 5.17 0.03 1.71 0.43 0.8312 TCT WI + TCT WI2 + Cd 6 223.26 5.30 0.03 1.76 0.42 0.8313 TCT WI + TCT WI2 + Cu 6 223.27 5.31 0.03 1.78 0.42 0.83
TABLE D.12 – TCT WI and an additional chemical variable
Model Predictors Df AICc ΔAICc Aw σ2site
1 TCT WI + TCT WI2 + FI 6 217.96 0.00 0.46 1.64 0.44 0.832 TCT WI + TCT WI2 +
Macrophytes 6 219.25 1.29 0.24 1.01 0.52 0.703 TCT WI + TCT WI2 +
Macrophytes + FI 7 219.96 2.00 0.17 0.74 0.64 0.824 TCT WI + TCT WI2
5 220.61 2.66 0.12 1.78 0.42 0.83
2mR 2
cR
2mR 2
cR
2mR 2
cR

83
TABLE D.13 – The best candidate model when comparing the best candidates of thelandscape models + additional variables.
Model Predictors Df AICc ΔAICc Aw σ2site
1 Area + FI 5 211.62 0.00 0.95 0.43 0.76 0.882 TCT WI + TCT WI2 + FI 6 217.96 6.34 0.04 0.78 0.67 0.883 Medium CTWI x Imp./BS 6 220.32 8.71 0.01 1.20 0.52 0.80
2mR 2
cR