thesis – main part › en › wp-content › uploa… · web view1. mathematical activity should...
TRANSCRIPT

Weizmann Institute of Science
Thesis חבור לשם קבלת התואר for the
degree
Doctorדוקטור לפילוסופיה of
Philosophy
By מאתMichal Tabachמיכל טבח
למידת ראשית האלגברה בסביבה עתירת מחשבLearning Beginning Algebra in
a Computer Intensive Environment (CIE)
Published papers format
AdvisorsמנחיםProf. Abraham Arcaviפרופ' אברהם הרכביDr. Rina Hershkowitz ד"ר רנה הרשקוביץ
2007August תמוז תשס"ז

Submittedמוגש למועצה המדעית של to the Scientific Council of the
Weizmannמכון ויצמן למדע Institute of Science
Rehovot, Israelרחובות, ישראל
2

Table of ContentsAcknowledgments 3Summary 4List of publications within this thesis 5
Chapter 1: Introduction 61.1 Personal Preface 61.2 Literature review 7 1.2.1 Learning beginning Algebra 7 1.2.2 Learning Algebra using computerized tools 10 1.2.3 Computer Intensive Environments (CIE) 13
Chapter 2: Research Design, Questions and Methods 152.1 Population, the course, and class management 152.2 Research questions 162.3 Research design and methodology 18
Chapter 3: Articles written within the dissertation 223.1 Pilot research 233.2 The working environment and students achievements 483.3 Design considerations in detail 953.4 In-depth analysis of students work in the CIE 1173.5 Long-term analysis 2273.6 Introspective analysis 260
Chapter 4: Answers to the research questions 2714.1 What kind of algebraic knowledge did students construct? 2714.2 How did students construct their algebraic knowledge in this
environment?273
4.3 In what ways did students use the computer in their work? 2744.4 How did individual students benefit from the computer use? 2754.5 What socio-mathematical norms evolved in this CIE, and how
are they related to learning?276
4.6 General Conclusion 278
Chapter 5: Discussion and Conclusions 2795.1 Generalizing and Delimiting Results - What Can be Learned
from this Work? 279
5.1.1 Learning beginning algebra in a partially computerized environment vs. a CIE
280
5.1.2 Learning beginning algebra in a non-computerized environment
280
5.1.3. Learning beginning algebra in a different computerized environment
281
5.1.4. Learning other mathematical topics in a computerized environment
281
5.2 Further research 282
Appendix 1: the post-test (assessment activity) and its statistical analysis 285
References 293
3

Acknowledgements
I would like to thank my dissertation supervisors, Rina Hershkowitz and Abraham
Arcavi, for their professional guidance and ongoing encouragement. I deeply
appreciate the long hours they have dedicated to discussing, interpreting, sharing and
sharpening ideas. Their multifaceted understandings of learning processes have much
contributed to this work. I thank them for reading and commenting on early drafts,
and for providing valuable feedback on my ideas.
I would like to express my thanks to Alex Friedlander of the Weizmann Institute of
Science, who served as an advisor to the mathematics department at the experimental
school in which this study was conducted, for his professional contribution and
support both as a designer and a researcher. I would also like to thank my dissertation
committee, Bat-Sheva Eylon, Tommy Dreyfus and the late Prof. Lee Segel for their
thought provoking and stimulating ideas.
I would like to thank students from the two experimental classrooms, who have
managed to act naturally despite the fact that their work was being recorded. I would
especially like to thank my colleagues at school, Ariel Lifshitz and Hana Stein, for
being a supportive community, offering their time and assistance and always willing
to discuss my work and hear my reflections. I also thank the principal of the school,
Sara Koch, who willingly offered me all the help a school can provide.
During the past years, I had many opportunities to discuss parts of my work with
colleagues from the Science Teaching Department at the Weizmann Institute of
Science. These discussions helped me shape the ideas expressed in this work, which I
hope would be helpful and thought provoking for others as well. The supportive
environment and the technical support provided by the department had enabled me to
work in the best possible conditions.
Lastly, I would like to thank my family, my husband Shaul, and my children Omer,
Yael and Roi, who understood how important this work was for me, and encouraged
me to carry it on, giving me the confidence that accomplishing this work's goal lies
within my reach.
I am thankful for the friendly and supportive attitude of everyone who was involved
in this important period of my professional life.
4

Summary
The goal of this dissertation is to advance our understanding of the learning and
teaching of beginning algebra in a Computer Intensive Environment (CIE). A pilot
study, consisting of an in-depth analysis of how a pair of 7th grade students
constructed their knowledge over time, suggested the potential advantages of learning
in CIE. which has the following characteristics: (1) computerized tools are available at
all times both at school and at home, and (2) students are free to choose if, when, and
how to use the tools, in order to work with (3) carefully designed learning materials.
The main body of this dissertation consists of scholarly papers describing the
following:
the design and implementation of the innovative environment,
the research questions chosen to pursue,
the research qualitative methodology (with quantitative aspects),
the findings that document and analyze students' learning processes and outcomes
including achievements (and comparisons to two kinds of control groups),
instrumental genesis processes, and classroom socio-mathematical norms), and
a discussion of the main findings, their generalizability, limitations, and questions
for further research.
Overall, it was found that students meaningfully learned (1) content (they
outperformed the average student on a national exam), (2) learning skills (posing
conjectures, choosing strategies, representing situations, organizing data, monitoring
solution processes, and reflecting), (3) different ways to support their own progress by
harnessing the characteristics of a computerized tool (from which they could wean
themselves by the end of the year), and the context of inquiry, and (4) to respectfully
discuss mathematical ideas with peers and to generate mathematical questions for
themselves. Students' transition from arithmetic to algebra was gradual, and was at an
individual pace.
The work presented here is organized in five chapters. The first chapter includes an
introduction and a literature review. The second chapter includes design,
methodology, and research questions. The third section consists of the papers. The
fourth chapter summarizes (from the different papers) the answers to the research
5

questions. The fifth chapter presents the discussion, conclusions, and the theoretical
and practical implications of the study.
List of publications within this thesis
Paper #1 Tabach, M., Hershkowitz, R. & Schwarz, B. (2006). Constructing and consolidating of algebraic knowledge within dyadic processes: A Case study. Educational Studies in Mathematics, 63(3), 235-258.
Paper #2 Tabach M., Hershkowitz, R., Arcavi, A. & Dreyfus, T. (In press). Computerized environments in mathematics classrooms: A research - design view. To appear in L. D. English (Ed.), Handbook for International Research in Mathematics Education, 2nd edition. Mahwah, New Jersey: Lawrence Erlbaum.
Paper #3 Tabach, M. & Friedlander, A. (In press). The role of context in learning beginning algebra. To appear in C. Greenes (Ed.), Algebra and Algebraic Thinking in School Mathematics, Seventieth NCTM Yearbook (2008).
Paper #4 Tabach, M. & Friedlander, A. (2004). Levels of student responses in a spreadsheet-based environment. In M. J. Hoines, & A. B. Fuglestad (Eds.), Proceedings of the 28th Conference of the International Group for the Psychology of Mathematics Education (Vol. 2, pp. 423-430). Bergen, Norway: PME.
Paper #5 Tabach, M. Hershkowitz, R. & Arcavi, A. (Under revision). Learning beginning algebra with spreadsheets in a computer intensive environment. Submitted to Journal of Mathematical Behavior.
Paper #6 Tabach M. & Friedlander, A. (Under revision). Understanding equivalence of algebraic expressions in a spreadsheet-based environment. Submitted to International Journal of Computers in Mathematics Education.
Paper #7 Tabach, M. & Friedlander, A. (2006). Solving equations in a spreadsheet environment. In C. Hoyles, J. B. Lagrange, L. H. Son & N. Sinclair (Eds.). Proceedings of the 17th ICMI Study Conference "Technology Revisited" (pp. 539-545). Hanoi, Vietnam: Hanoi University of Technology. (CD-ROM).
Paper #8 Tabach, M. Arcavi, A. & Hershkowitz, R. (Submitted). Development of symbolic representations in a computer intensive environment for learning algebra. Submitted to Educational Studies in Mathematics.
Paper #9 Tabach, M. (2006). Research and teaching – Can one person do both? A case study. In J. Novotna, H. Moraova, M. Kratka and N. Stehlikova (Eds.), Proceedings of the 30th Conference of the International Group for the Psychology of Mathematics Education (Vol. 5, pp. 233-240). Prague, Czech Republic: PME.
6

Chapter 1: Introduction1.1 Personal Preface
This study is rooted in my three fields of experience within mathematics education:
classroom teaching, design and implementation of innovative learning materials, and
classroom research.
As a 7th grade algebra teacher for ten years, I experienced: (a) the barriers most
students had to overcome in the transition from arithmetic to algebra, (b) the ways in
which a teacher may attempt to help students to overcome those barriers, (c) the
potential of computerized environments as a powerful aid to students and teachers,
and (d) the collective wisdom of a strong school team of reflective mathematics
teachers (of whom I was a member) who support each other in both the incorporation
of innovations and in coping with the day-to-day work.
Being also part of a team of designers for nine years made me aware of the
complexities and challenges involved in creating a coherent conglomerate of tasks and
assignments – a curriculum that should meet the requirements of the official syllabus
and, at the same time, support the meaningful learning of algebra by making use of
the potential power of computerized tools. The design process involved explicit
hidden beliefs and assumptions and was exposed to and took advantage of a wide
range of diverse experiences (within the designer's team) and of the knowledge
accumulated from research on the nature of learning.
Being a researcher for about 5 years enabled me to become familiar with learning
theories, research methods, and findings from the research literature in mathematics
education. My own investigations (Friedlander & Tabach, 2001a; Friedlander &
Tabach, 2001b; Tabach, 1999; Tabach & Hershkowitz 2002; Tabach, Hershkowitz &
Schwarz, 2001) provided me with good opportunities to gain theoretical and practical
wisdom related to research in our field.
These three sources of experience, teaching, design, and research were closely
interwoven and fed into each other. As a teacher, I piloted innovative learning
materials developed within the team of designers. After piloting the materials, I could
provide feedback to the team of designers (and to the designer in me) on the
appropriateness of the tasks (and their sequencing) to students’ learning processes and
to classroom realities. As a participant in the ongoing research that accompanied the
7
trials, I experienced observations with a researcher's eye, utilized data analysis, and I
even initiated and led research studies. The outcomes of the research were the basis
of the ongoing cycle of design-implementation-research-redesign, which also guided
my teaching practice in many ways.
The decision to focus my dissertation on students' transition from arithmetic to
algebra (at 7th grade) was a most natural consequence of the three roles I had played
before starting my doctorate. A pilot study tracing the learning of a pair of students
working in a partially computerized environment over six months showed promising
results on how students' uses of representations, and in particular, symbolic
generalizations evolved in interesting ways. Of special interest was the way students
took advantage of the partial availability of computerized tools and the freedom to
choose in the computer lessons, if, when, and how to use them in order to make sense
of what they were learning. From the findings, which were in agreement with
findings from other researchers all over the world, a new research question emerged:
how would the full availability of computerized tools at all times (both in class and at
home) and the freedom to choose if/when/how to use them affect the learning of
beginning algebra, given the gaps and difficulties inherent in the transition from
arithmetic to algebra? More specifically, what kind of algebraic-knowledge did
students construct? How did students construct their algebraic knowledge in this
environment? In what ways did students use the computer in their work? How did
different individual students benefit from the computer use? What socio-mathematical
norms evolved from this CIE, and how are they related to learning mathematics?
The goal of my dissertation was to provide answers to these questions, building on the
three interrelated perspectives that shaped my previous experiences and on the
collective wisdom that has already accumulated all over the world, as reported in the
professional literature.
1.2 Literature Review
This literature review is organized around three main themes: learning beginning
algebra, learning algebra with computerized tools, and learning mathematics in
computer-intensive environments (CIE).
1.2.1 Learning Beginning Algebra
8

In many countries students are introduced to algebra after six years of learning
arithmetic, basic geometry (and possibly some data handling) at elementary school.
The shift from arithmetic to algebra requires abandoning many of the views and
practices so deeply rooted in teaching arithmetic and to learn and apply the syntactic
rules to handle symbolic expressions. For example, in arithmetic the equal sign is
usually regarded as an invitation to calculate (e.g., 3 + 2 = means “add up the
numbers and write the sum in the right-hand side of the equal sign”, whereas in
algebra an expression such as a + 3 remains as is and no calculation is possible unless
a value for a is substituted). In algebra, the equal sign has other meanings that are new
to students, for example, equivalence between the two hand sides (a + b = b + a,
a(b+c) = ab + ac) or a definition (the right-hand side defines what is in the left-hand
side, as in f(x)=3x). Learning and getting used to these new meanings is problematic
for many students (e.g., Knuth et al., 2006). The phenomenon that students experience
when confronted with the many shifts in perspective occurring in the transition from
arithmetic to algebra was characterized as a “didactical cut” (e.g., Ainley, 1996;
Rojano, 2002; Sutherland & Rojano, 1993) that needs to be understood and attended
to.
Different approaches to algebra learning were proposed in order to meaningfully
bridge the gap between arithmetic and algebra. Such approaches include
“generalization of numerical and geometric patterns and of the laws governing
numerical relations, problem solving, equation solving aided by the use of concrete
models, introduction of functional situations, and the modeling of physical and
mathematical phenomena” (Bednarz et al., 1996, p.3).
One approach to help students bridge the gap consists of context-based learning.
Coping with realistic problem situations that are prone to mathematization (e.g.,
Gravemeijer & Doorman, 1999) becomes the starting point and the main process for
understanding the main ideas of algebra (generalizing, solving equations) and for
learning to operate symbolically. "Context is paramount to the construction of
meaning the whole way through. It is the backdrop against which the parts have to
make sense" (Bickmore-Brand, cited by Wiest, 2001, p. 75). Context-based
approaches have the following characteristics:
9

They facilitate learning by providing real or concrete meanings to abstract ideas or
operations (e.g., Heid et al., 1995) and provide legitimization to bring to bear out-of-
school knowledge and common sense;
They provide points of reference and anchors against which students can rely at any
stage of their work as a way to monitor their progress and understandings;
They may enhance motivation and engagement;
They emphasize the potential and power of algebra to model, understand, and solve
problems from other fields of knowledge.
“In order to have clear, confident and automatic mastery of any skill, it is necessary
to practice, but the wish to practice will arise naturally from stimulating contexts”
(Mason et al., 1985, p. 36).
The potential of a context-based approach for learning algebra and in its
implementation is discussed at length in Paper 3 of this dissertation. In particular, the
paper analyzes the role of variables and expressions as representations of meaningful
phenomena of change, the difference between changing versus constant quantities
within the phenomena, the lack of closure of algebraic expressions (e.g., 2x + 3 does
not add up to 5x), and the equivalence of algebraic expressions.
School algebra and algebraic activity can be characterized as consisting of three main
interrelated components: (1) generational activities that involve forming expressions
and equations arising from quantitative problem situations, geometric patterns, and
numerical sequences or relationships; (2) transformational activities that include
mainly changing the form of expressions and equations in order to maintain
equivalence; and (3) global/meta-level activities, such as problem solving, predicting,
modeling, generalizing, and justifying – for which algebra is used as a tool (Kieran,
2004). Kieran also points out that because of the modern math movement, the
advancement of cognitive research and the emergence of technological tools, the
dominant trend in the teaching and learning of algebra shifted from an earlier
emphasis on transformational work to a more recent focus on the domains of
generational and global/meta-level activities. However, on the basis of studies on the
use of CAS in school algebra (e.g., Lagrange et al., 2003), Kieran notes that "the
emphasis on conceptual work was not producing neither a clear lightening of the
technical aspects of work nor a definite enhancement of students' conceptual
10

reflection" (p. 28). Finally, Kieran concludes her review of the state of learning and
teaching school algebra as follows:
“Findings from this growing body of research encourage us to think of
techniques and conceptual understanding as an interrelation rather than in
opposition to each other. … We now find ourselves faced with evidence
that the transformational activity in algebra can serve as a site for meaning
making, that is, that techniques can have an epistemic dimension.” (p. 30)
Similarly, Star (2005; 2007) claims that procedural knowledge has two qualitative
dimensions: the superficial common use of procedural knowledge, and a more in-
depth way of using it. This second dimension is usually neglected.
One of the foci of this dissertation is to study how a spreadsheet-based environment
may enhance 7th grade students' conceptual understanding of (a) algebraic
transformations (see paper 6, this dissertation) and (b) the concept of equation and
related issues (see paper 7, this dissertation).
1.2.2 Learning Algebra using Computerized Tools
The advent of computers turned the attention of many researchers to the potential of
technological tools to support students' transition from arithmetic to algebra. In the
last two decades, several Algebra projects based on the partial use of different kinds
of computerized tools were developed, implemented, and studied (e.g., Dettori et al.,
2001; Haspekian 2005; Hershkowitz et al., 2002; Kieran, 1992; Wilson et al., 2005;
Yerushalmy & Schwartz, 1993). These studies are not fully convergent regarding their
conclusions.
Some studies emphasize the contribution of computerized tools to the learning of
algebra, and their potential to address not only the syntactic aspects but also to focus
on understanding, on symbolic generalization, on mathematical modeling, and on the
development of symbol sense (as defined by Arcavi, 1994). Such aspects of algebra
can be learned by making use of the dynamic capabilities of the graphical, numerical,
and symbolic representations of computerized environments. Or, as Kaput (1992)
states, a display notation system in a pencil and paper environment becomes an
action notation system in computerized environments. Graphical, numerical, and
symbolic representations can be used in parallel or can be chosen by the users
according to their needs and/or personal preferences. Changing representations can be
11

observed, initiated, and reflected upon, and hence become the source of
investigations and insight. Researchers and educators suggest using various models of
learning environments, which widen and enrich the scope of learning processes for
students having differing mathematical abilities. Technological tools were recognized
as a particularly effective means to achieve this purpose (see for example, Balacheff
& Kaput, 1996).
Use of computerized environments in algebra may also enable students to amplify
their capabilities and for educators to significantly change the nature of mathematical
activity itself (Pea, 1985). Explorations with computerized tools encourage students
to plan, reflect, explain, and engage in classroom discussions (Heid, 1995).
The availability of computers in schools and their incorporation into instruction have
led to new approaches in teaching algebra. In particular, the functional approach
(exploring changing phenomena that can be represented numerically, verbally,
symbolically or graphically) became popular (e.g., Heid, 1995; Hershkowitz et al.,
2002; Radford, 2000; Yerushalmy and Schwartz, 1993). It was claimed that a
functional approach enables students to face and deal with different kinds of
changing phenomena and provides them with opportunities for generalization and
modeling within several representations (e.g., Bednarz et al., 1996; Yerushalmy,
2005).
Appropriate and successful uses of technological tools in beginning algebra have
been described, for example: explorations of every-day life problem situations using
several representations (e.g. Heid, 1995), numerical experimentation that evolves into
functional connections (e.g., Kieran, 1992), and manipulations of symbolic and
graphical representation of functions (e.g., Yerushalmy & Schwartz, 1993).
Other studies end up questioning the benefits of introducing technologies into the
algebra classroom. For example, Hershkowitz and Kieran (2001) are concerned with
the kind of mathematics with which students engage in a computerized environment.
Yerushalmy (2005) claims that in a computerized environment students' difficulties
may shift from one issue to another.
Hershkowitz et al. (2002) defined three criteria that computerized tools should fulfill
in order to become suitable for classroom learning and teaching: (i) The extent to
which a tool supports the generation of mathematical generalizations. Spreadsheets
12
have the potential to support the natural and spontaneous creation of numerical series
by means of certain kinds of algebraic rules, and to represent numerical data
graphically. (ii) The extent to which a tool creates opportunities to engage naturally
in mathematization (in the sense of Treffers, 1987; see also, van Reeuwijk, 1995).
Spreadsheets have potential for students in their development of mathematical
processes, by proposing patterns and expressing them via formulas and using the
"dragging" option (e.g., Kaput, 1992). (iii) The extent to which the tool affords and
supports communication.
Several curricula and research projects adopted spreadsheets as a tool for learning
algebra on a wide variety of uses -- both at the stage of beginning algebra (e.g.,
Ainley, 1996; Friedlander & Tabach, 2001b; Haspekian, 2005; Sutherland & Rojano,
1993; Tabach et al., in press; Wilson et al., 2005) and at more advanced levels (e.g.,
Dugdale, 1994; Sutherland and Rojano, 1993). Thus, the characteristics of
spreadsheets make it a sound candidate for bridging between arithmetic and algebra
(Haspekian, 2005; Wilson, 2005), transforming the "didactical cut" from a rapid
arbitrary transition from numbers to symbols into a less demanding task.
The use of spreadsheets in learning beginning algebra is at the core of this
dissertation: in papers 1, 4, 5, 6, 7 and 8 (this dissertation) I describe, analyze, and
discuss at length the technical, mathematical, pedagogical, and cognitive implications
of spreadsheets and the empirical results that confirm or challenge those implications.
In my analyses, I also rely on the powerful construct of instrumental genesis, which
helped me characterize aspects of students’ learning in a computerized environment.
Instrumental genesis is a theoretical construct (Verillon & Rabardel, 1995) proposed
on the basis of empirical findings, adopted by researchers in mathematics education,
to describe diversity of strategies to solve the same task using the same tools, within
the same classroom (e.g., Artigue, 2002; Mariotti, 2002). When students begin to use
computerized tools, they construct an image of what the tool can and/or should do for
them. This image is strongly related to their initial experiences, beliefs, the perceived
nature and goals of the activities to be performed, dialogs with peers, and results of
spontaneous explorations and serendipitous discoveries, especially when the initiative
to use the tool (or not use it) is left to students and their needs. In the words of
Verillon & Rabardel (1995), a tool in the hands of a user together with the image the
user has developed (and continues to develop) of it, becomes an instrument.
13
Instruments are actively constructed over time by individuals as they use the tool and
become more acquainted with it, and also upon their needs. Therefore, an instrument
might vary from one individual to another even if they work on the “same” task and
with the same tool. Verillon & Rabardel (1995) defined instrumental genesis as the
process of an individual creating and changing the image of a tool during the
performance of different tasks.
Whole-class discussions, orchestrated by the teacher, can serve as an appropriate
forum to talk about and share students’ personal instrumental genesis processes in
order to further enhance them. Thus, instrumental genesis involves not only cognitive
processes, which change the nature of the mathematics learned and re-position the
difficulties thereof, they also involve socio-cultural processes concerning both
individuals and whole classrooms, which change the dynamics of learning and
teaching (Lagrange et al., 2003; Laborde, 2003).
1.2.3 Computer-Intensive Environments
In the last decade, there has been a growing interest in learning environments in which
computers are available to students and teachers at all times. Studies on these
environments usually focus on outcomes, showing advantages and gains, such as
improvement of reading and writing skills, better organization of written work as a
whole (especially argumentation capabilities), improvement of self-esteem,
involvement, etc. (Rockman et al., 1997, 1998, 1999; Gardner et al., 1993). Although
there are reports of partial uses of computers in mathematics classrooms or labs, there
are almost no reports on the teaching of mathematics in a CIE, where computer tools
are available at all times. One notable exception is the experimental setting that takes
place in a kind of CIE, as described in Shternberg & Yerushalmy (2003). Moreover,
often students who have had experience in a general CIE report that mathematics is
the subject in which computer use is the lowest (Rockman et al., 1998), and that
problem solving usually takes place with pencil and paper only, even when the
computer is fully available (Rockman et al., 1997). Lewis (2005) reports on some of
the problems that she, as a mathematics teacher, faced when coming to implement a
CIE in her class in the absence of suitable learning materials. The scarcity of reports
on learning mathematics in CIE is in sharp contrast with the growing body of research
14

on teaching and learning mathematics in computerized environments where computer
use is partial (when it is used in a lesson or a sequence of several lessons).
Considering the potential described separately regarding research on learning
mathematics with partial use of computers and the use of CIE in general education,
this dissertation addresses the issue of helping beginning algebra students to enter the
world of algebra and algebraic thinking, by providing a CIE in a mathematics class.
One immediate concern relates to learning materials, which will foster learning in
such environment. The next section addresses these issues.
15

Chapter 2: Research Design, Research Questions and
Methods
2.1 Population, the Course, and Class Management. This study is a classroom research, conducted during two consecutive school years
(2003-2004, and 2004-2005). In both classes, I served in the dual role of teacher and
researcher (for a discussion of the confluent and conflicting aspects of these two roles,
see paper 9, this dissertation). The study consists of two related main parts: the first
analyzes outcomes (students' achievements), and the second analyzes processes and
their resulting outcomes (learning, instrumental genesis, and the classroom socio-
mathematical norms).
Population
Both experimental groups participated in the two parts. Two kinds of comparison
groups were involved in some parts of this research, mainly in the first part.
Experimental groups: two different 7th grade classes (26 students in each cohort)
learned a beginning algebra courses in a CIE. Students in the experimental school
were randomly assigned to these classes.
The first comparison group: each year the other two parallel 7 th grade classes in the
same school served as comparison groups, 4 comparison classes all together (51
students each year, for a total of 102 students in 4 comparison classes).
The second comparison group: half of the student population in the whole country
(who took the official nationwide achievement test called Meitzav).
The Course
The learning materials were especially developed as an adaptation (to the spirit of this
CIE) from a beginning algebra course for 7th grade students designed for partially
computerized environments (the CompuMath project, see Hershkowitz at el., 2002).
The course includes a series of problem situations designed on the basis of a
functional approach to algebra in which syntactic algebraic skills are integrated into
and are at the service of the mathematical activity related to these problems. Students
are required to generalize symbolically from a real-world phenomena presented in the
problem situations (for sample activities, see Papers 1, 3-8).
16

The experimental classes learned from the adapted materials, whereas the first
comparison groups learned from the original CompuMath materials. The second
comparison group learned from various textbooks, mostly traditional.
Class Management
In the experimental groups, the lessons throughout the school year had a more or less
uniform format: at the beginning of each 90-minute-long class period, the teacher
presented frontally a problem situation followed by a short class discussion to ensure
that the terms of the problem are understood. During the main part of the lesson,
students worked with the problem in pairs, and the teacher acted as a moderator.
Finally, a whole-class discussion led by the teacher was conducted. The functioning
of the class is described in detail in paper 2 (this dissertation).
2. 2 - Research Questions
The general question addressed in this study is: In what ways does the CIE shape
cognitive and socio-cultural aspects of learning beginning algebra in 7th grade? This
general question includes the following sub-questions:
1. What kind of algebraic-knowledge did students construct?
In fact, this sub question can be divided into two parts:
1a. Was the knowledge of students in the experimental group similar to the
knowledge of other students from the same age group?
Since the study took place during a year-long algebra course, the procedural
mathematical knowledge of the students by the end of the year should be
comparable to the knowledge of 7th grade students in regular classes as
required by the Ministry of Education.
1b. Did students in the experimental group construct additional knowledge?
In addition, students in the CIE were expected to gain knowledge and
experience on posing hypotheses and verifying / rejecting them, moving
among representations, as well as generalizing and creating symbolic
expressions for the generalizations.
2. How did students construct their algebraic knowledge in this environment?
17

An in-depth analysis was conducted in order to describe and understand the ways
in which students construct their knowledge in this CIE.
3. In what ways did students use the computer in their work?
While working with a computer, students create for themselves an image of the
possible uses of the tool. These images of the tool, called instruments, may be
different for different individuals and develop as students become more
experienced with the tool. A main issue of this study is to analyze the instrumental
genesis in relation to the learning of algebra in this environment.
4. How did different individual students benefit from the use of computers?
The CIE provided the opportunity to use technology, but did not impose its use on
students. Moreover, when students chose to use the computerized tool, they could
apply several strategies, at various levels of sophistication. Therefore, students'
choice to work with technology may reflect personal preferences, learning styles,
as well as algebraic knowledge and several levels of acquaintance with the
possible uses of the tools.
5. What socio-mathematical norms are evolved in this CIE, and how are they related
to learning mathematics?
A new environment enables new ways of classroom work; therefore, new
classroom norms may emerge. Some of them are related specifically to
mathematics learning – socio-mathematical norms. In this study these norms and
their relations to learning were explored in relation to the learning of algebra with
computerized tools.
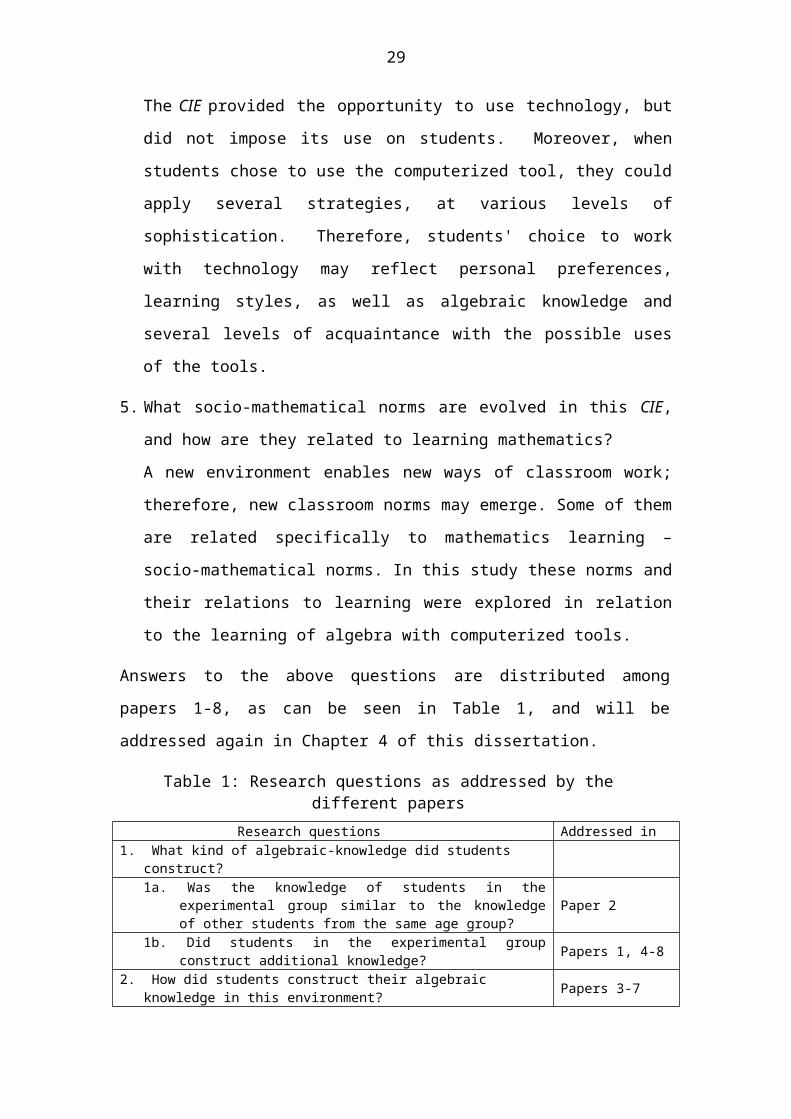
Answers to the above questions are distributed among papers 1-8, as can be seen in
Table 1, and will be addressed again in Chapter 4 of this dissertation.
Table 1: Research questions as addressed by the different papersResearch questions Addressed in
1. What kind of algebraic-knowledge did students construct?1a. Was the knowledge of students in the experimental group similar to the
knowledge of other students from the same age group? Paper 2
1b. Did students in the experimental group construct additional knowledge? Papers 1, 4-8
2. How did students construct their algebraic knowledge in this environment? Papers 3-73. In what ways did students use the computer in their work? Papers 1, 4-6, 84. How did different individual students benefit from the use of computers? Papers 2, 55. What socio-mathematical norms evolved in this CIE, and how are they
related to learning? Papers 1, 2, 4-8
18

2.3 – Research Design and Methodology
The following is a description of the two parts of this study.
I. Achievements (Part of research question 1)
Research Tools:
Pre- and post-tests were administered to students from both the experimental and the
first control groups, before and after the algebra year-long course. Test items which
aimed to check procedural knowledge were traditional in nature.
The national test (prepared and analyzed by the Ministry of Education) was
distributed to half of the 7th graders nationwide. Students' achievements were used
as a measure for comparing the achievements of the experimental group with the
second control group on a national scale.
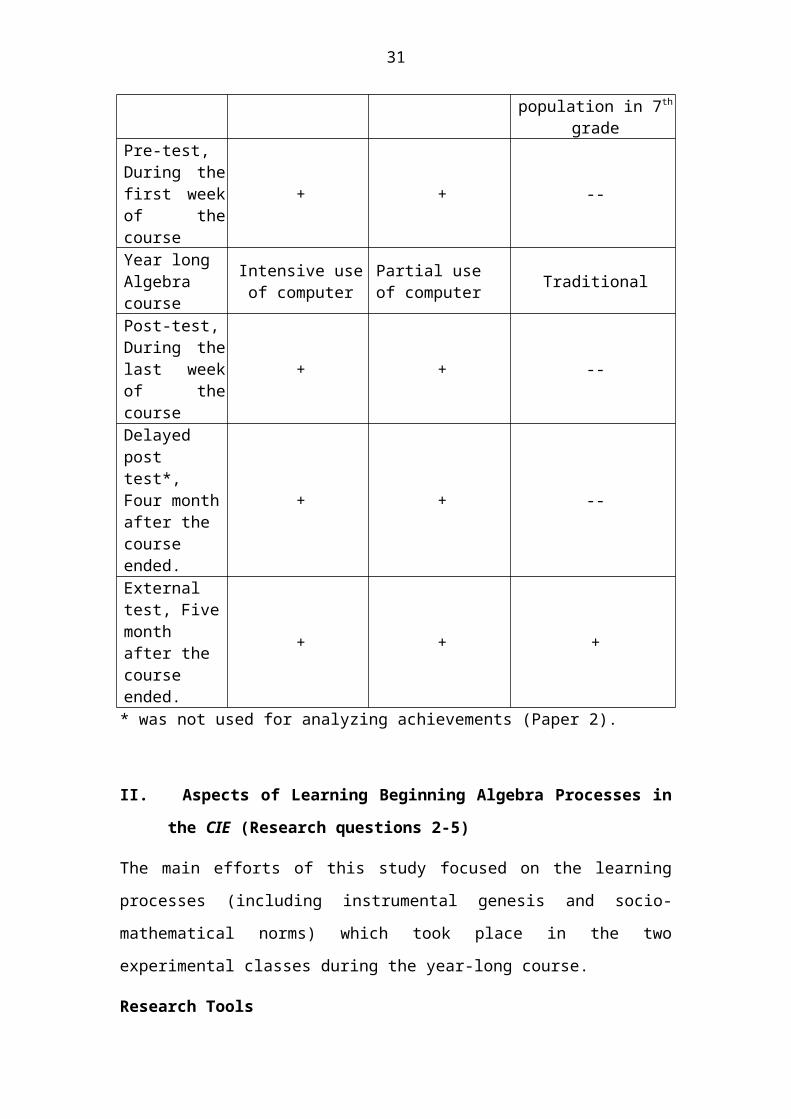
Table 2 summarized the various tests which were analyzed.
Table 2: Quantitative components of the study Groups Experimental group
N = 52First Control group
N = 102Second Control group
Half the national population in 7th grade
Pre-test, During the first week of the course
+ + --
Year long Algebra course
Intensive use of computer
Partial use of computer Traditional
Post-test, During the last week of the course
+ + --
Delayed post test*, Four month after the course ended.
+ + --
External test, Five month after the course ended.
+ + +
* was not used for analyzing achievements (Paper 2).
19

II. Aspects of Learning Beginning Algebra Processes in the CIE (Research
questions 2-5)
The main efforts of this study focused on the learning processes (including
instrumental genesis and socio-mathematical norms) which took place in the two
experimental classes during the year-long course.
Research Tools
Many tools were used to document classroom learning processes:
The work of five randomly selected pairs of students was audio-taped in each
algebra lesson. In a few lessons, the work of an additional pair was videotaped.
All working files that students saved in their computers were collected.
Written works and assessment tasks of all students were collected.
A detailed teacher diary was written including a description of each lesson plan, its
goals, the expected lesson flow and the expected difficulties (prepared before the
lesson took place). Immediately after each lesson, the teacher wrote a report on the
classroom events, including reflection on the lesson as a whole against the
background of the expectations, and a description of the difficulties, surprises, and
ways of using the computerized tools.
In a small number of lessons, a guest observer was present, and her field notes were
collected as well.
Table 3 presents the data sources and methodologies related to each paper, and their
connection to the research questions.
20

Table 3: Data sources and methodologies related to the research questions
Paper Research questions
Data sources Methodology
1 (pilot study)
1, 3, 5 Video recordings of the work of one pair of students in three assignments administered over a six-month period
Analysis of transcripts concerning the construction of knowledge using the RBC + C modelQualitative analysis of students’ interactions and student-teacher interactions using arrow-flow charts
2 1, 4, 5 Pre- and post-tests (experimental & first control groups)National test (experimental & second control groups)Delayed post-test (4 months after the end of the course, experimental and first control groups)
Quantitative analysis of students' achievements (t-test) Qualitative/quantitative analysis of students’ creativity in designing worksheets
3 2 Students’ work on one assignment (Toothpick Towers).Field notes
Epistemic and pedagogic analyses of the subject matter and activity structures
4 1-3, 5 Audio recordings of five pairs of students working on one assignment (Growing Rectangles)Working files of the first experimental group
Analyses of transcripts focusing on students' hypotheses and their actions to verify / reject them Qualitative/quantitative analyses of students’ data organization strategies and symbolic generalizations
5 1-5 Students’ work on one assignment (Buying a Walkie-Talkie)Audio recordings of the work of ten pairs of studentsVideo recording of one pair of studentsWorking files of all the students in the experimental groupVideo recording of a whole class discussion during a lesson summary (first experimental group)
Analyses of transcripts focusing on students' strategies to generate explicit symbolic generalizations, data organization, levels of symbolic representations, and processes of instrumental genesisQualitative/quantitative analyses of students' working-files to identify data organization, levels of symbolic generalization and uses of representations
Qualitative analysis of a whole class discussion to identify working habits and socio-mathematical norms
21

6 1- 3, 5 Students’ work on one assignment (Identical Columns)Audio recording of the work of four pairs of studentsSaved files of the experimental and first control groupsWritten work of the experimental and first control groups on the given assignmentAssessment tasks of the experimental and first control groups
Analyses of transcripts focusing on students' working strategies in a transformational activityQualitative/quantitative analyses of students' working files to validate working strategies identified in the recorded work of the pairsQualitative/quantitative analyses of students' assessment sheets to validate working strategies identified in the recorded work of the pairs
7 1, 2, 5 Students’ work on one assignment (Elections)Audio recordings of the work of ten pairs of studentsWorking files of the experimental group
Analyses of transcripts to identify students' working strategies with the TRUE / FALSE option of the spreadsheets ("solving" equations), and the interpretation students gave to the feedback receivedQualitative/quantitative analyses of students' working files to validate the working strategies identified in the recorded work of the pairs
8 1, 3, 5 Students’ work on nine assignmentsWorking files of the experimental group on the assignments
Qualitative/quantitative analysis of symbolic expressions used by all students in their files in all the assignments
9 Detailed diary written by the teacher Introspective/reflective analysis regarding the dual role of teacher and researcher
22
Chapter 3: Articles Written within the Dissertation and their
Role
The whole study and the data analyzed in light of the research questions are presented
in the following papers:
Pilot study (Paper 1).
A description of the design principles of the CIE, its development, and
implementation (Paper 2).
Epistemic and pedagogic considerations of the design of the learning materials
(Paper 3).
Analysis of students processes of posing hypotheses and verifying / rejecting them
(Paper 4).
Learning algebra in the CIE and the instrumentation processes (Paper 5).
Learning symbolic manipulation in a spreadsheet-based environment (Paper 6).
Conceptual understanding of the concept of the equation (Paper 7).
Development of students’ understandings and uses of symbolic representations
throughout the school year (Paper 8).
An introspective analysis of the complexities of the dual role of teacher-researcher
(Paper 9).
Next, each of the papers is presented, preceded by a synopsis.
23

3.1 – The pilot research
Tabach, M., Hershkowitz, R. & Schwarz, B. (2006). Constructing and consolidating
of algebraic knowledge within dyadic processes: A Case study. Educational
Studies in Mathematics, 63(3), 235-258.
This paper describes a pilot study that inspires the research described in this
dissertation. The pilot study identifies learning algebra processes in a computerized
learning environment and the potential role of spreadsheets in these processes. This
study consists of a micro-analysis of the work of one pair of 7 th graders during their
beginning algebra course on three assignments (involving exponential change of
realistic phenomena), over a six-month period. The assignments are taken from a
beginning algebra course, where students had periodic access to computerized tools.
A detailed analysis of the processes of knowledge constructing by the students is
described, using the RBC+C model (Hershkowitz, Schwarz, & Dreyfus, 2001). The
RBC+C model is a theoretical/methodological framework, developed on the basis of
empirical data analyses, and aimed at analyzing processes of abstraction in context
while solving problems. Evidences for the students' constructing of knowledge and its
consolidation from one activity to the next are presented. In addition, an analysis of
the interaction between the students in the dyad and its connections to the cognitive
analysis is discussed. The paper raises the question of the possible effects of students
learning in a CIE rather than working with computerized tools only partially. This is
the leading question of this dissertation.
24

Paper 1
Constructing and consolidating of algebraic knowledge
within dyadic processes: A Case study
Michal Tabach, Rina Hershkowitz The Weizmann Institute of Science
Rehovot, Israel
Baruch SchwarzThe Hebrew University
Jarusalem, Israel
25

3.2 – The working environment and student achievements
Tabach M., Hershkowitz, R., Arcavi, A. & Dreyfus, T. (In press). Computerized
environments in mathematics classrooms: A research - design view. To appear
in L. D. English (Ed.), Handbook for International Research in Mathematics
Education, 2nd edition. Mahwah, New Jersey: Lawrence Erlbaum Associates.
This paper describes and analyzes:
• the curriculum materials developed ad hoc for the CIE as an expansion and
adaptation of the materials of the CompuMath Project (designed for working with
classes with only partial access to computer labs);
• the design considerations and the design process;
• aspects of the functioning of the environment itself including working habits,
classroom management, and socio-mathematical norms;
• description and results of students' achievements in the pre- and post-tests of the
experimental and the first comparison groups on test items of a traditional nature,
showing no significant statistical differences (the test itself and statistical analysis
per item can be found in Appendix 1);
• results of the achievements of the students in the experimental group on a national
test (Meitzav) showing that their performance was significantly higher than the
national average;
• results of a delayed post-test administered to the experimental and the first
comparison group showing that the former outperformed the latter in mathematical
creativity.
48

Paper 2
Computerized environments in mathematics classrooms: A
research - design view
Michal Tabach, Rina Hershkowitz, Abraham Arcavi The Weizmann Institute of Science
Rehovot, Israel
Tommy DreyfusTel-Aviv University
Tel-Aviv, Israel
49

1. Introduction
This chapter is a follow-up to the chapter by Hershkowitz et al. (2002) in the first
edition of this handbook, which describes and analyzes the stages of the CompuMath
Project, as a paradigm for research-intensive development and implementation of
compound and long-term curricula for computerized environments.
The chapter in the first edition has two parts. In the first part, the characteristics of the
project are described. Particular attention is paid to issues related to the use of
computerized tools. In the second part, three narratives representative of the process
of curriculum development are presented. Each narrative focuses on a small number
of major concerns in curriculum development including the role of research (the
section on geometry), the choice and potential problems of computerized tools (the
section on algebra), and project work and learning trajectories (the section on
statistics).
In the present chapter we review the main trends of the development, research
and implementation, and the way they were integrated in the CompuMath project,
without repeating the narratives1. We then describe a new project, which evolved from
the teaching and learning of beginning algebra within the CompuMath curriculum.
We will use this new project to discuss a somewhat different paradigm for the activity
of teaching and learning mathematics in a computer intensive environment, and
discuss its novel characteristics, the design processes, the teaching and learning trials,
and most importantly - the research and a few major findings.
We call the new learning environment: “Computer Intensive Environment in
Mathematics (CIEM)”, because in contrast to CompuMath, where computer time
was limited, in CIEM computers were available to students and teacher at any time.
1 The reader is referred to the first edition of the handbook for a more detailed description, which includes the narratives. We acknowledge the contribution of those co-authors of the first edition chapter who were mostly involved in writing the narratives about the various content areas: Dani Ben-Zvi, Alex Friedlander, Nurit Hadas, Tzippora Resnick, and Baruch Schwarz.
50
We present the research accompanying the learning paths towards constructing
algebraic competence. We trace instrumentation processes, in which computerized
tools become students’ instruments, and the influence of these tools on learning
algebra as a whole, and we examine the role of Excel in learning and teaching
beginning algebra in particular.
The research takes into account and analyzes the classroom mathematical norms,
which evolve as a result of CIEM, the teacher’s role and voice in the management of
the environment, and above all students’ ways of constructing their knowledge in the
environment.
The commonality between the two chapters lies in their continuity in terms of design,
as well as in their focus on processes of implementation integrated with classroom
research in computer-rich environments, including the interaction between
researchers, designers and teachers in these processes.
2. The CompuMath Project (a brief version of the first edition chapter)
Curriculum development is the process of developing a coherent sequence of learning
situations, together with appropriate materials, whose implementation has the
potential to bring about intended change in learners’ knowledge.
The situation is especially complex when the activity of curriculum development is
aimed at learning mathematics in an environment in which the benefit from the
potential of computerized tools has a central role. In their comprehensive chapter on
“Computer-based learning environments in mathematics”, Balacheff and Kaput
(1996) explained why they think that technology’s power is primarily
epistemological, and added:
While technology’s impact on daily practice has yet to match expectations from two or three decades ago, its epistemological impact is deeper than expected. (p. 469)
51

The aim of the first edition chapter was to exhibit this epistemological potential in the
design and realization of a curriculum, and show how it impacts on the daily practices
of teaching and learning mathematics in classrooms.
Any curriculum development project is embedded in its own socio-cultural
context, but there are also many common features between different projects. In the
first edition chapter these common features were described and illustrated via an
example providing appropriate windows through which curriculum development is
seen as a comprehensive, theoretically and practically consistent activity. These
windows belong to CompuMath, a large-scale curriculum development,
implementation and research project for the junior high school level. The curriculum
was based on the national syllabus, and its main goal was to design and create a
learning environment in which students are engaged in meaningful mathematics
through the use of computerized tools.
By meaningful mathematics we mean that students’ main concerns are
mathematical processes rather than ready-made algorithms. The following
mathematical processes are representative:
Inductive explorations: generalizing numerical, geometrical,
and structural patterns, making predictions and hypotheses;
Explaining, justifying, and proving these hypotheses.
Problem situations were used systematically to provide a natural environment for
students’ activities of investigating and solving problems, thus avoiding an
environment consisting of ritual procedures imposed by the teacher or the textbook.
The CompuMath project is an example of a curriculum development project
in which lessons learnt from research and from development in previous projects,
theoretical frameworks, and relevant cultural artifacts (for example computerized
52
tools) were taken into account. Above all, we adopted a socio-cultural view about
mathematics and the learning of mathematics.
The development team had to deal with many facets of theory, research, and
practice of development and implementation; practices were fed by theory and
research, and vice versa. The team functioned as a cell eager to live and develop,
whose life was in large part determined by its interaction with an unknown outside
world. Through this interaction, the curriculum development activity constantly
redefined its own components.
The curriculum development project was a comprehensive process with three stages:
i. The pre-design stage involves pre-design considerations, before starting the
actual development and research work;
ii. The initial design-research-redesign stage consists of a first design of
sporadic isolated activities and their implementation in a few classrooms,
accompanied by classroom research on learning and teaching practices (observations,
data collection and analysis);
iii. The expansion stage comprises the creation of coherent sequences of
redesigned activities forming a complete curriculum and its implementation, including
the dissemination of the curricular aims and ‘spirit’ on a large scale.
The main issues in each of the three stages of a curriculum research and development project fall into three dimensions.
First, syllabus, curriculum and standards: the syllabus as
given by external agents, explicitly or implicitly, as well as possible national
standards and international trends.
Second, the participants in the process, from project team
members to students, teachers, classrooms, principals and other functionaries
of the school system, each with possibly different roles at different stages.
53

Third, tools, theories, development and research: the
theoretical, socio-cultural and technological background, the actual process of
design, research and development.
Here, we will describe each dimension along the 3 stages, rather than describing each
stage in terms of the 3 dimensions, as we did in the first edition chapter.
2.1. Syllabus, Curriculum and Standards
In many countries, a central syllabus is prescribed by some authority. This syllabus is
usually expressed as a list of contents and/or skills, which students at a specific age or
level should know. Often an external, central examination with a crucial role in the
students’ academic future is imposed, based on this syllabus.
In contrast to a syllabus, a curriculum, as we understand it, is a far more
comprehensive notion. Its goals are intended changes in learners’ knowledge in the
widest possible sense, and it is expressed as a coherent sequence of learning
situations, together with the necessary materials such as textbooks, teacher guides and
other components created in order to implement the intended changes. Hence, a
successful curriculum mediates teaching and learning in actual classroom practice in
such a way as to bring about intended change in learners’ knowledge.
Syllabus and curriculum (as products) may be seen as two poles between
which the curriculum development activity is taking place. There exists no direct and
easy translation of the syllabus into a curriculum that supports the intended changes in
learning and teaching processes in the classroom. There are two crucial reasons for
this; one is that the syllabus is a static list which deals only with the questions of what
contents are to be learned, whereas the curriculum guides the practice of doing
mathematics in the classroom, and as such it also deals with the how. The second
reason is that unlike a syllabus, the curriculum relates to mathematical processes such
as visual reasoning, hypothesizing, and investigating.
54

In order to bridge the gap between syllabus and curriculum, documents
intended to inform and lead reform efforts have been published. The most impressive
of these are the NCTM Standards (NCTM, 1989, 2000), which go far beyond the bare
list of mathematical topics; on the other hand, they are still far from constituting a
curriculum that can be implemented in classrooms.
At the pre-design stage of the CompuMath project, the team faced the
situation of lack of appropriate formal guidelines such as the NCTM Standards, and
therefore had to develop ‘internal’ standards, to guide the curriculum development
and research work. The team dealt with the reality of a rather rigid official syllabus on
the one hand, and long-term government support for innovative curriculum
development projects, on the other. The following are examples of internal
CompuMath standards:
1. Mathematical activity should be driven by the goals of understanding, inquiry,
and convincing.
2. Proving is not only the central tool for providing evidence that a mathematical
statement is true, but should also support understanding why it is true.
3. Mathematical activity should take place in situations that are meaningful for
the students.
4. Mathematical language (notation systems) fosters the consolidation of
mathematical knowledge; it should be introduced to students when they feel the need
for it.
5. Computer tools support and foster the above standards and beyond.
It is important to note that “open” computer tools were rather new to team’s
members at the time, and so was their knowledge about the potential of computers as
a regular and integral part of classroom activity. So the design was mostly a “virtual
design”. Yet some very important decisions were made:
55

1. To broaden the mathematical contexts.
2. To create a curriculum for all the central topics in the Junior High School
syllabus (grades 7, 8 and 9).
3. To base the teaching-learning process on the regular use of computer tools,
rather than to use them only sporadically.
4. Concerning the characteristics of teaching-learning processes – it was decided
to amplify processes, such as investigations of open problem situations, in which
groups of two to four students deal with a broad variety of mathematical phenomena.
5. The team hoped to develop this non-traditional curriculum for a large-scale
population of teachers and students – thus it was decided to educate and train teachers
in the spirit of the project’s goals from the beginning.
6. The team members were fully aware of the novelty of their undertaking as
well as of their limited experience with it – thus it was decided that extensive research
is going to be an integral part of the work.
At the initial design-research-redesign stage, the goal was the first
realization of the plans and of the pre-design considerations, elaborated in line with
the internal standards agreed upon in the previous stage and with the knowledge and
beliefs of the participants. This first realization consisted of the design of
mathematical activities and the investigation of their impact in classroom trials. In
order to continuously base design on insights already gained, the activities designed in
this stage were isolated rather than in sequence. The overall continuum served as a
somewhat vaguely envisaged background against which the isolated activities were
designed. This stage was characterized by the dilemmas concerning the translation of
the contents prescribed by the syllabus into first trial activities, which conform to the
standards of the emerging curriculum.
56

Very often, dilemmas arose from conflicts between the content, as it appears in
the syllabus and the approaches that were adopted in order to implement the internal
standards and make full use of computerized tools. Such dilemmas served as catalysts
for rethinking approaches and methods, and for innovative solutions in the curriculum
development work. Examples:
Within the topic of functions, the possibility of obtaining the graph of any
function from its symbolic representation, to ‘walk’ on the graph, and to read
from the graph the coordinates of special points like extrema, considerably
enriched the teaching-learning of functions in junior high school. However,
this power put in doubt what is commonly presented as a main motive for
learning calculus in high school: The ability to find the main features of a
given function’s graph. The dilemma arises whether to reduce the teaching of
derivatives at high school, or to give it new motives.
Before starting the design and development of algebra activities, the team had
to make a decision about the approach. Several considerations led to the
selection of a functional approach (Yerushalmy, 1997). The main focus of
beginning algebra in the 7th grade is the generation of symbolic generalizations
of number patterns, which can very naturally be seen as the discovery of the
symbolic rule of a function. In addition, the use of a spreadsheet emphasizes
the transition between dynamically varying numbers and their symbolic rules.
Moreover, graphs can be produced when wanted. The functional approach and
the use of graphing software also create opportunities to broaden the concept
of solving equations.
Solving equations of the form f(x)=g(x) was presented as finding the
intersection points of the graphs of the two functions, linear or not. Thus the
graphical solution of a given situation became more fundamental than the
57

algorithmic-symbolic one. On the other hand, students were required by the
official syllabus to master the algorithm for solving linear and quadratic
equations, and the team needed to develop suitable activities for teaching it.
One of these activities dealt with the transformation of a given equation into
an equivalent one. Students in the trial classrooms, who were already familiar
with the intersection point view of a solution, were asked to conjecture the
graphical representation of an equivalent equation. Students, and even some of
the teachers, were quite surprised to discover, by means of a computerized
tool, that the equivalent equation is represented by different functions that
have a different intersection point (with the same x-coordinate). Thus it
became clear that the functional approach does not well support the algorithm
for solving a linear equation, and this topic had to be presented differently.
Through these and similar cases the team members learned that there is a need to
flexibly use different approaches and points of view in curriculum development, just
as in problem solving.
At the expansion stage, the task was to turn the project materials from a
collection of isolated activities into a broad and flexible continuum, expressed by
chains of activities that have the appropriate structure in order to lead to long-lasting
cognitive gains.
2.2. Participants in the Curriculum Development Activity
At the pre-design stage, only a few people were actually participating in the activity
of curriculum development, namely the members of the research and design team. For
the CompuMath project, these were mostly members of the Mathematics Group at
the Department of Science Teaching of the Weizmann Institute. The members of the
team included designers who specialized in producing written materials, experienced
teachers working with the team part time, and researchers in mathematics education.
58

At that stage, the team functioned as “designers” of the future curriculum; they
regularly imagined how a particular design would play out in classrooms with
students and teachers, virtual participants in the activity of curriculum development,
which the designers had in mind.
In the initial design-research-redesign stage, the team members continued, of
course, to form the core, but additional participants were added: teachers and students
in trial classes, which were not virtual any more. The team members as a group were
involved with a large and complex array of interrelated tasks: design and development
of activities, in-depth learning of the mediating potential of the computerized tools,
and teaching in trial classrooms, including observation, investigation and analysis of
teaching – learning processes. The role of several members of the team expanded
considerably during this stage. Many team members went through intensive processes
of introspection and reflection on their own products and actions. For example, one
central member of the team, and the main designer of the functions’ activities, an
experienced teacher as well as developer, became part of the research team that
investigated the teaching trials of activities on functions in her own classroom
(Resnick, Schwarz, & Hershkowitz, 1994). As team member, she was eager to try the
new activities in her classroom. But as teacher, she also had to follow the official
syllabus of the grade 9 functions course with her class. Hence the activities, in spite of
being isolated and innovative, formed an integral part of the official syllabus.
On the other hand, teachers and students in trial classes began to have an
impact on the development process and were thus integrated into the ‘community of
participants’. The common denominator among all these new participants is that they
were highly motivated to realize the goals of the project and aware of their potential
impact on the curriculum. For example, in one ‘lab school’, all the mathematics
teachers (some of whom are members of the core team) used to meet regularly to
59

create activities together, produce worksheets, and try them with their students. The
students were aware that their role was important in evaluating the new approaches
and activities.
Implementation took place at different stages of the curriculum development
activity. Teachers who chose to teach with the project materials needed a lot of
support both, before and during their teaching, because every component was
radically new – the technological tools, the organization of the learning environment
and learning processes, the kind of open-ended problem situations and their
multiphase structure, the methods of teaching, and the ways of evaluating students.
When a sufficient number of activities on functions had accumulated, we
organized an in-service course. Teachers from various schools went through the same
learning practices, in the same learning environment, as students in the trial classes.
They then reflected on each activity as students and as teachers. About half of them
volunteered to use these activities and others that would be developed, during the
following academic year. They received intensive support, mainly in bimonthly
meetings with team members. An additional, quite different role of this group of
teachers was to provide feedback from their classes. This feedback was invaluable in
the next stage of curriculum development as well as in the establishment of
curriculum implementation practices.
A typical feature of the expansion stage, is an expansion of the population.
The social texture of the participating teacher and student populations was radically
different from that of the previous ones. The expansion to a wider population implied
a large measure of ‘democratization’ for both, learners and teachers.
With this expansion of the project to the heterogeneous general population of
learners, and to an anonymous population of teachers, principals, inspectors, and even
parents, less support and monitoring was flowing from the team to each classroom,
60

and less information was coming back from classrooms to the team than in the initial
design-research-redesign stage. The teachers in these classrooms had varying
degrees of commitment, and as a consequence the degree of implementation of the
project varied from sporadic activities, to the adoption of the entire approach and set
of project materials. The team thus initiated new ways to encourage and support
innovation in schools, without impinging on the schools’ autonomy.
2.3. Tools, Theories, Development and Research
At the pre-design stage the project team invested a considerable amount of time and
effort in analyzing various computerized tools and establishing criteria for choosing
the technology to be incorporated in future work. We list here the main criteria that
determined our choices, together with the underlying theoretical considerations, and
explain in a general manner how the tools we actually chose, satisfy the criteria. In the
sections on teaching algebra in CIEM, this discussion will be completed by means of
evidence for the potential of the chosen tools to support curricula that live up to our
internal standards in the specific content area of algebra.
The primary consideration used in choosing a piece of software for a specific
mathematical topic, was the degree to which the software was suitable for the didactic
nature and the content structure of the topic. This led the team to define the following
three more specific criteria:
1. The generality of the tool, its applicability in different content areas, its
availability and its cultural status. Most tools have multiple uses. For example, a
spreadsheet such as Excel may be used to store and analyze data, to create sequences
of numbers from other sequences of numbers by manipulating general symbolic rules,
and to represent numerical data graphically. More broadly speaking, we considered
the cultural nature of the tool.
61

2. The potential of the tool to develop and support mathematization by students
working on problem situations. This can take the form of amplification and
reorganization (Pea, 1985; Dörfler, 1993) and of experiencing new ‘mathematical
realism’ (Balacheff & Kaput, 1996). For example, the capabilities of spreadsheets
enable students to explore the meaning of trends in data, and to use different
representations to exhibit these trends.
3. The third criterion is what we call communicative power (or semiotic
mediation power), that is, the power of the tool to support the development of
mathematical language. This concerns the nature of the symbol system used by the
tool, and its relation to the symbol system more commonly used in mathematics. The
symbol systems of graphers and dynamic geometry programs are usually in one-to-
one correspondence with the symbol systems of mathematics. The symbol system of
Excel, however, is intermediate between the formal algebraic symbol system and an
informal verbal notation system. Efficient problem solving in mathematics depends on
the flexible manipulation of objects in different representations and notation systems.
These three criteria led us to decide on a type of tools for each of the main topics in
the syllabus: spreadsheets (for statistics and algebra), graphers (for functions and
algebra) and dynamic geometry. The selection of a particular piece of software within
these types was based on various additional criteria including user-friendliness,
didactic power (e. g., how many graphs can be shown simultaneously) and more
mundane considerations such as affordability and availability.
The initial design-research-redesign stage, concerning this dimension was
characterized by the process of isolated activity development through research. The
process was a dialectic one, during which design and research influenced each other.
The various aspects considered in the research-design process include the
content, the overall mathematical approach, the intended mathematical thinking
62

processes (generalizing, hypothesizing, reflecting and justifying), the potential of the
tool, the classroom organization (including redistribution of learning responsibilities
between students and teacher), classroom practices, and socio-mathematical norms.
In trials of these early isolated activities in the few first classes, the team was
carried away by the exciting and surprising processes observed, and by the extent to
which they differed from what we had observed during the previous two decades of
development and research. What started as naïve observation and documentation by
taking field notes, was soon transformed into coherent research with videotape
documentation and detailed analysis and interpretation. The need to describe,
understand, explain and analyze what was going on in these classrooms naturally
brought the team closer to the concerns of socio-cultural psychology. Like many
others (e.g., Perret-Clermont, 1993; Yackel & Cobb, 1996), we felt the shortcomings
of cognitive theories, methodologies and tools to describe and interpret learning and
teaching processes in the classroom. The team researchers adopted activity theory
(Kuutti, 1996) as the theoretical frame for the interactionist approach. The
construction of knowledge was analyzed while students were investigating problem
situations in different contexts. Research became a crucial component in the
curriculum development activity.
Two types of research were interwoven in these design–research–redesign
cycles. Both types might be called developmental research (Cobb, 1998), in the sense
that they involve instructional development with research. The first used interviews
with pairs of students, interlaced with development cycles. The second type is
classroom research, which focused on investigating the ways in which the goals and
standards of the intended curriculum were implemented.
Two researchers, members of the team, observed each new activity. In this
way, the team accumulated experience concerning the development of learning
63

opportunities through the power of the computerized tool, and through inquiry during
problem solving processes. At the same time, changes in classroom practices were
noted. As was mentioned before, the observations, which were at first unstructured,
became focused in the course of the year. The analysis of the observations and the
conclusions the team was able to draw, served as the basis for the design of other
activities, as well as for improving the observed activities themselves in the expansion
stage. The following is a short example from classroom research in this stage:
Students’ ability in making hypotheses, their awareness of the quality of
hypothesizing processes and the nature of different reflective processes in different
phases of the activity was investigated. In addition, the orchestrating role of the
teacher during the activity was examined. The research has been reported in detail in
Hershkowitz and Schwarz (1999a). Some of its conclusions are:
1. The power of the tool to deal with a large variety of functions makes rich
problem situations possible.
2. In rich problem situations, inquiry is a natural process. Students have and use
the opportunity to move among representations in order to progress.
3. Asking students to make hypotheses about possible solutions before solving
the problem is a valuable didactic technique. The students were able to delay the
actual solution, and accept hypothesizing as a valuable activity.
4. Reflection, does not usually occur spontaneously but has to be initiated, for
example by requiring students to write a group report on their inquiry process.
5. A teacher led synthesis in a session with the entire class is useful for many
reasons. Students can be given an opportunity to report on their work and to practice
participation in classroom debates, in which they can exert, as well as obtain, critique.
The teacher can use their reports to raise criticism and evaluation, as well as for a
synthesis of the main processes students went through. The session thus affords
64

another opportunity for reflection. Last, but not least, such a synthesis allows the
teacher to define the common (shared) knowledge, which she expects the students to
have gained.
6. The teacher’s role during the synthesis session is crucial.
7. It is advantageous to let students carry out the inquiry and write the report on
the inquiry in groups, because social interaction in the group supports mathematical
argumentation: students complete, oppose and criticize others’ proposals, progressing
towards agreement within the group.
Classroom research thus gave the team members a large amount of input in an
area with which they had little experience from prior cycles of curriculum
development: How to design extended activities based on rich problem situations in
multiple phases, including inquiry by groups of students, report-writing about the
inquiry, and teacher-led synthesis.
During this stage the team designed and refined several activities in each topic,
which incorporated the research results about rich problem situations, activity design,
use of computer tools and teachers’ and students’ roles in the learning process. These
model activities later served as exemplars for the expanded development.
In the expansion stage, development expanded from isolated activities to a
continuum expressed as chains, which combined and shaped the isolated activities
developed earlier into a whole. The chains were elaborated according to the following
perspectives:
1. The structure of the content to be learned,
2. The standards of the project,
3. The power as well as the limitations of the computerized tools,
4. The available time for computer use in school,
65

5. The lessons drawn from the design-research cycles in the pilot classes in the
initial design-research-redesign stage.
A typical chain of activities constitutes a unit of six to eight lessons, which
includes:
A key activity: a multi-phase activity based on an open problem
situation in the computer lab, serving as introduction to the unit. This activity
was typically designed and investigated in the initial design-research-redesign
stage. In the expansion stage, it was revised in the light of lessons the team had
learned from research and observations in the previous stage, as well as in the
light of its role as the key activity for the whole unit. One of the main goals of
this key activity is to create opportunities for students to deal informally and
intuitively, from the start with all concepts, relations, and representations to be
learned in the unit as a whole.
A consolidation activity, given immediately after the key
activity, which elaborates, formalizes and consolidates the informal knowledge
constructed in the key activity. Very often observations in the initial design-
research-redesign stage are the source of such elements. For example,
‘interesting mistakes’, such as wrong verbal or graphical hypotheses,
incomplete strategies, or inefficient representations, are presented as possible
solutions to be accepted or refuted. The intention is to create opportunities for
students to reflect on these ‘mistakes’, through dialectical processes.
Several additional activities, each giving rise to a multi-phase
activity, with or without a computerized tool. The teacher may select two or
three for her class, or even replace the key activity by one of them.
Several follow-up ”corners”, each with its own purpose: The
‘beacon’ corner provides clues and support in various places in each of the
66

activities for students that may need such support. The ‘see if you can’ corner
offers challenging questions on the problem situations for students who finish
the inquiry earlier than others.
A typical unit also contains a collection of homework tasks
(without a computerized tool).
A summary, usually in verse, in the poet’s corner.
Interactive reading of mathematical texts connected to the unit.
Tasks encouraging reflection on actions, content, and learning
processes.
In summary, each unit is organized so as to generate a dialectic process in which
students deal with the key concepts and processes of the unit in different contexts,
from different angles and with different purposes. Such a dialectic process emerges
from the key activity, in which the concepts and contents are linked mainly through
the context of the problem situation, rather than through the mathematical structure
and continues to other activities in which the mathematical structure takes a
progressively more important role.
When the isolated activities were redeveloped and integrated into a whole
curriculum, new research questions, such as the construction of the knowledge of
individuals over an extended period of time, became very important (Hershkowitz,
1999). The construction of knowledge via learning trajectories of students in the space
of the classroom can be examined by tracing individuals as well as groups within and
across activities. For example, a group of researchers focused on the progress over
time of the relationship between a pair’s shared knowledge and individual knowledge
construction. They had begun observing and documenting the common, as well as the
separate work, of a pair of students in activities scattered along the entire 7 th grade
algebra course. They were attempting to understand and interpret each student’s
67

construction of knowledge, as well as the social interaction among the pair. The
intention was to focus on relationships between the changes in individual knowledge
and the changes in shared knowledge, as well as changes in the way the students
interact (Tabach et al., in press). Such research had an effect on development during
the expansion stage. Interactions in a group and with the entire class, as well as with
the computer tool, have a strong influence on building the continuum, since
curriculum development includes also the planning of the type of collaboration within
each phase of a multiphase activity.
Finally, some of the team research focused on outcomes, in particular on the
effect of the curriculum on knowledge structures. In one such study students’ function
concept images at the end of the CompuMath course on functions were characterized
(Schwarz & Hershkowitz, 1999). Specifically, this research does not show how to
undertake curriculum development but rather what is its effect. This was done partly
to satisfy our curiosity, and to gain additional insight into students’ conception of
function, and partly to provide data to principals, inspectors and other interested
parties.
In this first part of the present chapter we tried to show how the
epistemological potential of technology is interwoven in the processes of the “daily
practice” of a new curriculum developed through the processes of its design, research
and implementation.
In the following second part we will focus on the impact on mathematics
learning and teaching of a quantitative change in the availability of technology – it is
available throughout all of the students’ mathematics activity – and of a change in the
approach towards the use of technology – its use is flexible and optional.
3. CIEM as a Learning Environment
3.1 Evolvement of the Idea of CIEM
68

As was mentioned above, one of the design constraints of CompuMath was the
limited access to computers (one or two weekly lessons only). Thus the curriculum
materials include both, activities in which students use computerized tools, and many
other paper and pencil activities that complement it (see 2.3).
Experiences with Computer Intensive Environments (CIE) in many school subjects
(improvement of reading, writing, organizational and argumentation skills,
improvement of students’ self-esteem and involvement) are accumulating and show
their potential benefits (e.g., Rockman et al., 1997, 1998, 1999; Gardner et al., 1993).
However, according to such reports, the use of computers in mathematics is minimal
(Rockman et al., 1998). Moreover, for quickly solving mathematical problems, the
use of pencil and paper is preferred even when the computer is fully available
(Rockman et al., 1997). This is in sharp contrast with a growing body of research
concerning the effect of computer use on learning mathematics as a whole, and on
learning of beginning algebra in particular (Kaput, 1992).
Thus, it was a natural development for the CompuMath project to remove the
limitation of only one lesson (or two) a week with the computer, and turn into a
curriculum for a Computer Intensive Environment in Mathematics (CIEM).
3.2 General Characteristics of CIEM
The new learning environment is an expansion of the CompuMath environment,
taking into account the compulsory official syllabus. It is important to note that the
new CIEM includes all the characteristics of a “traditional” learning environment in
mathematics (i.e., aimed at heterogeneous classes grouped by age, lessons within and
according to the whole school schedule, assessment tests, and homework).
The new elements in CIEM include:
The availability of several computerized tools at all times, both
in the mathematics class and at home.
69

The ”freedom to choose” – students make use of computers for
mathematics, mainly according to their knowledge, needs and preferences. In
most tasks, students can decide whether to use a computerized tool, which tool
to use, when and how.
The addition of these elements transforms CompuMath into a new, quite different
learning environment.
3.3 Tools in CIEM
In CIEM the following tools are available to students (see 2.3).
General tools:
Word processing: the students may “store” their classroom notebook as a computer
file. Writing and editing files as well as drawing are easy options. Teachers can have
continuous and dynamic access to students’ work and create and distribute worksheets
easily.
E-mail communication: enables the transfer of the student’s own files between
classroom and home, extending the learning environment beyond the lesson period. In
addition, e-mail exchange provides additional communication opportunities between
the teacher and each student, and among students.
Online Web forum: the teacher and students may communicate in an asynchronous
forum located at the school site.
Mathematical tools:
Spreadsheet: this tool, primarily developed for business management, is suitable for
learning beginning algebra (see 2.3).
Scientific calculator: to make calculations quickly and correctly.
Mathematical sites: offer “applets” appropriate to the syllabus, and/or interactive
games for practicing needed skills in attractive ways, solving logic puzzles, and more.
3.4 Beyond CompuMath: Design Considerations and Changes
70

The permanent availability of the above tools requires suitable learning materials. We
decided to adapt and redesign (when needed) the beginning algebra course materials
of the CompuMath project for the CIEM. In this new cycle of adaptation/redesign,
the characteristics of the previous development and research cycles of CompuMath
as well as the sequence of activities, their main structure and contents were preserved.
However, each activity was re-examined in the light of the new affordances of CIEM.
As mentioned above, in CompuMath less than half of the activities were designed for
computer use; some (especially at the beginning of the algebra course) include direct
instructions for computerized tools, in order to familiarize students with the tools, and
the new working strategies they enable. Other activities only provide hints for a
possible use of the spreadsheet.
The redesign considerations took into account the possibility of maximizing
computer use in several ways. In all of the following options, CIEM introduces ways
and possibilities of use in the very first activities. In subsequent activities, the decision
about when and how they decide to use each tool is open to the students, and often
became the subject of whole classroom discussions.
The computer as a notebook. For example, in one of the first
activities, in which students had to organize data, they were provided with an
empty table (in a word processor file) in order to make this optional tool
visible.
Spreadsheet as a validation tool. From the very first activities,
students were asked to hypothesize before solving. Data generated with Excel
served to validate hypotheses or raise new questions regarding numerical,
graphical or symbolic hypotheses.
Spreadsheet as a number generator and organizer of data in a
tabular representation.
71

Spreadsheet as a function grapher.
In order to support students’ informed decisions about tool use, they are explicitly
exposed to the differences among the tools. For example, after creating a Word table
for the first time, instructions are provided to build the same table using Excel, and the
class discusses the advantages and disadvantages of each possibility. Moreover, the
curriculum exposes students to several working strategies enabled by a single tool
such as Excel, and supports whole classroom discussions on the issue (see below,
section 5.2).
As in CompuMath, students are encouraged at all times to find their own
solution paths, to consider their advantages and disadvantages and to be creative.
However, in CIEM the space of possibilities for students is larger and richer.
The above considerations led to the final form of the materials: Most of the
activities were left as they were. In activities in which we thought that the presence of
the computer may contribute, we changed and/or added questions.
4. Research in CIEM
The main objective of researching CIEM was to uncover the learning processes that
take place over long periods of time within a classroom.
4.1 Research Goals
The main research question we address is: In what ways does CIEM affect cognitive
and socio-cultural aspects of learning beginning algebra in the 7th grade? More
specifically:
1. What kind of mathematical knowledge did students construct? How?
2. In what ways did students use the computer in their work?
3. To what extent did different students benefit from the computer use?
4. What socio-mathematical norms did develop, and how did they influence
learning?
72

4.2 Participants and Setting
The CIEM beginning algebra course was implemented in two 7th grade classrooms
(two cohorts during two consecutive years), whereas two parallel 7 th grade classes
each year learned with the “regular” CompuMath curriculum. All six classes (one
experimental class and two control classes each year) were very much alike (students
were assigned randomly to each within the same school). The first author served as
the teacher of the experimental group during both years (Tabach, in press).
All students were familiar with some of the tools from previous experiences in
and out of school, including the use of spreadsheets (Excel) in arithmetic lessons.
Lessons were 90 minutes long and took place in a computer room. Most of the
students worked in stable pairs throughout the school year (a few worked alone, and
others changed pairs). Students carried the textbooks, and some of them had a
notebook and pencils; others, as mentioned above, used the computer as their
notebook, to which they downloaded homework from their email account. All files
were saved in the school net.
4.3 Research Design and Tools
The leading research paradigm, applied during the two successive years, is qualitative,
making use of ethnographic methods but also supported by quantitative components.
The quantitative components
A classical quantitative design of the study (see Table 1) was aimed at comparing
achievements on the mathematical topics of the official syllabus.
Groups
Test
Experimental group Control group Control on a
national scale
Pre-test + + --
Algebra course Intensive use of
computer
Limited use of
computerTraditional
73

Post-test + + --
External test + + +
Table 1: Quantitative components of the study
The pre-test was administered before the beginning of the algebra course to both
groups (experimental and control). The test includes short items meant to serve both
as a beginning reference point and to probe students’ entry knowledge of algebra
(which was not taught to them in previous years).
The post-test was administered to both groups during the last week of the course, at
the end of the school year. This test was almost identical to the pre-test, to enable
comparison within groups and between the experimental and control groups. In
addition, it contains two “extra” questions in which students had to make use of
algebraic generalizations.
The external test was administered about half a year after the end of the
experiment to all groups. It is a TIMSS – like external test, designed by the Ministry
of Education, and administered every year to half of the nation’s 8th grade population.
The test items are mainly procedural.
The qualitative components
The qualitative research took place throughout the entire beginning algebra course in
the two experimental classes, and includes intensive observations,
documentation/recording and analysis of student's work (worksheets, homework and
other files). Data gathering included:
In each lesson, audio recording of (a) the opening and summary
phases and (b) the working processes of five pairs of students. In a small
number of lessons, an additional pair of students was video recorded.
The working files of all students in each lesson were saved. In
some activities, students’ worksheets were collected.
74

The researcher/teacher wrote a diary during the school year.
For each lesson, it includes the plan and potential/expected difficulties written
before the lesson, and a report and reflection (against the background of the
expectations) written after the lesson.
Qualitative-quantitative elements:
Based on the intensive observations and documentation along the algebra course, a
delayed post-test was designed, and administered about 3.5 months after the course
ended to all control and experimental groups, while students were in the 8 th grade (see
section 5.3).
5. Some Findings and Insights
In the following, we summarize results from the quantitative and qualitative analyses,
followed by results from the delayed post-test. We conclude by linking and discussing
all the findings.
5.1 Findings Based on Quantitative Data
The tests show no statistically significant differences, neither between the control
groups, nor between the experimental groups. Thus we combine the groups into a
single control group and a single experimental group. The mean results of the three
tests are given in Table 2.
Groups
Test
Experimental group
(n=47)
Control group
(n=94)
Control on a
national scale
Pre-test 78 74 --
Post-test 86 83 --
External test 83 85 77
Table 2: Means of test results from both years
Although the post-test results of the experimental group are slightly higher than those
of the control group, the differences are not statistically significant. Both groups
75

performed well, and seem to have learned algebra during the course. We note that
both groups are well above the national average in the external test – an important
finding in itself: either a limited or an intensive computer environment does not
“harm” students in terms of the national requirement for achievements in 7th grade
mathematics.
The quantitative data is more revealing when some of its details are examined
closely. For example, we examined some results of low-achieving students (five
students in each group defined by their teachers as such). All low-achievers from the
CIEM project could express general patterns algebraically in the relevant post-test
item, whereas none of the low achievers in the control groups could (some gave
numerical answers).
5.2 Findings Based on Qualitative Studies
An in-depth analysis of student work was conducted on selected activities, where the
activity was taken as the unit of analysis.
Instrumentation processes
When students begin to use computerized tools, especially when some initiative is left
to them, they construct an image for themselves of what the tool can and should do.
This image is strongly related to initial experiences, beliefs, the nature and goals of
the activities to be performed, conversation with peers, and results of spontaneous
explorations and serendipitous discoveries. In the words of Vérillon and Rabardel
(1995), a tool in the hands of a user together with the image the user has developed of
it, becomes an instrument. Instruments are actively constructed over time by the
individual as she/he uses the tool and becomes more acquainted with its potential.
Therefore, an instrument might vary from one individual to the other even if they
work on the ‘same’ task with the same tool. Vérillon and Rabardel (1995) defined
instrumental genesis as the process of an individual creating and changing the image
76

of a tool during the performance of different tasks. This process implies two
interrelated aspects: that the tools, their affordances, and the context of their use
influence thinking (instrumentation) and at the same time, that the user shapes the
goals of the tool and the ways of using it (instrumentalization).
A wide collection of working strategies involving computerized tools was
found (for similar findings, see Artigue, 2002). It seems that students adapt the tool to
their ad hoc needs, in ways that they invent themselves. The strategies may be related
to students’ perception of the tool (instrumentation), to their mathematical knowledge,
their actual need and past experiences. For example, in CIEM, some of the students
used the computer to store their notebook. Interestingly, some of them made the
conscious decision to write their notes in an Excel file, rather than in a Word file (as
might be expected) because they found it easier for writing mathematical expressions.
In the following we describe further examples of instrumentation processes
observed in CIEM and specifically related to the learning of algebra.
A need for organizing data.
When students decide to turn to computerized tools while working on a problem, a
main concern may be the need to organize their data (Alro & Skovsmose, 2004). It
seems that this decision is driven by their familiarity with Excel. However, we found
that this familiarity does not dictate a single way of use: we found several ways of
data organization with Excel tables, reflecting different ways of thinking, different
images of the tool and their needs regarding the problem (Tabach & Friedlander,
2004).
Scaffolding the symbolic representation.
Students use numerical and/or graphical representations to deal with changing
phenomena, or to solve word problems (e.g., Dettori et al. 2001). In our study, we
found that even when the task is perceived as “purely” symbolic, students resort to the
77

numerical capabilities and the tabular format of a spreadsheet as a bridge to the
symbolic representation. For example, in a traditional paper and pencil environment,
the syntactic use of the distributive law is applied to find equivalent expressions:
expanding (e.g., 10(a + b) = 10a + 10b), or factoring (e.g., 2a + 2b = 2(a + b)).
Students working with Excel approach the task quite differently, namely as a search
for numerical patterns. They start by inserting numbers in columns A and B, find their
sum in column C (=A + B), calculate the expression (=2*A + 2*B) in column D, and
“drag” (copy) it down. Then, by comparing the obtained numbers in column D with
the numbers in columns A, B and C, students generate equivalent algebraic
expressions. In other words, students remain at the numerical level, but begin to
gradually move towards algebraic rules by generalizing patterns and keeping the
meaning (Tabach & Friedlander, 2006). Thus, spreadsheet enables algebra beginners
to bypass symbolic difficulties by remaining within the realm of numbers in many
different ways, and yet helps them to act “algebraically”, namely, to make
generalizations, to solve equations and to get slowly acquainted to the approaches and
points of view of this new discipline.
Multiple levels of symbolic representations.
Beginning algebra students may use different symbolic expressions to generalize a
given phenomenon (Arcavi, 1995; Dreyfus et al., 2001; Friedlander et al., 1989;
Hershkowitz & Arcavi, 1990). Spreadsheets expand considerably the range of
possible expressions allowing students to select those which make more sense to
them, or those which are found to be more effective. Consider, for example, the
following problem: The following two expressions describe the weekly status of the
respective savings of two friends, Moshon and Robin: 30 + 5x and 60 + 3x (x
describes the week number). Moshon and Robin decided to combine their savings.
Express their joint savings symbolically.
78

Some students expressed Moshon’s savings in column A, Robin’s in column
B, and then used “A+B” as the joint expression (in Excel notation). We call such
symbolic generalization “adding columns”. Other students expressed the joint savings
by defining the starting amount (A1) as 90, and each week’s increase as 8, thus their
input in column A was “=A1 + 8”. We call such a symbolic generalization a
“recursive relation”. A third symbolic approach was the “explicit expression”: Some
students expressed from the very beginning the full relationship “=90 + 8*A” (where
A denotes the week’s number).
These constitute three distinct levels of symbolic generalization:
“Adding columns” relates individual numerical values
concealing the general symbolic expression of each as well as the general
expression for their combined value.
“Recursive relation” connects consecutive elements and creates
a generalization out of local relationships between a value and its predecessor.
“Explicit expression” builds the general expression by
unfolding a full symbolic relationship, not always immediately obvious to
algebra beginners (Noss, 2002; Stacey & MacGregor, 2001).
In a paper and pencil environment, the “dragging” option of the spreadsheet is not
available. Thus, students are nudged from the very beginning towards the explicit
expression (action notation system, according to Kaput, 1992). With these
computerized tools, students have the possibility of choosing their own level of
symbolic generalizations, usually related to the preservation of meaning, and only
then move up gradually, as we found in our study. The availability of these multiple
levels enabled the same students to use two different levels of symbolic
representations for the same phenomenon, according to their understanding of the task
at different stages of their work. This freedom of choice is at the heart of the
79

instrumentation processes observed, which were crucial for the students to develop
understandings and make progress.
Validating results.
Students regard the computer's output as an accurate mathematical reflection of their
input. Therefore, when the obtained output was different from their expectations, they
often concluded that they must re-evaluate their thinking and change the instruction
given to the computerized tool. In other words, the computer is regarded as a
validating tool (Friedlander, 1999). For example, when two students tried to express
the same phenomenon symbolically, each of them suggested an expression: (90) +
(8)x and (90) + 8x. When comparing them, they argued about the need for parentheses
and could not reach agreement. In order to decide which of the expressions was
correct, they turned to the spreadsheet, and wrote both expressions (using the
appropriate notation). They were surprised to notice that the same numbers were
obtained from both expressions, and concluded that the parentheses were not needed.
There are also problematic aspects to the use of computerized tools in general
(Hershkowitz & Kieran, 2001), and for beginning algebra in particular. For example,
two students tried to symbolically express the rule: instead of dividing by a certain
number, we can multiply by its inverse. They used this rule to generate an expression,
and wrote it in Excel. But they were disappointed by the numerical output, because it
indicated that they were wrong, without offering any hint for a possible correction.
They were sure that the rule was correct, and frustrated by their failure to apply it
correctly. As a way out, they moved to a different an ad hoc simpler, additive strategy
(Tabach & Friedlander, 2006). This is an example of a problematic situation, which
can occur while using a technological tool like Excel: The use of the tool leads the
students to follow a simpler strategy.
Emphasizing the conceptual within the procedural.
80
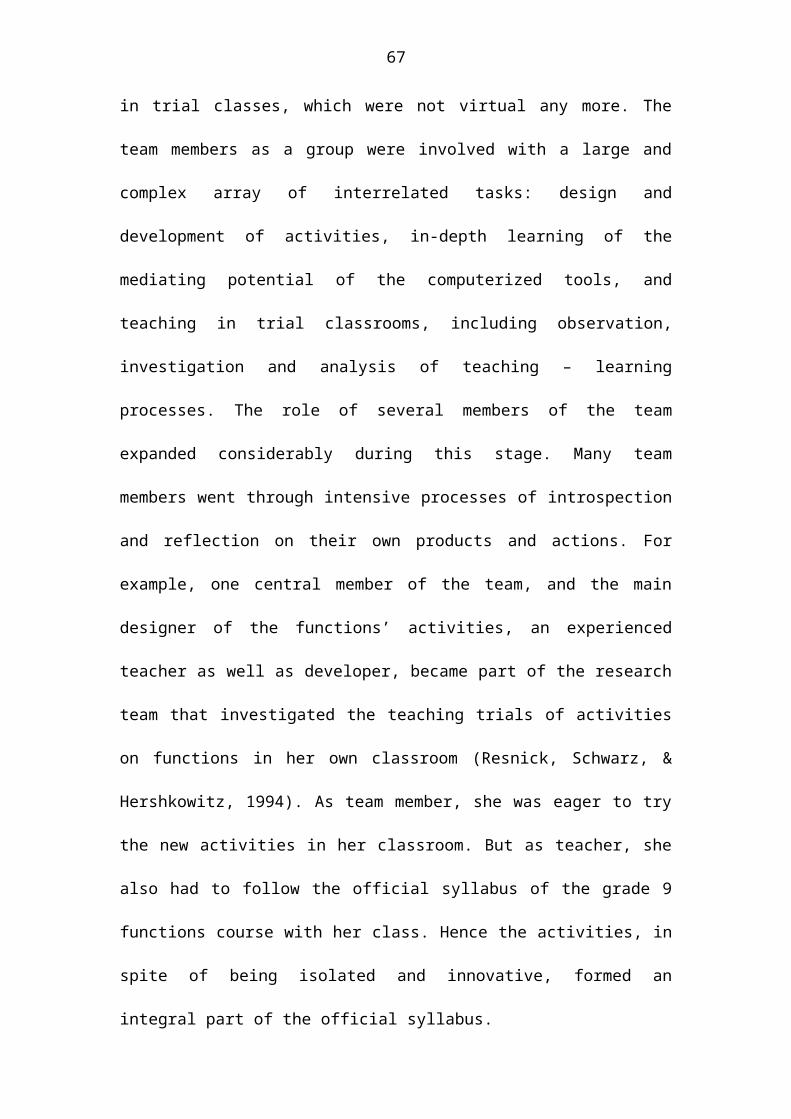
We found that technological tools may focus students’ attention on meaning,
sometimes even stressing the conceptual within procedural tasks. For example,
solving equations is usually perceived as a procedural task. Solving equations with
Excel, entails the following:
Write in one column several values for the variable.
Use the variable to write an equation at the beginning of
another column (e.g. =8*A1 + 10 = 12 – 3*A1).
Copy (drag) the equation down (within the column).
The resulting output is a sequence of “TRUE” or “FALSE” -
indicating whether the variable of the value yields an equality or an inequality
respectively. In other words, TRUE points to the values of the variable, which
solve the equation.
A sequence of FALSE (and the absence of TRUE) can indicate
either that the equation has no solution or that the solution is outside the range
checked for the variable.
When confronted with True/False statements in their attempts to solve equations with
Excel, students in CIEM, started to discuss the conceptual aspects of equations and
what it means to solve equations (Tabach & Friedlander, in press). Similarly, when
each side of an equation is represented graphically, the interpretation of the solutions
as the intersection points between the graphs contributed to the students’ focus on
conceptual aspects of equation solving.
Socio-mathematical norms.
The term “socio-mathematical norms” designates the classroom social constructs
specific to mathematics that individuals negotiate in discussions to develop their
personal understandings (Hershkowitz & Schwarz, 1999b). Socio-mathematical
norms form, for example, when explanations and justifications are made acceptable
81

(Yackel & Cobb, 1996). Three components influenced the development of socio-
mathematical norms in the CIEM classes: the computerized tools, the learning
materials and the teacher. The open–ended activities and the presence of the computer
enable students to make different uses of the tools available, and to produce and ad
hoc variety of strategies. The teacher’s encouragement legitimates students’ initiatives
and supports them to pursue their own strategies, reflect upon them and discuss results
with peers and the whole class. Thus, students’ freedom to approach tasks in their
own ways and to manage their notebooks as they wish, was a characteristic of the
class at all times, and made students responsible for both, the technical and the
mathematical decisions. This characteristic yielded important individual and class
working norms. For example, students do not need to guess the exact answer the
teacher is expecting, rather they have to make sense of the tasks and muster their
knowledge and tools to proceed and work. During the work, students are free to talk
to each other, make shared decisions, defend their positions and listen to others. After
the work, students discuss and listen to others, probe solutions, and elucidate
misunderstandings.
5.3 Findings from the Delayed Post-Test
The delayed post-test, which was administered to both the experimental and the
control groups, consists of an open ended task, the Mobile Phone Companies (see
Figure 1) - which is similar to many of the assignments with which students worked in
CIEM.Towards New Year the mobile phone companies decided to update their monthly rates, as
follows,
AA-Mobile: a fixed service rate of 39 NIS plus 0.6 NIS per minute.
Bell-Solar: a fixed service rate of 49 NIS plus 0.5 NIS per minute.
Cell-mobile: is still considering how to charge their customers.
Design a worksheet for 7th grade students based on this situation.
Indicate which questions are intended for computer use.
Explain your indications.
82

Figure 1: The Mobile Phone Companies problem situation
The purpose of this task was to check students’ understandings through the design of
questions intended for others. The assumption is that when one is placed in a
“teaching” position, the awareness of the mathematical and meta-mathematical issues
involved (algebra, representations, appropriate tool use), and reflection upon them
increase and deepen. In the process of preparing oneself to question others, a student
makes explicit her own understandings, attempts to take the other’s point of view and
to “nudge” into directions considered relevant, including the ways tools should be
used (Harel, 1991).
The results of the delayed post-test show no differences between the experimental and
control groups regarding mathematical knowledge, the use of representations, and
computer use. (Note that the control group learned mathematics with computers once
a week).
All students created questions regarding rates and times of the first two companies.
However, students in the experimental groups asked more complex questions than
their peers in the control group, and they added components to the situation. We
identified three kinds of “expanding cycles” of the given situation:
Inviting the creation of a similar rate system for the third
company. For example: “Suggest prices for the third company, that will be
based on a fixed price and a charge per minute”.
Creating a “competitive” rate system for the third company and
asking questions about it. For example: “Cell-mobile: a fixed service rate of 29
83

NIS plus 0.7 NIS per minute.” We note that this choice was designed for a
lower monthly price compensated by a higher per minute charge. Another
student proposed: “Cell-mobile: a fixed service rate of 59 NIS, plus 0.4 NIS
extra per minute” – a higher fixed price and a lower per minute charge.
Asking complex questions or including new elements. For
example: “Advise Cell-mobile on a rate such that it will be the same as the
first two at their graphical intersection point”. Another student proposed:
“Bell-Solar charges 1 NIS for SMS messages. Eli claims that the expression
describing this company rates is 49+0.5x+1y, where x represents the number
of minutes and y represents the number of SMS messages, and David claims
that the expression is 49 + 1.5x. Who do you think is correct? Why?”
Examining students’ questions according to these three categories indicates that
students from the experimental group were more creative then students from the
control group (Table 3). (The total of the percentage is less then 100, since some of
the students work sheets did not contain questions that could be classified as
expanding the given situation).
Experimental group Control group
Expanding
cycles
first second third first second third
2% 29% 54% 12% 39% 30%
Table 3: Percentage of students from each group according to the three expanding
cycles.
5.4 The Overall Picture
The results of the pre- and post-test (quantitative data) indicate that students in the
experimental CIEM and in the control groups performed equally well in formal
84

mathematics skills. Students in both groups performed above the national average in
an external test administered by the Ministry of Education.
The qualitative studies were very informative regarding the nature and quality
of the learning processes in CIEM. Three main components influenced the
environment: the nature of the task-design, the omnipresence of the computerized
tools, and the socio-mathematical norms that developed. While coping with open-
ended problem situations, students shape their own learning path, construct a variety
of productive strategies (some of them quite surprising) at different levels of algebraic
sophistication, and some showed creative approaches. CIEM proved to be very
inclusive, such that students from different ability levels participated actively at all
times and engaged in lively peer and whole classroom discussions. CIEM provided
not only a motivational atmosphere, but also tools to be adopted and adapted by
students in different ways, making them highly responsible for their own learning.
The teacher became a genuine facilitator of the learning processes, staging the tasks,
scaffolding the learning of individual students, coordinating the discussions, and
constantly providing legitimization of the different approaches to problem solving and
tool use.
6. Epilogue
This is a follow-up chapter describing the evolving story of a comprehensive project
of development, research, and implementation of a rich learning environment for
learning mathematics with computerized tools. On the one hand, the description
portrays the dynamic inter-relation between design and research. On the other hand, it
illustrates the multifaceted implementation of the materials resulting in students’
mathematical and personal achievements, as learners in control of their own learning
processes and as resourceful citizens of the future.
The continuation of the previous stages of this project was inspired by what then was a conclusion: “…in an ideal environment the students can be autonomous and
85

use technological tools whenever they feel the need for it.” (Hershkowitz et al., 2002, p. 691).
CIEM constitutes a firm step forward. However, it is far from ideal; it still poses
some challenges and dilemmas.
Designing and running CIEM seems to require, certainly in its
first stages but not only, the work of a team, in which teachers, designers and
researchers collaborate intensively at all times. The role of the teacher, the
expected students’ activities and the ways in which computerized tools are
intended, require constant monitoring, reflection and re-design alongside
school and parental support. The intellectual and technical demands of an
environment like CIEM are non-trivial, and the upscaling of such experience
remains a challenge.
CIEM showed productive personalized uses of computerized
tools that resulted in powerful learning outcomes. This is certainly important
as the epistemology of school mathematics (Kaput, 2002) changes in the light
of new tools. Hardware and software continues to shift from isolated,
expensive tools to connected, inexpensive, diverse and ubiquitous
technologies. Therefore, more ongoing research should be invested into the
potential of the tools.
As opposed to what was envisioned by some with the advent of
computers in mathematics education, the role of the teacher acquires crucial
importance, far beyond the traditional roles of paper, pencil, chalk and board
mathematics classrooms. As an orchestrator of a complex environment,
teachers should undergo an intensive and possibly different education in order
to be properly prepared to exploit the richness of environments like CIEM.
Such educational programs are not sufficiently widespread.
86

Classrooms should be envisioned as communities of learners in
which different ability levels, the availability of new tools, collaboration and
ongoing discussions are assets to be exploited. Thus, mathematics education
will be not only about mathematics, but about education, in its more general
meaning, as well. Not many schools are inclined to support such classrooms.
Mathematicians actively engaged in mathematics education,
often express their dislike (or disbelief) of the computerized tools. The main
argument seems to be that mathematics “suffers” in several ways from the new
learning trajectories and emphases. The dialogues between the communities of
mathematicians and mathematics educators engaged in environments like
CIEM is slow in producing consensus, even when studies like the above show
that achievements in “traditional” tests are not harmed (they even improve). In
this respect, a main challenge for environments like CIEM is that the
traditional syllabus can become a “straightjacket”, limiting the ample
possibilities to approach old content differently, as well as limiting the
addition of new content such as syntactic algebraic manipulations in the
presence of friendly computer algebra systems. Also, even if these dilemmas
can be resolved, we still need to study the new kind of difficulties students will
face (Yerushalmy, 2005).
Combining pure cognitive paradigms of research on
mathematics learning with socio-cultural outlooks has gained increased
attention and importance over the last decade, and it is essential in order to
better understand learning in environments like CIEM. The interdependence
between “shared knowledge” and “individual knowledge” (Hershkowitz,
1999), will occupy the research community for years to come, especially as the
87

new environments will become more widespread, raising new questions and
challenges.
Thus, even after a second stage of a long term and comprehensive project, we should
take progress as a mere sign that much more work awaits on this wonderful journey.
Nevertheless, we can take a small respite to fully agree with diSessa’s (2000, p. ix)
vision that computers started to convey a “new increment of intellectual power that
rivals what conventional literacy has given us”, and that education will “be
transformed by the computer’s presence so that children learn much more, learn it
earlier, and more easily, and, fundamentally, learn it with a pleasure and commitment
that only a privileged few now feel toward school learning.” It is our belief that the
increased intellectual power, the joy of learning and the availability of different
computerized tools from which to choose different ways to approach problems will
turn most students into autonomous life-long learners.
88

References
Alrø, H., & Skovsmose, O. (2003). Dialogue and learning in mathematics education –
Intention, reflection, critique. Dordrecht, The Netherlands: Kluwer.
Arcavi, A. (1995). Teaching and learning algebra: Past, present and future. Journal of
Mathematical Behavior, 14 (1), 145-162.
Artigue, M. (2002). Learning mathematics in a CAS environment: The genesis of a
reflection about instrumentation and the dialectics between technical and
conceptual work. International Journal of Computers for Mathematical
Learning, 7, 245-274.
Balacheff, N., & Kaput, J. (1996). Computer-based learning environment in
mathematics. In A.J. Bishop, K. Clements, C. Keitel, J. Kilpatrick, & C.
Laborde (Eds.), International handbook of mathematics education (pp. 469-
501). Dordrecht, The Netherlands: Kluwer.
Cobb, P. (1998) Analyzing the mathematical learning of the classroom community:
The case of statistical data analysis. In A. Olivier & K. Newstead (Eds.),
Proceedings of the 22nd Conference of the International Group for the
Psychology of Mathematics Education (Vol. 1, pp. 33-48). Stellenbosch, South
Africa: PME.
Dettori, G., Garuti, R., & Lemut, E. (2001). From arithmetic to algebraic thinking by
using a spreadsheet. In R. Sutherland, T. Rojano, A. Bell, & R. Lins (Eds.),
Perspectives on school algebra (pp. 191-208). Dordrecht, The Netherlands:
Kluwer.
diSessa, A.A. (2000). Changing minds. computers, learning, and literacy. Cambridge,
MA: MIT Press.
89

Dörfler, W. (1993). Computer use and views of the mind. In C. Keitel & K. Ruthven
(Eds.), Learning from computers: Mathematics education and technology (pp.
159-186). Berlin, Germany: Springer, NATO ASI Series.
Dreyfus, T., Hershkowitz, R., & Schwarz, B.B. (2001). Abstraction in context: The
case of peer interaction. Cognitive Science Quarterly. An International
Journal of Basic and Applied Research, 1 (3&4), 307-358.
Friedlander, A. (1999). Cognitive processes in a spreadsheet environment. In O.
Zaslavsky (Ed.), Proceedings of the 23rd Conference of the International
Group for the Psychology of Mathematics Education (Vol. 2, pp. 337-344).
Haifa, Israel: PME.
Friedlander, A., Hershkowitz, R., & Arcavi, A. (1989). Incipient ”algebraic” thinking
in pre-algebra students. Proceedings of the 13th Conference of the
International Group for the Psychology of Mathematics Education (Vol. 1, pp.
283-290). Paris, France: PME.
Gardner, J., Morrison, H., & Jarman, R. (1993). The impact of high access to
computers on learning. Journal of Computer Assisted Learning, 9, 2-16.
Harel, I. (1991). Children designers. Norwood, NJ: Ablex Publishing Corporation.
Hershkowitz, R. (1999). Where in shared knowledge is the individual knowledge
hidden? In O. Zaslavsky (Ed.), Proceedings of the 23rd Conference of the
International Group for the Psychology of Mathematics Education (Vol. 1, pp.
9-24). Haifa, Israel: PME.
Hershkowitz, R., & Arcavi, A. (1990). The interplay between student behaviors and
the mathematical structure of problem situations – Issues and examples.
Proceedings of the 14th Conference of the International Group for the
Psychology of Mathematics Education (Vol. 2, pp. 193-200). Oaxtepec,
Mexico: PME.
90

Hershkowitz, R., & Kieran, C. (2001) Algorithmic and meaningful ways of joining
together representatives whithin the same mathematical activity: An
experience with graphing calculators. In M. van den Heuvel-Panhuizen (Ed.),
Proceedings of the 25th Conference of the International Group for the
Psychology of Mathematics Education (Vol. 1, pp. 96-107). Utrecht, The
Netherlands: PME.
Hershkowitz, R., Dreyfus, T., Ben-Zvi, D., Friedlander, A., Hadas, N., Resnick, T.,
Schwarz, B.B., & Tabach, M. (2002). Mathematics curriculum development
for computerized environments: A designer-researcher-teacher-learner
activity. In L.D. English (Ed.), Handbook of international research in
mathematics education (pp. 656-694). Mahwah, NJ: Erlbaum.
Hershkowitz, R., & Schwarz, B.B. (1999a). Reflective processes in a technology-
based mathematics classroom. Cognition and Instruction, 17 (1), 65-91.
Hershkowitz, R., & Schwarz, B.B. (1999b). The emergent perspective in rich learning
environments: Some roles of tools and activities in the construction of socio-
mathematical norms. Educational Studies in Mathematics, 17 (1), 1-18.
Kaput, J. (1992). Technology and mathematics education. In D.A. Grouws (Ed.),
Handbook of research on mathematics teaching and learning (pp. 515-556).
Reston, VA: National Council of Teachers of Mathematics.
Kaput, J. (2002). Implications of the shift from isolated, expensive technology to
connected, inexpensive, diverse and ubiquitous technologies. In F. Hitt (Ed.),
Representations and mathematical visualization (pp. 79–109). Mexico:
Departmento de Mathematica Educativa del Cinvestav – IPN, Mexico.
Kuutti, K. (1996). Activity theory as a potential framework for human-computer
interaction research. In B.A. Nardi (Ed.), Context and consciousness (pp. 17-
44). Cambridge MA: MIT Press.
91

NCTM (1989). Curriculum and evaluation standards for school mathematics. Reston,
VA: National Council of Teachers of Mathematics.
NCTM (2000). Principles and standards for school mathematics. Reston, VA:
National Council of Teachers of Mathematics.
Noss, R. (2002). For a learnable mathematics in the digital culture. Educational
Studies in Mathematics, 48, 21-46.
Perret-Clermont, A.-N. (1993). What is it that develops? Cognition and Instruction,
11 (3&4), 197-205.
Pea, R.D. (1985). Beyond amplification: Using the computer to reorganize mental
functioning. Educational Psychologist, 20 (4), 167-182.
Resnick, Z., Schwarz, B.B., & Hershkowitz, R. (1994). Global thinking ”between and
within” function representations in a dynamic interactive medium. In J. Pedro
da Ponte & J.F. Matos (Eds.), Proceedings of the 18th Conference of the
International Group for the Psychology of Mathematics Education (Vol. 3, pp.
57-64). Lisbon, Portugal: PME.
Rockman et al. (1997). Report of a laptop program pilot. Retrieved March 15, 2006,
from http://www.microsoft.com/education/downloads/aal/resrch_1.rtf
Rockman et al. (1998). Powerful tools for schooling: Second year study of the laptop
program. Retrieved March 15, 2006, from
http://www.microsoft.com/education/downloads/ aal/research2.rtf
Rockman et al. (1999). A more complex picture: Laptop use and impact in the context
of changing home and school Access. Retrieved March 15, 2006, from
http://download.microsoft.com/download8/d/c/8dc3ebfe-6849-4534-a4b7-
846a8c327874/ Research3Report.doc
92

Schwarz, B.B., & Hershkowitz, R. (1999). Prototypes: Brakes or levers in learning the
function concept? The role of computer tools. Journal for Research in
Mathematics Education, 30 (4), 362-389.
Stacey, K., & MacGregor, M. (2001). Curriculum reform and approaches to algebra.
In R. Sutherland, T. Rojano, A. Bell, & R. Lins (Eds.), Perspectives on school
algebra (pp. 141-153). Dordrecht, The Netherlands: Kluwer.
Tabach, M. (in press). Research and teaching – Can one person do both? A case study.
In J. Novotna (Ed.), Proceedings of the 30th Conference of the International
Group for the Psychology of Mathematics Education. Prague, Czech Republic:
PME.
Tabach, M., & Friedlander, A. (2004). Levels of student responses in a spreadsheet-
based environment. In M.J. Hoines & A.B. Fuglestad (Eds.), Proceedings of
the 28th International Conference for the Psychology of Mathematics
Education (Vol. 2, pp. 423-430). Bergen, Norway.
Tabach, M., & Friedlander, A. (2006). Understanding equivalence of algebraic
expressions in a spreadsheet-based environment. Technical report. Weizmann
Institute of Science, Rehovot, Israel: Available from the authors.
Tabach, M., & Friedlander, A. (in press). Solving equations in a spreadsheet
environment. In L. H. Son, N. Sinclair, J. B. Lagrange and C. Hoyles (Eds.),
Proceedings of the ICMI 17 Study Conference: background papers for the
ICMI 17 Study. Hanoi University of Technology.
Tabach, M., Hershkowitz, R., & Schwarz, B.B. (in press). Constructing and
consolidating algebraic knowledge within dyadic processes: A case study.
Educational Studies in Mathematics.
93

Vérillon, P., & Rabardel, P. (1995). Cognition and artifact: A contribution to the study
of thought in relation to instrumented activity. European Journal of
Psychology in Education, 9 (3), 1-33.
Yackel, E., & Cobb, P. (1996). Sociomathematical norms, argumentation, and
autonomy in mathematics. Journal for Research in Mathematics Education, 27
(4), 458-477.
Yerushalmy, M. (1997). Emergence of new schemes for solving algebra word
problems: The impact of technology and the function approach. In E.
Pehkonen (Ed.), Proceedings of the 21st Conference of the International Group
for the Psychology of Mathematics Education (Vol. 1, pp. 148-164). Lahti,
Finland: PME.
Yerushalmy, M. (2005). Challenging known transitions: Learning and teaching
algebra with technology. For the Learning of Mathematics, 25 (3), 37-42.
94

3.3 – Design Considerations in Detail
Tabach, M. & Friedlander, A. (In press). The role of context in learning beginning
algebra. To appear in C. Greenes (Ed.), Algebra and Algebraic Thinking in
School Mathematics, Seventieth NCTM Yearbook (2008).
This paper expands and extends the general description of the curriculum materials by
focusing on a specific example. It presents epistemic and pedagogical analyses of the
design of one assignment involving symbolic expressions and related concepts. The
designers' intentions and considerations are explicitly discussed by addressing the
following issues: the role of variables and expressions as meaningful representations
of changing phenomena; the difference between variables and constants; the lack of
closure of symbolic expressions (adding up 2x+3 has “no result” vs. the common
mistake of performing the sum to obtain 5x); and the equivalence of symbolic
expressions.
95

Paper 3
The role of context in learning beginning algebra
Michal Tabach and Alex Friedlander
The Weizmann Institute of Science
Rehovot, Israel
96

THE ROLE OF CONTEXT IN LEARNING BEGINNING
ALGEBRA
Michal Tabach Alex Friedlander
Introduction
Algebra has been traditionally described as "generalized arithmetic," and
as a result, instruction has usually focused mainly on its symbolic aspect
(for example, the manipulation of symbolic expressions, the solution of
algebraic equations, and the investigation of symbolically presented
functions). According to this approach, the use of algebraic objects and
concepts in a real-life, fictitious, or mathematical contexts was considered
later (if at all) as applications of the learned concepts.
In contrast, context-based learning of mathematics considers the use of
real-life situations or situations involving mathematical problems that
constitute both the starting point and the main process for understanding
concepts and the performance of operations. Bickmore-Brand (cited by
Wiest 2001) states that "context is paramount to the construction of
meaning the whole way through. It is the backdrop against which the
parts have to make sense" (p. 75).
According to Gravemeijer and Doorman (1999), a pure mathematical
problem can also be a context problem. In any case, a contextual task
97

should be experientially real for the student, and should serve as a basis
upon which a mathematical concept can be built.
A context-based approach has both immediate and more general
advantages.
It facilitates learning processes by providing real or concrete meaning to
an otherwise abstract concept or algorithm (Heid et al. 1995).
It provides points of reference that students can review at a more
advanced stage of learning, when work is performed at a more abstract
level.
It raises student motivation and willingness to become engaged in the
learning activity.
It emphasizes the potential of using algebraic models and skills in other
fields.
Mason and his colleagues (1985) state that "In order to have clear,
confident and automatic mastery of any skill, it is necessary to practise,
but the wish to practise will arise naturally from stimulating contexts." (p.
36).
In this article, we will show the role of context in learning algebra, with
regard to four concepts: the role of variables and expressions as
representatives of meaningful phenomena of changes, the difference
98

between changing versus constant quantities, the lack of closure of
algebraic expressions, and the equivalence of algebraic expressions.
The role of variables and expressions as representatives of meaningful
phenomena of changes.
In many cases students (and educators) refer to a symbol as an unknown
quantity or a "place-holder" (Usiskin 1988). In this regard, the expression
2 + 3x is interpreted as "the sum of two and a multiplication of a number
by three". This is a limited view of symbols and expressions. The same
expression can represent a range of possible numbers, all of which have a
common characteristic – they are all the result of multiplication by 3 plus
2. Usiskin (1988) indicated that students are expected to understand a
wide variety of meanings attributed to a letter in algebra (for example, a
varying quantity, a fixed solution of an equation, a generalized number, a
function, and a set). Awareness of different interpretations enhances the
concept of variables. We will demonstrate the use of context as a possible
way of addressing the notion of the symbol as a variable and expressions
as representations of changing phenomena.
The difference between changing versus constant quantities.
Another obstacle to understanding symbolic expressions is the need to
distinguish between constants and variables (Arcavi and Schoenfeld
1988). At the stage of beginning algebra, students are required to use
99

letters mainly as generalized numbers, and therefore the distinction
between these letters and constants is important (Usiskin 1988). Usiskin
also mentioned the use of letters and numbers in generalizing patterns.
We will discuss the potential of visual context for clarifying the different
roles of constants and variables.
Lack of closure of algebraic expressions.
Teachers and researchers (Matz 1982) have indicated that students
studying algebra tend to add up unlike terms (for example, thinking that 2
+ 3x = 5x). This tendency is usually attributed to students’ eagerness to
bring an algebraic expression to a "closed result", in a way similar to the
final results obtained in arithmetical exercises. Tirosh and her colleagues
(1998) analyzed teachers’ approaches to students’ tendencies to "close"
algebraic expressions. They found four approaches for dealing with the
algebraic lack of closure.
1. Identify and collect like terms. For example, in the expression
2x +3y + 4x + 8y, the terms "2x" and "4x" are alike, and hence can
be added into one term, "6x". In the same manner the terms "3y"
and "8y" can be added into "11y". However, the terms "6x" and
"11y" are not alike, and hence cannot be added.
2. Associate unlike terms with different objects. For example, 2a +
3b represent two apples and three bananas that cannot be added or
subtracted (but for some miraculous and unexplained reason they
100

can be multiplied…). Note that here the use of apples and bananas
is a limited illustration of the symbols, rather than a
comprehensive context. Some students even may perceive the "a"
as a short symbol for apple, and the "b" as a short symbol for
banana.
3. Emphasize the order of operations. For example, in an expression
like 2 + 3x, the multiplication of 3 and x precedes the addition, but
it cannot be performed. As a result, the expression cannot be
simplified.
4. Substitute numbers for variables in two expressions that are
considered equivalent (e.g., 2 + 3x and 5x) and check whether the
results obtained are equal.
None of these approaches considers the potential of meaningful contexts
as a means of overcoming this difficulty. Later in this article we will
demonstrate the potential of a contextual approach to clarify this issue.
Equivalence of algebraic expressions
Traditionally, the concept of equivalence of expressions is introduced
when students are required to simplify expressions. The expressions
produced in a process of algebraic simplification are considered
equivalent. As a result, the equivalence of expressions is defined in one
or both of the following ways.
101

If one expression can be transformed into the other by performing a
sequence of valid algebraic operations for a common domain of
numbers.
If the substitution of all numbers in two expressions produces equal
results for their common domain.
The application of the first definition is problematic, due to the large
variety, and sometimes arbitrary nature of the simplification rules as
perceived by beginning algebra students (Matz 1982). The second
definition of equivalence cannot be applied in an operative manner, since
the defined domain of many expressions is an infinite set of numbers.
In the discussion that follows, we present the Toothpick Towers problem,
and illustrate how the use of context-based problems can help to
overcome or prevent the reported difficulties.
The Toothpick Towers problem
The Toothpick Towers problem belongs to a sequence of activities that
constitute the core of the beginning algebra course in the Compu-Math
materials for 13-year-old students (Hershkowitz et al. 2002). The activity
was designed and then its implementation was observed in several
classrooms.
The main task in this activity is to analyze the patterns of two sequences
of "toothpick towers" (fig. 1). The first stages of the activity are aimed to
102

get the students acquainted with the given sequences and the numerical
patterns behind them.
______________Figure 1
______________
Understanding algebraic concepts in context
In this section, we discuss how the context of the Toothpick Tower
problem helps to clarify the four basic algebraic concepts that we
discussed in the introductory section.
The role of variables and expressions as representatives of meaningful
phenomena of changes.
In the context of Toothpick Towers, the variable represents the place
index for the two tower sequences, and the corresponding algebraic
expressions describe the number of toothpicks in these towers. Thus,
students relate to these algebraic expressions as descriptors of complete
sequences, as opposed to a visual representation presented by a figure,
which describes only a few particular instances (see, for example, the first
three towers in figure 1).
The difference between changing versus constant quantities
In Toothpick Towers and other similar activities, the students are involved
in generalization processes and as a result, they must consider the
meaning, the notation, and the difference between a variable and a
103

constant quantity. The obvious difference between the two sequences of
toothpicks is in the towers’ constant base in the first sequence, as opposed
to their changing base in the second. Thus, the context of the problem
provides a visual representation of a varying quantity – such as the
number of toothpicks in some parts of the towers (for example, their
vertical walls and horizontal ceilings), as opposed to the constant base (of
two toothpicks) for the towers in the first sequence. As a result, these
quantities must be represented in different ways – the first as an
expression (3n) and the second as a number (2). The visual representation
here makes the difference concrete, and hence meaningful to students.
Simon (1995) recommends basing some of the student tasks on the
conceptual difficulties previously observed among students working on a
similar task. Accordingly, the issue of constants versus variables was
further addressed in our activity in the question presented in figure 2.
This question requires students to consider an episode, based on an error
observed in one of the project’s experimental classes, and to reflect on the
meanings of constants and variables.
______________Figure 2
______________
The importance of this question lies in the opportunity to discuss this
issue with students. Many students' reactions to this item is that Daniel
made a mistake – he added up the numbers correctly, but basing his
104

symbolic expression on a particular numerical instance was a mistake. In
such a discussion, terms such as "static" and "dynamic", or "fixed" and
"changing" are used frequently by students, and can be naturally
formulated by the teacher as a "constant" and "variable".
Lack of closure in algebraic expressions
Our classroom observations revealed that attaching a visual or other
concrete meaning to algebraic terms, and generalizing or modeling
authentic problems are effective in preventing the closure of unlike terms.
As mentioned before, in the Toothpick Towers activity, each algebraic
term has a visual counterpart. This allows students to consider whether
each term represents a changing or a constant quantity. Work in the
context of the activity also provides meaning to each algebraic operation
performed by the students. For example, the addends of 3n + n + n derive
their meaning from the number of toothpicks in the different components
of the towers that change by the same pattern; hence they can be added.
On the other hand, the terms 3n and 2 represent a changing and a constant
quantity, correspondingly, and hence the expression 3n + 2 cannot be
simplified. As a result, the addition of similar terms or the lack of closure
for unlike terms is given a visual interpretation and understood
intuitively.
The reflective question presented in figure 3 relates to the issue of the
lack of closure. As in the case of the previous reflective item (fig. 2), this
105

question is based on a classroom episode observed during the
development of the curriculum. Again, this question provides an
opportunity for classroom discussion.
______________Figure 3
______________
On a more general level, we claim that a contextual approach enables
students to identify unlike terms that cannot be added, since their sum
does not display the same pattern of change as its addends. Thus, a
context can provide a specific meaning to syntactic rules of manipulation,
which are usually considered by students as arbitrary. Various syntactic
rules can be addressed by using different contextual problems.
Equivalence of algebraic expressions
As mentioned before, a context-based algebraic activity provides
opportunities for students to actively assign a meaning to each component
of an algebraic expression. In addition, comparisons of different
expressions based on meaningful interpretations enable a better
understanding of the concept of algebraic equivalence. In many context-
based activities, expressions both describe a pattern and reflect a method
of modeling.
By working in a contextual situation, the concept of equivalence is raised
by an authentic need to compare different models that were designed by
106

students to describe the same situation – and not by an arbitrary
requirement to simplify abstract expressions presented by the teacher.
In our case, for example, both n + 3n + n and n + n + n + n + n represent
the number of toothpicks for the n-th tower in the second sequence, and
we can establish their equivalence by following the modeling process that
underlies each model. These two expressions represent different ways of
looking at the same situation. The first expression represents a counting
method that considers the tower’s two base lines and its wall structure
separately, whereas the second expression counts each straight line and
the set of ceilings separately (fig. 4). Thus, the equivalence of these
expressions can be established by validating the counting methods for the
two models. Students in class actually used their counting method to
determine the equivalence of expressions. Moreover, they were able to
look at a given expression and describe the counting method that
underlies a given expression.
______________Figure 4
______________The potential of equivalent expressions to reflect different models for the
same situation is also illustrated by the question presented in figure 5.
The question is based on the simulation of a classroom discussion, based
on students' presentations and a comparison of their algebraic models.
107

______________Figure 5
______________
In a more general view, in a context-based approach, the expressions
produced by students during an activity may represent different ways of
modeling the same phenomenon. As a result, equivalent expressions can
be viewed by students as different descriptors of the same phenomenon.
This approach enables teachers and curriculum developers to introduce
the concept of equivalence at early stages of learning algebra, when
students’ skills of manipulation are very limited.
At a more advanced stage of learning algebra, the situations and their
corresponding expressions become more complex, and consequently
validating the equivalence of models by vision or by reasoning becomes
more difficult. By then, however, most students have acquired enough
experience with modeling, so that an intuitive understanding of
equivalence is achieved, and they can resort to the other two, more
abstract definitions of algebraic equivalence (performing a sequence of
valid algebraic operations or getting equal results when substituting any
number from a common domain).
Conclusion
Learning beginning algebra at an almost exclusively abstract, symbolic
level can cause many cognitive and affective difficulties (Sutherland &
108

Rojano 1993; Tall 2004). We claim that the provision of contextual
meanings to algebraic objects, concepts, and operations must occur at the
initial stages and accompany the whole process of learning – as opposed
to presenting these meanings only at more advanced stages, as possible
applications. Our experience with developing a context-based algebra
curriculum shows that this approach provides an important bridge
between arithmetic and algebra, between concrete and abstract objects,
and enables students to learn algebraic concepts in a more meaningful
way.
We used the Toothpick Towers activity to illustrate our claim that context
facilitates the learning of algebraic concepts throughout the stages of
initial exposure, and provides opportunities to reinforce learning by
meaningful
applications and personal reflection. The context exemplified here was
based on a visual sequence. Other context-based situations can, and
should be used – for example, a change in the amount of allowance
money, or sequences of growing rectangles (Friedlander and Tabach
2001; Tabach and Friedlander 2004), to provide meaningful support to
newly learned abstract entities.
At this stage, we would like to make three cautionary remarks with regard
to this issue.
109

A context-based approach cannot be employed in an exclusive
manner. For various reasons, mathematics teaching in general, and
algebra teaching in particular, should be accompanied by abstract,
symbolic tasks. Gravemeijer (1998) and his colleagues at the
Freudenthal Institute claim that besides the mathematization of
problems that are real to students, there also has to be room for the
mathematization of concepts, notations, and problem-solving
procedures. Thus, besides the process of converting a contextual
problem into a mathematical problem (in their terms, horizontal
mathematization) considered in this paper, there is a need to convert
mathematical matter onto a higher plane (vertical mathematization).
In spite of its potential to promote a deeper understanding of
mathematical concepts, a context-based approach is prone to cause
some cognitive difficulties as well. For example, for different
students, a "familiar" context tends to be "familiar" in different ways.
As a result, students might understand a mathematical concept in
unintended ways, or follow "unproductive" paths of solution -
described by Sutherland and her colleagues (2004) as construction of
idiosyncratic knowledge that is at odds with intended learning.
Teaching in a context-based approach is very challenging. Many
teaching strategies (for example, predicting or reacting to
"productive" or "unproductive" student answers) require skills that
110

can be acquired gradually by experience, participation in teacher
workshops, and supportive team work.
Thus, there is a need to strike a careful balance between the contextual
and mathematical abstract approaches in teaching algebra. However, in
view of the traditional emphasis on the abstract, symbolic aspects of
algebra, we would like to recommend to teachers, curriculum developers,
and researchers to focus on the issues of teaching beginning algebra using
a context-based meaningful approach.
References
Arcavi, Abraham, and Alan Schoenfeld. "On the Meaning of
Variable." Mathematics Teacher 81 (1988): 420-427.
Friedlander, Alex, and Michal Tabach. "Promoting Multiple
Representations in Algebra." In The Roles of Representation in
School Mathematics, 2001 Yearbook of teachers of
Mathematics (NCTM), edited by Albert A. Cuoco & Frances
R. Curcio, pp. 173-185. Reston, Va.: NCTM, 2001.
Gravemeijer, Koeno. "From a Different Perspective: Building on
Students' Informal Knowledge". In Designing, Learning
Environments for Developing Understanding of Geometry and
Space, edited by Richard Lehrer, and Daniel Chazan, pp. 45-
66. Mahwah, N.J.: Lawrence Erlbaum, 1998.
Gravemeijer, Koeno, and Michiel Doorman. "Context Problems in
Realistic Mathematics Education: A Calculus Course as an
111

Example." Educational Studies in Mathematics 39 (1999):
111-129.
Heid, Kathleen M., Jonathan Choate, Charlene Sheets, and Rose M.
Zbiek. Curriculum and Evaluation Standards for School
Mathematics, Addenda Series: Algebra in a Technological
World. Reston, Va.: NCTM, 1995.
Hershkowitz, Rina, Tommy Dreyfus, Dani Ben-Zvi, Alex
Friedlander, Nurit Hadas, Tzippora Resnick, and Michal
Tabach. "Mathematics Curriculum Development for
Computerized Environments: A Designer-Researcher-
Teacher-Learner Activity." In Handbook of International
Research in Mathematics Education, edited by Lyn English,
pp. 657-694. Mahwah, N.J.: Lawrence Erlbaum, 2002.
Mason, John, Alan Graham, David Pimm, and Norman Gowar.
Routes to / Roots of Algebra. Milton Keynes, U.K.: The Open
University, 1985
Matz, Mailyn. "Towards a Process Model for High-School Algebra
Errors." In Intelligent Tutoring Systems, edited by Derek
Sleeman and John Seely Brown, pp. 25-50. London:
Academic Press, 1982.
Simon, Martin A. "Reconstructing Mathematics Pedagogy from a
Constructivist Perspective." Journal for Research in
Mathematics Education 26 (1995): 114-145.
Sutherland, Rosamund, and Teresa Rojano. "A Spreadsheet
Approach to Solving Algebra Problems." Journal of
Mathematical Behavior 12 (1993): 353-383.
112

Sutherland, Rosamund, Susan Robertson, and Peter John.
"Interactive Education: Teaching and Learning in the
Information Age." Journal of Computer Assisted Learning 20
(2004): 410-412.
Tabach, Michal, and Alex Friedlander. "Levels of Student
Responses in a Spreadsheet-based Environment." In
Proceedings of the 28th Conference of the International
Group for the Psychology of Mathematics Education, edited
by Marit Johnsen Hoines, and Anne Berit Fuglestadt, vol. 2,
pp. 423-430. Bergen, Norway, 2004.
Tall, David. "Thinking Through Three Worlds of Mathematics." In
Proceedings of the 28th Conference of the International
Group for the Psychology of Mathematics Education, edited
by Marit Johnsen Hoines, and Anne Berit Fuglestadt, vol. 4,
pp. 281-288. Bergen, Norway, 2004.
Tirosh, Dina, Ruhama Even, and Neomi Robinson. "Simplifying
Algebraic Expressions: Teacher Awareness and Teaching
Approaches." Educational Studies in Mathematics 35 (1998):
51-64.
Usiskin, Zalman. "Conceptions of School Algebra and Uses of
Variables." In The Ideas of Algebra K-12, 1988 Yearbook of
Teachers of Mathematics (NCTM), edited by Arthur F.
Coxford, and Albert P. Shulte, pp. 8-19. Reston, Va.: NCTM,
1988.
Wiest, Lynda. "The Role of Fantasy Contexts in World Problems".
Mathematics Education Research Journal 13 (2001): 74-90.
113

The figure presents two sequences of growing toothpick towers.
Find the number of toothpicks for the fourth,
fifth and the tenth "tower" in each sequence.
Generalize: How many toothpicks are in the n-
th "tower" of each sequence?
Find the place of the "tower" made of 40
toothpicks in each sequence.
Figure 1. The Toothpick Towers problem situation.
First sequence of towers:
Second sequence of towers:
114

Daniel found that the number of toothpicks in the second
tower of the first sequence is .
He thought: "Three 2's and another 2 are the same as ,
and therefore, the number of toothpicks for the n-th tower
should be n".
Do you think that Daniel is right? Explain your answer.
Figure 2. A reflective item dealing with variables and
constants.
Rachel found that the number of toothpicks in the n-th tower
is
2 + n for the first sequence, and
n for the second sequence.
She wondered: "How can I get two equivalent expressions for
two different sequences?"
How would you solve Rachel’s problem?
Figure 3. A reflective item regarding the lack of closure for
algebraic expressions.
115

Figure 4. A visual interpretation of equivalent expressions.
Find expressions that describe the number of toothpicks
of the n-th tower in the first sequence – mark them by
(1).
Find expressions that describe the number of toothpicks
of the n-th tower in the second sequence – mark them by
(2).
2(2n) + n 2 + 3n
n + 2(n + 1) 3n + 2n
5n n + 3n + n
5 + 3(n – 1) 4n + n
Figure 5. A context-based identification of equivalent
expressions.
n + n + n n + n + n + n + n
116

3.4 – In-Depth Analysis of Students Work in the CIE.
Papers 4, 5, 6, and 7 analyze various aspects of algebra learning in the CIE on the
basis of the students’ work on several assignments. The combined work presented in
these four papers (and paper 8, next section) yields the core findings upon which the
answers related to the second part of the research questions are based. These papers
present, describe, and discuss the processes of learning, instrumental genesis, and the
classroom socio-mathematical norms within the CIE. In the following, I describe the
individual focus and contribution of each of the four papers.
Tabach, M. & Friedlander, A. (2004). Levels of student responses in a spreadsheet-
based environment. In M. J. Hoines, & A. B. Fuglestad (Eds.), Proceedings of
the 28th Conference of the International Group for the Psychology of
Mathematics Education (Vol. 2, pp. 423-430). Bergen, Norway: PME. (Paper
4)
This paper analyzes three interrelated aspects of students' work on an assignment
administered in the third week of the course: posing hypotheses, ways of organizing
data, and kinds of symbolic expressions that students used to verify / reject their
conjectures. The findings show the variety in students' working strategies in all the
three aspects, which shed light on the ways in which CIE students approach and solve
mathematical problems
117

Paper 4
Levels of student responses in a spreadsheet-based
environment
Michal Tabach and Alex Friedlander
The Weizmann Institute of Science
Rehovot, Israel
118
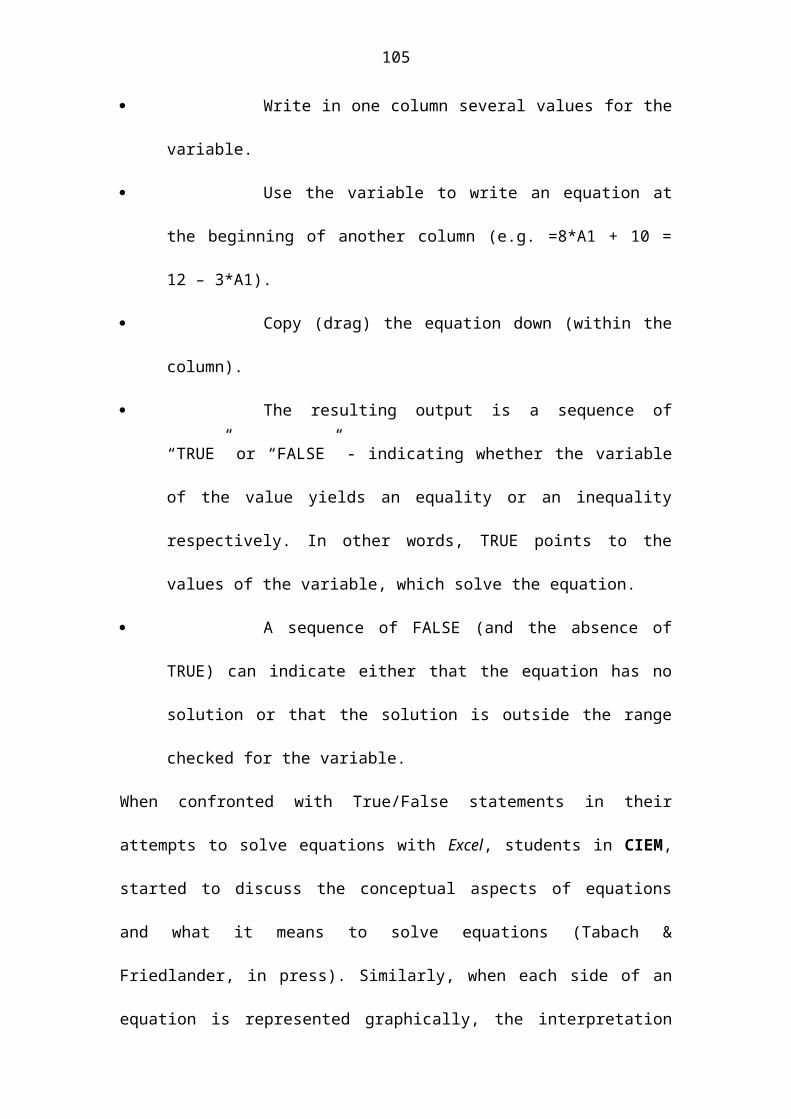
LEVELS OF STUDENT RESPONSES IN A SPREADSHEET-BASED ENVIRONMENTMichal Tabach Alex Friedlander
Department of Science Teaching, The Weizmann Institute of Science, Israel
The purpose of this report is to investigate the range of student responses in three domains - hypothesizing, organizing data, and algebraic generalization of patterns during their work on a spreadsheet-based activity. In a wider context, we attempted to investigate students' utilization schemes of spreadsheets in their learning of introductory algebra. Twenty students' responses to an investigative assignment were analyzed. The findings indicate a wide range of student responses. In each of the three domains analyzed, most student responses fell into several clearly definable categories. However, an attempt to establish a hierarchy of performance levels led to less clear results.
BackgroundResearchers and educators suggest using various models of learning environments, that widen and enrich the scope of learning processes for students having differing mathematical abilities. Technological tools were recognized as a particularly effective means to achieve this purpose (see for example, Balacheff & Kaput, 1996).The Compu-Math learning project created a technologically based learning environment, which systematically covers the entire mathematics syllabus for grades 7-9. As described by Hershkowitz and her colleagues (2002), this project is based on the following principles:o Investigation of open problem situations;o Work in small heterogeneous groups, where the problem is
investigated and discussed;o Consolidation of the mathematical concepts and processes, that arose
in group work, in a whole-class discussion;o Investigations that utilize computerized tools to facilitate operations
within and between various mathematical representations, to reduce the load of formal algorithmic work, to enable the construction of mathematical concepts and processes, to provide feedback to hypotheses and solution strategies, and to resolve a real need to explain important processes and products;
119

o Interactions between students in a group or in the class as a whole, between students and computerized tools, and between students and the teacher;
o Reflective actions on the learning process;This report investigates the range of student responses in three domains: (1) hypothesizing, (2) organizing data, and (3) algebraic generalization of patterns during students' work in a spreadsheet based activity. The findings address the broader issue of detecting the learning processes underlying introductory algebra students' instrumental genesis (Mariotti, 2002). Here we attempted to describe and discuss the processes involving students' perception and utilization of spreadsheets as a technological artifact.Our choice of domains was guided by their importance in the process of learning mathematics in general, and in the context of spreadsheet-based learning of introductory algebra in particular, and also by their potential to characterize and possibly indicate levels of mathematical learning. The importance of each of the three investigated domains was considered by others on various occasions:- Chazan and Houde (1989) and Howe and his colleagues (2000) indicate
that students’ hypothesizing has the potential to be a source of authentic mathematical activity, a catalyst for meta-cognitive action, and a motivator for learning.
- Student performance at the stage of collection and organization of data was investigated in particular in the domain of data analysis (Ben Zvi & Garfield, in press) and spreadsheet-based mathematical activities.
- Algebraic generalization of patterns is considered central for the learning of algebra on the one hand, and as a source of student cognitive difficulties on the other hand (Kieran, 1992).
MethodologyOne of the authors (M. T.) was the teacher-researcher of a Grade 7 introductory algebra class consisting of 24 students. For this particular group, all five weekly lessons were conducted in a computer laboratory; students had access to a computer, and occasionally used Excel spreadsheets as tools for mathematical work and documentation. In Grades 5 and 6, the students were also occasionally engaged in exploratory mathematical activities that employed Excel spreadsheets. During selected lessons, the teacher conducted both video and audio recordings. The video recordings included the class work of one pair of students and discussions involving the entire class. The audiotapes recorded the discussions of 3-4 additional pairs of students. In addition, all the students were required to save their computer work on the net. The data analyzed in this report is based on the data collected during one
120

90-minute lesson. The data include transcriptions of the video recording of one pair, the audio recordings of four pairs, and 12 spreadsheet files of all students. Twenty students attended this lesson, and worked in 6 pairs, one group of three, and 5 individuals. The lesson analyzed here was based on an activity called Growing Rectangles, and was conducted at an early stage of the course – three weeks after the beginning of the school year.
The activity of Growing RectanglesThe situation associated with the problem (Figure 1) presents the process of growth of three rectangles; students are requested to relate to the first ten years of this process.
Rectangle A Rectangle B Rectangle C
. . .
. . .
. . .
At the end of the first year, its width is one unit, and it grows by an additional unit each year.
The length of this rectangle is always longer than its width by three units.
At the end of the first year, its width is one unit, and it grows by an additional unit each year.
The length of this rectangle is constantly 10 units.
At the end of the first year, its width is one unit, and it grows by an additional unit each year.
The length of this rectangle is always twice the length of its width.
At what stages of the first ten years does the area of one rectangle overtake another’s area?
Figure 1. Problem situation of the Growing Rectangles.At the initial stage, the students are required to predict (hypothesize), without performing any calculations or formal mathematical operations, which rectangle will overtake another's area, and at what stage.Next, the students are required to organize their data regarding the growing rectangles in a spreadsheet table, record the formulas used to construct their table, and compare (first numerically and then graphically) their findings and their predictions.Student responsesNext, we will attempt to present and analyze some categories of student responses to this activity. As previously mentioned, we will restrict our
121

analysis here to three domains: hypothesizing, organizing data, and algebraic generalization of patterns.Hypothesizing (predicting results). In this domain, we observed three categories of responses.oLocal considerations. Most students sampled one or more points on the
time sequence and drew conclusions according to their findings in these selected points. For example, two pairs chose to look at the fifth year (probably because of its being the midpoint of the given period of ten years) and realized that at this point, the areas of Rectangles B and C are equal. This led them to conclude that these rectangles become equal in area every five years. They rejected this hypothesis at a later stage.
oConsiderations of rate. A few students considered the rectangles’ rate of growth. One pair reasoned as follows: Rectangle B has a fixed length, and as a result, it cannot “win”. Between Rectangles A and C, Rectangle C is the “winner”, since at each step “it grows by itself”.
oEliminating the common variable. One pair noticed that one side of each rectangle is the same at each stage and grows similarly. As a result, they ignored the contribution of this side to the area, and considered only the growth process of the other side. The comparison of the three corresponding sequences of lengths (Rectangle A - 4, 5, 6, …; Rectangle B - 10, 10, 10, …; Rectangle C – 2, 4, 6, …) led them to conclude that Rectangle C will have the largest area at the end of the process.
Ben Zvi and Arcavi (2001) found that student analyses that are based exclusively on local considerations lead to poorer results, as compared to an argumentation that is based on global, or combined global and local considerations. Thus, we considered the first category of hypothesizing to be at a lower level, in comparison to the other two. We could not develop an argument with regard to the comparison of the other two categories. They are both global and based on general features of a variation process. One should note, however, the elegant simplicity of the third strategy.Organization of data. In this activity, the students were required to use Excel in order to collect, organize, and analyze their data. However, they were not instructed how to organize their data. Figure 2 presents the four categories of tables observed in the students' work files and their corresponding frequencies.oSeparate tables. Students in this category constructed three tables - one
table for each rectangle (Figure 2a). Each table contained four columns to describe the year (from 1 to 10), the rectangle’s two linear dimensions, and its corresponding area.
122

oExtended table (Figure 2b). The tables of this category contained ten columns (i.e. variables): the year, six columns for the linear dimensions of each rectangle, and three columns for the area measures. The columns were in order either by rectangle (i.e. an annexation of the three separate tables previously described) or by variable (i.e. first, grouping together the linear dimensions of all rectangles and then, their area measures).
oReduced table (Figure 2c). These students allotted only one column for the width measures, since they are identical for all three rectangles. Thus, the number of columns in these tables was reduced to eight.
oMinimal table (Figure 2d). These students noticed that the width measures are identical to the year number and omitted the width measures altogether. Moreover, they omitted the length measures as well, and included their corresponding expressions directly into the area formulas of each rectangle. Thus, the number of columns in this case was further reduced to four.
123

Rect. A Width Length Area Rect. B Width Length Area Rect. C Width Length Area1 1 4 4 1 1 10 10 1 1 2 22 2 5 10 2 2 10 20 2 2 4 83 3 6 18 3 3 10 30 3 3 6 184 4 7 28 4 4 10 40 4 4 8 325 5 8 40 5 5 10 50 5 5 10 506 6 9 54 6 6 10 60 6 6 12 727 7 10 70 7 7 10 70 7 7 14 988 8 11 88 8 8 10 80 8 8 16 1289 9 12 108 9 9 10 90 9 9 18 16210 10 13 130 10 10 10 100 10 10 20 200
YearWidth Rect. A
Length Rect. A
Area Rect. A
Width Rect. B
Length Rect. B
Area Rect. B
Width Rect. C
Length Rect. C
Area Rect. C
1 1 4 4 1 10 10 1 2 22 2 5 10 2 10 20 2 4 83 3 6 18 3 10 30 3 6 184 4 7 28 4 10 40 4 8 325 5 8 40 5 10 50 5 10 506 6 9 54 6 10 60 6 12 727 7 10 70 7 10 70 7 14 988 8 11 88 8 10 80 8 16 1289 9 12 108 9 10 90 9 18 16210 10 13 130 10 10 100 10 20 200
Year Width Length Rect. A
Area Rect. A
Length Rect. B
Area Rect. B
Length Rect. C
Area Rect. C
1 1 4 4 10 10 2 22 2 5 10 10 20 4 83 3 6 18 10 30 6 184 4 7 28 10 40 8 325 5 8 40 10 50 10 506 6 9 54 10 60 12 727 7 10 70 10 70 14 988 8 11 88 10 80 16 1289 9 12 108 10 90 18 16210 10 13 130 10 100 20 200
YearArea
Rect. AArea
Rect. BArea
Rect. C1 4 10 22 10 20 83 18 30 184 28 40 325 40 50 506 54 60 727 70 70 988 88 80 1289 108 90 16210 130 100 200
(a) Separate tables (2 files)
(b) Extended table (4 files)
(c) Reduced table (2 files)
(d) Minimal table (4 files)
Figure 2. Categories (and frequencies) of tables observed in student Excel work files.
124

First, a distinction can be made between the construction of separate tables and the other categories. Students who employed the first strategy did not consider the common features of the three rectangles and the task at hand. A numerical or graphical comparison of several processes of variation requires either a common table or a common graph. An analysis of the other three table categories led us to conclude that an increasing level of conciseness is related to higher level of reasoning. As indicated by the findings presented in the next section, the construction of a compact table is related to the abilities to detect patterns and to express symbolically the relationships involved in this particular problem situation.Algebraic generalization of patterns. Hershkowitz and her colleagues (2002) indicate that the use of spreadsheets to investigate processes of variation enables students to use spontaneously algebraic expressions. Spreadsheet users employ formulas (expressed in spreadsheet syntax) as a natural means to construct extensive numerical tables and then, possibly to plot graphs. In our case, after three weeks of learning algebra, all students, with one exception, were able to write and then copy (“drag”) spreadsheet formulas, to obtain the necessary numerical data. We investigated whether the formulas used by the students in this case have the potential to indicate levels of student ability to generalize algebraically. After examining students’ work in this activity, we formulated the following categories:oOne student exclusively used numbers and showed no attempt to
generalize, but was still able to construct a graph based on his numerical data.
oRecursive formulas express a relationship between two consecutive numbers in a sequence. Figure 3(b) presents an example of using recursive expressions for obtaining the dimensions of a rectangle.
oExplicit formulas use the sequence place index as an independent variable. In our case, 3 students (in 3 files) used the year number as an independent variable in their expressions (see Figure 3(a)).
A B C D1 Year Width Length Area2 1 =A2 =A2+3 =A2*(A2+3)
(a) Explicit formulas.
A B C D1 Year Width Length Area2 1 4 1 =A2*B23 =A2+1 =B2+1 =C2+1 =A3*B3
)b (Mixed recursive and multivariate formulas.
(c) Mixed explicit and multivariate formulas.
125
A B C D1 Year Width Length Area2 1 =A2 =A2+3 =B2*C2

Figure 3. Algebraic generalizations.oMultivariate formulas use more than one variable to express a
generality. In our case, in 8 (out of 12) files the area of the rectangles was expressed by using the letters corresponding to the length, width or year columns (e.g., = B2*C2). The variables used in a multivariate formula were originally obtained by a recursive method or by an explicit formula (see Figures 3(b) and (c)).
Recursive formulas can be considered to be the result of a local view of a pattern. In standard algebra, recursive formulas are less effective as a tool for finding a required number in a sequence, or for analyzing and justifying sequence properties. In a spreadsheet environment, these disadvantages are less valid and hence less obvious to students (or researchers). The spreadsheets’ dragging ability allows us to obtain a very large quantity of numbers by using any kind of formula – including a recursive or a multivariate one. Moreover, the same action of dragging enables students to understand the global aspects of a recursive formula. Recursive formulas have a didactical advantage as well. For example, they are easier to understand and produce, and sometimes their use is the only way that some complex (for example, exponential) functions can be introduced at an early stage.Multivariate formulas are also frequently considered an obstacle to students’ performance in algebra. Lee (1996) states that one of the main difficulties in algebraic modeling is not the construction of a general expression, but the finding of a model that proves to be effective in the solution process. Once again, the difficulty of producing an ineffective model is bypassed by the spreadsheets’ ability to accept and handle a considerably wider range of generalizations than with a paper-and-pencil environment. In a spreadsheet environment, students frequently replace a quantity previously expressed as an algebraic expression by a new variable. Jensen and Wagner (1981) consider students’ ability to view expressions as entities a characteristic of algebraic expert thinking. The contribution of this strategy to advance this skill needs further inquiry.SummaryOur analysis of student responses in this spreadsheet activity revealed a wide range of student responses. Because of the variety of student responses detected in our findings, we concluded that a spreadsheet-based learning environment enables students to follow different paths of instrumental genesis, according to their algebraic reasoning and their perception of the employed artifact.In addition, we attempted to create categories of responses with regard to students’ ability to hypothesize, to organize data and to generalize. In each of these three domains, most student responses could be categorized in several distinctive groups. However, an attempt to distinguish levels
126

of performance among these categories led us to less clear results. In our case, the process of hypothesizing did not require the employed technological tool. As a result, we established levels of performance by an analysis of student mathematical reasoning.The activity presented here required students to organize large quantities of numerical data. Spreadsheets are particularly well-suited to facilitate the construction of tables. Our findings indicate that this feature enables students of all levels to organize their data. Moreover, we distinguished various levels of performance in this domain, based on students’ level of mathematical understanding of the task.With regard to students’ algebraic generalizations, we found that the spreadsheets’ powerful mathematical capabilities enable students to obtain the required results by employing strategies that are considered ineffective in a paper-and–pencil environment. As a result, we could not establish a hierarchy of generalization skills that would be valid for both environments. We also recommend that the effect of work with spreadsheets on students’ ability to generalize algebraically in both environments be investigated.ReferencesBalacheff, N.& Kaput, J. (1996). Computer-based learning environment in
mathematics. In A. J. Bishop, K. Clemens, C. Keitel, J. Kilpatrick & C. Laborde (Eds.) International Handbook of Mathematics Education (pp. 469-501). Dordrecht, The Netherlands: Kluwer Academic.
Ben-Zvi, D. & Arcavi, A. (2001). Junior high school students’ construction of global views of data and data representations. Educational Studies in Mathematics 45(1–3), 35-65.
Ben-Zvi, D. & Garfield, J. (Eds.) (in press). The Challenge of Developing Statistical Literacy, Reasoning, and Thinking. Dordrecht, The Netherlands: Kluwer Academic.
Chazan, D. & Houde, R. (1989). How to Use Conjecturing and Microcomputers to Teach Geometry. Reston, VA: NCTM.
Hershkowitz, R., Dreyfus, T., Ben-Zvi, D., Friedlander, A., Hadas, N., Resnick, T. & Tabach, M. (2002). Mathematics curriculum development for computerized environments: A designer-researcher-teacher-learner activity. In L. English (Ed.). Handbook of International Research in Mathematics Education (pp. 657-694). Mahwah, NJ: Lawrence Erlbaum.
Howe, C., Tolmie, A., Duchak-Tanner, V. & Rattray, C. (2000). Hypothesis testing in science: Group consensus and the acquisition of knowledge. Learning and Instruction 10, 361-391.
Jensen, R. J. & Wagner, S. (1981). Three perspectives on the process uniformity of beginning algebra students. In Proceedings of the 2nd
Annual Meeting of PME-NA (pp. 133-139). Athens, GA.
127

Kieran, C. (1992). The learning and teaching of school algebra. In D. A. Grouws (Ed.). Handbook of Research on Mathematics Teaching and Learning (pp. 390-419). New York: Macmillan.
Lee, L. (1996). An initiation into algebraic culture through generalization activities. In N. Bednarz, C. Kieran, & L. Lee (Eds.). Approaches to Algebra: Perspectives for Research and Teaching (pp. 87-106). Dordrecht, The Netherlands: Kluwer Academic.
Mariotti, M. A. (2002). The influence of technological advances on students mathematics learning. In L. English (Ed.). Handbook of International Research in Mathematics Education (pp. 695-723). Mahwah, NJ: Lawrence Erlbaum.
128

Tabach, M. Hershkowitz, R. & Arcavi, A. (Under revision). Learning beginning
algebra with spreadsheet in a computer intensive environment. Submitted to
Journal of Mathematics Behavior. (Paper 5)
This paper studies three confluent issues: learning in a Computer Intensive
Environment; meaningful learning of symbolic manipulations in a beginning algebra
course; and processes of instrumental genesis. The analysis focused on the working
processes of eleven pairs of students from both cohorts (transcription of audio
records), the working processes of all the students in both cohorts, and a whole class
discussion led by the teacher. Students took advantage of the various symbolic levels
afforded by spreadsheets. The large variety of students’ working strategies reflects
their autonomy to choose their preferred tools and ways of working, and the lively
classroom discussions reveal the socio-mathematical norms that evolve in this CIE
and their enactment in the classroom working habits.
129

Paper 5
Learning beginning algebra with spreadsheet in a computer
intensive environment
Michal Tabach, Rina Hershkowitz and Abraham Arcavi
The Weizmann Institute of Science
Rehovot, Israel
130

Learning Beginning Algebra with spreadsheets
in a Computer Intensive Environment
Michal Tabach, Rina Hershkowitz and Abraham Arcavi
The Weizmann Institute of Science
Abstract
This study is part of a large research project aimed at observing, describing and analyzing the
learning processes of two 7th grade classrooms during a year long beginning algebra course in
a Computer Intensive Environment (CIE). The environment includes carefully designed
learning materials with a functional approach, and provides students with unconstrained
freedom to use (or not use) computerized tools during the learning process at all times. This
paper focuses on the qualitative and quantitative analyses of students' work on one problem
situation, which is representative of the way they worked throughout the year. The analyses
reveal the characteristics of students’ mathematical activity, and how such activity is related to
both the instrumental views of the computerized tools that students develop and their freedom
to use them. We describe and analyze the variety of approaches to symbolic generalizations,
syntactic rules and equation solving and the many solution strategies pursued successfully by
students. On that basis, we discuss the strengths of such an environment and discuss the open
questions and dilemmas it poses.
131
1. Introduction
During the last five years we have conducted a long-term research study whose
overarching goal was to observe, describe and analyze the mathematical activity of
students in a beginning algebra course within a Computer Intensive Environment
(CIE).
We define a CIE as a learning environment in which (1) computerized tools are
available to learners at all times (both in class and at home), and (2) the learners are
free to choose if, when and how to use the tools while working on problem situations.
At the very beginning of the course, the learning materials and the teacher introduce
students to the computerized tools and suggest how these may be used to solve certain
problems. However, very soon thereafter, all the problem situations (which are at the
core of the activity in this CIE and which were designed to provide ample
opportunities to work with computerized tools), do not include any instructions or
specific requests to work either with paper and pencil or with computerized tools.
Thus the intensiveness of the environment refers to the availability of the
computerized tools at all times and not necessarily to an intensive use of them.
The year-long beginning Algebra course designed and implemented for this CIE is
organized around a sequence of problem situations involving phenomena involving
changing quantities. In this "functional approach", equations consist of pointwise
comparisons within a changing phenomenon (Heid, 1995; Hershkowitz et al., 2002;
Yerushalmy & Schwartz, 1993), and syntactic algebraic skills are integrated into the
learning process when needed and at the service of the mathematical activity related
to the problem situations.
Our long-term research includes different components described elsewhere: the design
principles of the learning environment, its implementation and results of a comparison
with student achievements in other classes (Tabach, Hershkowitz, Arcavi & Dreyfus,
in press); analysis of student learning of syntactic aspects of algebra (Tabach &
Friedlander, 2004; submitted); understanding the concept of equation in the beginning
algebra course in the CIE (Tabach & Friedlander, 2006); and the students' evolving
uses of spreadsheets throughout the course (Tabach, Arcavi & Hershkowitz,
submitted).
In the present paper, we focus on the ways students (from two different 7th grade
classes in two consecutive school years) worked on a problem situation within the
132
CIE. Since the work of the students in this problem situation is representative of what
they did throughout the year, it serves as a window to examine, characterize and
analyze (both quantitatively and qualitatively), the kinds of mathematical activity
which took place in this CIE for beginning algebra.
This study touches upon on three confluent areas, and it is aimed as a contribution to
each of them: learning in Computer Intensive Environments, learning beginning
algebra with a functional approach (Tabach, Hershkowitz & Schwarz, 2006), and
processes of instrumental genesis in which computerized tools affect thoughtful users
(Verillon & Rabardel, 1995). In the next section, we briefly discuss these three areas.
2. Background
2.1 Learning in a Computer Intensive Environment
In the last decade, there is a growing interest in learning environments in which
computers are available to students and teachers at all times. Studies on these
environments usually focus on outcomes, showing advantages and gains, such as
improvement of reading and writing skills, better organization of written work as a
whole (especially argumentation capabilities), improvement of self-esteem,
involvement and the like (Gardner et al., 1993; Rockman et al., 1997, 1998, 1999).
Whereas there are reports of partial uses of computers in mathematics classrooms or
labs, there are almost no reports on the teaching of mathematics in a CIE, where
computerized tools are available at all times. Moreover, in many cases, students who
had had experience in a general CIE report that mathematics is the subject in which
the computer use is the lowest (Rockman et al., 1998), and problem solving usually
takes place with pencil and paper only, even when the computer is fully available
(Rockman et al., 1997). Lewis (2005) reports on some of the problems she, as a
mathematics teacher, faces when coming to implement a CIE in her class because of
the absence of suitable learning materials. The scarcity of reports on mathematics in
CIE is in sharp contrast with the growing body of research on teaching and learning
mathematics in computerized environments where the computer use is partial (a
lesson or a sequence of several lessons). One of the goals of this study is to illustrate
and discuss the functioning of a CIE in a beginning algebra classroom with learning
materials designed ad hoc - were the computerized tools (mainly spreadsheets) are
available to the students at all times.
133
2.2 Beginning Algebra in a partially computerized environment
In the last decade and a half, several Algebra projects based on the partial use of
different kinds of computerized tools were developed, implemented and studied (e.g.
Dettori et al., 2001; Haspekian 2005; Hershkowitz et al., 2002; Kieran, 1992; Tabach
et al, 2006; Wilson et al., 2005; Yerushalmy & Schwartz, 1993). Some studies end up
questioning the integration of computerized tools into the algebra classroom, for
example, the potential of spreadsheets to express algebraic relationships in the form
of equations is challenged by Dettori et al. (2001). Others are concerned with the kind
of mathematics with which students engage in computerized learning environments
(Hershkowitz & Kieran, 2001), and/or with the shift of difficulties from one area to
another (Yerushalmy, 2005).
Other studies emphasize the contribution of computerized tools to the learning of
algebra, and their potential to address not only the syntactic aspects but also to focus
on understanding and on the development of symbol sense (e.g. Arcavi, 1994) and on
mathematical modeling. Furthermore, the claim is that the functional approach, which
lends itself so well to computerized environments, enables to present students with
different kinds of changing phenomena and opportunities for generalization and
modeling within several representations (e.g. Bednarz et al., 1996; Yerushalmy,
2005). Such aspects of algebra can be learned by making use of graphical, numerical
and symbolic representations whose static nature with paper and pencil become
dynamic in computerized environments. Students can choose a graphical, numerical
or a symbolic representation, or use them in parallel according to their needs and/or
personal preferences. These various representations might be used to contrast and
operate upon mathematical objects, thus, as Kaput (1992) states, they turn display
notation systems in a pencil and paper environment into action notation systems in
134

computerized environments. Changing representations can be observed, initiated, and
reflected upon becoming the sources of investigations and insight.
The use of computerized environments in algebra may also enable to amplify student
capabilities and to significantly change the nature of mathematical activity itself (Pea,
1985). Explorations with computerized tools encourage students to plan, to reflect, to
produce explanations and to engage in classroom discussions (Heid, 1995).
Appropriate and successful uses of technological tools in beginning algebra have
been described, for example with explorations of every day life problem situations
using several representations (e.g. Heid, 1995), with numerical experimentation
which evolves into functional connections (e.g. Kieran, 1992), and with
manipulations of symbolic and graphical representation of functions (e.g.
Yerushalmy & Schwartz, 1993).
Spreadsheets and beginning algebra learning
Following Hershkowitz et al. (2002), the selection of appropriate computerized tools
for teaching algebra was based on the potential of the tools to support: (i)
generalization (ii) mathematization (in the sense of Treffers, 1987; see also, van
Reeuwijk, 1995) and (iii) communication. Spreadsheets (e.g. those widely available,
like Excel) seem to fulfill these three criteria, and were widely studied as tools for
learning beginning algebra (e.g. Ainley, 1996; Filloy & Sutherland, 1996; Friedlander
& Tabach, 2001b; Haspekian, 2005; Hershkowitz et al., 2002; Sutherland & Rojano,
1993; Wilson et al., 2005).
Spreadsheets allow students to handle, observe, and generate a large number of
numerical instances, bridging the sometimes rapid and disconcerting transition
(described as "cut" by Sutherland & Rojano, 1993 and by Ainley, 1996) from
numbers to symbols, from arithmetic to algebra (Haspekian, 2005; Wilson et al,
135

2005). With the creation of numerical sequences out of existing ones by using either
symbolic rules (expressions, or formulae) and "dragging", or by representing numeric
data in graphical form, spreadsheets support the functional approach to Algebra, and
the envisioning of patterns which leads to generalization. Whereas mathematization
in general and generalization in particular are at the core of the activity, spreadsheets
enable students to remain within the numerical realm (handling large sets of
numerical data by "dragging") and to slowly get acquainted with the use, the purpose
and the power of symbols. Thus the learning of the symbolic language to express
generalization, to mathematize real world phenomena and as a means of
communication is introduced according to students’ needs, allowing for time to get
accustomed to it, within meaningful contexts.
The following are some characteristics of the mathematical work typical of beginning
algebra learning with spreadsheets, which are relevant to the analyses of data in this
study:
a) "Organization of data" and development of solution strategies. When
using spreadsheets, especially when working on relationships among
quantities, students need to consider efficient ways of data organization (Alrø
& Skovsmose, 2002). Such considerations can trigger productive data analysis
and reflection, and promote the need for the use of symbols to express general
relationships symbolically (Tabach & Friedlander, 2004).
b) Symbolic generalization. In pencil and paper environments, three stages
of generalization processes by pre-algebra students have been identified
(Arcavi, 1995; Friedlander et al., 1989; Hershkowitz & Arcavi, 1990). At a
first stage, students, even when aware that they should use symbols, tend to
represent quantities involved in a given situation by using different letters,
disregarding existing relationships between the quantities these letters
represent. For example, two consecutive numbers are often represented as a
and b (rather than as a, a+1), probably because consecutiveness is still
conceived within the alphabetical context, rather than as an arithmetical
136

property2 to be expressed by letters and numbers. At a second stage, students
learn to express relationships using symbols only partially. For example, two
consecutive numbers are written as a, a+1, but in other, more complex,
numerical relationships, still a different letter is introduced for a new related
quantity. Only at a third stage, students are able to express full relationships
among related quantities symbolically. It is only in the third stage that general
connections among variables appear and algebraic expressions are explicitly
written. Unfortunately, with paper and pencil, algebraic manipulations on
expressions which do not state full symbolic relationships obtained or proposed
do not usually lead to insightful results, if any. However, with spreadsheets,
students at all three stages may be able to operate, experiment, reflect and
learn, because large amount of numbers can be handled either by "dragging"
and taking a whole array of numbers (i.e. a column in the spreadsheet) as a
"variable" for another one (Dreyfus et al., 2001) or by the use of recursive
expressions, which emphasize local relationships between consecutive
elements such as cells in the same column (Tabach et al. 2006). It seems that
initially many students prefer recursive over explicit formulae (Friedlander &
Tabach, 2001b; Stacey & MacGregor, 2001). Such preference may indicate
the initial difficulties encountered to handle an explicit formula even when, in
many situations, it can be more efficient than recursivity. Spreadsheets provide
students with the possibility to remain in this middle ground between
arithmetic and algebra, where they slowly gain confidence with symbols, and
yet to be able to get and handle a changing phenomenon numerically, semi-
symbolically or even graphically and therefore are being able to generalize,
mathematize and communicate their results to each other. In fact, students
explore functional relations, even if unaware of it. A main concern of this
approach is that students may feel comfortable with it and thus remain attached
to the use of recursive expressions, making the introduction of explicit
expressions difficult.
2.3 Instrumental Genesis
When students introduced to use of computerized tools, they begin construct an image
of what the tool can and should do. This image is strongly related to their initial 2 Another possible reason may be students’ acquaintance with Gematria, according to which consecutive
letters of the Hebrew alphabet represent specific consecutive numbers (e.g. aleph is one, bet is two, etc.)
137

experiences, their previous beliefs, the perceived nature and goals of the activities to
be performed, the conversations with peers and the teacher, and their results of
spontaneous explorations and serendipitous discoveries, especially when the initiative
whether and how to use and experiment with the tool is left to them. In the sense of
Verillon & Rabardel (1995), a tool in the hands of a user together with the image the
user has developed (and continues to develop) of it, becomes an instrument. Thus,
instruments are actively constructed over time by individuals as they use the tool and
become more acquainted with it. Therefore, an instrument might vary from one
individual to the other even if they work on the "same" task with the same tool.
Verillon & Rabardel (1995) define instrumental genesis as the process of an
individual creating and changing the image of a tool during the performance of
different tasks.
Instrumental genesis is a theoretical construct proposed on the basis of empirical
findings (especially in mathematics classrooms using computers), describing diversity
of strategies to solve the same task with the use of the same tools, within the same
classroom (e.g. Artigue, 2002; Mariotti, 2002). Whole class discussions, orchestrated
by the teacher, can serve as an appropriate forum to talk about and share students’
personal instrumental genesis processes in order to further enhance them. Thus,
instrumental genesis involve not only cognitive processes, which change the nature of
the mathematics learned and re-position the difficulties thereof (Laborde, 2003;
Yerushalmy, 2005), they also involve socio-cultural processes, concerning both
individuals and whole classrooms, changing the dynamics of learning and teaching
(Lagrange et al., 2003).
3. Research goalsAs mentioned before, the study reported in this paper is part of a longitudinal research
on learning processes of beginning algebra in a CIE and its focuses on the description
and analysis of: a) a representative example of how a CIE functions (i.e. the work of
7th graders with one problem situation), b) issues of beginning algebra with a
functional approach using spreadsheets, and c) the processes of instrumental genesis
thereof.
4. Methodology
138

In this section, we describe: a) the setting (the CIE, the learning materials, and the
classroom functioning), b) the design of the present study, and c) the problem
situation.
4.1 The setting
In our CIE, students had access to a variety of tools available to students at all times.
In the present study, we focus on the use of spreadsheets with occasional reference to
the use of the word processor. Students had an ad-hoc learning textbook including
problem situations and tasks (with explicit instructions to use spreadsheets as a
working tool only at the beginning of the course and rarely elsewhere). Hence, soon
after students get acquainted with the possible uses of the tool to work on the problem
situations, they are free to choose whether, how and when to use the computerized
tools. The teacher supported and legitimized any of the choices students made,
allowing students to develop autonomy in learning and enabling a variety of processes
of instrumental genesis.
The learning materials
The learning materials of our CIE consist of an adaptation of the materials from the
CompuMath Project (Hershkowitz et al, 2002), developed for classes with limited
access to computers, but preserving its original design spirit, as follows:
Teaching and learning are based on the work of small heterogeneous
groups/pairs of students working on open problem situations, in which not only
products and results are encouraged, but also mathematical discussions among
students;
The teacher orchestrates and leads whole-class discussions to allow for the
communication, reflection upon and evaluation of each other’s ideas as well as
to support the consolidation of the mathematical concepts and processes
emerging from the groups’ work;
The potential for use of computerized tools includes affording more
opportunities for the use of different strategies of handling problem situations,
facilitating operations within and across representations, reducing the load of
mechanical work, and providing non-judgmental feedback on hypotheses
checking and on solution strategies.
Class management and working practices in CIE
139
The characteristics of the two experimental classrooms of this study and their
functioning were similar to any other regular class in the same school: their
composition was heterogeneous (in terms of ability levels) and grouped by age
learning at regular lesson times (90 minutes - two conjoined periods with no break,
starting and ending with the bell). Students carried their textbooks, some of them also
carried a notebook and pencils (others, decided to keep -and edit- their notebooks in
the computer using a word processor), they were assigned homework, and had
periodic assessment tests.
The physical setting consisted of a regular classroom with one computer for each pair
of students working together (only few students worked alone). Students had the
freedom to choose their partners. In general, a regular activity lasted 2 lessons and
had the following structure (see also Tabach et al., in press):
Initiation. The teacher read out loud a problem situation from the textbook,
made clarification remarks as needed, and checked for students’ understanding
of the task. This part took about 5 minutes, and students proceeded to work.
Students at work. Students worked in pairs or alone, and the teacher circulated
among them talking to students about their approaches, processes and thinking
strategies and answering technical questions regarding the computer use. When
a pair of students had a question and the teacher was not available, they turned
to their neighbors for help. The teacher sometimes initiated clarifying dialogues
with pairs that she knew may need special help.
Summary. About 20 minutes before the end of the period, the teacher asked the
students who worked on the computer to save their work, and proceeded to
conduct a whole class discussion. During the class discussion, the teacher
invited students to share their working strategies which were commented, and
requested to present alternative approaches (which she saw developing).
Strategies were examined for correctness, efficiency and originality. The
collective discussion of both fruitful and unfruitful (or incorrect) solution paths
were intended to encourage and support reflection, mutual respect and the
development of productive sociomathematical norms (Yackel and Cobb, 1996;
Hershkowitz & Schwarz, 1999). When needed, the teacher introduced relevant
formal terms, concepts and other knowledge she considered relevant for the
summary.
140

Homework assignment. Homework on classroom related work was assigned
after each lesson, some of which were presented in electronic files. Some
students handed in their assignments by e-mail.
The possibility of using the computer at all times for different purposes was
introduced to students from the very beginning of the school year. Spreadsheets and
its functions were introduced during the second lesson of the course with a guided
assignment (many students were acquainted with the tool from previous years).
Graphical representations were introduced during the third lesson.
4.2 The design of the present study
Our CIE for learning beginning algebra was fully implemented during two year-long
courses (7th grade), taught by the first author, who acted both as the teacher and as a
researcher (Tabach, 2006). In this paper, we focus on students’ work on one problem
situation, in which a total of 29 teams3 (15 in the first year and 14 in the second year)
worked on it. 21 (out of the 29) teams used the computer and saved their working
files (12 out of 15 (80%) in the first cohort, and 9 out of 14 in the second (64%)). Our
sources of data are:
All the 21 working files.
Audio-records from the work of 10 teams (5 from each cohort, randomly
selected).
A video-recording of 1 team of the first cohort (due to practical constrains video
could not be used further).
One video-recording from a whole class summary discussion.
The teacher’s diary with entries both before each single lesson (describing the
learning goals, plans, expectations), and immediately thereafter (including the
lesson description, informal perceptions, surprises and post-hoc reflection).
Field notes taken by another researcher (in the first year).
The work of the 10 audio-recorded groups and one video-recorded group on the
assignment, and the video recorded summary discussion were transcribed and
analyzed regarding the learning of algebra and the instrumental genesis processes. A
qualitative analysis of the recorded pairs was complemented by a quantitative analysis
3 We use the term team to indicate a pair or an individual student. Each team produced one piece of work .
141

of the work of all the students (saved in their files), and by the analysis of a few
episodes from the whole class discussion.
4.3 The Problem Situation: “Savings”
Savings is a concatenated sequence of three assignments (each of them intended for a
90 minute session), adapted from Resnick et al. (1999)4 in which students have to
explore the growth of different kinds of weekly savings during 52 weeks. In the
process, students learn (in context) the roles and meanings of constants and variables,
by using verbal, numerical, graphical and symbolic representations and by comparing
different kinds of growth phenomena. The three assignments exemplify the design
and implementation of the function approach to algebra in which growth and change
can be expressed by symbolic or "semi-symbolic" rules with or without spreadsheets,
and supported by verbal and graphical representations. When Savings was
administered (in the fourth week of classes and lasting for about two weeks), students
had had a gradual acquaintance and some experience with different representations,
and with the use of spreadsheet.
The first assignment presents four linear ways of weekly savings of pocket money
(see Figure 1). Each way is presented in a different representation, and students are
asked to compare them (Friedlander & Tabach, 2001a). Students may choose their
"favorite" representation (Dolev, 1996) in order to express with it all the four ways in
order to enable an easy comparison.
Insert Figure 1 about here
The second assignment introduces verbally a fifth way of saving with an exponential
growth, with a very small initial amount (Figure 2).
Insert Figure 2 about here
Representing exponential change with an explicit symbolic model is beyond the
algebra knowledge of beginners. However, the availability of a tools like spreadsheets
enables students to focus on the recursive relationship (between two consecutive
elements), and use the "dragging" capability to get a numerical and a graphical
representation of the phenomenon over a certain period of time. Exponential change is
surprisingly different from linear change for most students. They are asked to
hypothesize and then to investigate (using spreadsheets) the question of whether (and
if so, by how much?) an amount of money (saved according to the given exponential
4 The first Algebra textbook for 7th grade of the CompuMath Project.
142

rule) reaches or exceeds the amounts saved and explored in the first assignment (for a
detailed discussion, see Tabach et al., 2006).
The third assignment: The first part of this assignment focuses on symbolic
manipulations of linear expressions (Figure 3).
Insert Figure 3 about here
Since this assignment was administered during the fifth week of the course, students
had not yet learned how to add two symbolic expressions of the form ax + b. Hence,
their work was intended to be driven by the meanings of these expressions within the
situation, rather than by following syntactic rules. At this stage of their learning, the
students are able to perceive the expressions mostly as a compact way of stating a
verbal sentence, i.e. the expression 30 + 12x stands for the savings at a certain point
in time (week x), namely as the sum of the initial 30 NIS5 and the 12 NIS which are
added weekly.
The second part of this assignment brings implicitly to the fore the concept of
equation. Students are required to distinguish between increasing and decreasing
savings based on their symbolic representations, in order to find which combination
will first reach the needed amount. For that purpose, their attention should be turned
to both the initial condition (i.e. the starting amount expressed by the constant in the
formula y = ax + b) and the rate of change (expressed by the coefficient of the
variable).
There are no instructions or suggestions for using the computer to work on this
assignment; students could follow their own initiative, based on their previous class
experiences, preferences and expectations. From this point onwards, we focus on the
qualitative and quantitative data analyses of student work on the third assignment.
5. Data Analysis
This section includes:
- a brief description of how the lesson began (section 5.1);
- the analysis of the work of four pairs of students on the first part of the
assignment (section 5.2);
5 NIS is an acronym for the national currency: New Israeli Shekels.
143

- The analysis of the work of five pairs on the second part of the assignment
(section 5.3);
- quantitative data from the work of all students during this lesson (section 5.4);
- a description and analysis of the whole classroom discussion which
summarized the lesson (section 5.5).
5.1 Initiation
The out-loud reading of the problem by the teacher was interspersed with clarifying
questions such as: ‘how we can describe in words Moshon's savings?’ ‘What is the
meaning of the expression –20 + 4x which describes Eliran’s savings?’ Some students
wondered about the meaning of the negative sign in terms of the savings. Others
remarked that combining Danny’s savings with someone else’s would be unfair, since
he would not contribute to a joint effort to increase the savings. Yet, students were
willing "to play the game" of adding up the amounts. Thus, the introduction to this
lesson (which is similar to the introduction to other lessons in this course) served the
purpose of understanding the problem and to verbalize, clarify and comment on some
of its aspects.
5.2 Working processes on the first part of the third assignment
The following are examples from four pairs of students attempting to add linear
expressions. We bring different parts of their solution processes in order to emphasize
several yet complementary aspects of our findings.
Natally and Eli (two girls) discussed, the expressions for the joint savings of Dina (7x)
and Karin (10x), and Dina (7x) and Moshon (30+5x):
Natally: Dina gets 7 each week, and Karin gets 10 each week, so together they get 17 each week, 17x.
Eli: They will get the largest amount of money.
Natally: Dina and Moshon. If Dina gets 7, and Moshon gets 5, wait a minute! Moshon have here 30 NIS, yes? So 5+7=12, O.K., 30 + 12x.
Episode 1: Natally and Eli first task
This kind of dialog is typical of Natally and Eli: they "read" the meaning (in terms of
the situation) directly from the written symbolic expressions and use it as the basis
for creating the new expressions for the conjoined amount. We regard this as an
144

instance of symbol sense (Arcavi, 1994, 2005) which includes both the "reading" of
the expressions’ meaning and its use for operating on them. Although there was no
direct use of spreadsheets in this case, we attribute their flawless and meaningful
performance to both their reliance on a real situation and to their previous
experiences with handling at once many numerical instances of a phenomenon in
previous assignments (using spreadsheets).
What proficiency are these algebra beginners displaying? They are capable of adding
up two algebraic expressions correctly, (e.g. 7x+30+5x) without restoring to syntactic
rules (not learned yet) and avoiding the common mistake of adding constants to
coefficients which is not infrequent with many algebra beginners. This proficiency
was stable across time and we attribute it to the close contact the students kept with
the meaning of the expressions in the context of the situation.
Rina and Carmel (two girls) illustrate a somewhat different approach to adding up two
linear expressions. They worked hard to find the proper expression for Dina’s (7x)
and Danny’s (300-5x) conjoined savings (300+2x):
Rina: Danny gets 300 at the beginning of the year, and each week he goes down by 5. For her [Dina] it is going up by 7, meaning that it will go up only by 2.
Carmel: For her [Dina] it is going up by 7
Rina: 300 – 5x
Carmel: Yes, I know
Rina: His expression in parenthesis plus hers. [(300-5x)+7x. They check their expression for the first week by replacing the variable by 1] …
Rina: Good. But we need to find the shortest expression.
Carmel: I have an idea about what can we do. 300 - , like adding up this two, but, 300 – 2 * , not 2, yes 2.
Rina: She gets 7, he drops 5. No, it is not correct. She goes up by 7, he goes down by 5. Did you get it? 7-5=2!
Carmel: 300 – 2x [they calculate for x=7, and realize that they have a mistake.]
Carmel: Let's stay with our first expression.
Rina: It is so long! [Calling the teacher] Do we have to find a short expression?
Episode 2: Rina and Carmel first task
At the very beginning, Rina expressed verbally the correct answer for the shortest
expression ("… it will go up only by 2"). But, apparently Carmel was not yet ready
for the abbreviated form, and she retraced the steps of the calculation by following
145

Rina’s words. Rina returns to a long expression, either to convince Carmel or
herself, and they check it, but Rina then proposes to reduce the expression to a
simpler form. Carmel suggests to subtract the resulting 2x, upon which they agreed,
instead of adding it. Again they feel the need to check this suggestion against the
expected result, but the check does not yield the result sought. Since they are unable
to extricate themselves from the discrepancy between the meaning the expression
should convey and what it actually does, they decide to call the teacher and ask
whether they actually need to find a short expression. This exchange shows that: a)
also for these students, the manipulation of the symbolic expressions is driven by
their meaning in relation to the situation, b) in the two occasions that they produced a
new symbolic expression they feel the need to check whether it indeed expresses
what they intended, c) when meaning and syntax are in contradiction, they attach
prevalence to meaning, and question the need for a better syntactic outcome ("Do we
have to find a short expression?") which they feel they are still not sure how to
obtain, d) these students do not feel a need to use spreadsheet in this task.
With the help of the teacher they found the correct short expression. Rina and Carmel
managed to create the correct expressions for the rest of the joined saving amounts by
themselves.
Gal and Oryan (two girls) had the following exchange concerning another part of the
same assignment:
Gal: Moshon and Danny, 300 – 5x
Oryan: No, 330, 330 - 5x + 5x
Gal: Yes, you are right, in sum it is + 5x
Oryan: No!
Gal: No, it is with nothing, just "330" along the whole year!
Episode 3: Gal and Oryan first task
They started the discussion of the expression for Moshon’s (30 + 5x) and Danny's
(300 – 5x) combined savings (330) at the symbolic level, however, the meaning
underlies their conversation and appears when needed ("it is with nothing, just "330"
along the whole year!"). Gal and Oryan are constantly checking each other. Each of
them contributes to their joined work by developing her line of thinking while
considering her partner's ideas.
146

Yishay and Nissim (two boys) focused on the need of making clear the explicit
algebraic expressions for Moshon’s (30+5x) and Rubin’s (60+3x) conjoined savings
(90+8x) by overusing parenthesis.
Yishay: For Moshon and Rubin, (90) + (8)x
Nissim: No, we need only one parentheses, (90) + 8x
Yishay: Let's check with Excel
Nissim: No, I tell you, [Yishay opens Excel in spite of Nissim's reluctance]
Yishay: We will check on 1 [writes in Excel ‘=(90) + (8)*1", and in the next cell he writes ‘=(90) + 8*1’]
Nissim: It is the same! [both laugh]
Episode 4: Yishay and Nissim first task
As with the other pairs of students, meaning drives the symbolic actions, and initially
the parenthesis seem to be a secure way to keep track that both the 90 and the 8 were
obtained by adding up the constants and the variable terms respectively (and
separately). The correct answer for them should also reflect the traces of the process,
and should also express the distinct roles of the fixed and the changing amounts.
These students wanted the meanings to be reflected in the correct syntax. What are
the instrumental characteristics of the spreadsheet tool for these students? Firstly, they
attribute to it the authority to settle a doubt. Secondly, they know how to harness it for
their specific purpose: they write two seemingly different expressions which they
want to check if they are equivalent in contiguous cells, to let the tool calculate and
they check whether the result obtained is the same. The computerized tool was
effectively used for a syntactic uncertainty they posed to themselves. Yet we note, that
they seem to be satisfied with checking only one specific numerical case and was not
used to verify their conclusion with many numerical instances. We do not have
enough data to claim more about the instrumental nature of the computerized tool for
these students. It is possible that the reason for checking only one simple numerical
instance is that they were confident that the equivalence holds before their check and
it was the easiness of a simple check what led them to use the tool anyway. It is also
possible that they did not relate yet the power of the tool to check as many numerical
instances as they want to the need of establishing a general conclusion.
The above four episodes illustrate the findings in the three confluent areas under
exploration. Firstly, they show the functioning of a CIE in which the intensiveness is
reflected in the availability of the computerized tools at all times and not necessarily
their constant use and the way students enact their freedom to choose whether, how
147

and when to use it. Secondly, we can see how these algebra beginners develop
syntactic rules which are driven by a meaningful situation and by the need to express
and operate with functional relationships that reflect it. Thirdly, it illustrates the
instrumental views of a pair of students for whom the tool is envisioned as an easily
accessible authority to check (according to their understanding of what a check
consists of in this case).
5.3 Working processes on the second part of the third assignment
The second part of the assignment consists of comparing the changing amounts in
each joined savings to a given number, before any formal instruction on solving
equations. Three pairs of students decided to use spreadsheets to solve the problem,
whereas two other pairs used spreadsheets to solve a question they themselves posed.
The following are excerpts from the work of each of the first three pairs.
Natally and Eli had the following exchange when working to find the conjoined
savings which will first reach the amount of 400 NIS:
Natally: Let's make a table with Excel.
Eli: They need 400 NIS, they will not have it. [It is not clear to which pair she is referring].
Eli: They will!! [Still not clear to which pair she is referring].
Natally: Yes, but we also need to know in what week.
Episode 5: Natally and Eli second task - why to use Excel?
This short exchange indicates that Eli and Natally are aware of the nature of the task:
first, will a pair (not clear which, but it could be a general statement) reach the goal
of 400 NIS? And if so, in what week? Although they did not learn the concept of
equation explicitly, they already had a previous similar experience with looking for
and finding, with the aid of spreadsheets, the value of the variable which will yield a
certain result in another problem situation involving a "growth phenomenon". And
indeed Natally seems to know that spreadsheets can be helpful in finding the
information they are looking for: she explicitly states the need and the motivation for
using the tool extrapolating from a previous experience. The following exchange
reflects further their instrumental view of the tool.
Natally: Column A, read me the names of the pairs.
Eli: There are so many!
148

Natally: Never mind [Inputs in each column the names of one pair].
...
Natally: Dina and Karin, each week 17, so they start with 17, and each week they get 17 more. [Writes down a recursive formula in A3 =A2 + 17, and drags down the formula].
Eli: They will start with 30+12 [referring to Dina and Moshon], so in the first week they will have 42.
Natally: And each week 12. [Writes down in B3 =B2 + 12].
Episode 6: Nataly and Eli second task – recursive symbolic generalization in Excel
Their work continues and produces what is shown in Figure 4.
Insert Figure 4 about here
The computerized tool served as an organizational device, in which these students
decided to invest time and effort (There are so many! - Never mind). Furthermore,
they decide to make use of the recursive capability of the tool known to them, plus
dragging, in order to generate a numerical representation of the changing amounts, in
spite of the fact that a moment ago they themselves create an explicit symbolic
representation for the vary same phenomena (see episode 1). In this way, the tool
allowed them to keep the meanings visible: the first numerical cell (i.e. the second
cell of each column) was used in all cases for the amount of money attained after one
week of joining the savings, and then they defined the subsequent cells by recursively
adding the combined weekly increment.
Eli and Natally knew how to extract back from the expression 30+12x the meaning of
the 12 as being the weekly increment, but they decided to unpack their meanings and
use recursion, in order to have the tool do work for them. Their instrumental view led
them to resort to recursion and to create a new symbolic representation for each pair
of savings, by translating one symbolic representation into the other. We propose that
their understanding of the different roles of variables and constants was sharpened by
these actions. Thus, the instrument posed for them the need for further symbolic
generalization, and it also provided them information they thought was otherwise
impossible to obtain.
Rina and Carmel illustrates a different instrumental view at the service of learning
algebra. Rina read the second part of the assignment and said:
Rina: Let's work with Excel. Read me the pairs’ names. Wait just a moment – the number of weeks. [Inputs week #, in column A, see Figure 5 below].
149

[Carmel reads the pairs’ names and Rina writes them in each column]
Rina: O.K., now read me the expressions. Wait, first we will do 52 weeks.
Carmel: Equals 17 times the week number [Rina inputs ‘=17*A2’ for Dina and Karin]
[They go on with the other pairs, and drag down each expression].
Episode 7: Rina and Carmel second task – explicit symbolic generalization in Excel
Their work produces what is shown in Figure 5.
Insert figure 5 about here
Rina and Carmel, like Natally and Eli, started their work by making orderly use of the
organizational features of the tool. However, Rina and Carmel needed an additional
column in which to input the week number. The addition of this column reflects a
different instrumental view which is related to their use of explicit (as opposed to
recursive) symbolic expressions. The concise expression they produced for the first
task (17x), is read by Carmel as "17 times the week number", and correctly translated
by Rina into the spreadsheet language as ‘=17*A2’. Rina and Carmel (like Natally and
Eli) had no problem in moving from the given explicit symbolic expressions for
individual savings, via the verbal representation to the explicit notation of the joined
savings within the realm of their instrument.
Danielle and Amelia (two girls) also relied on the spreadsheets as an organizational
device, but their way of organizing was different. Like Rina and Carmel, they used the
first column for the week number, and then they devoted one column to each of the
savings of the two children (filled with explicit expressions), and a third column for
the combined savings using the previous columns as variables. Rather than proposing
a symbolic relationship for a generalization, these students combined the columns
numerically as it is easily afforded by the capabilities of the spreadsheet tool to bypass
the use of symbols. This use had consequences in the way Danielle and Amelia
organized the table (they wrote the saving box of Dina six times, each time in a
different "triplet" (see figure 6).
Insert Figure 6 about here
The next two pairs of students managed to successfully work through the second
assignment without using spreadsheets. However, they turned to the tool afterwards
to cope with questions that they posed for themselves.
150
Gal and Oryan used a mixed language of symbols and words to describe the
contextual features of the situation. For example: "this pair is with minus, they will
not be able to…" or "they will get it first, because they started high". They found the
week number for which the conjoined savings (330+5x) of Moshon (30+5x) and Yoni
(300) would reach the target of 400 NIS. The worked backwards, using a calculator,
as follows: 400 – 330, and then they divided the answer by 5. In this case, they felt no
need to turn to the tool.
The following dialog took place when Oryan and Gal discussed whether the combined
saving box of Danny and Eliran (280 – 1x) or that of Danny and Rubin (360 – 2x) will
have the least amount at the end of the year, a question which was not part of the
assignment, but posed by them for exploration:
Oryan: Maybe along the year the minus 2 will overcome the minus one.
Gal: Let's check it with Excel
Oryan: Why Excel?
Gal: In Excel we can drag a formula!
Oryan: I prefer not to use Excel.
Gal: It is more convenient with Excel.
Episode 8: Gal and Oryan - in need for Excel
Firstly, we speculate that both the meaningfulness of the situation and their
confidence on having some tools and skills (the ability to "read" through the explicit
symbols) to answer it, invited them to pose this task for themselves. Secondly, Oryan
seems to display understanding of the functional relationships in her attempt to
compare two such functions (note the use of the word "overcome" to expresses two
variations to be compared – this word emerged in previous classroom discussions and
was successfully appropriated here). Even when the level of confidence with
spreadsheets is not the same for both students, they finally resort to it in order to solve
the comparison problem. As opposed to the previous task (in which they compared a
symbolic equation to a number), here they need to compare two symbolic expressions.
The strategy of working backwards mentally is much less straightforward and natural
in this case. Thus, the instrumental view of these two students seems to lead them to
spontaneously prefer their informal and sense-making strategies when possible and
turn to the tool when they seem to reach the limits of their knowledge, and sense that
the tool can be very convenient. This is yet another instance in which an instrument
151

empowers students and pushes forward the boundaries of their knowledge and what
they can do with it.
Yishay and Nissim chose to work the combined savings of Yoni (300) and Karin
(10x) – a pair not suggested in the assignment – as the one who will first reach the
target of 400 NIS. They reasoned that if Yoni had the largest amount at the beginning,
and Karin gets the largest weekly amount, their combined savings will first reach the
target. A sound, sense-making but alas incorrect reasoning in this case. Then they
turned to a task they established for themselves: which of the joined saving boxes will
have the least money by the end of the year. They investigated the joined saving
boxes of Danny and Rubin (300-5x+60+3x), and Danny and Eliran (300-5x-20+4x),
and used spreadsheets as follows: in one cell they input
‘=360– 2*52’, and in another ‘=280 – 1*52’, (52 weeks), and compared the obtained
numbers. Also in this case, these students used the tool served them as a calculating
device to solve a self-posed problem. We note that their problem had a meaning
within the situation which was of interest to them. However, by fixing the week on
which they wanted to focus (the end of the year), they transformed the algebraic
nature of the other problems into an arithmetical one, and thus what they needed was
a calculation device.
Interim Summary
The following issues emerge from the previous analysis of work of the five pairs of
students on both parts of the assignment.
The diversity of approaches and the different instrumental views chosen by
different teams working with the same assignment and the same tool is
noticeable. We take this as an indication that an environment which a) offers
meaningful problem situations as springboards for learning mathematics, b)
provides appropriate tools to work with, and c) allows for autonomy to decide
when to use the tool and at what level of mathematical sophistication to work,
we can see evidences of successful learning of algebra. In our view, such
success is related to the way in which the environment allows a diversity of
approaches. Thus students in a class with these characteristics can be introduced
to algebra respecting their idiosyncratic ways of sense making: purely
arithmetical (adding columns), recursive (local generalization), and explicit
(global). These idiosyncratic ways are supported by tools which can become
flexible instruments for bridging between numbers to symbols.
152

Students used the tool after they identified a need, and envisioned that some
functions of the tool may be useful (or “convenient”) to meet that need. Such
envisioning is related to their instrumentation processes, of which we saw a
variety of examples.
In spite of the diversity of the ways in which peers solve the problem situation,
all of them seem to grasp the idea of phenomena of growth and change, and
(implicitly) the meaningful functional relationship among them. Also they
experienced the mathematical means to handle the phenomena: symbols, rules
of operations with symbols (so difficult to many beginners), equations and
strategies to solve them.
Students’ translations between the verbal and the symbolic representations were
central to their progress. The situation itself (Savings) became a leading
representation which served as the meaningful anchor against which students
checked their progress with the symbolic representations, and thus led the
choices when, how and when to use the tool and even to suggest new questions
to explore.
One of the instrumental uses of spreadsheets was to contrast results against their
expectations. This metacognitive function was for many students a central
feature of their instrumental genesis, fueled by their strong desire to keep close
to the meaning of the problem situation.
5.4 Quantitative analysis
This section is intended as complementary to the qualitative analysis and it is aimed to
show the extent and scope of the findings presented above. We analyzed
quantitatively the data from the 21 saved working files of all students from both
cohorts (12 teams from the first and 9 from the second, which include the work by the
pairs presented in the previous sections). The written files reflect the work of each
team at the end of the activity, and although their working processes may not be
always traceable, they also reveal the different processes of instrumental genesis
students went through. Whereas, in the first part of the assignment, most teams
(except Yishay and Nissim) did not make a "mathematical" use of the spreadsheets
(some used it as a notebook), many students turn to mathematical uses of the
computer in the second part. Thus, computer use seems to be a result of the students’
153

deliberate and thoughtful decisions driven by their needs for the tool and its potential
to serve those needs, rather than be its mere availability.
In the following, we analyze the use all students made of the computerized tools at the
service of their mathematics learning, in the second part of the assignment. We start
by proposing a broad distinction between "mathematical" and "non mathematical"
uses of a tool. In this Algebra course, the mathematical uses included calculations,
the generation and testing of generalization rules, the creation of numerical (and
graphical) representations, hypothesis checking, translation between representations,
and the like. Non-mathematical uses include writing, documenting, communicating,
saving and sending files. For the majority of teams, spreadsheets in particular and the
computer in general became a mathematical instrument. Three teams (two in the first
year and one in the second) used the computer only for the purposes of writing and
storing their notes (one used a word processor for their notebook, while the other two
teams used Excel as a notebook, because they found it more friendly for writing
symbolic expressions). Their calculations were apparently made with paper and
pencil.
In the following, we concentrate on three aspects of the mathematical use of
spreadsheets: (i) data organization (of individual and combined savings Table 1, four
central columns), (ii) choosing a representation with which to work (numerical tables
or graphs Table 1, first row), and (iii) choosing the type of symbolic representations
(adding columns, see Danielle and Amelia, recursive or explicit Table 1, second row).
The results are summarized in Table 1.
Insert Table 1 about here
(Since we have only the final state of students' work, we cannot report on the ways
students compared the joined savings to 400 NIS, and how they found when the
savings reached that sum). The table confirms that the variety and spread of working
strategies found in our qualitative analysis (section 5.2) is a representative of all the
teams in these two classes.
Note that the files analyzed were created by the students after completing the first task
– namely, all groups had already created on paper and pencil explicit symbolic
expressions to represent the combined savings. Therefore students had the explicit
expressions at their disposal for using with their spreadsheet files. Table 1 shows that
indeed 9 teams (out of 18) used explicit expressions - the most efficient and
154

sophisticated strategy to express the growth and change of the combined savings. The
remaining 9 teams created alternative approaches. In the following, we briefly
describe these other strategies, however, in the absence of records of the working
processes which produced the written records, our interpretations may be speculative.
The instrumental generation of a graphical representation for the growth of the
individual savings by one pair of students. There are field note records from
these students showing that they explicitly expressed their willingness to "see
the savings of each child graphically". These students first created a numerical
representation of the savings over time using a recursive symbolic strategy, and
then proceeded to create the graph. This piece of data is not only another
confirmation of the variety of approaches, but it is also an indication that
students exerted their autonomy and felt it was legitimate to proceed on the basis
of their curiosity.
We found three interesting strategies for the instrumental generation of a tabular
representation. One team of students expressed the individual savings with
explicit expressions, but used a recursive expression for each of the combined
amounts, a mixed perception of the instrument as both - recursive and explicit.
Three teams used explicit expressions to represent the individual saving, and did
not use spreadsheets to represent the combined amounts. Two other teams
represented explicitly the individual saving growths in spreadsheets, and then
choose to add these columns cell by cell (bypassing the use of algebraic
symbolism) to obtain the combined amount over time (e.g. Danielle and Amelia,
see Figure 6 above). Why did some students choose not to use their own explicit
expressions of the combined saving growths, from the first task, and preferred to
resort to their sources? We propose several possible explanations. Whereas in
the first part of the assignment, there is a precise request to produce explicit
expressions, there is no specific guidance as to how to approach the second part
in which students have to compare a combined growth to 400 NIS, that is to
solve an equation. Since students had not yet learned how to solve equations
some of them lean back on the problem-situation, as a leading representation to
solve the problem. Another possible explanation is that students working with
spreadsheets, especially beginners, tend to use recursive notations (Stacey &
MacGregor, 2001). Our students have previously used recursive strategies
successfully (including in the previous two assignments – Fig. 1 and 2), and
155

therefore it makes sense to them (or it is safe) to go back to recursion. For some
students it also reasonable to assume that they are fully aware of the calculation
capabilities and the expediency of the computerized tool and thus they turn to it
for quick results. Regardless of the reason students had for their different
choices of strategies, (which reflect different symbolic approaches to express
generalization as well as different instrumental views) the results indicate that
the tools in this CIE provided students with the freedom to work at the level
with which they feel comfortable, or with which they like.
5.5 Whole class discussion (the lesson summary)
In this section, we present parts of the transcript of three episodes from the class
discussion that took place (in the first year) after students worked on the problem
situations described above. These episodes are representative of the class discussions
conducted by the teacher as "lesson summary" (as described in section 4.1). These
data complements the findings from the qualitative and quantitative analyses
presented above, and may help to better understand the functioning of this CIE, in
which students with different approaches, different instrumentation views of the same
tool, and at different levels can live together, be exposed to others’ ideas, find ways to
express and defend their own, and engage in exchanges and discussions, even when
participants are at different points in their algebraic proficiency and understandings.
Episode 1: Can meanings always come to the rescue? - When mathematical and
contextual meanings are at odds.
We have already described several instances in which students applied several
syntactic rules of algebra even before learning them formally on the basis of the
contextual meaning of the problem situation. Thus the problem situation became
another representation to think with as well as the basis for learning some algebraic
rules. What happens when the different solutions of a problem situation come in
contact with each other? It is hoped that the expected mutual listening would enrich
and support the learning processes. However, other things may happen as well, as it is
the case in the following exchange.
Teacher: Which pair will be the first to buy the Walkie-Talkie?
Yishay: Yoni and Karin, because Yoni starts with the largest amount, and Karin gets the largest amount each week [the teacher records the suggestion on the board]
Teacher: [To all students] What do you think?
156

Rina: There is a quicker pair, Danny and Yoni, they had 600 from the beginning of the year [the teacher writes the suggestion on the board]
Natally: But Danny is taking away 5 every week, and at the end of the year he will have only 40. If he buys the Walkie-Talkie at the beginning of the year, he will end up with a minus in his account. [Many students expressed their point of view refuting Natally's comment, but Natally was not convinced by their arguments, and asked the teacher to write also her suggestion on the board] Yoni and Moshon, 330 + 5x, since they had 330 at the beginning of the year, and each week added 5 [if only pairs given at the first task are considered, Natally’s suggestion is correct].
Episode 9: class discussion, part 1
Yishay suggested a common sense strategy: look at the largest departure point and at
the largest pace of increase (unfortunately they pointed to the wrong pairs). However,
Rina saw it differently, if you have 600 NIS from the very beginning, the problem is
fully solved. Natally disagreed, one should look at what happens next, and those who
started with 600 NIS will end up with a debt, which is unacceptable. In this case,
comparing solutions led to the interpretation of the problem situation in its largest
context, different interpretations lead to different solutions. Nowhere in the problem it
is stated that the students should end up not owing money, and thus the contextual
meaning and the ways you are inclined to read the problem situation may have an
impact on the acceptance or rejection of a solution. This episode shows that in a
classroom where the environment provides contextually rich problem situations,
different tools to approach them and freedom to discuss and choose solution
approaches, lively discussions may emerge with unexpected yet very sensible
viewpoints. However, in this case, the contextual meaning was not a springboard to
learn algebra, but a crossroads on which a certain interpretation of the problem
conditions must be agreed upon. Whereas Yishay was presenting a mathematically
general strategy, Natally disagreed on the terms of the problem. This and other kinds
of disagreement illustrate how students enacted a socio-mathematical norm: making
collective sense of a problem is at the core of the classroom activity and it is central to
the solution process. We conclude from this episode that in environments of the kind
described, when students confront their ideas, not always the mathematics prevails,
yet it still may be at the service of a lively discussion.
Episode 2: Comparing and contrasting approaches
Teacher: How did you find the answer to this task [the second part of the assignment]?
157

Noam: I used Excel
Teacher: In what way?
Noam: I wrote in each column the savings of an individual child, and dragged it down for 52 weeks. Then I looked at each column for an amount of 200, and then I looked at the second column to make 400.
Teacher: I understand. Do you have other suggestions?
Rina: I used each column for the savings of one pair, dragged it down for 52 weeks, and looked for 400.
Teacher: Yes. Noam, do you understand the way Rina described?
Noam: Yes
Teacher: Other options?
Dianna: I did not work that way, I started like Noam, but I could then use more columns, and add up two columns for each combined savings box.
Episode 10: class discussion, part 2
This dialogue illustrates how students listen to each other and establish ways of
comparisons. Dianna could recognize in Noam’s approach traces of her strategy, but
she could also show in which ways hers was different, by using the tool to do more
work for her instead of visually examining (as Noam did) a list of partial results.
Dialogues of this kind exemplify that our CIE provided opportunities to fruitful
exchanges: students not only had the freedom to work as they pleased, they also had
the obligation to insert there work in the larger picture of the whole class.
Episode 3: Reclaiming the freedom
Eden: Do we have to work with Excel?
Teacher: There is no obligatory way of working. You may choose to work in a way that you think is correct, easy and efficient. One can use pencil and paper and another one will use the computer. Could we find an answer if we did not had the computer?
Yoni: Yes, for some pairs we did not have to check, like Danny and Eliran, 280 – 1x, which we can see from the formula that their sum decreases.
Teacher: Yes, for some pairs you saw decreasing amounts. What about the pairs for which the amounts increase?
Eli: Yes, by looking at the amounts of the beginning of the year, and by looking at the sums that they received each week.
Episode 11: class discussion, part 3
Classroom discussions brought to the fore not only mathematics but also issues
related to the tool use and instrumentation processes. Freedom of choice although
allowed, enacted and talked about may still be needed reconfirmation in the light of
what others do. Eden knew that she had no obligation to use the computerized tool
158
but in the light of the public discussion in which others mention their ways of using
the tool (which might affect her own the image of the tool); she apparently needed
reassurances that indeed not using the tool is fair game. Yoni replies, that in some
cases a quick check saves from you any tool use or calculation, you quickly inspect an
expression to realize that you can discard it outright. Eli seems to agree, and
generalizes echoing what Yishay said in episode 9: see which is larger from the
beginning and which has the largest weekly increase, and you’ll solve the problem.
Summary. The classroom discussion provides opportunities to students to
communicate about their strategies, to air their misunderstandings, to "negotiate" the
meaning of the problem situation and to discuss when and why using or not using
certain tools. Thus whole class discussion enables the formation and is driven by
socio-mathematical norms which legitimize these activities and is an integral
component of this CIE.
In this analysis we do not focus to which extent these exchanges had an impact on
each of the individuals engaged in the conversation. Rather our point was to show that
the CIE we designed and implemented provides opportunities for learning in at least
two complementary settings: when students worked in pairs (or alone) and when
students engaged in collective discussions of the kind described above.
6. Concluding remarks
As stated at the beginning, this study is part of a large project which lies at the
confluence of three themes: computer intensive environments, learning of beginning
algebra and the processes of instrumental genesis. This paper is an attempt to show
that by conflating the three issues, we made some contribution to each of them.
CIE: We showed an existence proof that mathematics can be as good a candidate for a
computer intensive environment as any other school subject. The main characteristics
of our CIE were the availability of computerized tools at all times, both for
mathematical and general uses, and student freedom to choose if, when and how to
use these tools. Our environment also included a) an ad-hoc curriculum with
contextually rich problem situations, b) a teacher who also acted as a reflective
practitioner and as a researcher, and c) a set of socio-mathematical norms. We claim
that ours is only just an example of how a CIE can be designed, implemented and
studied, and many others can and should follow in mathematics. Not only the tools
159

become pervasive and will be an inseparable part of the school of the future, but also
the nature of the mathematics learning may make the lessons more engaging and
effective. We claim that it is the obligation of the mathematics education community
to design and implement such environments because the computerized tools are out
there and teachers should not be left with the tremendous (and impossible) burden of
deciding by themselves what to do with them and how.
Algebra: What did these students learn during their work on the problem situation?
According to the data presented, we claim that they learned some mathematics and
they also learned how to learn mathematics. Mathematically, these students learned
certain aspects of how to:
harness both their sense-making and the contextual features of the problem
situations in order to develop solution strategies and sound mathematical
products (at different levels of sophistication) which were meaningful to them,
represent linear growth phenomena modeling contextual situations with
symbols, tables and graphs, keeping meaningfulness at hand,
operate with a symbolic model (including the basics of syntax, which usually
cause difficulties for many students in traditional environments, when taught
through decontextualized assignments), and
use situations to learn mathematics and conversely to use mathematics in order
to enhance their understanding of the situations explored, and thus gain power
over them.
Given the characteristics of the CIE, and considering the fact that the activity we
analyzed here is representative of a whole year of school work, the students also
learned how to learn mathematics. For example:
to become aware of representational choices and enact them,
to discuss problem solving processes and approaches with a partner and with the
whole class, and to reflect (both "online" and a-posteriori) about their own and
others’ thought processes,
to consider issues of economy, efficiency and even aesthetics of mathematical
activity (even when the students’ sense of them are in stark contrast with those
of an expert),
160

to respect each other ideas, and yet to dissent when mathematical correctness is
at stake,
to relate to the teacher as a source for guidance rather than a source for asserting
correctness of mathematical results.
Instrumentation: We observed different processes of instrumental genesis at the
service of learning algebra. Students learned to harness existing tools and to convert
them into instruments in personal and idiosyncratic ways, by adapting the tools to
their organizational needs and to their thinking and problem solving processes (and
vice versa, namely by adapting their thinking process to the possibilities they see in
the tool). They experienced the freedom to choose the tools and adapt them and also
they were exposed to the ways other do so.
This study also opens up a set of yet unresolved issues – we raise two of them, the
first related to the very nature of learning and the second to replicability (or, better,
the implementation of this and similar experiences).
The nature of learning. We can simplistically assert that a main characteristic of the
intellectual development of mankind is the ongoing creation of "amplifiers of mind"
(Pea, 1985) that seem to supersede each other. Humans create tools that become
instruments which enable either to amplify our existing cognitive capabilities or to
enable us doing things in a completely new and different manner. In this paper, we
exemplified how students learned beginning algebra by creating their own instruments
out of the tools at hand. More research is needed to find out whether students’ later
progress is not hindered by these instruments. We tend to get used to successful ways
of work, regardless of the existence of better or more advanced ones, thus, would
generalization by the "adding columns" strategy, or the recursive approach to
spreadsheets, or the use of spreadsheets in general for this matter, remain "fixed" as a
student working habit and impede progress? Or would this intermediate step be
indeed another (more effective) means to learn the explicit formula, and algebra in
general? In general terms, would the "fading" of the "scaffolds" successfully take
place in this case, when and how?
Implementation. Assuming that our trial can be considered successful (in spite of the
open questions of the previous paragraph), it is still a small scale trial. Moreover, the
teacher is a researcher who has a supportive research community to assist and support
her on issues of curriculum development, reflection, doubts and the like. By providing
161

a designed curriculum and a set of desirable norms to enact, one provides only the
initial conditions for a CIE to work. Attending to the daily demands of managing such
a class, being attentive to tens of kids, each with his/her own approach, and yet
fulfilling the demands of an official syllabus, could be enormously demanding for a
teacher. Supporting groups for teachers might be appropriate when implementing
such learning environment. Although there are many strategies for implementation, it
is still an open challenge.
162

References
Ainley, J. (1996). Purposeful contexts for normal notation in spreadsheet environment.
Journal of Mathematics Behavior, 15, 405-422.
Alrø, H., & Skovsmose, O. (2002). Dialogue and learning in mathematics education -
intention, reflection, critique. Dordrecht, The Netherlands: Kluwer Academic Publishers.
Arcavi, A. (1994). Symbol sense: informal sense-making in formal mathematics. For the
Learning of Mathematics. 14(3), 24-35.
Arcavi, A. (1995). Teaching and learning algebra: Past, present and future. Journal of
Mathematical Behavior, 14 (1), 145-162.
Arcavi, A. (2005). Developing and using symbol sense in mathematics. For the Learning of
Mathematics, 25(2), 50-55.
Artigue, M. (2002). Learning mathematics in a CAS environment: The genesis of a reflection
about instrumentation and the dialectics between technical and conceptual work.
International Journal of Computers for Mathematical Learning, 7, 245-274.
Bednarz, N., Kieran, C., Lee, L. (Eds.) (1996). Approaches to Algebra. Perspectives for
Research and Teaching. Dordrecht, The Netherlands: Kluwer Academic Publishers.
Dettori, G., Garuti, R., & Lemut, E. (2001). From arithmetic to algebraic thinking by using a
spreadsheet. In R. Sutherland, T. Rojano, A. Bell, & R. Lins (Eds.), Perspectives on School
Algebra (pp. 191-208). Dordrecht, The Netherlands: Kluwer Academic Publishers.
Dolev, O. (1996). The passage between representations as an action of characterizing student's
learning in an interactive computer based environment. Unpublished dissertation, The
Hebrew University of Jerusalem.
Dreyfus, T., Hershkowitz, R., & Schwarz, B. B. (2001). Abstraction in context: The case of
peer interaction. Cognitive Science Quarterly. An International Journal of Basic and Applied
Research, 1 (3&4), 307-358.
Filloy, E., & Sutherland, R. (1996). Designing curricula for teaching
and learning algebra. In A.J. Bishop, K. Clements, Keitel, C., Kilpatrick, J.
& Laborde, C. (Eds.), International handbook of mathematics education
(pp. 139-160). Dordrecht, The Netherlands: Kluwer Academic Publishers.
Friedlander, A., Hershkowitz, R., & Arcavi, A. (1989) Incipient "algebraic" thinking in pre-
algebra students. Proceedings of the 13th Conference of the International Group for the
Psychology of Mathematics Education, Vol. 1 (pp. 283-290). Paris, France.
163

Friedlander, A. & Tabach. M. (2001a). Promoting multiple representations in algebra. (pp. 173-
185). In A. A. Cuoco & F. R. Curcio (Eds.) The Roles of Representation in School
Mathematics. 2001 Yearbook. Reston, Virginia: The National Council of Teachers of
Mathematics.
Friedlander, A & Tabach, M. (2001b). Developing a curriculum of beginning algebra in a
spreadsheet environment (Vol. 1 pp. 252-257). In H. Chick, K. Stacey, J. Vincent & J.
Vincent (Eds.). The Future of Teaching and Learning of Algebra, Proceedings of the 12th
ICMI Study Conference. The University of Melbourne, Australia.
Gardner, J., Morrison, H., & Jarman, R. (1993). The impact of high access to computers on
learning. Journal of Computer Assisted Learning 9, 2-16.
Haspekian, M. (2005). An ”instrumental approach” to study the integration of computer tool
into mathematics teaching: the case of spreadsheets. International Journal of Computers for
Mathematics Learning, 10(2), 109-141. Kluwer academic publishers.
Heid, M. K. (1995). Curriculum and Evaluation Standards for School Mathematics, Addenda
Series: Algebra in a Technological World. Reston, Virginia: The National Council of
Teachers of Mathematics.
Hershkowitz, R., & Arcavi, A. (1990). The interplay between student behaviors and the
mathematical structure of problem situations - issues and examples. Proceedings of the 14th
Conference of the International Group for the Psychology of Mathematics Education, Vol. 2
(pp. 193-200). Oaxtepec, Mexico.
Hershkowitz, R., Dreyfus, T., Ben-Zvi, D., Friedlander, A., Hadas, N., Resnick, T., Schwarz,
B.B., & Tabach, M. (2002). Mathematics curriculum development for computerized
environments: A designer-researcher-teacher-learner activity. In L.D. English (Ed.)
Handbook of International Research in Mathematics Education (pp. 656 – 694). Mahwah,
NJ: Lawrence Erlbaum Associates.
Hershkowitz, R., & Kieran, C. (2001). Algorithmic and meaningful ways of joining together
representatives whithin the same mathematical activity: An experience with graphing
calculators. In M. van den Heuvel-Panhuizen (Ed.), Proceedings of the 25st Conference of the
International Group for the Psychology of Mathematics Education. Vol. 1 (pp. 96-107).
Utrecht, The Netherland.
Hershkowitz, R., & Schwarz, B.B. (1999). The emergent perspective in rich learning
environments: some roles of tools and activities in the construction of sociomathematical
norms. Educational Studies in Mathematics, 17 (1), 1-18.
164

Kaput, J. (1992). Technology and mathematics education. In D.A. Grouws (Ed.), Handbook of
Research on Mathematics Teaching and Learning (pp. 515-556). Reston, VA: National
Council of Teachers of Mathematics.
Kieran, C. (1992). The learning and teaching of school algebra, In D. A. Grouws (Ed.) ,
Handbook of Research on Mathematics Teaching and Learning, A Project of the National
Council Teachers of Mathematics, pp. 390-419, Reston, VA: National Council of Teachers
of Mathematics.
Laborde C. (2003) Technology used as a tool for mediating knowledge in the teaching of
mathematics: the case of Cabri-geometry, Proceedings of the 8th Asian Technology
Conference in Mathematics, In Wei-Chi Yang, Sung Chi Chu, Tilak de Alwis, Ming Gong
Lee (Eds.), (Vol. 1, pp. 23-38) Chung Hua University, Hsinchu Taiwan ROC.
Lagrange, J.B., Artigue, M., Laborde, C. & Trouche, L. (2003). Technology and mathematics
education : a multidimensional study of the evolution of research and innovation, In A.J.
Bishop, M.A. Clements, C. Keitel, J. Kilpatrick, & F.K.S. Leung (Eds). Second
International Handbook of Mathematics Education, 239-271. Dordrecht : Kluwer Academic
Publishers.
Lewis S. (2005). Laptops in the Middle School Mathematics Classroom. (pp. 267-280), In W.
J. Masalski (Ed.), Technology-Supported Mathematics Learning Environments (Sixty-
seventh Yearbook). Reston, Virginia: The National Council of Teachers of Mathematics.
Mariotti, A. (2002). Technological advances in mathematics learning. In L. English (ed.),
Handbook of International Research in Mathematics Education. (pp. 695-723) Mahwah NJ:
Lawrence Erlbaum.
Pea, R.D. (1985). Beyond amplification: Using the computer to reorganize mental functioning.
Educational Psychologist, 20 (4), 167-182.
van Reeuwijk, M. (1995). Students knowledge of algebra. Proceedings of the Eighteenth
International Conference for the Psychology of Mathematics Education (PME 19, Vol. 1,
pp. 135-150). Recife, Brazil: Universidade Federal de Pernambuco.
Resnick, Z., & Tabach, M. (1999). A travel to the land of Oz (Textbook from The Mathematical
Chapters Series for 7th grade). In Hebrew. The Department of Science Teaching, The
Weizmann Institute of Science, Israel.
Rockman et al. (1997). Report of a Laptop Program Pilot. Retrieved Mars 15, 2006, from
http://www.microsoft.com/education/downloads/aal/resrch_1.rtf
165

Rockman et al. (1998). Powerful Tools for Schooling: Second Year Study of the Laptop
Program. Retrieved Mars 15, 2006, from
http://www.microsoft.com/education/downloads/aal/research2.rtf
Rockman et al. (1999). A More Complex Picture: Laptop Use and Impact in the Context of
Changing Home and School Access. Retrieved Mars 15, 2006, from
http://download.microsoft.com/download/8/d/c/8dc3ebfe-6849-4534-a4b7-846a8c327874/
Research3Report.doc
Stacey, K., & MacGregor, M. (2001). Curriculum reform and approaches to algebra. In R.
Sutherland, T. Rojano, A. Bell, & R. Lins (Eds.), Perspectives on School Algebra (pp. 141-
153). Dordrecht, The Netherlands: Kluwer Academic Publishers.
Sutherland, R., & Rojano, T. (1993). A spreadsheet approach to solving algebra problems.
Journal of Mathematical Behavior, 12, 353-383.
Tabach, M. (2006). Research and teaching – Can one person do both? A case study. In J.
Novotna, H. Moraova, M. Kratka and N. Stehlikova (Eds.), Proceedings of the 30th
Conference of the International Group for the Psychology of Mathematics Education.
Prague, Czech Republic: PME.
Tabach, M., Arcavi, A., & Hershkowitz, R. (Submitted). Students' development of symbolic
representations in a computer intensive environment for learning algebra. Submitted to
Educational Studies in Mathematics.
Tabach, M., & Friedlander, A. (2004). Levels of student responses in a spreadsheet-based
environment. In M. J. Hoines & A. B. Fuglestad (Eds.), Proceedings of the 28th International
Conference for the Psychology of Mathematics Education, Vol. 2 (pp. 423-430). Bergen,
Norway.
Tabach, M., & Friedlander, A. (2006). Solving equations in a spreadsheets environment. In C.
Hoyles, J. B. Lagrange, L. H. Son & N. Sinclair (Eds.). Proceedings of the 17th ICMI Study
Conference "Technology Revisited" (pp. 539-545). Hanoi, Vietnam: Hanoi University of
Technology. (CD-ROM).
Tabach, M., & Friedlander, A. (submitted). Understanding equivalence of algebraic expressions
in a spreadsheet-based environment. Submitted to International Journal of Computers in
Mathematics Education.
Tabach, M., Hershkowitz, R., Arcavi, A. & Dreyfus, T. (In press). Computerized environments
in mathematics classrooms: A research - design view. To appear in L. D. English (Ed.),
166

Handbook for International Research in Mathematics Education, 2nd edition. Mahwah, New
Jersey: Lawrence Erlbaum Associates.
Tabach, M., Hershkowitz, R., & Schwarz, B.B. (2006). Constructing and consolidating
algebraic knowledge within dyadic processes: A case study. Educational Studies in
Mathematics.
Treffers, A. (1987). Three dimensions. A model of goal and theory description in mathematics
education. Dordrecht, The Netherlands: Kluwer.
Vérillon, P., & Rabardel, P. (1995). Cognition and artifact: A contribution to the study of
thought in relation to instrumented activity. European Journal of Psychology in Education, 9
(3), 1-33.
Wilson, K., Ainley, J., & Bills, L. (2005). Naming a column on a spreadsheet: Is it
more algebraic? In D. Hewitt & A. Noyes (Eds.), Proceedings of the Sixth British
Congress of Mathematics Education (pp. 184-191).Warwick, U.K.
Yackel, E., & Cobb, P. (1996). Sociomathematical norms, argumentation, and autonomy in
mathematics. Journal for Research in Mathematics Education, 27 (4), 458-477.
Yerushalmy, M. (2005). Challenging known transitions: Learning and teaching algebra with
technology. For the Learning of Mathematics 25 (3), 37-42.
Yerushalmy, M. & Schwartz, J. (1993). Seizing the opportunity to make algebra
mathematically and pedagogically interesting. In T. A. Romberg, E. Fennema & T. P.
Carpenter (Eds.), Integrating Research on Graphical Representation of Functions (pp. 41-
68).
167

FiguresThe savings of Dina, Yonni, Moshon and Danny changed during the last year, as described below. The numbers indicate amounts of money in NIS at the end of each week.Dina: The table shows how much money Dina had saved at the end of each week. The table continues in the same way for the rest of the year.
Week 1 2 3 4 5 6…Amount 7 14 21 28 35 42…Yoni: Yoni kept his savings at 300 NIS throughout the year.Moshon: The graph describes Moshon's savings at the end of each of the first 20 weeks. The graph continues in the same way for the rest of the year.
Danny: Danny's savings can be described by the expression 300 – 5x, where x stands for the number of weeks.
Figure 1: The first assignment
Efrat received her allowance in the following way:On the first weekend, she got two cents. Every weekend that followed, she received an amount identical to the amount she had left in her savings box the previous week. Efrat saves all the money she gets.
Figure 2: The second assignment
168

Buying a Walkie-Talkie
The following expressions describe the savings box of different children (x denotes the number of the week).
Dina 7x Yoni 300
Karin 10x Rubin 60 + 3x
Moshon 30 + 5x Eliran -20 + 4x
Danny 300 - 5x Moti -70 + 7x
At the beginning of the year Eliran had a debt, and each week he added 4 NIS to his box.
The children decided that, in order to be able to buy sooner a Walkie-Talkie costing 400 NIS, they will join pairs of saving boxes.
1. Find expressions, as short as possible, to describe the amounts of money in the joined saving boxes of the following pairs. (Try first to express verbally the joined savings for each week).
Dina and Karin ____________ Moshon and Danny __________
Dina and Moshon __________ Moshon and Yoni ___________
Dina and Danny ____________ Moshon and Rubin __________
Dina and Yoni ______________ Moshon and Eliran __________
Dina and Rubin _____________ Moshon and Moti ___________
Dina and Eliran ____________ Danny and Rubin ___________
Dina and Moti ______________ Danny and Eliran ___________
2. Which of these pairs (or perhaps another possible pair), will be the first to collect the 400 NIS needed to purchase the Walkie-Talkie?
Figure 3: The third assignment
169

A B C D E F G H1 Dina and
KarinDina and Moshon
Dina and Danny
Dina and Yoni
Dina and Rubin
Dina and Eliran
Dina and Moti
Moshon and
Danny2 17 42 302 307 70 -9 -56 330
3 =A2+17 =B2+12 =C2 + 2 =D2 + 7 =E2 +10 =F2 +11 =G2+14 =330
4 =A3+17 =B3+12 =C3 + 2 =D3 + 7 =E3 +10 =F3 +11 =G3+14 =330
Figure 4: Parts of the Excel table produced by Natally and Eli
A B C D E F G1 Week # Dina and
KarinDina and Moshon
Dina and Danny
Dina and Yoni
Dina and Rubin
Dina and Eliran
2 1 =17*A2 =30+12*A2 =300+2*A2 =300+7*A2 =60+10*A2 =-20+11*A2
3 2 =17*A3 =30+12*A3 =300+2*A3 =300+7*A3 =60+10*A3 =-20+11*A3
4 3 =17*A4 =30+12*A4 =300+2*A4 =300+7*A4 =60+10*A4 =-20+11*A4
Figure 5: Parts of the Excel table produced by Rina and Carmel
A B C D E F G1 Week # Dina Karin Dina and
Karin Dina Moshon Dina and Moshon
2 1 =7*A2 =10*A2 =B2+C2 =7*A2 =30+5*A2 =E2+F2
3 2 =7*A3 =10*A3 =B3+C3 =7*A3 =30+5*A3 =E3+F3
4 3 =7*A4 =10*A4 =B4+C4 =7*A4 =30+5*A4 =E4+F4
Figure 6: Part of the Excel's table produced Danielle and Amelia
170

TablesTable 1: data about the different aspects of the mathematical uses of Excel
Uses of Excel Table generator Graph generator
Working strategies
Year
Individual saving
Explicit
Combined savings
Recursive
Combined savings
Explicit
Individual + Combined savings
Explicit + addition of columns
Individual savings
Recursive
First 2 files 1 file 5 files 1 file 1 file
Second 2 file No files 4 files 2 file No files
Total 4 files 1 file 9 files 3 files 1 file
171

Tabach M. & Friedlander, A. (Under revision). Understanding equivalence of
algebraic expressions in a spreadsheet-based environment. Submitted to
International Journal of Computers in Mathematics Education. (Paper 6)
Whereas in previous papers student work was analyzed through realistic problem
situations involving changing phenomena, this paper focuses on a purely
mathematical context of inquiry: transformational activities in general, and the
distributive law in particular. The qualitative and quantitative analyses of students’
work are based on a sequence of computer-based assignments, classroom lessons, and
an assessment activity. The findings indicate the benefits of using spreadsheets at the
initial stages of learning algebraic transformations because they support the
preservation of numerical meaning of equivalent expressions, promoting connections
and transitions between numerical sequences and their corresponding algebraic
symbolizations. The findings presented here are in agreement with the findings from
previous papers: spreadsheets enabled engagement with meaningful algebraic
activities in which different students adopted different learning strategies and solution
processes that produced a variety of symbolic expressions. This variety provided raw
material for spontaneous and authentic reflective discussions about the meaning,
efficiency, and elegance of the different solution processes and their results.
172

Paper 6
Understanding equivalence of algebraic expressions in a
spreadsheet-based environment
Michal Tabach and Alex Friedlander
The Weizmann Institute of Science
Rehovot, Israel
173

Understanding Equivalence of Symbolic Expressions
in a Spreadsheet-Based Environment
Michal Tabach Alex Friedlander
The Weizmann Institute of Science
ABSTRACT Use of spreadsheets in a beginning algebra course was investigated mainly with
regard to their potential to promote generalization of patterns. Less is known about
their use in promoting understanding and learning of transformational activities. The
overall purpose of this paper is to consider the conceptual aspects of learning a
transformational skill (use of the distributive law to transform algebraic expressions)
in a learning sequence composed of both spreadsheets and paper-and-pencil
activities. We conducted a sequence of classroom activities in several classes, and
analyzed the students' work regarding a spreadsheet activity by an assessment
questionnaire and by both qualitative and quantitative methods. The findings indicate
both encouraging benefits and some potential sources of difficulties caused by the use
of spreadsheets at these initial stages of learning symbolic transformations.
BACKGROUND
A categorization of algebraic activitiesIn a plenary lecture at the 12th ICMI Study Conference on the Future of the Teaching
and Learning of Algebra, Kieran (2004) presented a model for conceptualizing
algebraic activity that synthesizes three principal activities of school algebra: (1)
generational activities that involve the forming of expressions and equations arising
from quantitative problem situations, geometric patterns, and numerical sequences or
relationships; (2) transformational activities that include mainly changing the form of
expressions and equations in order to maintain equivalence; and (3) global/meta-level
activities, such as problem solving, predicting, modeling, generalizing, and justifying
– for which algebra is used as a tool – but are not exclusive to algebra.
174

Kieran also points out that because of the modern math movement, cognitive research,
and the emergence of technological tools, the dominant trend in the teaching and
learning of algebra changed from an earlier emphasis on transformational work to a
more recent emphasis on the domains of generational and global/meta-level activities.
However, she notes, based on Lagrange and French colleagues' studies on the use of
CAS in school algebra, that "the emphasis on conceptual work was producing neither
a clear lightening of the technical aspects of work nor a definite enhancement of
students' conceptual reflection" (p. 28). Finally, Kieran recommended to treat
techniques and conceptual understanding as complementary components, and
concludes her argument as follows:
We now find ourselves faced with evidence that the transformational
activity in algebra can serve as a site for meaning making, that is, that
techniques can have an epistemic dimension. It is ironic that when
consideration is given to technique in a technological environment, the
epistemic factor can be greater than it ever was thought to be in paper-
and-pencil environments. (p. 30)
Similarly, Star (2005; 2007) claims that procedural knowledge has two qualitative
dimensions: a superficial dimension, which is the common usage of procedural
knowledge, and a second dimension having an in-depth quality. This second
dimension is usually neglected, but it can and should be taught in a meaningful and
in-depth way.
In this paper, we present a follow-up of Kieran's conclusions and Star's
recommendations. We will focus our study on a specific aspect – the potential of 7 th
grade students' conceptual understanding of symbolic transformations in a
spreadsheet-based environment.
175

Use of spreadsheets in learning algebra Sutherland & Rojano (1993) described the transition from arithmetic to algebra as a
"didactical cut" (i.e., a rapid arbitrary transition). Several research studies reported
that spreadsheets have the potential to reduce the cognitive demands of the transition
at the stage of beginning algebra (Ainley, 1996; Filloy & Sutherland, 1996;
Friedlander & Tabach, 2001b; Haspekian, 2005; Sutherland & Rojano, 1993; Tabach
et al., 2006; Wilson et al., 2005). Sutherland and Rojano (1993) claimed that Excel
allowed students to use numerical representation while working on generalizations
and patterns. The use of formulas in a spreadsheet environment has a practical role
(i.e., creating a numerical representation of a given phenomenon), and as a result,
their use by students can be perceived as a natural need, rather than an arbitrary
requirement. Hence, Excel may serve as a bridge between arithmetic and algebra
(Haspekian, 2005; Wilson et al., 2005).
Spreadsheets have the potential to produce ample numerical tables, and they fulfill the
need to use general expressions to create these tables. In addition, it is possible to
obtain a wide variety of corresponding graphs, thus enabling the use of a functional
approach in the teaching and learning of algebra (see, for example, Baker & Sugden,
2003; Filloy & Sutherland, 1996; Heid, 1995; Wilson et al., 2005). Therefore,
according to most of these studies, spreadsheets can be used effectively in
investigating variations.
Use of spreadsheets in the Compu-Math project (Excel) is aimed at 13-14-year-old
students, at the beginning stage of learning algebra (Tabach et al., in press). The
project perceives the potential of using Excel to bridge the way to algebra in general,
and algebraic syntax in particular, as indicated by Sutherland and Balacheff (1999).
Students' activities are based on complex “real-life” or mathematical situations that
lead students to investigate processes of quantitative variations such as measures of
176

geometrical shapes, series expressed in a numerical or geometrical form, and
variations of weight, price, and distance. Students’ work on these topics can be
considered as belonging mainly to the categories of generational and global/mate
level mathematical activities: predicting, generating, and analyzing data, as well as
generalizing, justifying, modeling, and reflecting on thinking processes and solutions
(Friedlander, 1999; Friedlander & Tabach, 2001a; Friedlander & Tabach, 2001b;
Tabach & Friedlander, 2004; Tabach et al., in press).
However, the ability to use spreadsheets for understanding and performing
transformational activities (e.g., the syntax of symbolic expressions, simplifying
symbolic expressions, or solving equations) is less clear. Several researchers have
conflicting views regarding these issues:
Syntax of symbolic expression. There are conflicting views about the connections
between standard symbolic expressions and spreadsheet notations. Some researchers
do not distinguish between the syntax of spreadsheet formula and the syntax in a
paper and pencil environment. Drouhard & Teppo (2004) claim that "the formula
[=2*A1 + 1] that expresses the relationship between the content of the two cells is the
strict equivalent of the algebraic expression like 2x + 1, or better said, a translation of
this expression in the language of spreadsheet" (p. 236). Sutherland and Balacheff
(1999) expressed a more complex view, by indicating different possibilities for
viewing spreadsheet formulas at the same time:
A number in a cell can have several meanings, it can be a specific
number or a cell representing a general number, or a cell representing
an unknown number or a cell representing a relationship between
numbers; the spreadsheet/algebraic approach is to view a cell as 'x',
either as an unknown or a general number and to express relationships
with respect to this 'x' (p. 22).
177

Yerushalmy & Chazan (2002) consider spreadsheet syntax as problematic, and
question its potential as a tool for learning the syntax of symbolic expressions, since:
When students are working with symbols representing locations in the
spreadsheet table, these symbols are neither unknowns, nor variables.
They represent particular locations and in that sense seem too particular
to be variables, though of course the values in cells to which they refer
can change; the cells to which they refer either do or do not have
values; when they do, it seems funny to call them unknowns (p.735).
Simplifying symbolic expressions. Rojano & Sutherland (2001) consider the potential
use of spreadsheets as a tool for learning how to simplify symbolic expressions. They
claim that spreadsheet exercises can be used to determine the equivalence of various
formulae (for instance, whether =2*A2 + 1, =2*(A2+1), and =2*(A2+0.5)), all of
which produce the same numbers).
Equations. There are conflicting views on the potential of spreadsheets as a tool for
solving equations. On the one hand, researchers claim that the use of spreadsheets for
solving equations before learning the standard algorithm can promote understanding
the meaning of equations, solutions, and related concepts (Tabach & Friedlander,
2006). On the other hand, some studies have shown that attempts to use spreadsheets
as a means for strengthening the conceptual understanding of symbolic techniques
encounter considerable difficulties (Dettori et al., 2001; Friedlander & Stein, 2001).
PURPOSE OF THE STUDYSome basic assumptions guided us in the present research:
We employed Kieran's (2004) framework of generational, transformational, and
global/meta-level symbolic activities.
Our own experience in the CompuMath project, and other projects mentioned
above showed that spreadsheets can be used as a vehicle to foster both
generational and global/meta-level skills at the stage of beginning algebra. We
178

felt a need to expand our research-focus from mainly generational and
global/meta-level to include transformational operations as well. More explicitly,
we felt a need to investigate the meanings and concepts that underlie
transformational activities.
Following Sutherland & Balacheff (1999), we accepted the view of parallel (but
not identical) meanings of algebraic expressions written in standard algebraic
notation and in Excel format.
This study is part of a longitudinal research study about learning processes of
beginning algebra (13-year-old) students. The overall purpose of this paper is to
consider the conceptual aspects of learning a transformational skill (use of the
distributive law to transform algebraic expressions) in a learning sequence composed
of both spreadsheets and paper-and-pencil activities.
The learning sequence, which started with a spreadsheet activity, is aimed at
enhancing the conceptual aspects of the distributive law in the context of numerical
and symbolic representations. The activity required students to generate equivalent
symbolic expressions based on the distributive law of multiplication over addition.
This was followed by several paper-and-pencil activities whose aim was to enhance
the transformational skills related to the use of the distributive law in an exclusively
symbolic representation. The sequence ended with an assessment activity.
In order to gain some knowledge about the learning that took place, we conducted a
classroom-based research study in six classes, and analyzed the students' work on the
spreadsheet-based and the assessment activities by both qualitative and quantitative
methods.
METHODOLOGY
Learning environment
179

The activities employed in this study are part of the Compu-Math curriculum project
for middle school mathematics (Hershkowitz et al., 2002). This project is based on a
learning environment characterized by rich social interactions supporting high-level
discursive activities, and by the extensive use of multi-representational computer
software. The CompuMath students usually work in small groups on open-ended
activities that are conducted in several phases: an introductory classroom forum, work
in small groups, and a whole-class summary discussion. About a third of the learning
time is spent in a computer laboratory.
Student Activities
This study is based on a short learning sequence that included a spreadsheet-based
activity called Identical Columns (Fig. 1), followed by short paper-and-pencil
exercises, and an assessment activity called Return of the Identical Columns (Fig. 2).
The sequence related to the symbolic aspects of the distributive law and was
conducted as part of the regular work, around the middle of the first year of a
beginning Algebra course. The design of the sequence was influenced by the
following considerations:
o The general purpose of the sequence was transformational – acquiring the skills
needed to perform the distributive law in a symbolic representation. The students
were familiar with its numerical aspects and encountered some of its applications
in the context of expressing the perimeter of rectangles with variables as lengths
of their sides.
o The first spreadsheet-based activity in the sequence was included as a transition
between the familiar generational activities and the following paper-and-pencil,
symbolic transformational activities. The combined symbolic and numerical
representations inherent in the spreadsheet environment of the first activity were
also intended to evoke students' global/meta-level activities, such as predicting,
180

generalizing, or justifying, and thus to strengthen the conceptual aspects of the
transformational skills learned. The other activities that followed this mediation
of a technological tool were transformational in nature; and focused on
symbolical representation and were performed in a paper-and-pencil environment.
By the end of the sequence, a final assessment activity was administered to
students. The entire sequence was planned for six class periods: two lessons for
the spreadsheet-based activity, three lessons for short paper-and-pencil exercises,
and one lesson for an assessment activity.
o Up to this learning sequence, CompuMath students worked in a combined
spreadsheet and paper-and-pencil environment, on about ten generational
activities, based on geometric or numerical patterns of quantitative variations.
Throughout their work, the students used in parallel two notation systems - the
standard algebraic notation and the spreadsheet (Excel) format (see, for example,
Figures 1 and 2). Thus, at this stage, the students are familiar with both the
concept and the syntax of spreadsheet formulas and regular symbolic expressions
as tools for generalizing patterns and creating corresponding numerical
sequences6. For the sake of clarity and conciseness, spreadsheet formulas will be
presented in this paper in standard algebraic notation. For example, the Excel
formula =2*A1+2*B1 will be referred to as 2A + 2B, even when the students of
this study actually used the Excel format.
__________________Insert Figures 1 and 2
6 A detailed description of students' fluency in moving between the two notations can be found in Tabach et al. (submitted).
181

Next, we will focus our attention on the first spreadsheet-based activity Identical
Columns, (Fig. 1), and the last assessment activity Return of the Identical Columns
(Fig. 2).
The spreadsheet activity - Identical Columns
The work on this activity (Fig. 1) was in pairs, in a computer laboratory. In the first
task, the students were required to fill in spreadsheet Columns A and B with two
given sets of numbers arranged in arithmetical sequences. The choice of arithmetical
sequences was not inherent to the task, but since the students were familiar with this
feature, it presented the option of filling in the spreadsheet table by using formulas,
rather than by introducing discrete numbers. Next, the students were asked to
construct in Column C, the sum of the corresponding numbers given in Columns A
and B (A + B), and then to construct in Column D the sum 2A + 2B. Thereafter, the
students were asked to use Columns A, B, or C in order to create two other columns of
their own that are identical to Column D. The designers intended to use this task to
stress the symbolic equivalence between the expressions 2A + 2B and 2(A + B) - i.e.,
the symbolic representation of the distributive law. The expected spreadsheet
formulas were 2(A + B), A + A + B + B, A + B + C, or 2C. The request to create two
(rather than just one) columns was intended to encourage students to think about
general relationships, rather than look for idiosyncratic numerical connections.
In the second task of this activity, students were asked to write in Column G the
formula 10(A + B) and again, to use Columns A and B in order to create two columns
of their own that are identical to G. The expected spreadsheet formulas for this task
were 10A + 10B, or (A + B)·10.
We noted that both tasks require the use of the distributive law, but they have a
different structure. The first task involves a transition from 2A + 2B to 2(A + B)
(i.e., factoring out a symbolic expression), whereas the second task was intended to
182

expand 10(A + B) into 10A + 10B. The designers assumed that for beginning algebra
students, the operation of factoring out is more demanding cognitively than
expanding. Thus, the first task in the activity was intended to be algebraically more
difficult, in order to induce students to get started in a numerical context, and to obtain
an initial understanding of the meaning of identical columns.
The use of spreadsheets in this activity was intended to provide students with
numerical support for symbolic transformations, to enable them to produce their own
expressions, and to test their hypotheses through the obtained numbers. In these
tasks, obtaining identical number columns indicates an equivalence of symbolic
expressions, whereas a mismatch indicates a need for additional adaptations of the
employed formula.
Paper-and-pencil exercises
During the following three lessons, the students were given transformational tasks,
based on the distributive law, which were presented in a symbolic representation (for
example, expanding the expression 3(x + 5) or factoring out the expression 4x – 12).
The assessment activity - Return of the Identical Columns
The spreadsheet-based and the assessment activities were similar in structure.
However, the assessment activity (Fig. 2) was given in a paper-and-pencil
environment, and students worked on it individually. The assessment activity
required students to construct two identical columns (i.e., two equivalent expressions)
for 2(A + B), and two other (equivalent) expressions for –2(A – B).
Both activities require students to perform on generational and transformational
levels. However, the spreadsheet activity is more generational in its nature, whereas
the assessment activity emphasizes the transformational aspects of the distributive
law. This claim is based on the following considerations:
183

o One of the tasks in the assessment activity is less intuitive (its expression is based
on a difference multiplied by a negative number);
o By the end of their learning sequence, the students were expected to be more
advanced in both conceptual understanding and in performing transformational
skills related to the distributive law;
o The assessment activity's paper-and-pencil environment does not provide the
numerical feedback provided by a spreadsheet environment.
Methods
The learning processes reported here took place in a regular classroom environment –
(i.e., in a class or a computer laboratory setting) and the described activities were
taken from the students' textbooks. The teachers' interventions during student work
were spontaneous and integral to the classroom routine of guided investigation, rather
than being a part of a planned research design.
The data for this report were collected around the middle of the school year. The same
learning sequence was given for two consecutive years to 6 classes of seventh grade
algebra students. We decided to combine the data collected during the two years,
since the student population had similar characteristics as well as the same teachers.
All students participated in the complete learning sequence. The data collected on the
spreadsheet-based activity included the audio-taped work of 4 randomly selected pairs
of students and 41 Excel files of 74 students – most of them working in pairs. The
written data on the assessment activity included the work of 136 students. During the
spreadsheet-based activity, most of the students worked in pairs and some worked
individually. All students worked individually on the assessment activity.
The data analysis of this study is both qualitative and quantitative in nature. First, the
audio recordings of the four pairs of students were transcribed and analyzed in depth
to identify the reasoning employed and the strategies used. At this stage, we
184

attempted to match expressions produced by the four pairs of students with their
thinking strategies. Then, data from both the spreadsheet-based activity and the
assessment activity for all students were quantitatively analyzed, based on the
strategies identified in the first stage. Thus, the quantitative analysis was based on the
assumption that in most cases, the matching between the thinking strategies and the
resulting symbolic expressions that were identified in the qualitative analysis is valid
for the whole student population as well. This assumption was necessary in view of
the classroom research conditions of this study, which posed some methodological
difficulties. On the other hand, the assumption that the matching between the
observed strategies and expressions can be generalized enabled us to detect patterns of
student symbolic reasoning on a much larger scale than the qualitatively analyzed
work of four pairs of students.
Teaching sequence
The teaching in all classes followed a similar sequence:
The spreadsheet-based activity (90 min). In the introductory phase, using the board,
the teacher simulated a task similar to the first task of the classroom activity. The task
started with a set of given numbers in Column A of a simulated spreadsheet table.
These numbers were substituted in expression 2A, and the results were written in
Column B. Next, the teacher asked the students to find expressions that will produce
number columns identical to Column B. Some expressions suggested by the students
were correct (e.g., A + A or ) and others were incorrect (e.g., 1 + A).
Finally, the students worked in pairs on the spreadsheet-based activity (Fig. 1). The
strategies that were employed to solve the two tasks will be described later. The
teacher moved between the pairs, and helped them in their work.
185
In the summary phase, the teacher led a whole–class discussion on student strategies.
As a result, of the feedback provided by the computer, all the expressions suggested
by the students during this stage were correct. Therefore, the discussion focused on
the concept of symbolic identity and equivalent expressions, and not on the
correctness of the provided answers.
Paper-and-pencil exercises (135 min). During the next three lessons, the students
worked on expanding and factoring out symbolic expressions, by using the
distributive law in a symbolic representation.
The assessment activity (about 45 min). Finally, the students were given an
assessment activity, similar to the initial spreadsheet-based activity (Fig. 2). The
purpose of this activity was to assess students' ability to apply, in a meaningful way,
symbolic aspects of the distributive law, in a paper-and-pencil environment.
FINDINGSThe findings relate to the students' work on the spreadsheet-based activity Identical
Columns, (Fig. 1) and the assessment activity Return of the Identical Columns (Fig.
2). The sections of this chapter will be presented according to the three sources of the
collected data.
Work of the four pairs of students on the spreadsheet-based activity
We will start by describing each of the four audio-taped pairs of students, including
quotes of selected episodes from their transcribed work.
The case of Alon and Shir. Their first expression for the first task was A + B + C; it
resulted from adding up the given numbers in attempting to use a strategy involving
numerical considerations. In order to obtain an additional identical column, they tried
(and failed) to subtract, multiply, and divide the numbers in the first row of the
spreadsheet table.
186

They asked their teacher for help.
Teacher: What was the expression for which you tried to find an identical column?
Alon: [Moving the mouse, to see the expression written in Column C] 2 times A plus 2 times B
Alon: I know! A + A + B + B.
They wrote down the expression, "dragged" it down, and were satisfied to see an
identical column. Alon was pleased with his expression, and he named it "The
Separation Law".
Obtaining an identical column for the second task [identical columns for 10(A + B)]
was much easier for them. They used the same ideas as in the first task.
Alon: In the first case we translated the term A·2 into A + A. Shir: But now we have A + B.Alon: A + B + A + B is exactly the same as A + A + B + B. Alon: Let's write A + B + A + B + …, Shir: No, this expression is too long.
Later Shir accepted this idea, and wrote down a sum of 20 addends. Their second
expression was 10A + 10B; it was obtained by simplifying their first original long
additive expression.
Analysis: Alon and Shir started with a generational activity - looking for numerical
patterns. This numerical consideration was based on the given sets of numbers, which
provided them with their first expression, but it failed to produce another one. The
discussion with the teacher indicated that spreadsheets can distract students from the
"hidden" symbolic expressions by drawing their attention to the "exposed" numbers.
When Alon moved the mouse to a cell and read in the upper editing window the
corresponding symbolic expression, he was able to perform a transformational
activity and employ symbolic reasoning, thus transforming the products of the given
formula 2A + 2B into corresponding sums. We will call this an 'additive strategy'.
Alon also felt the need to give a "mathematical name" to his newly discovered
strategy (a separation law). This is a meta-cognitive action that indicates a sense of
187

ownership toward solving the task; it can be attributed to Kieran's global/meta-level
category of actions.
For the second task, the pair continued to employ general symbolic reasoning, using
the same 'additive strategy'. Shir's objection to their first expression (A + B + A + B +
… + A + B), "it is too long" indicates her need for an "elegant" solution – a meta-
cognitive action that can also be attributed to Kieran's (2004) global/meta-level
category of actions.
During their work, Alon and Shir needed a small "push" by the teacher in order to
move from numerical considerations to general symbolic reasoning.
Thus, three of the four expressions produced by Alon and Shir resulted from symbolic
transformational actions, and in all of these cases, the spreadsheet served as a
validating tool.
The case of Dar and Or. Their first expression for the first task was 2C, and it
evolved from a numerical comparison of Columns C and D – i.e., employing
numerical considerations. Their second expression for this task was A + A + B + B,
and it was obtained by employing an 'additive strategy'.
Next, Dar and Or began the second task: they wrote the expression 5A + 5B (besides
expanding, they applied incorrectly the distributive law by "distributing" the
multiplier between the two addends), dragged it down, but did not get the expected
numbers. Then, they corrected their initial expression to 10A + 10B, and started to
look for a second expression that would produce an additional identical column.
Dar: 10/A + 10/B, like one tenth. Or: Instead of multiplying, we can divide by the inverse. Or: [Writes the expression in Excel format, but the computer fails to
provide the expected result.] It must be correct! Dar: Something must be wrong with what we wrote.Dar: Try the decimal fraction, 0.1/(A + B).Or: [Writes the expression in Excel format, and again they receive an
unsatisfactory result.] No! Dar: Let's do simple adding, A + A + 8A + B + B + 8B.
188
Or: [Writes the expression in Excel format and "drags" it down, receiving this time the desired identical column.] Yes!
Analysis: Dar and Or started with a numerical generational action, employing
numerical considerations, and then began, on their own initiative, a transformational
activity, applying general symbolic reasoning. They continued to reason algebraically
with an incorrect application of the distributive law, and relied on the spreadsheet's
feedback to adjust their initial answer (5A + 5B) to a correct expression (10A + 10B),
applying numerical considerations. This is an example of moving between
transformational to generational actions. In the next task, they tried to apply a correct
expression by writing it erroneously, but the spreadsheet feedback did not indicate the
source of their error. Here, correct declarative knowledge was applied the wrong way;
the error became evident from the numbers provided by the spreadsheet. However,
the help provided by this feedback was limited, and as a result, the pair sought
alternative solutions. They used an 'additive strategy' that seemed to them "simpler".
This new solution consisted of a relatively superficial change, transformative in
nature, which provided them with the expected result.
In this case, we can again see the role of spreadsheets as a generational tool for the
students' initial numerical activity, and as a validating tool for both numerical,
generational, and symbolic transformational activities. We also observed that the
feedback provided by spreadsheets is limited, prone to syntax errors, and does not
provide additional mathematical help or scaffolding.
The case of Dan and Shay. In order to bettter understand the meaning of the numbers
produced by the given formula 2A + 2B, they first tried to reconstruct the calculations
that led to the numbers in Column C.
Dan: 2*4 is 8, right? And 16*2 is 32.Shay: Yes.Dan: So 32 + 8 equals 40.
189

The expressions produced by Dan and Shay for the first task were A + B + C and 2C,
and they evolved by applying numerical considerations.
Dan and Shay found the second task more difficult than the first. They asked for the
teacher's help in understanding the meaning of the numbers obtained by dragging
down the expression 10(A + B) in Column G.
Shay: What is in Column G?Teacher: Let's look at the expression. Ten times the sum of A and B.Shay: Ah! It's like 4 + 16 ten times.Dan: Can it be done differently?Teacher: Yes, it can.Dan: 5A + 5BTeacher: So we will get five times A and five times B. Do we want that?Dan: We need 10.Shay: Maybe we can do 10A + 10B.Dan: [Writes the formula in Excel format and drags it down.] Yes.Teacher: Do you have another idea?Dan: 15 – 5A + B.Teacher: What do you want the computer to calculate first?Shay: Parentheses! (15 – 5)(A + B).
Analysis: Dan and Shay considered the first task as a generational activity, and
obtained both expressions by using numerical considerations. In the second task,
owing to teacher intervention, the discussion focused on symbolic expressions and on
transformational activities. In the first expression (5A + 5B), the distributive strategy
was incorrectly applied (as in the case of Dar and Or), and was changed later (to
10A + 10B) owing to teacher intervention. The second expression (15 – 5)(A + B)
was created by using properties of numerical operations, and again was modified as a
result of teacher intervention. In both tasks, the pair used spreadsheets as a validating
tool.
The case of Gil and Mira. For their first task, Gil and Mira used numerical
considerations, and produced A + B + C, as their first expression. Then, they looked
for additional numerical patterns, could not find any, and asked for the teacher's help.
The teacher drew their attention to the expression 2A + 2B in Column D. This led
190

them to write the expression 2A + B, drag it down, check the resulting numbers, and
as a result, correct this expression to 2(A + B).
In the second task, they unsuccessfully attempted to apply numerical considerations,
and asked for the teacher's help.
Teacher: How did you create Column G? What is there behind the 200?Gil: [Moving the mouse to see the expression that created Column G.]
First add them.Teacher: Correct. And then what?Mira: Multiply by 10.Teacher: And how can we do it differently?Gil: A + B·10?Teacher: Try it.Mira: [Writing the expression.] No, we need parentheses.Gil: (A + B)·10…Teacher: Do you have a different expression?Mira: 5A + 5B?Teacher: How much will this be? Try it.Mira: [Writes the expression.] We got 100.Teacher: Instead of what?Gil: 200.Teacher: So what did we miss?Gil: Multiply by 2.Mira: [Correcting the Excel formula and dragging it down.]
(5A + 5B)·2.Gil: We succeeded! [Teacher is leaving.]Gil: Let's try another expression. Mira: Let's try to make changes, we can always delete them later.Gil: Let's try to write 6A + 6B.Mira: [Writing] We got 120. We missed 80.Gil: Let's add (A + B)·4.Mira: [Correcting the expression to 6A + 6B + (A + B)·4.] This is the
strangest formula we have ever written!
Analysis: Gil and Mira, like all the other pairs, started from generational actions, and
employed numerical considerations. With the teacher's help, they shifted their
attention to symbolic reasoning, and created an expression that was corrected as a
result of numerical feedback provided by the spreadsheet. The second task was again
considered as a generational activity, which should be solved by numerical
considerations. The teacher tried to shift the focus of the activity to symbolic
transformations performed by employing symbolic reasoning. The two correct
191

expressions that emerged at the end resulted from refining the solution. Their solution
involved combining symbolic reasoning and numerical considerations, and their final
"most strange" expression was reached by student–spreadsheet negotiation. Gil and
Mira contrasted the symbolic hypothesis and numerical feedback in a dialectic
manner, and this process enabled them to reach a correct expression. Again, this
meta-cognitive action can be categorized in Kieran's terms as a global/meta-level
activity. The pair were not convinced by the teacher's attempt to induce symbolic
reasoning, and once she left, the students tried to follow a path that combined
numerical and symbolic solutions.
Summary: Table 1 presents the expressions that were provided by each pair of
students for the spreadsheet-based tasks, and the reasoning that they employed.
__________Insert Table 1
The picture emerging from the four pairs reveals some common features. When facing
the first task, all students started to work in a familiar numerical context, and
considered the activity as generational. During the first task, most pairs shifted to
symbolic reasoning, and viewed the task as a transformational activity. One of the
pairs (Dar and Or) shifted to symbolic reasoning by their own initiative; the other two
pairs (Alon and Shir; Dan and Shay) needed the teacher's intervention (at different
points) in order to employ symbolic reasoning, and the fourth pair (Gil and Mira)
employed a mixture of numerical considerations and general symbolic reasoning, in
spite of the teacher's intervention.
Next, we will present some conclusions about the spreadsheet-based activity based on
qualitative analysis of the data.
The spreadsheets' numerical representation and capabilities provided for
students who employed numerical considerations, a starting point and a working
192

environment that corresponded to their mathematical abilities. In all cases,
spreadsheets served as a validating tool for the expressions obtained by any
strategy.
The perception of spreadsheets as an "empirical laboratory" (explicitly
expressed by students) enabled students to employ numerous strategies and to
obtain many different expressions. Although the activity was intended to
promote the use of a distributive strategy, some students found other suitable
symbolic strategies. Out of the eight expressions created for the first task, only
one expression was obtained by using the distributive law, two were obtained by
using an additive strategy, and five expressions were generated by using
numerical considerations. Out of the nine expressions created for the second
task, four expressions used the distributive law, one expression was created by
using an additive strategy, one was generated by using a commutative strategy,
and three were obtained by using other properties of arithmetical operations.
We claim that this variety of strategies employed by the students provides
evidence that an Excel environment allows students to function satisfactorily
according to their perception of the activity and cognitive preferences.
The transition from numerical considerations to symbolic reasoning can be
attributed to several factors such as processes of student learning, task
characteristics, and teacher intervention. Because of the classroom-based design
of this study, we could not distinguish the influence of each of these factors. By
analyzing the four pairs of students, we could establish, however, that learning
processes did play a considerable role in student work. Thus, for some of the
students, the first task served as a learning experience that enabled them to
become acquainted with symbolic reasoning and use it in the second task. The
larger number used in the second task (multiplication by 10, as compared to
193

multiplication by 2 in the first task) possibly encouraged a transition from
numerical considerations to symbolic reasoning. However, some students
continued to rely on numbers, and for them the support of Excel was critical. In
this sense, the use of spreadsheets in the first activity of the learning sequence
provided the intended transition from a numerical to a symbolic representation.
Feedback provided by spreadsheets needs further interpretations by
students. If the results are satisfactory, a spreadsheet does not encourage the use
of more complex or sophisticated expressions. However, if the results are
unsatisfactory (in our case, if the number of columns do not turn out to be
identical), spreadsheets do not indicate the source of error. In this case, students
must provide their own interpretations and modify their original solution in new
directions (see the case of Dar and Or). In spite of this difficulty, we observed
that in a spreadsheet environment, interaction with the computer as well as
teacher intervention can encourage students to seek norms for setting standards
in order to attain a high-quality solution, in addition to considering the
correctness of the final result. Three out of the four pairs of students assessed
their expressions: Shir complained about an expression being "too long", Dar
considered her expression as "simple", and Gil and Mira considered their
expression as "strange". We considered these reflections on their evolved
expressions as being activities of a global/meta-level type.
The fact that spreadsheets conceal the symbolic expressions that were used
to generate numbers can be another source of difficulty. Some students (Alon
and Shir) were distracted by this fact, but others (Dar and Or) managed to
overcome it, and reasoned symbolically.
Analysis of both the audio-taped data and the saved spreadsheet files of the four
student pairs led us to define the following student strategies:
194

Numerical considerations - analysis of numbers and "fitting" of a formula
that satisfies specific numbers. In our case, we related a numerical strategy to
expressions containing C as a variable.
Distributive strategy – applying procedures involving expanding or
factoring. We related the distributive strategy with expressions like 2(A + B) in
the first task and 10A + 10B in the second task.
Additive strategy - decomposing products into repetitive sums. We related
an additive strategy to expressions like A + A + B + B.
Commutative strategy – rearranging the order of variables. For example,
we related a commutative strategy by employing (A + B)·10 as equivalent to
10(A + B).
Use of other properties of arithmetical operations - for example, writing
A/0.5 + B/0.5 to obtain a number column identical to the one produced by
2A + 2B.
In the following analysis, we will consider the first strategy as an example of
numerical considerations, whereas the other four strategies will be considered as cases
involving symbolic reasoning. In the next section, we will examine the distribution of
the above-defined strategies on a larger scale.
The work of all students on the spreadsheet-based activity
The data for this section were recorded as Excel files by the students during their
work, and as such reflect the final results, rather than solution processes. Thus, the
analysis of this section considers only the final expressions that were produced by
students to obtain columns that are identical to those generated by 2A + 2B in the first
task, and by 10(A + B) in the second task.
The first task (expressions equivalent to 2A + 2B):
195

Table 2 presents the distribution of strategies employed by the students to solve the
first task. First, we would like to mention the wide variety of expressions produced
by the students. Out of a total of 87 expressions found in 41 Excel files, we
distinguished 22 different expressions.
___________Insert Table 2
In the first task, we related 58% of the expressions to symbolic reasoning, which
suggests a symbolic transformational approach. On the other hand, 42% of the
students approached the task as a generational activity, suggesting the use of
numerical considerations.
The second task (expressions equivalent to 10(A + B)):
Table 3 presents the distribution of the strategies and expressions created for the
second task. Out of a total of 71 expressions found in 41 Excel files, we distinguished
31 different expressions.
___________Insert Table 3
In this case, a total of 92% of the expressions suggested symbolic reasoning, and only
8% of the expressions were categorized as based on numerical considerations.
The relatively large number (ten) of conventional and less conventional expressions
provided by users of a distributive strategy can be attributed to students' cognitive
flexibility and by the complexity of the second task (as compared to the first).
Summary: In order to analyze students' performance on the two spreadsheet-based
tasks, we considered the following four aspects:
Students' perceptions of symbolic transformational activities. We found that students'
solutions did not necessarily follow the activity's intended learning trajectory
regarding the use of the distributive law. For example, many students focused on the
requirement to create identical columns. Solution strategies and the resulting
196

symbolic expressions reflected two directions in students' perceptions of the task
under investigation:
Perception of the task as a transformational activity – based on symbolic
reasoning. In this case, spreadsheets played a validating role by checking
retroactively the correctness of the symbolic expressions.
Perception of the task as a generational activity – based on numerical
considerations. In this case, spreadsheets played two roles: first they provided the
numerical data needed to find patterns and their corresponding symbolic
expressions, and second, as in the previous case, it also served as a validating tool.
At this stage of learning algebra, the two directions cannot be clearly separated (see
the case of Gil and Mira). Students who employed symbolic reasoning could still be
influenced by the spreadsheet's numerical environment, and those who employed
numerical considerations could still apply general reasoning. In both cases, Excel
seemed to play a crucial role as a "numerical and symbolic laboratory" that allowed
students to pose predictions, to experiment during the solution process, and to validate
the obtained results. These actions can be identified with Kieran's third category of
global/meta-level activities.
Level of difficulty. The number of expressions provided for the two tasks were almost
identical: 87 for the first task, and 71 for the second. All expressions were correct,
owing to the use of spreadsheets in validating the correctness of expressions.
Variety of responses. The students' work contained 22 and 31 different expressions for
the first and the second tasks, respectively. We attribute this wide variety of
expressions to the use of spreadsheets. The larger number of different expressions
obtained in the second task can be attributed to the larger numerical factor involved in
the structure of the second task (10 as compared to 2).
197

Solution strategies. The expressions produced by the students during their work on the
two tasks indicated a decreasing use of both numerical considerations and an additive
strategy. This finding can be explained by the effect of students learning to apply
general symbolic strategies. The increased use of symbolic non-additive strategies
most probably can also be related to the characteristics of the expression involved in
the second task. The larger factor in this expression makes the use of numerical
considerations technically difficult, whereas the use of an additive strategy produces
an inconveniently long expression.
The work of all students on the assessment activity
In this section, we will analyze the students' expressions created for the two tasks
(finding two equivalent expressions to 2(A + B) in the first task, and to –2(A – B) in
the second) and discuss how their work was categorized into the employed strategies.
Then, we will discuss the findings.
The first task (expressions equivalent to 2(A + B)):
One hundred and thirty-six students were given the assessment activity. Five students
did not do any work on the first task, and the other 131 provided a total of 249
expressions, and out of these, only 16 (6%) were incorrect. Among the 233 correct
answers, we found 26 different expressions. Table 4 presents the distribution of
strategies and correct expressions created for the first assessment task.
___________Insert Table 4
In this case, 99% of the correct expressions suggested the use of symbolic strategies,
and we deduced that these students considered the task to be a transformational
activity.
198
The exceptional use of numerical reasoning by one student involved the expression
= – A1 + B2 – B1, which turned out to be correct7 because the two given sets of
numbers provided in this task formed arithmetical sequences (a design decision
explained earlier). We claim that such an expression could be obtained only by
numerical manipulations.
The second task (expressions equivalent to – 2(A – B)):
Out of the 136 students who were given the second assessment task, 7 did not show
any work. One hundred and twenty-nine students provided 234 expressions, and out
of these, 134 (57%) were correct. Among the 134 correct expressions, we found 25
different expressions. Table 5 presents the distribution of strategies and correct
expressions for this task.
___________Insert Table 5
In this case as well, 99% of the correct expressions suggested the use of symbolic
strategies, and we deduced that for students who employed these strategies, the
activity was of a transformational nature. For this task as well, only 1% of the
expressions were based on numerical considerations.
Summary: In order to examine the students' performance on the assessment activity,
we will consider the same four aspects that were used in the summary of the
spreadsheet-based activity:
Students' perception of symbolic transformation activities. As suggested by the
almost exclusively symbolic strategies used in the assessment activity (Tables 4 and
5), students perceived both tasks as transformational activities.
7 In this case and in the case of one other expression (see Tables 4 and 5), we used the original spreadsheet notation, since these two formulas employ quantities from different lines, and dropping the line indexes (as we did in the other cases) cannot adequately describe these solutions.
199

Level of difficulty. As in the case of the spreadsheet-based activity, the numbers of
expressions provided for the two tasks were almost identical: 249 for the first task,
and 234 for the second. However, the difficulty levels of the two tasks were different:
94% of the expressions in the first task were correct, as compared to only 57% of the
expressions created in the second task.
Variety of responses. The students' work contained almost the same number of
different correct responses: 26 expressions for the first task and 25 for the second.
Again, we attribute this wide variety of expressions to the students' previous
experience with spreadsheets on a similar activity. The role of spreadsheets in
obtaining a wide variety of expressions will be discussed later.
Solution strategies. Comparison of the strategies employed in the two tasks revealed
decreased use of an additive strategy, and increased use of a distributive strategy
(Tables 4 and 5). This can be explained by the complexity involved in transforming
–2(A – B) into an additive expression (e.g., –A – A + B + B) as compared to
transforming –2(A – B) into –2A + 2B by employing a distributive strategy.
DISCUSSIONAnalysis of the data obtained from both the spreadsheet-based activity and the
assessment activity led us to the following conclusions:
Spreadsheets allow students to approach a basically symbolic concept in a variety of
learning trajectories. We can illustrate this claim by the work of the four pairs of
students described in our section on the findings. For students who worked at a
symbolic level, spreadsheets provided further possibilities to vary both strategies and
products. In our case, we distinguished the following four kinds of symbolic
strategies: a distributive strategy (e.g., Gil and Mira), an additive strategy (e.g., Dar
and Or), a commutative strategy, and use of other properties of arithmetical operations
(e.g., Dan and Shay). These strategies led the students to more than 22 different
200

equivalent expressions for each task. The same variety of strategies and emerging
expressions was found in the assessment activity as well (conducted in a paper-and-
pencil environment). This suggests that such a learning sequence, which is based on
various environments (spreadsheets and paper-and-pencil) activities (generational,
transformational, and global/meta-level) and representations (numerical and
symbolic), has the potential to affect students' symbolic creativity and comprehension
both ad hoc and at a later stage.
During the whole learning sequence, we could not find any evidence of any difficulty
students encounter in moving between the symbolic notations of spreadsheets and
those of regular algebra.
Use of spreadsheets allows students to implement an operative and intuitive aspect of
symbolic equivalence. Mathematically, there are two alternative definitions for the
concept of equivalence of two symbolic expressions: (a) two expressions that provide
identical results for any number that can be substituted in both, and (b) an expression
that can be derived from a given expression by valid operations.
The first definition has a numerical context and is more meaningful to beginning
algebra students. However, applying this definition usually involves work with
infinite number sets, and as a result, its operative application is problematic. The
second definition is more operational, but it depends on students' ability to perform
symbolic transformational activities. As noted by Rojano and Sutherland (2001),
spreadsheets enable students to implement the first meaning of the equivalence
concept on a larger scale – and thus provide a prolonged, more accessible and gradual
transition to its second, more abstract meaning. Our study investigated and confirmed
the potential of this approach.
The learning sequence based on both spreadsheets and paper-and-pencil allowed for
a gradual transition from generational to transformational activities. Our findings
201

suggest that students tended to work in a numerical context at the beginning, and in a
symbolic context at a later stage. In our spreadsheet-based activity, the rate of use of
numerical patterns was 42 percent for the first task, but this decreased to 8 percent for
the second task. In the paper-and-pencil assessment activity, the rates of numerical
reasoning for both tasks were negligible. In our view, this phenomenon indicates that
such a transition is possible in a learning sequence starting with a spreadsheet-based
activity that is followed by paper-and-pencil exercises based on an increasing
numerical level of difficulty (for example, use of larger or negative numbers) or
increased complexity of mathematical structure (for example, expanding as compared
to factoring out). Students' answers for more complex or cognitively demanding tasks
suggested a tendency to use symbolic rather than numerical reasoning. Thus, the
decreased use of numerical considerations seems to result from the combined effect of
task design and student learning. At this stage, we cannot quantify or estimate the
relative weight of these factors. In our view, their combined effect on student
reasoning is the important issue.
Furthermore, the pedagogical goal of the designers of the learning sequence was to
enable students to apply the symbolic aspect of the distributive law. Table 6 shows
rates of use of this particular strategy, as compared to the use of other
transformational strategies.
___________Insert Table 6
The data reflects increased use of a distributive strategy, both within each activity
(from the first to the second task) and across activities (from spreadsheet-based, to
assessment activity). As in the case of symbolic reasoning, in general, we infer that
students perceived the use of the symbolic distributive law as a strategy suitable for
more complex or abstract tasks.
202

Students tend to consider spreadsheet activities as generational. As indicated in the
introductory section on the use of spreadsheets in learning algebra, the use of this
technological tool was considered mainly for generational activities. The
spreadsheet's ability to produce large bodies of numerical data (and at the same time,
to conceal the original formulas that generated them) encourages students to look for
numerical patterns. Again, we can consider this as both an advantage and a
disadvantage. On the one hand, the numerical meaning of symbolic equivalence is
emphasized and the transition to its symbolic meaning is gradual and adjustable to
students. Thus, we saw that all four observed pairs of students began their work on
the classroom activity in a generational mode. On the other hand, we consider the
general tendency toward numerical work as unnecessary for more advanced students.
Spreadsheets serve as a validating tool. The students' work on the spreadsheet-based
activity suggests that spreadsheets play an important role as a validating tool. We will
elaborate here on several aspects of this role.
As a result of immediate and continuous feedback, the use of spreadsheets
considerably increased the number of correct responses. All final expressions
given for the spreadsheet-based activity were correct, whereas work on the two
paper-and-pencil assessment tasks indicated a level of correctness of 94 and 57
percent, respectively.
Feedback provided by spreadsheets encourages student interactions and reflective
discussions on the meaning of the obtained results (for example, "this is the
strangest formula that we have ever written" – Gil and Mira) or on the reasons for
obtaining unsatisfactory results (in our case, two unidentical columns). We
believe that this kind of reflection will fit into Kieran's (2004) description of a
global/meta-level symbolic activity. The capacity of technological tools to
promote global/meta-level actions in generational investigations was indicated
203

elsewhere (Hershkowitz & Schwarz, 1999; Friedlander & Tabach, 2001b). Our
study expands this capacity to the use of spreadsheets in transformational
activities as well.
The variety of correct answers produced by the students and accepted by
spreadsheets can be both an advantage and a disadvantage. On the one hand, it
allows students to work according to their personal and cognitive preferences, but
on the other hand, spreadsheets do not provide any feedback regarding the level of
mathematical sophistication, efficiency, compactness, or connection to the
intended mathematical nature of the solution. Moreover, if there is an
unsatisfactory result, spreadsheets do not indicate the source of the error. For
example, the expression [ ] produced by Or and Dar as an equivalent to
10(a + b) was based on a correct idea [ ], but the students did not receive the
support needed to correctly pursue their original idea.
CONCLUSIONS
Most of the relevant literature mentions that spreadsheets support generational
activities (such as searching for patterns, descriptions of variation processes, solutions
of standard word problems, and proportional reasoning). Diverse results emerge from
research that involves spreadsheets as mediators for transformational activities (such
as simplifying expressions or solving equations).
We investigated the possibility of using spreadsheets as a tool for promoting the
creation of equivalent expressions and for understanding concepts related to this topic.
The design and implementation of a learning sequence involving the symbolic use of
the distributive law with several groups of beginning algebra students led us to the
following conclusions:
204

The use of spreadsheets at the initial stages of learning symbolic transformations
resulted in the following encouraging benefits:
It emphasized the numerical meaning of equivalent expressions.
It promoted connections and transitions between numerical sequences and
their corresponding symbolizations using variables and expressions.
It created a laboratory environment by allowing students to test and validate
their solutions.
It enabled students to adopt various learning trajectories, while engaging in
meaningful symbolic activities.
It increased considerably the variety of solution processes and the resulting
expressions.
It provided an authentic environment for spontaneous reflective discussions
about the meanings of solution processes and their results.
Spreadsheets can generate large sets of numbers, and thus enable students to apply the
numerical aspect of the concept of equivalent symbolic expressions – an option that
has no parallel in a paper-and-pencil environment.
Work in a spreadsheet environment enables students to employ symbolic expressions
(Excel formulas) as tools that produce numerical sequences. This feature strengthens
the numerical meaning of symbolic expressions in general and their equivalence in
particular. Moreover, it makes the task of finding equivalent expressions more
meaningful; thus, it increases student involvement in an otherwise abstract symbolical
task. The produced expressions are in fact symbolic identities, a concept that gains
meaning from its numerical representation.
The "fill down" (dragging) operation of a spreadsheet formula emphasizes the
functional aspect of algebraic expressions as generators of many numerical instances.
205
The spreadsheet syntax for writing variables and formulas did not pose any
difficulties for our students.
An integrated spreadsheet-based and paper-and-pencil environment apparently allows
students to benefit from both generational work conducted at a numerical level
(promoted by spreadsheets), and transformational work conducted at a symbolic level
(promoted by paper-and-pencil and spreadsheets).
The data collected here indicated that the integrated learning sequence described here
allowed students to consider the same tasks as generational, transformational, and
global/meta-level activities. As recommended by Star (2005; 2007) and Kieran
(2004), there is a need for further research about the possibility of viewing
generational and transformational activities as complementary, rather than
contradictory.
206

REFERENCES
Ainley, J. (1996). Purposeful contexts for normal notation in spreadsheet
environment. Journal of Mathematics Behavior, 15, 405-422.
Baker, J. E., & Sugden, S. J. (2003). Spreadsheets in education: The first 25 years.
Spreadsheets in Education, 1(1). Retrieved on March 2007, from
http://www.sie.bond.edu.au/.
Dettori, G., Garuti, R., & Lemut, E. (2001). From arithmetic to algebraic thinking by
using a spreadsheet. In R. Sutherland, T. Rojano, A. Bell & R. Lins (Eds.),
Perspectives on School Algebra (pp. 191-208). Dordrecht, The Netherlands:
Kluwer Academic Publishers.
Drouhard, J. P. & Teppo, A. R. (2004). Symbols and language. In K. Stacey, H. Chick
and M. Kendal, (Eds.), The future of the teaching and learning of algebra (pp.
227-266). The 12th ICMI study. Kluwer academic publishers.
Filloy, E., & Sutherland, R. (1996). Designing curricula for teaching
and learning algebra. In A.J. Bishop, K. Clements, C. Keitel, J. Kilpatrick,
& C. Laborde (Eds.), International Handbook of Mathematics Education
(pp. 139-160). Dordrecht, The Netherlands: Kluwer Academic Publishers.
Friedlander, A. (1999). Cognitive processes in a spreadsheet environment. In O.
Zaslavsky (Ed.), Proceedings of the 23rd Meeting of the PME Conference, Vol. 2
(pp.337-344), Haifa, Israel.
Friedlander, A., & Stein, H. (2001). Students’ choice of tools in solving equations in a
technological learning environment. In M. Heuvel-Panhuizen (Ed.), Proceedings of
the 25th International Conference for the Psychology of Mathematics Education,
Vol. 2 (pp. 441-448). Utrecht, The Netherlands.
Friedlander, A., & Tabach, M. (2001a). Promoting multiple representations in algebra.
In A. A. Cuoco & F. R. Curcio (Eds.), The Roles of Representation in School
Mathematics, 2001 Yearbook of the National Council of Teachers of Mathematics
(pp. 173-185). Reston, VA: NCTM.
Friedlander, A., & Tabach, M. (2001b). Developing a curriculum of beginning
algebra in a spreadsheet environment. In H. Chick, K. Stacey, J. Vincent & J.
Vincent (Eds.), Proceedings of the 12th ICMI Study Conference, The Future of
207

Teaching and Learning of Algebra, (pp. 252-257). Melbourne, Australia:
University of Melbourne.
Haspekian, M. (2005). An ”instrumental approach” to study the integration of
computer tool into mathematics teaching: The case of spreadsheets. International
Journal of Computers for Mathematics Learning, 10(2), 109-141. Kluwer
Academic Publishers.
Heid, M. K. (1995). Curriculum and Evaluation Standards for School Mathematics,
Addenda Series: Algebra in a Technological World. Reston, VA: NCTM.
Hershkowitz, R., Dreyfus, T., Ben-Zvi, D., Friedlander, A., Hadas, N., Resnick, N.,
Tabach M., & Schwarz, B. B. (2002). Mathematics curriculum development for
computerized environments: a designer-researcher-learner-activity. In L. D.
English (Ed.), Handbook of the International Research in Mathematics
Education (pp. 657-694). Mahwah, New Jersey: Lawrence Erlbaum Associates.
Hershkowitz, R., & Schwarz, B. B. (1999). The emergent perspective in a rich
learning environment: Some roles of tools and activities in the construction of
sociomathematical norms. Educational Studies in Mathematics 39, 149-166.
Kieran, C. (2004). The core of algebra: Reflections on its main activities. In K.
Stacey, H. Chick, & M. Kendal (Eds.), The Future of Teaching and Learning of
Algebra: 12th ICMI Study (pp. 21-34). Dordrecht, The Netherlands: Kluwer
Academic Publishers.
Rojano, T., & Sutherland, R. (2001). Arithmetic world – Algebra world. In H. Chick,
K. Stacey, J. Vincent, & J. Vincent (Eds.), Proceedings of the 12th ICMI Study
Conference, The Future of Teaching and Learning of Algebra (pp. 515-522).
Melbourne, Australia: University of Melbourne.
Star, J.R. (2005). Re-conceptualizing procedural knowledge. Journal of Research in
Mathematics Education, 36(5), 404-411.
Star, J. R. (2007). Foregrounding procedural knowledge. Journal of Research in
Mathematics Education, 38(2), 132-135.
Sutherland, R., & Balacheff, N. (1999). Didactical complexity of computational
environments for the learning of mathematics. International Journal of Computers
for Mathematical Learning, 4, 1-26.
208

Sutherland, R., & Rojano, T. (1993). A spreadsheet approach to solving algebra
problems. Journal of Mathematical Behavior, 12, 353-383.
Tabach, M., & Friedlander, A. (2004). Levels of student responses in a spreadsheet-
based environment. Proceedings of the 28th International Conference for the
Psychology of Mathematics Education, Vol. 2 (pp. 423-430). Bergen, Norway.
Tabach, M., & Friedlander, A. (2006). Solving equations in a spreadsheets
environment. In C. Hoyles, J. B. Lagrange, L. H. Son & N. Sinclair (Eds.).
Proceedings of the 17th ICMI Study Conference "Technology Revisited" (pp. 539-
545). Hanoi, Vietnam: Hanoi University of Technology. (CD-ROM).
Tabach, M. Hershkowitz, R., & Arcavi, A. (Under revision). Learning beginning
algebra with spreadsheet in a computer intensive environment. Submitted to
Journal of Mathematics Behavior.
Tabach, M., Hershkowitz, R., Arcavi, A., & Dreyfus, T. (in press). Computerized
environments in mathematics classrooms: A research - design view. To appear in
L. D. English (Ed.), Handbook for International Research in Mathematics
Education, 2nd edition. Mahwah, NJ: Lawrence Erlbaum.
Tabach, M., Hershkowitz, R., & Schwarz, B. B. (2006). Constructing and
consolidating of algebraic knowledge within dyadic processes: A case study.
Educational Studies in Mathematics, 63(3), 235-258.
Wilson, K., Ainley, J., & Bills, L. (2005). Naming a column on a spreadsheet: Is it
more algebraic? In D. Hewitt & A. Noyes (Eds.), Proceedings of the Sixth British
Congress of Mathematics Education (pp. 184-191).Warwick, U.K.
Yerushalmy, M., & Chazan, D. (2002). Flux in school algebra: curricular change,
graphing technology, and research on students learning and teacher knowledge. In
L. D. English (Ed.), Handbook of International Research in Mathematics
Education (pp. 725-755). Mahwah, NJ: Lawrence Erlbaum.
209
Copy the following pairs of numbers to your spreadsheet:
1. a) Write in Column C the sum of the numbers from Columns A and B ( =A+B).
b) Write in Column D the sum =2∙A + 2∙B
c) Use Columns A, B, or C in different ways, to create additional columns that are
identical to Column D.
Write down the Excel formulas that you used to obtain the identical columns:
Your first formula __________________
Your second formula __________________
d) Use symbolic language to write the relations between the formula 2∙A + 2∙B and
your formulas for identical columns.
2∙A + 2∙B = ________________
2∙A + 2∙B = ________________
2. a) Write in Column G the product =10·(A + B).
b) Use only Columns A and B in different ways to create other columns that are
identical to Column G.
c) Use symbolic language to write the relations between the formula 10∙(A + B)
and your formulas for identical columns.
10∙(A + B) = _____________
10∙(A + B) = _____________
Figure 1. Spreadsheet-based activity- Identical Columns.
210

1. The following is an Excel table:
a) David wrote in C1 =2·(A1 + B1) and dragged it down.
Fill in Column C the numbers he gets.
b) Write in D1 and E1 expressions that use A and B, and if dragged down, will
generate numbers identical to Column C.
2. Here is another Excel table:
a) Dan wrote in cell C1 the expression = –2·(A1 – B1) and dragged it down.
Fill in Column C the numbers he gets.
b) Write in D1 and E1 expressions that use A and B, and if dragged down will
generate numbers identical to Column C.
Figure 2. Assessment activity - Return of the Identical Columns
211

TABLE 1
Solution paths of the four pairs of students*
Alon and Shir Dar and Or Dan and Shay Gil and Mira
Firs
t Tas
k
A + B + C 2C A + B + C A + B + C
A + A + B + B
@
A + A + B + B 2C 2A + B
2(A + B) @
Seco
nd T
ask
A + B + A + B + … 5A + 5B
10A + 10B
5A + 5B
10A + 10B
@
A + B∙10
(A + B)10
@
10A + 10B 10/A + 10/B
0.1/(A + B)
A + A + 8A + B + B + 8B
15-5A + B
(15–5)(A + B)@
5A + 5B
(5A + 5B)2@
(A6 + B6) + (A + B)4
* Cell colors: Numerical considerations
Symbolic reasoning
Mixed numerical considerations and symbolic reasoning @ indicates teacher intervention.
Italics indicate incorrect expressions.
212

TABLE 2
Strategies and expressions for the first task of the spreadsheet-based activity (N=41)
Strategy Sample of Expressions* Frequency**Numerical
considerations C + C C∙4/2
2C A + B + C42%
Distributive 2(A + B) (A + B) ∙2 24%
Additive A + A + B + B
(A + B) + (A + B)B + B + A + A 20%
Commutative A∙2 + B∙2
2B + 2A B∙2 + A∙2 5%
Other
properties
(A + 2) ∙2 + (B - 2) ∙2
A/0.5 + B/0.5
((A∙4) + (B∙4))/2
C – A + B + A∙2
A∙4∙4/8 + B∙10∙4/20
2A + 2B +C - C
9%
* Cell colors: Numerical considerations
Symbolic reasoning
** Percent out of 87 expressions
213

TABLE 3
Strategies and expressions for the second task of the spreadsheet-based activity
(N=41)
Strategy Sample of Expressions* Frequency**Numerical
considerations 10C 8%
Distributive 10A + 10B 10B + 10A
57%Distributive
(with minor
modifications)
(A∙5 + B∙5)2
5((A∙2) + (B∙2))
(A∙2 + B∙2) ∙5
(A + B) ∙5 + (A + B) ∙5
(A + A + B + B) ∙5
(A + B + A + B)∙5
5∙(A + B) + 5∙(A + B)
(A∙6 + B∙6) +(A + B)∙4
Additive A + A + … + B + B …A + B + A + B…
A + A + 8A + B + B + 8B 10%
Commutative (A + B)∙10 10(B + A) 6%
Other
properties
(A + B)2∙5
5∙2∙ (A + B)
(A + B) ∙5∙2
(A + B) ∙2.5∙4
(A + B)/0.1
10(A + B + A – A)
(A + B)∙20/2
5∙2∙ (A + B)
(5 + 5)(A + B)
(15-5)(A + B)
-10(-A + -B)
(A + B)4∙4∙10/16∙75/300
19%
* Cell colors: Numerical considerations
Symbolic reasoning
** Percent out of 71 expressions
214

TABLE 4
Strategies and correct expressions for the first assessment task (N=136)
Strategy Sample of Expressions* Frequency**Numerical
considerations = – A1 + B2 – B1 1%
Distributive
2A + 2B
A∙2 + B∙2
B∙2 + A∙2
2B + 2A
1(A + B) + 1(A + B) 48%
Additive
A + B + A + B
A + A + B + B
(A + A) + (B + B)
B + 2A + B
B + B + A + A
(A +B) + (A + B)
A + A + B∙2
A∙2 + B + B
27%
Commutative (A + B) ∙2
2(A + B)(B + A)·2 14%
Other
properties
((A∙4 + B∙4)/2
2(A – – B)
–2∙ – (A + B)
(A + B)/
(A/2 + B/2) ∙4
(1 + 1) ∙ (A + B)
(3 – 1) ∙ (A + B)
11%
* Cell colors: Numerical considerations
Symbolic reasoning
** Percent out of 233 expressions
215

TABLE 5
Strategies and correct expressions for the second assessment task (N=136)
Strategy Expressions* Frequency**Numerical
considerations
=–2(A1 – B2 – 1.5)
=– [(–A1) + B2 – B1] 1%
Distributive
– (2A – 2B)
–2A + 2B
–2A – – 2B
–2A + (–2)(–B)
A∙–2 – B∙–2
A∙–2 – (–B) ∙2
B∙2 – A∙270%
Additive
–2A + B + B
B + B – (A + A)
(–A + –A)+ (B + B)
– (A – B + A – B)
– [(A + A) – (B + B)]
–A – A – (–B + –B)7%
Commutative (A – B) ∙ (–2)
(A + –B) ∙2
(–A + B)·2
(B – A)·2 16%
Other
properties
–2(A + (–B))
–4A/2 + 2B (A – B)/ (– )
(A/ –2 – B/ –2) ∙47%
* Cell colors: Numerical considerations
Symbolic reasoning
** Percent out of 134 expressions
216

TABLE 6
Rates of use (in percent) of the distributive law as compared to other strategies in the
correct responses
Tool
Strategy
First
spreadsheet-
based task
N=41
Second
spreadsheet-
based task
N=41
First
assessment
task
N=136
Second
assessment
task
N=136
Distributive 24 57 48 70
Other
transformational
considerations
34 35 51 29
Numerical
considerations42 8 1 1
217

Tabach, M. & Friedlander, A. (2006). Solving equations in a spreadsheets
environment. In C. Hoyles, J. B. Lagrange, L. H. Son & N. Sinclair (Eds.).
Proceedings of the 17th ICMI Study Conference "Technology Revisited" (pp.
539-545). Hanoi, Vietnam: Hanoi University of Technology. (CD-ROM).
(Paper 7)
Proficiency in algebra includes the ability to create a symbolic model (establish an
equation) to a word problem, solve it, and provide an answer to the problem. This
aspect of algebra learning is addressed in this paper. Beginning algebra students
worked on an assignment that required solving equations of the type ax + b = cx + d
even before receiving formal instruction on these issues. By using the spreadsheets,
students confronted the interpretation of the results obtained as output, making salient
the meaning of what an equation is and what solving it means.
218

Paper 7
Solving equations in a spreadsheets environment
Michal Tabach and Alex Friedlander
The Weizmann Institute of Science
Rehovot, Israel
219

3.5 – Long-Term Analysis.
Tabach, M. Arcavi, A. & Hershkowitz, R. (Submitted). Development of symbolic
representations in a computer intensive environment for learning algebra.
Submitted to Educational Studies in Mathematics. (Paper 8)
Whereas papers 4-7 focus on different aspects of algebra learning, this paper presents
a macro-analysis of the changes in students’ work with symbolic representations
throughout the school year, thus completing the characterization of the learning
processes and providing a sound description of students’ end knowledge by the end of
the year. Three related issues are addressed: symbolic representations as a means to
ease the transition from arithmetic to algebra; changes in the use of symbolic
representations that occurred during the year; and the possibility of working
symbolically by the end of the school year without relying on the computerized tools.
The findings indicate that students use spreadsheets to handle symbolic
representations at various levels of sophistication. They show that the spreadsheet
scaffolds student learning, but it does not cause dependency - by the end of the year,
students can freely handle symbolic representations explicitly and generally in a paper
and pencil environment.
227

Paper 8
Development of symbolic representations in a computer
intensive environment for learning algebra
Michal Tabach, Abraham Arcavi and Rina Hershkowitz
The Weizmann Institute of Science
Rehovot, Israel
228

Students’ Development of Symbolic Representations in
a Computer Intensive Environment for Learning Algebra
Michal Tabach, Abraham Arcavi and Rina Hershkowitz
The Weizmann Institute of Science
Abstract
The transition from arithmetic to algebra in general, and the use of
symbolic representations in particular, is a major challenge for students.
In this study we describe and analyze students' learning in a “Computer
Intensive Environment” designed to ease the introduction to algebra.
The research was carried during two consecutive school years in two 7 th
grade classrooms. The results show how students’ initial strategies
(which relied on computerized tools that enabled different students to
work at different levels of symbolic sophistication) developed into
advanced uses of symbolic representations, in which the mediation of the
computerized tools fades away.
Introduction
This paper describes components of a long term study with the overall goal to
observe, analyze and better understand the learning processes of a beginning algebra
course in a specially designed Computer Intensive Environment (CIE). By CIE we
mean a learning environment in which (1) computerized tools are available to learners
at all times (in class and at home), and (2) the learners are free to choose if, when and
how to use these tools while working on problem situations. Thus, the intensiveness
of the environment consists on the availability of the computerized tools at all times -
but not necessarily on the intensiveness of their use. In this CIE, 7th grade students
work with an ad-hoc algebra curriculum based on a functional approach, which is rich
in problem situations, and designed to provide opportunities to work with
spreadsheets (but with only very few instructions as to when and how to do so). The
realistic problems situations, the functional approach and the availability of
spreadsheets provide opportunities to start making use of symbolic representations at
different levels of sophistication, allowing different students to make sense of
symbols and their potential at their own pace. This is possible because the problems
229

require to model phenomena from real life situations (e.g. the growth patterns of
different saving plans) using numerical, symbolical and graphical representations
while keeping in mind the meaning of the situation. A detailed description of this
environment, including some problem situations and the flexible way of working
(freedom to choose a representation, classroom discussions on advantages and
disadvantages of solution strategies and the teacher as a consultant) can be found in
Tabach et al. (in press).
In another study within this project (Tabach and Friedlander, submitted), we found
that the use of spreadsheets in a beginning algebra course allows students to keep in
mind the numerical meaning of equivalent expressions promoting connections and
transitions between numerical sequences and their corresponding algebraic
symbolizations. Moreover, while engaging in meaningful algebraic activities,
different students were free to adopt different learning trajectories, increasing the
variety of solution processes and generating an authentic environment for spontaneous
reflective discussions about the meaning of their results.
In this paper, we concentrate on an aspect missing in the two previous studies: the
way in which the different uses of symbolic representations evolved throughout the
year from novice idiosyncratic approaches to a more expert type use of algebraic
symbols. We begin with a brief background on the initial stages of algebra learning in
general, and the use of computers in mathematics classrooms. We focus on the role of
spreadsheets as mediator for understanding the meaning and the uses of symbolic
representations. Then we present the research goals, methodology, data and analysis.
Finally, on the basis of the findings, we discuss the mediating role of spreadsheets in
the transition from arithmetic to algebra.
Background
The transition from arithmetic to algebra
In many countries students begin to learn algebra after six years of learning
arithmetic, geometry (and possibly some data handling) at elementary school. At that
stage, instruction shifts from working with numbers, their properties and operations
(arithmetic) to the introduction of symbols, generalizations and structures (algebra).
Students are expected to learn the syntax of symbolic expressions and to ‘manipulate’
them. Moreover, students are implicitly requested to abandon some of their views and
practices so ingrained in arithmetic instruction. For example, whereas in arithmetic
230

the equal sign is usually regarded as an invitation to calculate, (e.g. 3 + 2 = means
“add up the numbers and write the sum in the right hand side of the equal sign”), in
algebra, the equal sign usually means equivalence (sometimes it also means that what
is in the left hand side is defined as what is in the right hand side, as in f(x)=3x). The
subtle conceptual shift of the equality sign is problematic for many students (e.g.
Knuth et al., 2006). This and other shifts in perspective have led researchers to
characterize what students experience as a “didactical cut” (Sutherland & Rojano,
1993) that needs to be understood and attended.
Different approaches to algebra learning were proposed in order to meaningfully
bridge the gap between arithmetic and algebra. Such approaches include
“generalization of numerical and geometric patterns and of the laws governing
numerical relations, problem solving, equation solving aided by the use of concrete
models, introduction of functional situations, and the modeling of physical and
mathematical phenomena” (Bednarz et al., 1996, p.3).
Teaching beginning algebra in partially computerized environments.
The advent of computers turned the attention of many researchers to the potential of
technological tools to support students' transition from arithmetic to algebra. It has
been claimed that computerized environments enable to amplify student mental
capabilities and to significantly change the nature of mathematical activity itself (e.g.
Pea, 1985). Also, researchers suggest that explorations with computerized tools
encourage students to plan, to reflect, to produce explanations usually through
classroom discussions (e.g. Heid, 1995).
In the last two decades, several Algebra projects based on the partial use of different
kinds of computerized tools were developed, implemented and studied (e.g. Dettori et
al., 2001; Haspekian 2005; Hershkowitz et al., 2002; Kieran, 1992; Wilson et al.,
2005; Yerushalmy & Schwartz, 1993). These studies are not always fully convergent
in their conclusions.
Appropriate and successful uses of technological tools in beginning algebra have
been described, for example: explorations of every day life problem situations using
several representations (e.g. Heid, 1995), numerical experimentation which evolves
231

into functional connections (e.g. Kieran, 1992), and manipulations of symbolic and
graphical representation of functions (e.g. Yerushalmy & Schwartz, 1993).
Computerized tools may contribute to the learning of algebra, and have a potential to
address syntactic aspects as well as enhanced understanding, mathematical modeling
and the development of symbol sense (Arcavi, 1994). Such aspects of algebra can be
learned by making use of graphical, numerical and symbolic representations whose
static nature with paper and pencil becomes dynamic in computerized environments.
Graphical, numerical and symbolic representations can be used in parallel or be
chosen by the students according to their needs and/or personal preferences. These
various representations might be used to contrast and operate upon mathematical
objects, thus, as Kaput (1992) states, they turn display notation systems in a pencil
and paper environment into action notation systems in computerized environments.
Changing representations can be observed, initiated, and reflected upon, and hence
becomes the source of investigations and insights. Furthermore, the claim is that the
functional approach (i.e., equations consist of pointwise comparisons within a
dynamic phenomenon and syntactic algebraic skills are integrated into, and are at the
service of, the mathematical activity related to these problem situations), enables to
present students with different kinds of changing phenomena and opportunities for
generalization and modeling within several representations (e.g. Bednarz et al., 1996;
Yerushalmy, 2005).
In contrast, other studies end up questioning the benefits of introducing technologies
into the algebra classroom. For example, the potential of spreadsheets to express
algebraic relationships in the form of equations is challenged (Dettori et al., 2001,
Yerushalmy and Chazan, in press). Others are concerned with the kind of
mathematics with which students engage (Hershkowitz & Kieran, 2001), and/or with
the shift of students' difficulties from one area to another (Yerushalmy, 2005).
232

On the basis of the existing literature (e.g. Heid, 1995; Hershkowitz et al., 2002;
Yerushalmy & Schwartz, 1993), we adopted in our studies the functional approach for
teaching beginning algebra. The Algebra course we designed and implemented is
organized around a sequence of problem-situations consisting of phenomena which
can be described by changing quantities. Following Hershkowitz et al. (2002), we
adopted three criteria for the selection of appropriate computerized tools for teaching
algebra. These criteria are based on the potential of the tools to support: (i)
generalization (ii) mathematization (in the sense of Treffers, 1987; see also, van
Reeuwijk, 1995) and (iii) communication. Spreadsheets (e.g. those widely available,
like Excel) seem to fulfill these three criteria, and were widely studied as tools for
learning beginning algebra (e.g. Ainley, 1996; Filloy & Sutherland, 1996; Friedlander
& Tabach, 2001; Haspekian, 2005; Hershkowitz et al., 2002; Sutherland & Rojano,
1993; Wilson et al., 2005).
Spreadsheet as a mediator for understanding and constructing the use of symbolic
representations
Spreadsheets allow students to observe, handle, and generate a large number of
numerical instances, and thus to potentially bridge the sometimes rapid and
disconcerting transition from numbers to symbols, from arithmetic to algebra (Wilson
et al, 2005; Haspekian, 2005). With the creation of numerical sequences out of
existing ones by using either rules (expressions, or formulae) and “dragging”, or by
representing numeric data in graphical form, spreadsheets support the functional
approach to Algebra, and the envisioning of patterns which leads to generalizations.
Whereas mathematization in general and generalization in particular are at the core of
the activity, spreadsheets enable students to remain within and to rely upon the
numerical realm (handling large sets of numerical data by “dragging”) and to slowly
get acquainted with the use, the purpose and the power of symbols. Thus the ideas of
algebra become the core, and the learning of the language to express and operate on
them is introduced according to the student needs, allowing for time to get
accustomed to a new field, within meaningful contexts.
233

Other researchers view spreadsheet as a tool for making sense of the dynamic aspect
of functional relationships between the value of a variable and the value of the
expression (Drouhard and Teppo, 2004). For example, if in a spreadsheet one writes
the expression “=2*A2+1”, then the content of that cell is dynamically dependent on
the content of cell A2. Moreover, many more cells can be created as the list of values
which are a function (2x+1) of the corresponding value of cell A2.
Hershkowitz et al. (2002) indicate that the use of spreadsheets to investigate processes
of variation enables students to the spontaneous use of algebraic expressions.
Spreadsheet users employ formulas (expressed in spreadsheet syntax) as a natural
means to construct extensive numerical tables.
However, the use of spreadsheet for learning the symbolic language of algebra is
questioned among several researchers in mathematics education. One issue of concern
refers to the role of spreadsheets as a mediator for the meaning of a variable and for
understanding symbolic representation.
Some researchers point to the intricacies and potential complications that underlie
symbolization with spreadsheets:
“When students are working with symbols representing locations in the
spreadsheet table, these symbols are neither unknowns, nor variables. They
represent particular locations and in that sense seem too particular to be
variables, although of course the values in cells to which they refer can change;
the cells to which they refer either do or do not have values; when they do, it
seems funny to call them unknowns.” (Yerushalmy and Chazan, 2002, p. 735).
Similar complexities were pointed out by Dettori et al. (2001) - students do not grasp
immediately what is a variable or an unknown, and “the sign of equality used in a
spreadsheet is actually the assignment of a computed value to a cell. (p. 199)”.
But, precisely the ambiguous nature of a cell in a spreadsheet environment is viewed
by Haspekian (2005) and others as a possible source for bridging between arithmetic
and algebra –
“A number in a cell can have several meanings; it can be a specific number or a
cell representing a general number, or a cell representing an unknown number or
a cell representing a relationship between numbers. The spreadsheet-algebraic
234

approach is to view a cell as 'x', either as an unknown or a general number and
to express relationships with respect to this 'x'. (Sutherland and Balacheff, 1999,
p. 22).
A different and very important concern about the use of spreadsheets refers to the
nature of the symbolic representations student prefer when using this tool.
Spreadsheets may enhance and perpetuate the natural tendency of many students to
view a changing phenomena as ‘local’, that is to focus on the connections between
two consecutive elements in a sequence, and thus to use recursive expressions the tool
so readily provides. This may come at the expense of learning and getting used to
explicit general expressions (Noss, 2002; Sasman, Olivier & Linchevski, 1999; Stacey
& MacGregor, 2001). In other words, with spreadsheets local connections have a
preferred status, whereas explicit expressions, which articulate the general structure of
a phenomenon, may be relegated. In a paper and pencil learning environment, such
focus on recursive expressions is rare and explicit expressions predominate.
We took this concern very seriously in our studies, since as mentioned before, in the
CIE we designed, students had spreadsheets available to them and they could decide
whether and how to use them or to prefer other tools or representations. Such freedom
could have indeed resulted in reinforcing students’ attachment to the recursivity
approaches making them unwilling to move forward to explicit expressions.
Our data from the beginning of the school year was encouraging. Five weeks into the
CIE on beginning algebra, our students already used four kinds of symbolic (and
proto-symbolic) representations while working on the following problem situation
(Tabach et al., submitted).
“The following two expressions describe the weekly status of the respective savings
of two friends, Moshon and Robin: 30 + 5x and 60 + 3x (x describes the number
week). Moshon and Robin decided to combine their savings. Express their joint
savings symbolically.”
The representations which involved the use of spreadsheets proposed were:
“Manual use of the tool”: Calculation of the actual amounts in the joined savings
of Moshon and Robin, and entering the resulting numbers into one spreadsheet
column. This way allows students to present the changing amounts numerically
and graphically. However, this strategy did not include any symbolic work and
connections between variables remained unaddressed (at least explicitly).
235
“Multi-variable approach”: Expressing Moshon’s and Robin's savings in two
contiguous columns (A and B), and then using “A+B” (in spreadsheet notation)
as the expression requested. This use of several variables, when only one could
have been used, were also found in a paper and pencil environment (e.g. Arcavi,
1995; Friedlander et al., 1989; Hershkowitz & Arcavi, 1990). Whereas, this
strategy seems more advanced than the previous, here the connections between
variables also remains hidden. However, as in the previous case, the numerical
and graphical representations of the phenomenon were fully available to the
students.
“Recursive expression”: Expressing the joint savings recursively by defining the
starting amount (A1) as 90 (30+60 from each of the savings to be joined), the
next week’s increase as 8 (3+5 from each of the individual increases), and
recursively onwards. Thus their strategy to generate the joined savings in
column A was to write and drag “=A1 + 8”. This recursivity is based on local
connections between two consecutive elements of a sequence. Yet, this can be
considered as a more advanced symbolic representation then the previous two.
“Explicit expression”: Expressing (from the very beginning) the general
relationship “=90 + 8*A” (where A denotes the week's number) and displaying
the full connection among the variables (the joined savings as a function of the
week). This kind of expression enables (as the previous ones) not only to obtain
the numerical and graphical representations available, but it also enables to work
further in a paper and pencil environment, for example to expose more
connections, or to solve equations. In the teaching of algebra the goal is for
students to become competent with such explicit expressions.
Thus the work in a spreadsheet environment and their particular characteristics
(dragging, etc.) allowed to our students different levels of approaching, handling the
problem and making some progress with it. These different levels of work enable a
wider entry point to both the idea of generalization and the tools to handle it (as
opposed to the abrupt “jump” to explicit general symbolic form which is usually
enforced very early on all students in an algebra course). However, although, some
students worked already at this early stage on explicit expressions, the concern still
needs to be fully addressed, as we also expressed it elsewhere.
“We tend to get used to successful ways of work, regardless of the existence of
better or more advanced ones, thus, would generalization by the “adding columns”
236

strategy, or by the recursive approach to spreadsheets, or the use of spreadsheets in
general for this matter, remain “fixed” as a student working habit and impede
progress? Or would this intermediate step be indeed only the means to learn the
explicit formula, of algebra in general? In general terms, would the “fading” of the
“scaffolds” successfully take place, when and how?” (Tabach et al. submitted)
The present study addresses this and other inter-related questions on the basis of our
empirical data.
Research Questions
i) What kind of symbolic representations do students use at the beginning of a CIE
algebra course using spreadsheets?
ii) If/how do students’ symbolic representations evolve during the year long course?
iii) By the end of the year, can students wean themselves from spreadsheets? Can
students be fully functional in a paper and pencil environment with explicit symbolic
expressions?
Methodology
In this section, we describe the setting, research design and tools, and data sources.
Setting
As mentioned, the CIE we designed is characterized by: i) full and unconstrained
access to spreadsheets (Excel) during the learning of beginning algebra, ii) freedom of
choice about if, when and how to use the computerized tools, and iii) an ad-hoc
learning textbook consisting of a sequence of assignments (problem situations and
simple tasks). Only in about one fifth of the assignments, mainly at the beginning of
the course, there is an explicit invitation to use spreadsheets as a working tool
(including the technical instructions thereof). In all other cases, the teacher supported
and legitimized any choices students made regarding the ways, means, and strategies
used to solve the assignments (for more details see Tabach et al., in press).
The tasks
In the following, we describe three assignments: Growing rectangles (Figure 1),
Buying a Walkie-Talkie (Figure 2), and a Present for the Parents (Figure 3). These
assignments are representative of most of the problem situations on which students
worked throughout the school year.
237

_______
Figure 1
This problem was administered to students after three weeks into the course. First,
students were asked to predict (hypothesize) which area will overtake and when,
without performing any calculations or formal mathematical operations. Next, the
students were asked to organize their data regarding the growing rectangles in a
spreadsheet table, record the ways used to construct their table, and compare (first
numerically and then graphically) their predictions with their findings. There are no
specific instructions how to use the computer. In this case, students had to decide how
to organize their data, how to create generalizations and how to express it in a
symbolic format (for more details, see Tabach and Friedlander, 2004).
_______
Figure 2
This assignment was administered five weeks into the course, and it does not include
any mention of computerized tools. Note that, at this point, student had not yet learned
how to add symbolic expressions, or how to solve linear equations (for a more
detailed analysis, see Tabach et al., submitted).
_______
Figure 3
This assignment was administered six months into the course (in March), and it also
does not mention the use of computerized tools.
Research Design and Tools
The CIE was implemented during a year long course (7th grade), taught by the first
author, who served both as the teacher and as a researcher (Tabach, 2006). Data was
gathered during two consecutive courses (two different cohorts). A most important
part of the data gathered consisted of all the students’ working files for each activity,
saved on the school server. All the files from both cohorts were collected and the
symbolic expressions found in them were analyzed and grouped into categories (as
exemplified above). In this paper, we focus on the uses of three out of the four
categories previously described: multi-variable expressions, recursive expressions and
explicit expressions, through nine of the assignments administered during the two
year-long courses. The first category (purely numerical) was rare.
238
Our data analysis will be presented as described in the following figure.
_______
Figure 4
The analysis of the use of symbolic representations by both cohorts in the Growing
Rectangles assignment (Figure 4, item a) at the beginning of the school year will be
the basis for the answer to our first research question. In order to confirm that working
strategies were indeed typical of the course beginnings (rather than being specifically
related to the particular assignment), we also examine data on the use of symbolic
representations in three other assignments administered during the first six weeks of
the course (Figure 4, item b). Next we analyze the symbolic representations found in
another five assignments administered during the last six weeks of the course (Figure
4, item c). The compared and combined analysis of the nine assignments (four at the
beginning of the course and five towards its end) allowed us to propose an answer to
our second research question (a potential evolution in the use of symbolic
representations throughout the year).
Next, we examine in more detail the symbolic representations used by three students
(Figure 4, item d). The analysis also focuses on students’ working processes (through
their recorded dialogues) on two assignments, administered at the beginning of the
year (October) and almost six month later (March)8 – this analysis provide
information about the shifts in the uses of symbolic representations (Figure 4, item e).
On the basis of this analysis, we propose an answer to our third research question.
Data sources
A total of 52 students (in the two cohorts), working in 26 pairs (producing a
maximum of 26 files for each assignment) participated in the study. Given that there
were no significant differences between the two cohorts with respect to the use of
symbolic representations, we will refer to the student population as one whole). The
26 working files of all pairs of students in the two cohorts were collected. All
spreadsheet files from both cohorts were analyzed, and in addition, the audio-records
of 10 pairs of students' working on the second and third assignments above were
transcribed.
Data Analysis
8 The school year runs from September 1st until June 20th. Usually due to the many holidays in September, the month of October is when the intensity of the school year starts.
239

Students used a variety of symbolic representations to generate their data in order to
solve the Growing Rectangles problem. An example of the various symbolic
representations for the first growing rectangle (the width grows by one unit per year
and the length is always three units more than the width) given in Figure 5:
_______
Figure 5
Explicit expressions use only one independent variable to express the full
relationship (see Figure 5 (a)).
Multivariate expressions use more than one variable to express generality. Such
use does not fully express the relations between length and width in the area,
established by the problem (see Figure 5 (b) and (c)).
Recursive expressions generalized and expressed relationships between two
consecutive content locations in a sequence (see Figure 5 (c)).
Table 1 shows the distribution of symbolic representations which were found in the
working files of 26 teams of students from both cohorts.
______Table 1
The “manual” uses found in two teams of students did not include any symbolic
expressions. The other 24 teams used 48 symbolic expressions altogether. Thus, on
average, each team used two kinds of symbolic representations during this activity.
Such a large number of representations reflects the variety of different symbolic
approaches used by students at this stage of their transition from arithmetic to algebra.
It was surprising to find, at such an early stage of algebra learning, the 15 files with
explicit symbolic representations. Yet, we reminded ourselves that these explicit
expressions were produced within this environment, could still be fragile and they not
entail students’ ability to make algebraic manipulations on these explicit expressions,
such as simplifications or solving equations. As mentioned above, we analyzed results
from three other activities also administered at the beginning of the year, in order to
confirm that the variety of symbolic expressions was not related to a particular
assignment. Each of the four graphs (Figure 6) describes the use of symbolic
representations in four different assignments (the lower left graph corresponds to
Growing Rectangles).
240

_______
Figure 6
In these charts, the y-axis displays the different types of representation chosen, and
the x-axis displays the students (arbitrarily numbered)9. Each dot in the chart denotes
the type of symbolic representation used in the assignment by a certain student.
Only the first assignment (Figure 6a) contained clear and detailed instructions for
spreadsheet use, since this was the first problem in the course. These clear
instructions together with the problem formulation resulted in the uniform and
exclusive use of explicit symbolic representations – thus such use should not be taken
as an indication of neither learning nor previous knowledge. As shown in the other
graphs (which reflected chronologically later assignments work), students used a
variety of symbolic representations, and many students used more then one symbolic
representation for the same problem (similarly to the data in Table 1), most of the
representations less sophisticated than the explicit representation.
We can see these data as further evidence that in this course students indeed enacted
the freedom of choice, and worked with a variety of symbolic representations,
according to their needs, preferences and knowledge, across different assignments and
contexts.
We now turn to data collected during six weeks towards the end of the school year on
five assignments, in which students still made extensive use of spreadsheets (Figure
7).
_______
Figure 7
We can see that, as it was in the first four activities presented in figure 6, there still are
a variety of working strategies and students still choose different symbolic
representations. Moreover, students even now choose more than one representation
for the same assignment, and some of them choose different symbolic representations
for similar assignments administered in close dates. However, we can see that the use
of less sophisticated representations (“manual” and multi- variables) almost
9 A methodological aside: Students changed working partners several times along the year in both cohorts. Therefore, we chose to present the data (in each of the four assignments) per individual student (who were tracked according to the pairs in which they participated). Since both cohorts show a similar pattern of use of symbolic representations, we chose to present data from only one of the cohorts.
241

disappeared towards the end of the year, whereas almost all of the representations are
based on either recursive or explicit expressions, with a large concentration of the
latter.
The work of individuals at the beginning and end of the year (Figure 4, item d)
The above analysis focuses on the two classes as a whole - both at the beginning and
at the end of each year long course. We now “zoom-in” into the work of three
students with different mathematical abilities (as judged by the teacher and validated
by their grades), at the beginning and at the end of the course: Amelia (mid-low
ability level), Yuval (mid-upper ability level), and Raz (high ability level). The
symbolic representations used by these three students during the ten assignments
mentioned above are presented in Figure 5. Note that, in this case, each chart displays
data for one individual student, where the y-axis still displays the chosen type of
symbolic representation, and the x-axis each of the 10 assignments (number six is
unused and denoted the “break” between the beginning and the end of the school
year).
_______
Figure 8
As the other students, also Amelia, Yuval and Raz used various symbolic
representations within the same assignment. However, towards the end of the year
both Yuval and Amelia have a higher concentration of more sophisticated
representations in the five assignments administered, with a clear increase in the use
of explicit formula.
Two similar activities, administered in October and March (Figure 4, item e)
In this section, we take a closer look at the nature of student work and their shifts
thereof while working on Buying a Walkie-Talkie and Present to the parents, which
were administered at the beginning and at the end of the year respectively. These
assignments are mathematically similar, hence making comparisons possible.
The following data (see Table 2) shows the extent of the use of spreadsheets at the
beginning and at the end of the school year.
______Table 2
242

While a majority of teams (73%) used the spreadsheet for answering the activity at the
beginning of the year, towards the end of the year only about one fourth of the teams
(23%) used the spreadsheet for a very similar mathematical task. Thus about half of
the students moved from computer use to a paper and pencil only, even when the
computer was available to them.
In order to better understand this shift, we looked at some working records on the two
assignments. The following are two pieces of data, one from each assignment, in
chronological order for a same pair of students.
In Buying a Walkie-Talkie activity, Natally and Eli were trying to find a pair of
children who will reach 400 NIS first, when the following dialogue took place:
Natally: Let's make a table with Excel.
Eli: They need 400 NIS, they will not have it. [It is not clear to which pair she is referring].
Eli: They will!! [Still not clear to which pair she is referring].
Natally: Yes, but we also need to know in what week.
Natally states clearly why she would like to use Excel – she cannot know when each
pair of joined savings will reach 400 NIS. That is, at this stage, she cannot solve an
equation of the type ax + b = 400. Five months later, in Present for the Parents
activity, the same team used an equation of the type ax + b = 600 in order to answer a
similar question. Creating a spreadsheet table was not their first choice of a working
tool anymore. Rather, the students preferred to use a relatively new learned tool –
solving an equation with paper and pencil.
This shift in tool use is representative not only of the fact that students did not
perpetuate the use of spreadsheets, but it illustrates the essence and reason for such
shift. The students used spreadsheets to support a proposed solution using the only
tool that could help them at the moment: the spreadsheet, which could easily show
when the amount of 400 will be reached. The algebraic tool these students learned
later was adopted because of they could appreciate the ease and efficiency of solving
an equation (which now they are proficient to state explicitly). Thus spreadsheets
instead of becoming a tool that perpetuated less sophisticated handling of symbolic
representations, it served as a springboard which facilitated the learning of solving an
equation with paper and pencil. We propose that this facilitation was possible
because: a) the situation led to the need to know the week for which a certain amount
of money is reached (i.e. the intuitive meaning of an equation was grasped in terms of
243

the situation), and b) the availability of a simple tool which students knew would help
them to provide an answer. Thus the use of symbolic equations with paper and pencil
was preceded by the confrontation with a situation in which an equation is sought by
the students in the solution process (even without using the noun) and by having a tool
to simply solve it. Having had such learning experiences, a “formal” equation and its
syntactic solution seem to fall in place and fully adopted later on.
DiscussionThis study describes parts of a comprehensive research and development project
designed to facilitate the transition from arithmetic to algebra, a transition (often
called a “gap) well known for its many difficulties documented by many research
studies.
We described some of the results of this project indicating how a learning
environment, which includes a specially designed curriculum which makes uses of
technological tools, supports the meaningful introduction of algebra.
This study shows that the main characteristics of the learning environment which
played a role in supporting students’ transition from arithmetic to algebra are:
- A curriculum rich in problem situations – these problem situations allow
students to rely on meaningful context and harness them in order to make
sense of new ideas and approaches and of the tools offered to them;
- Computerized tools – spreadsheets are the tools that come handy to students as
they enable them to remain in the numerical realm while making advances
with partial symbolic representations, and which enable them to make progress
with the problems;
- Classroom practices – students are offered the freedom to use the tools as they
wish and when they wish. Such freedom results in many problem solving
strategies which become the topic of whole classroom discussions (Tabach et
al., in press).
In this paper, we presented results which addressed three main questions (posed
above) as follows:
1. Throughout the year students used a variety of symbolic representations. The
variety expressed itself among different learners in the same activity, as well
as within the same student, who often used more then one symbolic
244

representation to generalize the same phenomenon in a given activity, and also
across activities. The mediation of technology and the freedom offered to
students enabled them to approach the problems in different ways, attuned to
their own pace, understanding and level of sophistication. All students could
benefit from using intermediate approaches and the classroom discussions
provided them with opportunities to experience and evaluate other students’
ways of producing symbolic representations. These findings expand upon
findings from previous studies (Tabach & Friedlander, submitted; Tabach et
al., submitted).
2. Towards the end of the year, students expand their initial uses of symbolic
representations, from multi-variable and recursive (as supported by the
spreadsheets) towards explicit symbolic expressions. Almost none of the less
sophisticated symbolic representations ("Manual" use and "Multiple"
variables) were found during the last six weeks of learning. Thus beyond
inclusiveness (of all students to the meaningful learning process, respecting
diversity of approaches and pace), this study shows that students make
progress towards the learning of expressing problems symbolically,
manipulating these expression and solving equations (which in turn solve the
problems). Thus, we see that this environment supports knowledge growth and
sophistication.
3. Towards the end of the year, most students shifted to a pencil and paper
environment (especially to solve linear equations), in which they can identify
the need to use equations, and be able to solve them symbolically. Thus, in this
environment, the concern related to the dependency on spreadsheets that may
develop showed to be unfounded. Quite the contrary, spreadsheets seemed to
be a productive intermediary which is abandoned after its role as such was
fulfilled. It is interesting to note, that students went back to spreadsheets when
they felt that its mediation power can help them again, in the lack of other
tools, for example, when facing non-liner problem situations (which students
encounter during their learning, in accordance to a design aimed at supporting
rich and diverse types of problems).
More research on environments of the kind is a challenge ahead of the mathematics
community in order to better understand how to further harness the potential of
245

technological tools, and which kinds of pedagogies and classroom environments
should accompany their introduction.
246

References
Ainley, J. (1996). Purposeful contexts for normal notation in spreadsheet environment.
Journal of Mathematics Behavior, 15, 405-422.
Arcavi, A. (1994). Symbol sense: informal sense-making in formal mathematics. For the
Learning of Mathematics. 14 (3), 24-35.
Arcavi, A. (1995). Teaching and learning algebra: Past, present and future. Journal of
Mathematical Behavior, 14 (1), 145-162.
Bednarz, N., Kieran, C., Lee, L. (Eds) (1996). Approaches to Algebra. Perspectives for Research and Teaching. Dordrecht, The Netherlands: Kluwer
Academic Publishers.
Dettori, G., Garuti, R., & Lemut, E. (2001). From arithmetic to algebraic thinking by using a
spreadsheet. In R. Sutherland, T. Rojano, A. Bell, & R. Lins (Eds.), Perspectives on School
Algebra (pp. 191-208). Dordrecht, The Netherlands: Kluwer Academic Publishers.
Drouhard, J. P. & Teppo, A. R. (2004). Symbols and language. In K. Stacey, H. Chick and M.
Kendal, (Eds.), The future of the teaching and learning of algebra (pp. 227-266). The 12th
ICMI study. Kluwer academic publishers.
Filloy, E., & Sutherland, R. (1996). Designing curricula for teaching and learning algebra. In
A.J. Bishop, K. Clements, Keitel, C., Kilpatrick, J. & Laborde, C. (Eds.), International
handbook of mathematics education (pp. 139-160). Dordrecht, The Netherlands: Kluwer
Academic Publishers.
Friedlander, A., Hershkowitz, R., & Arcavi, A. (1989) Incipient ”algebraic” thinking in pre-
algebra students. Proceedings of the 13th Conference of the International Group for the
Psychology of Mathematics Education, Vol. 1 (pp. 283-290). Paris, France.
Friedlander, A & Tabach, M. (2001). Developing a curriculum of beginning algebra in a
spreadsheet environment (Vol. 1 pp. 252-257). In H. Chick, K. Stacey, J. Vincent & J.
Vincent (Eds.). The Future of Teaching and Learning of Algebra, Proceedings of the 12th
ICMI Study Conference. The University of Melbourne, Astralia.
Haspekian, M. (2005). An ”instrumental approach” to study the integration of computer tool
into mathematics teaching: the case of spreadsheets. International Journal of Computers for
Mathematics Learning, 10(2), 109-141. Kluwer academic publishers.
247

Heid, M. K. (1995). Curriculum and Evaluation Standards for School Mathematics, Addenda
Series: Algebra in a Technological World. Reston, Virginia: The National Council of
Teachers of Mathematics.
Hershkowitz, R., & Arcavi, A. (1990). The interplay between student behaviors and the
mathematical structure of problem situations - issues and examples. Proceedings of the 14th
Conference of the International Group for the Psychology of Mathematics Education, Vol. 2
(pp. 193-200). Oaxtepec, Mexico.
Hershkowitz, R., Dreyfus, T., Ben-Zvi, D., Friedlander, A., Hadas, N., Resnick, T. & Tabach,
M. (2002). Mathematics curriculum development for computerized environments: A
designer-researcher-teacher-learner activity. In L. English (Ed.). Handbook of International
Research in Mathematics Education (pp. 657-694). Mahwah, NJ: Lawrence Erlbaum.
Hershkowitz, R., & Kieran, C. (2001). Algorithmic and meaningful ways of joining together
representatives whithin the same mathematical activity: An experience with graphing
calculators. In M. van den Heuvel-Panhuizen (Ed.), Proceedings of the 25st Conference of the
International Group for the Psychology of Mathematics Education. Vol. 1 (pp. 96-107).
Utrecht, The Netherland
Kaput, J. (1992). Technology and mathematics education. In D.A. Grouws (Ed.), Handbook of
Research on Mathematics Teaching and Learning (pp. 515-556). Reston, VA: National
Council of Teachers of Mathematics.
Kieran, C. (1992). The learning and teaching of school algebra, In D. A. Grouws (Ed.) ,
Handbook of Research on Mathematics Teaching and Learning, A Project of the National
Council Teachers of Mathematics, pp. 390-419, Reston, VA: National Council of Teachers
of Mathematics.
Knuth, E. J., Stephens, A. C., McNeil, N. M. and Alibali, M. W. (2006). Does understanding
the equal sign matter? Evidence from solving equations. Journal for Research in
Mathematics Education, 37(4), 297-311.
Noss, R. (2002). For a learnable mathematics in the digital culture. Educational Studies in
Mathematics, 48, 21-46.
Pea, R.D. (1985). Beyond amplification: Using the computer to reorganize mental functioning.
Educational Psychologist, 20 (4), 167-182.
van Reeuwijk, M. (1995). Students knowledge of algebra. Proceedings of the Eighteenth
International Conference for the Psychology of Mathematics Education (PME 19, Vol. 1,
pp. 135-150). Recife, Brazil: Universidade Federal de Pernambuco.
248

Sasman, M. C., Olivier, A. & Linchevski, L., (1999). Factors influencing student's
generalization thinking processes. In O. Zaslavsky (Ed.), Proceedings of the 23rd Conference
of the International Group for the Psychology of Mathematics Education (Vol. 4, pp. 161-
168). Haifa, Israel: PME.
Stacey, K., & MacGregor, M. (2001). Curriculum reform and approaches to algebra.
In R. Sutherland, T. Rojano, A. Bell, & R. Lins (Eds.), Perspectives on school
algebra (pp. 141-153). Dordrecht, The Netherlands: Kluwer.
Sutherland, R. and Balacheff, N. (1999). Didactical complexity of computational environment
for learning of mathematics. International Journal of Computers for Mathematics Learning,
4, 1-26.
Sutherland, R., & Rojano, T. (1993). A spreadsheet approach to solving algebra
problems. Journal of Mathematical Behavior, 12, 353-383.
Tabach, M. (2006). Research and teaching – Can one person do both? A case study. In
J. Novotna, H. Moraova, M. Kratka and N. Stehlikova (Eds.), Proceedings of the
30th Conference of the International Group for the Psychology of Mathematics
Education. Prague, Czech Republic: PME.
Tabach, M. & Friedlander, A. (2004). Levels of student responses in a spreadsheet-
based environment. In M. J. Hoines & A. B. Fuglestad (Eds.), Proceedings of the
28th Conference of the international Group for the Psychology of Mathematics
Education, Vol. 2. (pp. 423-430) Bergen University College: PME.
Tabach M. & Friedlander, A. (submitted). Understanding equivalence of algebraic
expressions in a spreadsheet-based environment. Submitted to International
Journal of Computers in Mathematics Education.
Tabach, M., Hershkowitz, R., Arcavi, A. & Dreyfus, T. (in press). Computerized
environments in mathematics classrooms: A research - design view. To appear in
L. D. English (Ed.), Handbook for International Research in Mathematics
Education, 2nd edition.
Tabach, M. Hershkowitz, R. & Arcavi, A. (submitted). Learning beginning algebra
with spreadsheet in a computer intensive environment. Submitted to Journal of
Mathematics Behavior.
Treffers, A. (1987). Three dimensions. A model of goal and theory description in
mathematics education. Dordrecht, The Netherlands: Kluwer.
249

Wilson, K., Ainley, J., & Bills, L. (2005). Naming a column on a spreadsheet: Is it
more algebraic? In D. Hewitt & A. Noyes (Eds.), Proceedings of the Sixth British
Congress of Mathematics Education (pp. 184-191).Warwick, U.K.
Yerushalmy, M. (2005). Challenging known transitions: Learning and teaching algebra with
technology. For the Learning of Mathematics 2 (3), 37-42.
Yerushalmy, M. & Chazan, D. (2002). Flux in school algebra: curricular change, graphing
technology, and research on students learning and teacher knowledge. In L. D. English (Ed.),
Handbook of international research in mathematics education (pp. 725-755). Mahwah, NJ:
Lawrence Erlbaum.
Yerushalmy, M. & Chazan, D. (in press). Technology and curriculum design: The ordering of
discontinuities in school algebra. To appear in L. D. English (Ed.), Handbook for
International Research in Mathematics Education, 2nd edition.
Yerushalmy, M. & Schwartz, J. (1993). Seizing the opportunity to make algebra
mathematically and pedagogically interesting. In T. A. Romberg, E. Fennema & T. P.
Carpenter (Eds.), Integrating Research on Graphical Representation of Functions (pp. 41-
68).
250

Figures
Growing Rectangles
Rectangle A Rectangle B Rectangle C
. . .
. . .
. . .
At the end of the first year, its width is one unit, and it grows by an additional unit each year.The length of this rectangle is always longer than its width by three units.
At the end of the first year, its width is one unit, and it grows by an additional unit each year.
The length of this rectangle is 10 units and remains constant.
At the end of the first year, its width is one unit, and it grows by an additional unit each year.
The length of this rectangle is always twice its width.
At what stages of the first ten years does the area of one of the rectangle overtake the others’ area?
Figure 1: The Growing Rectangles activity
251

Buying a Walkie-Talkie
The following expressions describe the amount of money (in NIS10) in the savings box of different children (x denotes the number of the week).
Dina 7x Yoni 300
Karin 10x Rubin 60 + 3x
Moshon 30 + 5x Eliran -20 + 4x
Danny 300 - 5x Moti -70 + 7x
Example: At the beginning of the year Eliran had a debt, and each week he added 4 NIS to his box.
The children decided that, in order to be able to buy a Walkie-Talkie costing 400 NIS, they will join pairs of saving boxes.
3. Find expressions, as short as possible, to describe the amounts of money in the joined saving boxes of the following pairs. (Try first to express verbally the joined savings for each week).
Dina and Karin ____________ Moshon and Danny __________
Dina and Moshon __________ Moshon and Yoni ___________
Dina and Danny ____________ Moshon and Rubin __________
Dina and Yoni ______________ Moshon and Eliran __________
Dina and Rubin _____________ Moshon and Moti ___________
Dina and Eliran ____________ Danny and Rubin ___________
Dina and Moti ______________ Danny and Eliran ___________
4. Which of these pairs (or perhaps another possible pair), will be the first to collect the 400 NIS needed to purchase the Walkie-Talkie?
Figure 2: The Buying a Walkie-Talkie activity
10 NIS is the acronym of the Israeli currency (New Israeli Shekels)
252

Present for the Parents
The five siblings, Avi, Ben, Gal, Danielle and Hilla decided to buy together a present
for their parents’ 25th wedding anniversary, which will take place in half a year. Each
of them reported on the present status of his/her bank account.
Avi had 300 NIS in his account, and each week he adds 40 NIS.
Ben had (-300) NIS in his account (a debt), and each week he adds 60 NIS.
Gal presented her account in the following table:
Week # 0 1 2 3 4 5 6
Amounts of money 500 480 460 440 420 400 380
Danielle presented her account with this expression: –100 – 15x, where x stands for the number of weeks.
Hilla presented her account with the following graph:
1. Find expressions to describe the amounts of money in the joined accounts of
the following pairs.
2. In what week the joined account of each pair will have 600 NIS?
Figure 3: the Present for the Parents Activity
253

(a) Use of symbolic representations during
the Growing Rectangles assignment
(b) Use of symbolic representations during the
first six weeks of the course (three other assignments).
(c) Use of symbolic representations during the
last six weeks of the course (five other assignments).
(d) A fine grain analysis on symbolic representations used by three students (at
the beginning and the end of the year)
(e) Comparison of the use of symbolic representations in two assignments, (at the beginning and the end of the year)
Figure 4: The data analysis
254

A B C D1 Year Width Length Area2 1 =A2 =A2+3 =A2*(A2+3)
(a) Explicit expressions.
(b) Explicit and multivariate expressions.
A B C D1 Year Width Length Area2 1 4 1 =A2*B23 =A2+1 =B2+1 =C2+1 =A3*B3
(c) Recursive and multivariate expressions.
Figure 5. Sample of symbolic representations in the Growing Rectangles activity.
255
A B C D1 Year Width Length Area2 1 =A2 =A2+3 =B2*C2

256

08/09
0
1
2
3
4
0 5 10 15 20 25 30
Students
Expr
ession
s
27/09
0
1
2
3
4
0 5 10 15 20 25 30
Students
Expr
ession
s
257

Figure 7: Use of symbolic representations in five activities at the end of the year
258

Raz
0
1
2
3
4
0 2 4 6 8 10 12
Activities
Expr
ession
s Amelia
0
1
2
3
4
0 2 4 6 8 10 12
Activities
Expr
ession
s
Figure 8: Uses of symbolic representations by Amelia, Yuval and Raz at the
beginning and at the end of the school year
Yuval
0
1
2
3
4
0 2 4 6 8 10 12
Activities
Expr
ession
s
4 - Explicit
3 - Recursive
2 - Multiple
1 - Manual
259

Tables
“Manual” uses
Multiple variables
Recursive expressions
Explicit expressions
Total
# of symbolic representations
2 20 13 15 50
Table 1: symbolic representations for Growing Rectangles (n=26).
Did not use spreadsheet Used spreadsheet
Beginning 27% 73%
End 77% 23%
Table 2: Relative frequencies of spreadsheet use
by teams of students for each assignment.
260

3.6 – Introspective analysis.
Tabach, M. (2006). Research and teaching – Can one person do both? A case study. In
J. Novotna, H. Moraova, M. Kratka and N. Stehlikova (Eds.), Proceedings of
the 30th Conference of the International Group for the Psychology of
Mathematics Education. Prague, Czech Republic: PME. (Paper 9)
Many studies focusing on teaching and teachers address the advantages and the
methodological dilemmas posed by the dual role of teacher and researcher (e.g., Ball,
2000; Lampert, 1990). This paper addressed these advantages and dilemmas from the
perspective of and focusing on learning processes.
261

Paper 9
Research and teaching – Can one person do both? A case
study
Michal Tabach
The Weizmann Institute of Science
Rehovot, Israel
262

RESEARCH AND TEACHING---CAN ONE PERSON DO BOTH?
A CASE STUDYMichal Tabach
The Weizmann Institute of ScienceIn the last two decades, it seems that the border between teaching and research has become blurred. Teachers are doing research in their classrooms, while researchers are turning to teaching the population they are investigating. This article is an introspective one, in which I exemplify this issue through my own experience of teaching and doing research in parallel. A short analysis is presented of the various roles of teachers and researchers. I then present a case study in which I held both roles simultaneously---researcher and teacher. I describe the strategies I used to distinguish between the two roles, as well as examples of synergy and clashes between them. The case study is used as an example to
illuminate possible gains and losses in holding such a dual role .In mathematics education, being teacher and researcher are two related roles. For one or two decades now, we have been observing a phenomenon in which people are deciding, or feeling the need to "serve" in both roles---teaching and research. In this presentation, I take an introspective stand, as I trace my own professional development from a teacher, to a teacher involved in research, to a researcher-teacher. While examining my path, I will refer to the similarities and differences between the two practices, and examine two types of mixed practices: teacher-researcher and researcher-teacher. I will present the case of my Ph.D. study, as an example illustrating the synergy and clashes that might occur
while fulfilling the two roles in parallel.I started my path in the mathematics education community as a teacher. During my second year as such, I became an experimenting teacher in the CompuMath project (Hershkowitz et al., 2002). I was given new curriculum materials, and I tried them in my class with my students. I was asked to reflect on the given activities, and was encouraged to make my own suggestions regarding ways of improving teaching/learning processes. In addition, during one lesson per week, an experienced researcher came to my classroom to observe and analyze learning. I very quickly became a member of the research team and found myself
involved in reflective talks regarding the materials and classroom events .DIVERSITY OF TEACHER AND RESEARCHER PRACTICESThe differences between the practices of teaching and research can be examined in terms of several aspects, among them the training processes,
263

the goals, and roles in the classroom. I examine each of these aspects here.
The training processThe educational backgrounds of a teacher and researcher differ: the teacher specializes in domains and aspects related to the contents s/he teaches (content knowledge), general pedagogical aspects (pedagogical knowledge), and aspects relating to the pedagogical knowledge of the contents s/he teaches (pedagogical content knowledge) (Shulman, 1986). The researcher's academic background and training include content knowledge, knowledge regarding the research literature in the field of study. A researcher should be familiar with a variety of research tools, with ways of matching research questions, methodologies, tools, and data
analyses.Common issues in teachers' and researchers' education are areas of the topic of specialization (i.e. mathematics), basic cognitive psychology and possibly, learning theories. But even when learning the same topics, the
emphases are different.The initial goalsA teacher and a researcher in the same class have different goals. The teacher's goals vary from general educational goals, relating to values and norms, through general goals which are related to mathematics itself (such as gaining skills and language), to goals relating to specific content knowledge. The teacher's aims include students' understanding, students' success in examinations, students' interest, involvement and even enjoyment of mathematics. The researcher's goal is to answer a research question (or questions) s/he posed, by collecting relevant data for the
research.Role in the classroomThe aforementioned differences in goals express themselves in the roles of the teacher and researcher in the classroom. The teacher is responsible for classroom organization---both physical and mental (i.e. the physical organization of the classroom and the students, creating learning sequences according to teaching goals, curriculum, and so on). The teacher must instantly respond to students' needs, distribute his/her attention among the students, follow individual students (who need help), and solve problems which do not relate to learning (e.g., discipline problems). The intensity of the interactions among the teacher and students in the classroom dictates the teacher's instant reactions during lesson time. Such reactions are based on a combination of the teacher's knowledge, experience and intuition. However, a reflective teacher may examine the outcomes of her/his reactions and their influence on the course of events, and may modify her/his reactions to classroom
264

happenings, to put learning back on the "right course" (Novotna et al., 2003). Teacher reactions and initiatives are guided by students' interests (from both affective and cognitive aspects), and the singularity of the
situation (Labaree, 2003) .In contrast, the researcher is not responsible for classroom occurrences. S/he is motivated by the need to know and understand what is going on and why (Labaree, 2003). The researcher wishes to understand the sources of a certain thinking process or strategy students followed, sometimes regardless of the learning that did or did not take place. To achieve this, the researcher may sit near a small group of learners and observe their work from start to finish, as it is happening. Meanwhile, the teacher is moving among all the learners, watching parts of the learning processes of many students. The researcher will usually record observations, and hence can observe events and episodes, in an attempt to analyze and understand what happened from different perspectives, and
to suggest interpretations and conclusions .The functions of the researcher and teacher might align while interacting with students, and asking questions. The teacher's goal is to listen (even if the teacher is listening in order to plan his/her next step, and not necessarily to completely understand the learning processes), and in this
respect, s/he might resemble the researcher.Both teacher and researcher function as designers: the teacher chooses curriculum materials s/he may adopt and change to suit instructional goals. A researcher might design his/her research tools, or adapt existing
tools. Yet, the design goals are different .SummaryGiven the differences in training, aims and functions, it appears that research and teaching are so far apart that the gap could never be bridged. This issue has been referred to in the literature (Labaree, 2003). However, one of the research goals in mathematics education is an understanding of learning processes in order to improve teaching. There are descriptions of professional developmental processes that include the alternating performance of teaching and research, which specifically claim that the two points of view complement and empower one another (Magidson,
2005).THE TEACHER-RESEARCHER VERSUS RESEARCHER-TEACHERA growing body of research performed in recent years describes teachers who conduct research concerning their own practice. In the US, such research is called Practitioner Research, in England, Action Research. Here, I refer to a teacher doing research as a teacher-researcher. The role of teacher-researcher has some typical characteristics: it is performed by
265

in-service teachers, who are involved in some sort of teacher's group---school staff, professional development program, or academic courses. Sometimes it is driven by the teacher's own needs concerning her/his practice, but in other cases it is driven by some main theme which is the focus of the group's leader (usually an academic member). The research is conducted by the teacher in his/her own classroom. It is sometimes aimed at establishing a practical knowledge base, including an attempt to articulate an epistemology of practice that includes experiences with reflective teaching, action research, teacher study groups and teacher narratives (Anderson, 2002; Matz & Page, 2002). The phenomenon of teacher-researcher is widespread, and it is perceived as advancing one's teaching practice. On the other hand, the possible contribution of research conducted by teachers to the knowledge of mathematics education is questionable (Breen, 2003; Labaree, 2003), since such research is preliminarily defined and focused according to the teacher's specific
needs, and is therefore bound by them.On the other hand, there is a trend in cognitive research that involves researchers choosing to go into the practice of teaching in order to conduct their research in a class that they themselves are teaching. I call these people researcher-teachers. These researcher-teachers are driven by a research question that has evolved from the literature of mathematics education, or their own curiosity, or both. To answer the question, the
researcher chooses to be an involved researcher. For example:When the purpose of the study is to investigate and expose the
considerations and dilemmas involved in teaching in classrooms from the teacher's perspective, the researcher-teacher uses her/his own classroom to conduct the research. Ball (2000) reflects upon her own teaching, to expose the knowledge a mathematics teacher needs to teach in elementary school. She offers an insider's
perspective of people who belong to the classroom community.Lampert (1990) examines the possibility of teaching mathematics in
a manner resembling the way mathematical knowledge is constructed within a community of mathematicians.
Rosen (in Novotna et al., 2003) uses teaching in his own class as a base for the knowledge he may present to other teachers when he offers alternative teaching methods. Rosen develops his teaching methods in a "real" classroom setting, with all of its inherent
complications .These are some examples of researchers who were motivated by the search for answers to their research questions and chose to be teachers.
The focus of these researchers was the teacher and the teaching.Both terms, teacher-researcher and researcher-teacher, describe one person involved in two domains: research and teaching. The main
266

dilemma occurs in class---how does this one individual react to classroom events in a way that will take into account the researcher's and teacher's
agendas?FROM TEACHER TO RESEARCHER-TEACHER---A PERSONAL CASE STUDYI am a PhD student in the Department of Science Teaching at the Weizmann Institute of Science, where I completed my Master's thesis while, in parallel, accumulating extensive experience as a mathematics teacher. As such, my professional training includes both teaching and research. In my PhD study I am conducting research in which I define myself as a researcher-teacher. The source of my research work is twofold: the literature, which reports research findings in mathematics education regarding the benefits of initiating the use of computers in the mathematics classroom, and my own curiosity as a teacher about the possibilities of unlimited computer use. My goal is to examine learning in an environment in which a computer is always available, and its use is optional---students can decide if, when and how to work with computers. This has led me (as a researcher with education and experience in teaching) to design an innovative learning environment, and to implement
the teaching in this environment for a 2-year period.I am aware of the dilemma involved in a single person doing both research and teaching. I have tried to separate the roles temporally: the learning environment and materials were designed before I started teaching, from a researcher's point of view, while bearing in mind the practical aspects of classroom life (duration, difficulty level, applicability, content, etc.). During the school year, teaching in the classroom was done from the teacher's point of view, while keeping an "observer's eye" on things, as is typical for a researcher (keeping a diary of interesting phenomena, documenting classroom work). While I am in classroom, the leading perspective is teaching (although awareness of the research exists). This limits my ability to observe (for practical reasons), which I try to overcome by means of documentation. Reflection after teaching is done from a researcher's point of view: studying events which took place, while watching and listening to recorded data from the classroom. Students' work files are examined after class from a researcher's perspective, bearing in mind that students' needs will determine my
course of action as a teacher in the next lesson .The teacher's role is a demanding one. The teacher's first priorities are responding to students' needs, which are many. In some lessons, I found myself acting as a teacher only, while in others, students functioned in a way that allowed me to observe parts of the events as a researcher. One of the things that helped me keep my "research eye" open was the teaching diary. During about a third of the research period, I sent my diary to my
267

supervisors, after each lesson. Each of them read the diary and sent back questions, remarks, and insights regarding my research and even teaching. Since both are experienced researchers, their attitude towards the episodes I described reflected mainly that perspective. Reading their reactions drew my attention to the research aspects during my work as a teacher. In point of fact, an interested colleague, who offers support and interpretation, is a key factor in the professional development of a teacher (Davis, 1997). The interest, support and interpretation of research experts
played a role in shaping my research view of my class.In the following, I give some examples from my researcher-teacher experience, which demonstrate cases in which a researcher would have investigated more, but my obligations as a teacher towards my students did not allow it, as well as cases in which being an insider (teacher)
helped me identify events which called for research.A clash scenario: M-teacher disturbs M-researcher11
As already mentioned, in the initial stage of the research, M-researcher designed the learning environment, including modifications of activities.
In one such task, the following question was posed :In the Excel file p80.xls you will find the following table. Open the file
and fill in the table. Write down formulas which you used.A B C D
1 The large number
The small number
The difference between A and B
How many times A is greater than B
2 1
3 1
4 1
5 1
M-researcher, from a designer's perspective, prepared this question to encourage the use of formulas and demonstrate the numerical power of Excel. M-teacher saw that students answered this question using three different tools: some calculated using pencil and paper (or a calculator), some used formulas in Excel, and some answered this question in a Word file. M-teacher was surprised by this third way, and M-researcher was troubled by the thought that students might perceive the computer as one entity, and not distinguish among the different tools---when is it preferable to use Excel? (The lesson took place in the third week of the course.) M-researcher wanted to administer a questionnaire in the next 11 I use the term M-teacher to describe my perspective as a teacher, and M-researcher when I am referring to my perspective as a researcher.
268

lesson, to ask students how they worked and why they chose that method. M-teacher thought that such a questionnaire was not directly relevant to the learning sequence, but in the end, she administered the questionnaire. M-teacher was surprised to read the students' answers. Only one student reported using Word, while the rest reported manual work or the use of Excel, mentioning the advantage of formulae and the "drag" operation. M-teacher was embarrassed: she had counted 10 students using Word during that lesson. What happened? M-researcher wanted to get to the bottom of this issue, confronting students' files with their questionnaire, but this time M-teacher decided it was sufficient, at this stage, that students could declare the benefits of using Excel. What did M-researcher
lose? We cannot say.A clash scenario: M-researcher "takes over" M-teacher in classIn the second year, before the opening lesson, M-researcher read the diary of the opening lesson from first year. M-teacher felt that she was well prepared for this lesson, since she "knew" what was going to happen. I quote from that lesson's diary: "Reading last year's diary was a mistake! It made me expect a certain flow of events, the one that had occurred last year. This expectation led to a 'bumpy' lesson flow, because I was looking for last year's remarks!" M-teacher felt that this situation was a result of
the "presence" of M-researcher.Synergy: M-teacher affects M-researcher, by identifying a phenomenon for researchDuring class work on an activity in which students look for equivalent expressions for a given expression by applying distributive law, M-teacher saw that students produced some unexpected expressions. In the diary entry from that lesson, M-teacher wrote a remark to M-researcher, to examine students' working files closely. M-teacher designed a short assessment activity on the same mathematical topic, and administered it to the students. M-teacher checked the students' work, and found a wide variety of expressions. As a result, M-researcher collected the work done by students from other classes for future research. In the following year, M-researcher invited another researcher to observe the activity. More details about this activity and the findings regarding learning algebraic manipulations in an Excel environment can be found in Tabach &
Freidlander (submitted) .
Synergy: M-researcher affects M-teacher, by creating learning opportunitiesIn the diary from Oct 1, 2003, before the lesson, M-teacher wrote: "The problem I see in the coming lesson is that the activity does not invite students to use Excel. It will be interesting to see if students will surprise me once again." The next day, when M-teacher arrived at school, she
269

faced a dilemma: to enter the computer laboratory or to stay with her students in the regular classroom, as one of the teachers had asked her to. Here M-researcher interfered, and hence M-teacher entered the computer laboratory. In that lesson's diary it was written: "To my delight, M-researcher took over M-teacher, and I did not give up the computer laboratory." During the activity, students used the Excel in a variety of original strategies. In this entry I wrote: "I think that the various strategies emerged due to a combination of elements. The activity itself contained no instructions as to how to use Excel, yet students already knew what spreadsheets could offer, and the norm of using the computer for their own needs had been established." The learning that took place in that
lesson is reported in Tabach, Hershkowitz and Arcavi (in preparation).CONCLUDING REMARKSIn this report, I have tried to shed some light on issues relating to attempts at being a mathematics teacher and researcher at the same time. I used my own experience to demonstrate a possible way of moving between the two roles. Self-awareness of the role you have taken on at every moment is crucial, even while realizing that sometimes it will not help (see above examples). Note that even in a clash scenario, an awareness of both perspectives enhances and sharpens. The most problematic part of being a teacher and researcher simultaneously arose during the lessons: the teacher's first commitment is to students' needs. Hence, in the classroom, the teacher must act like a teacher, keeping the researcher's voice silent. In analysis, the main perspective should belong to the researcher. An awareness of the opportunities afforded by mixing roles may advance both---teaching and research. Activities such as planning learning sequences or analysing data can be temporally separated from the teaching itself. A teacher who is doing research may become more reflective as a teacher. A researcher who is teaching may change his/her interpretations as a result of the broadening in his/her perspective. More thought is required with respect to possible ways of overcoming the
dilemmas involved in being a researcher and teacher simultaneously.ReferencesAnderson, G. L. (2002). Reflecting on research for doctoral students in
education. Educational Research, 31(7), 22-25.
Ball, L. D. (2000). Working on the inside: using one's own practice as a site for studying teaching and learning. In A. E. Kelly & R. A. Lesh (Eds.), Handbook of Research Design in Mathematics and Science Education (pp. 365-402). Mahwah, NJ: Lawrence Erlbaum Associates, Publishers.
Breen, C. (2003). Mathematics teacher as researcher: living on the edge? In A. Bishop, K. Clements, C. Keitel & J. Kilpatrick (Eds.), The Second International Handbook of Mathematics Education. Dordrecht: Kluwer Academic Publishers.
270

Davis, B. (1997). Listening for differences: an evolving conception of mathematics teaching. Journal of Research in Mathematics Education, 28, 335-376.
Hershkowitz, R., Dreyfus, T., Ben-Zvi, D., Friedlander, A., Hadas, N., Resnick, T. & Tabach, M. (2002). Mathematics curriculum development for computerized environments: a designer-researcher-teacher-learner activity. In L. English (Ed.), Handbook of International Research in Mathematics Education (pp. 657-694). Mahwah, NJ: Lawrence Erlbaum Associates, Publishers.
Labaree, F. D. (2003). The peculiar problem of preparing educational researchers. Educational Researcher, 32(4), 13-22.
Lampert, M. (1990). When the problem is not the question and the solution is not the answer: mathematical knowing and teaching. American Educational Research Journal, 27(1), 29-63.
Magidson, S. (2005). Building bridges within mathematics education: teaching, research, and instructional design. Journal of Mathematical Behavior, 24(2), 135-169.
Matz, M. H. & Page, R. N. (2002). The uses of practitioner research and status issues in educational research: reply to Garry Anderson. Educational Research, 31(7), 26-27.
Novotna, J., Lebethe, A., Rosen, G. & Zack, V. (2003). Navigating between theory and practice. Teachers who navigate between their research and their practice. Plenary Panel. In N. A. Pateman, B. J. Doherty & J. Zilliox (Eds.), Proc. 27th Conf. of the Int. Group for the Psychology of Mathematics Education (Vol. 1, pp. 69-99). Honolulu, HI: Psychology of Mathematics Education.
Shulman, S. L. (1986). Those who understand: knowledge growth in teaching. Educational Researcher, 15(2), 4-14.
Tabach, M. & Friedlander, A. (submitted). Understanding equivalence of algebraic expressions in a spreadsheet-based environment.
271

Chapter 4: Answers to the Research Questions
The main research question of this study, as stated in Chapter 2, is:
In what ways does the computer intensive environment shape cognitive and
socio-cultural aspects of learning beginning algebra in 7th grade?
This general question includes the following sub-questions:
1. What kind of algebraic-knowledge did students construct?
1a. Was the algebraic knowledge that the students constructed similar to the
knowledge of other students from the same age group?
1b. Did students construct additional knowledge?
2. How did students construct their algebraic knowledge in this environment?
3. In what ways did students use the computer in their work?
4. How did different individual students benefit from the use of computers?
5. What socio-mathematical norms evolved in this CIE, and how are they related
to learning?
In this chapter, I summarize and discuss the answers to the research questions as they
appear in the different research papers (Chapter 3), pointing to interrelated
connections among some of the issues. Toward the end of the chapter, I refer back to
the main and general research question in light of the sub questions' findings.
4.1 What Kind of Algebraic Knowledge did Students Construct?
The question of what students learn or fail to learn in experimental settings is a major
concern of any research study of this kind. This concern has two different levels. First,
are students in the experimental setting at a disadvantage regarding the subject matter
their peers learn in non-experimental settings, as established by the educational
authorities? In other words, do students in the experimental setting perform at least
equally well in tests designed and administered according to the official syllabus?
Second, to what extent do students learn what the designers of the experimental
setting expected them to learn, beyond the official syllabus? In the case of this study,
did students learn to pose hypotheses and verify/reject them? Did students become
proficient at moving across representations, generalizing and creating symbolic
272
expressions in different types of problem situations? Did students use the potential
strength of the tool, and in what ways? Did they learn meta-level skills, and of what
kind?
Achievements. In Israel, the Ministry of Education designs and administers an
exam (Meitzav) in several subjects on a national scale at the beginning of grades 5
and 8. The grade 8 mathematics exam tests student knowledge of the mathematics
studied in 7th grade (mostly beginning algebra). The two experimental cohorts of
this study took the test, and the following results show their performance against the
national average. The first cohort mean result was 85, as compared with the national
mean of 77. The second cohort mean result was in the 100 percentile. These results
provide an unequivocal answer to the first part of the research question: insofar as
the national test is a measure of what the official educational establishment
determines what students ought to know, the two cohorts of experimental groups not
only are not at a disadvantage, they outperform the national average.
The achievements of the students in the experimental group were also compared
with the achievements of the rest of the 7th graders in the same school (first
comparison group, two other classes every year). These other classes studied
according to CompuMath, the program from which the materials for the
experimental classes was adapted in order to adjust from a once weekly lesson with
computers to its full availability at all times. The comparison was undertaken in
order to identify the educational value added to the full availability of the
computerized tool. In terms of achievements, all the classes in the school performed
equally well in both the Meitzav and in the internal paper and pencil tests
administered to them within this study (see paper 2 for details). A delayed post-test
in which students were asked to design a worksheet with algebra assignments for
their peers was also given. Not surprisingly, students in the experimental group
proposed more creative items than their peers in the other classes in the same school
(see paper 2 for details).
Use of algebraic expressions. All the students in the experimental group learned to
express the given phenomena symbolically. During the year, several levels of
symbolic generalizations were used by different students (as described in papers 4,
5, 6, and 8). Yet, toward the end of the course, less sophisticated expressions faded
in favor of explicit and mathematically efficient representations (see paper 8).
Regarding algebraic technique, the experimental students learned to avoid many
273

common syntactic errors by anchoring the transitions among equivalent expressions
in the meanings stemming from the situations that the expressions represented (see
papers 5 and 6).
Transitions among representations. Students learned to represent the same
phenomena in several representations (numerical, graphical, symbolic, and verbal),
and to practice these transitions throughout their work. Moreover, they developed
some meta-representational expertise by learning to choose when and why a certain
representation may be preferred over others (see papers 4-7).
Solving equations. Students learned about equations by comparing two changing
phenomena, or by comparing a changing phenomenon to a given number (see paper
5). Later during the course, students learned to represent a symbolic model of a
given word problem as an equation, to solve it and interpret the solution in terms of
the given problem (see paper 7).
Problems solving. Students learned that the process of working on a given
assignment may involve one or all of the following steps: making a conjecture,
choosing a solution strategy, representing the data in different representations,
organizing the data, following a strategy, and verifying its outcomes against the
original data, revisiting the original conjecture, evaluating strategies proposed by
peers, reflecting on the whole process, and if necessary, repeating the process (see
papers 4-7).
4.2 How did Students Construct their Algebraic Knowledge in this
Environment?
The features of the CIE that can account for supporting students’ construction of
knowledge can be categorized into artifacts and tools (the curriculum materials, the
kind of problem situations, and the various computerized tools) and the social setting
and its functioning. This includes working in pairs, the freedom to pursue a problem-
solving approach, the freedom to choose a representation to work on, and the freedom
to choose when and how to use the computerized tools, as well as discussions in the
classroom. In the following, I summarize how some of these features worked.
Most of the time algebra was learned through work on meaningful problem-
situations, which included realistic contexts that can be presented in various
representations. The situations served as both a source of meaning for the symbols
and as the anchor against which any symbolic action was checked and discussed.
274

Thus, for example, some syntactic errors were avoided because their contextual
meaning prevented their occurrence (e.g., students would not “add” 2x+5 to produce
7x, because the meanings of the variables and the constant in the context of the
situation do not warrant such an operation, see papers 3, 5, 6, and 7). The
contextual aspects of the situations also enabled students to apply their common
sense and their knowledge from out of school, thus making them more engaged and
motivated throughout the learning process.
Students were free to decide if, when, and how to use the computerized tools at their
disposal. The computerized tool enabled students to generate, observe, and reflect
upon many numerical instances of a phenomenon during many lessons. Such
experiences predisposed them toward symbolic expressions, equations and
generalizations, which need not be adopted abruptly (and often meaninglessly) as it
is mostly the case in traditional algebra classes (see 4.3 below).
The social nature of learning enabled students to exchange ideas at several levels:
with a peer while working together, with a teacher as a consultant, with the whole
class in the general discussions in which each other’s ideas were analyzed and
discussed. These exchanges facilitate learning because it enables them to ask
questions, to revise mistakes, and to get inspired by a peer's comment or approach.
These social exchanges were legitimized and encouraged as part of the socio-
mathematical norms of this CIE (see 4.5 below).
4.3 In What Ways did Students Use the Computer in Their Work?
In their assiduous work with computerized tools, students developed for themselves
an image of the possible uses of the tool. These images of the tool, called instruments,
may be different for different individuals and generally develop as students become
more experienced with the tool. In this study, we analyzed the instrumental genesis
processes in relation to the learning of algebra in this environment. The following
refers to spreadsheets as the main computerized tool available to students during their
learning.
Students manage to harness the tool in order to handle situations that they otherwise
could not have handled because of lack of knowledge on symbolic representations
(see paper 1).
275

Students were able to use and manipulate expressions through the generation,
observation, and handling of many numerical instances at once. Some students used
spreadsheets in order to remain entirely at the numerical level or to stay midway
between many numerical instances and partial symbolic generalizations; others
could progress more rapidly and even do without the tool altogether. These
disparities regarding the tool's uses did not create gaps in the class–quite the
contrary, it enabled the whole class to work and interact on the same activity with
different approaches, and to discuss results, conjectures, and solutions even when
different students were at different levels of symbolic sophistication (see papers 4,
5, 6, and 8).
The computerized environment was a kind of experimental laboratory in which
students could use the tools as they see fit in order to check conjectures (see papers
4 and 6), or raise new questions and look for answers (see paper 5). Some students
used the tool as a means to get non-judgmental feedback on their work, or as an
“entity” that has life of its own, generating surprises upon which one can consult
peers or the teacher (see papers 1, 5, and 6). The different processes of
instrumentation across the class, in the same activity created opportunities for lively
discussions that focused on the advantages and disadvantages of various working
strategies, and their compatibility with the task at hand (see paper 5).
Many students saw the tool as a means to move back and forth from symbols to
numbers, and to understood that with spreadsheets the key to obtaining numerical
data is to feed the tool with symbolic expressions and drag it. Thus, generalizing
symbolically became a motivating and purposeful goal (see papers 1, 4, 5, and 6).
Many students started to use spreadsheets by generating recursive relationships (the
content of a cell is a function of its predecessor). One concern in this respect is that
such actions may reinforce and fix the recursive approach impeding the
development of explicit formula. However, toward the end of the course, students
were able to approach the assignments using explicit expressions by using paper and
pencil, without the computer. Thus, recursivity, the main feature of spreadsheets,
which was so natural to many students, turned out to be mostly an intermediate step
that scaffolded students’ learning, and was ultimately abandoned (see paper 8). In
sum, and somehow paradoxically, the culmination of the instrumental genesis
processes was to do without the tool that was so important during the learning
process.
276

4.4 How did Different Individual Students Benefit from the Use of
Computers?
The CIE provided all students with the opportunity to use technology at all times, but
did not impose its use on them. Moreover, when students chose to use the
computerized tool, they could apply several strategies, at various levels of
sophistication. Therefore, students' choice to work with technology reflects personal
preferences, learning styles, as well as algebraic knowledge and several levels of
acquaintance with the possible uses of the tools (levels of instrumentation). In many
respects, the answers to the previous questions also provide a general answer to this
question: different students used the computer in many different ways; sometimes
even the same student used the computer in more than one way (see papers 5 and 8).
Thus, through computer use, and by enacting the freedom if/when/how to use
computers in the context of meaningful problem-solving situations, students could
make personal preferences and styles – a choice that is seldom offered to them in
traditional mathematics classes. As described (see papers 2 and 5), students decided
to use the computer in non-mathematically related activities, for example, as a
notebook (and only with word processing applications; some used the spreadsheet as a
note-taking tool), as a means to exchange files and questions via email and so on. So
different students also benefited from the computer by organizing themselves as they
see fit.
In sum, computerized tools enabled students to work in many different ways even
within the same classroom, and yet they were able to communicate meaningfully to
each other. “Weak” students could still share their approach with more advanced
students, and yet feel that their products can be of interest (and sometimes even
challenging) to all. Therefore, whereas the computer allows for individualization in a
certain sense, in another sense it promotes equity.
4.5 What Socio-Mathematical Norms Evolved in this CIE, and How
are They Related to Learning?
A new environment makes room for new ways of classroom work; therefore, new
classroom norms may emerge, some of which are socio-mathematical, that is, they are
specifically related to mathematics learning. In this study, the following socio-
277

mathematical norms were identified, and their emergence and enactment were
explored in relation to the learning of algebra with computerized tools.
There are several possible strategies to approach a mathematical problem. As
shown in the preceding sections, the development of this norm is in agreement with
the materials, with the philosophy of the CIE, and with the goals of the experiment
(see papers 1-8). The process of acceptance and enactment of this norm by all
students required negotiation, reassurances on the part of the teacher, and repeated
actions by other students (see paper 5). The main forum in which this norm was
implicitly and explicitly legitimized was the whole-class discussion, in which the
teacher spelled it out and students get used to sharing their approaches and feel it is
worth while to do so. The norm also emerged within the work of the student pairs
working with one computer. Each pair had to agree upon their working strategy
(Papers 5 and 6).
The use of computerized tools is optional. This norm emerged similarly to the
previous one. Throughout the year, students began to understand that the work with
the computer and with paper and pencil was equally valued (see paper 5); moreover,
students got used to talking explicitly about their preferences. It is precisely the full
enactment of this norm which makes strong and meaningful the finding related to
students' independent use of the spreadsheets toward the end of the year (otherwise
such independence could have been an artifact of an environment that subliminally
imposes the abandonment of the tool).
Students' personal mathematical voices were respected. Students got used to
expressing their own ideas, especially in the classroom discussion. Such a norm
was reinforced by the way teachers allocated time for different approaches, and how
they requested that all students get used to attentively follow an approach proposed
by a peer, even if it felt alien to them (see paper 5).
Presenting a claim must be followed by supporting explanations/evidence. This
norm is strongly interrelated to the previous one. Voices are respected mostly
because they have foundations and they express certain ways of looking at a
problem or an idea. Thus, students got used to making explicit the sources of their
thinking; these sources were not accepted or dismissed on the mere basis of
correctness or incorrectness, respectively, but rather were discussed. Focusing on
strengths and weaknesses. This norm also included getting used to respectfully and
meaningfully challenging others, and accepting those challenges when they are
278

directed at oneself. The development of a norm like this (and the previous one as
well) is strongly related to the learning results described in the sections above, to
which we can add that students learned to communicate about mathematics. Paper 5
documents excerpts of students' exchanges and reveals how this norm worked.
Students can make progress at their own pace. The presence of the technological
tool, the different instrumental genesis processes it allows, and the realistic problem
situations that served as a unified basis for the collective discussions were the
foundation upon which this norm developed (see papers 5, 6, 8).
Creativity in mathematics is possible and is welcomed. The environment and the
teacher encouraged creativity and divergent thinking, as shown in the results in
papers 4-8. Moreover, a dimension in which the experimental students performed
higher than the students in the first comparison group was creativity (see paper 2).
4.6 General Conclusion
Let us refer back to the overriding research question: In what ways does CIE shape
cognitive and socio-cultural aspects of learning beginning algebra in 7th grade?
A general and simplistic answer: this study shows that, despite that mathematical
CIEs at the level of junior high school are almost inexistent throughout the world,
they are feasible, sustainable, and effective in terms of the learning outcomes. A CIE,
such as the one previously described, not only can lead students toward high
achievements (as measured by traditional and widespread measurement tools), but it
also can support meaningful and long-lasting learning, and can educate autonomous
learners.
In the next section, we discuss in some detail this answer, its generalizability, and its
limitations..
279

Chapter 5: Discussion and Conclusions
This chapter is devoted to reflecting on and discussing the issues that emerged from
this study, and that go beyond the direct findings of the study (Chapter 4). Possible
directions for generalizing or, alternatively, delimiting its results (including
considerations related to scaling up this learning environment to a wider population),
and directions for further research are discussed.
5.1 Generalizing and Delimiting Results - What Can be Learned
from this Work?
The experiment described in this dissertation can be considered idiosyncratic in many
senses: the CIE was designed and implemented by a specific teacher with ad hoc
learning materials for one course (beginning algebra) within a special school in a
particular educational system, and within a certain cultural milieu. However, it was
carefully conducted twice during two year-long cycles and its robust results converge
and confirm each other. Thus, a main question to discuss is what can be generalized
from this work and what are its limitations?
First, it can be claimed that a major theoretical and practical contribution of this work
is that it provided a functional, viable, and solid existence proof - in other words, this
research shows how it is possible to create, implement, and monitor a successful and
inclusive environment for learning beginning algebra. However, the existence proof
proposed in this study goes beyond its intrinsic value of showing that something can
be done and it is worthwhile even when challenging. It offers theoretical and practical
contributions. For example, it shows that the difficult transition from arithmetic to
algebra can be eased not only for advanced students. Moreover, it offers detailed
guiding principles regarding how to do it. The CIE can be replicated more or less as
is (with necessary and carefully adaptations as needed), or its principles can be
abstracted in order to design on their basis a CIE with different features.
Second, some of the results may apply beyond the specifics of this study. The
following are four possible directions indicated by the results of this research, which
are in agreement with other existing studies.
280

5.1.1 Learning beginning algebra in a partially computerized environment vs. a
CIE
This study indicates that in terms of conventional achievements, students who work in
an environment with similar characteristics, but with only partial access to
computerized tools, outperform the national average, as did the students in the CIE.
However, the full availability of computerized tools, and the freedom it always
provides to students who resort to them, not only opens up for students many
possibilities of approaching problems, it also seems to encourage them to generate
new and interesting questions to pursue (as evidenced in the delayed post-test and in
the data documenting their work in the different assignments).
5.1.2 Learning beginning algebra in a non-computerized environment
The study described in here emphasizes some general issues with respect to algebra
learning.
Realistic problem situations legitimize the use of students’ existing rich
knowledge resources, provide students with new representations to think with, and
offer students powerful anchors against which to check the reasonableness of their
results.
Spreadsheets became a tool that enabled students to remain, for long periods
of time, in a middle ground between arithmetic and algebra, and yet be functional
within the class. This feature had an important role in the success of the
experiment. In the absence of such computerized tools, it may be useful to consider
the availability of other tools that would serve a similar function.
Presenting phenomena in more than one representation has been shown to be
an important scaffolding component of the learning process. Each representation
presents and emphasizes different aspects, and thus the conciseness and initial
opaqueness of the symbolic representation becomes less difficult for students (for
example, bringing printing graphs)
Inclusiveness implies that different students can work at different levels of
sophistication, and yet their approaches can be presented, discussed, and evaluated
in a respectful way, maximizing learning opportunities for all.
281

5.1.3 Learning beginning algebra in a different computerized environment
This study shows that the power of the computerized tool lies in its novelty and the
engagement it induces, in its versatility, in its dynamism, in the exploration
possibilities it affords, in the multiple representation it supports, and in the freedom of
use it allows in a new and complex subject domain such as algebra. Spreadsheets are
just a realization of these characteristics, which support the generation and learning of
symbolic representations and which other tools may also have (for example, tools that
generate schematic graphs, e.g., Yerushalmy & Schwartz (1993) or simulations and
animations, e.g., Kaput (1998)).
5.1.4 Learning other mathematical topics in a computerized environment
Within school mathematics, there might be areas other than beginning algebra where
epistemic or ontological shifts between students' existing knowledge and practices and
the new subject domain may cause difficulties. This study illustrates how the careful
identification and characterization of these shifts and gaps may guide the successful
creation, design, and implementation of tools (and environments that properly enable
students to work with them) to support students in accessing a new domain. This
study also shows how such a project can be researched in order to establish its
effectiveness, or in order to determine that difficulties may not disappear but just shift
from one area to another, as pointed out by Yerushalmy (2005).
In order to conclude this discussion, it is important to point out that working within a
CIE (like the one described here) is extremely demanding, and the key to its success is
the awareness (and the willingness) of those who embark on such a task to face the
following predicaments.
Technical problems. Hardware and software failures occur and thus ongoing and
readily available technical support must be readily available in order to avoid serious
disruptions in the class flow, which hinder achieving the intended effects, even when
teachers had prepared alternatives.
Students and computers. There is fine line between the powerful harnessing of the
computer and its misuse. During class time, students may be distracted by surfing the
web, chatting, or sending email messages to each other. It may be even worse, as it
282
happened during the course of this study: the class folder in which students kept
records of their work mysteriously disappeared more than once.
Teaching. Teaching in a CIE is very different from traditional teaching. It is also
very different from non-traditional teaching in non-computerized environments.
Thus, teachers need several levels of support. First, the institutional support is crucial
both technically and pedagogically. Second, implementing a CIE should be a school
effort that involves all the mathematics teachers (at least in the same grade level). This
requisite may make the effort a collaborative and synergistic endeavor in which all the
students can feel that they are equally treated (as opposed to having a selected
experimental group).
In this study, the teacher was also the researcher. Such a dual role may have caused
certain dilemmas to both roles (as described in this dissertation), but on the other
hand, beyond the school and peer teachers' support, there was the collective support
provided by the academic community within which this research was conducted.
5.2 Further research
The following are some possible directions for further theoretical and empirical
research opened up by this study.
Scaling up
The promise of CIEs and the increasing availability of personal computers for all,
suggests that a wide range implementation should be feasible. Is this indeed the case?
This question raises multiple and diverse issues. There is the educational policy
dimension and the extent to which educational authorities, the media, parents, and
professional mathematicians would be willing (a) to attend to research results such as
those reported in this study (and many others), and (b) to provide full support -
without which failure is certain, and the whole experience may be highly
counterproductive.
There is the infrastructure dimension – to what extent schools can provide availability
to computers at all times alongside full technical support?
In addition, there is the professional development terrain – to what extent are teachers
prepared to face a demanding task that implies a drastic shift in their pedagogical
practices, including developing the habit of reflecting on a class-to-class basis,
283

intensively consulting with peers, and adjusting to a whole new way of working with
their students?
The research and development community can make some progress with the first two
issues raised above by establishing communication channels with the policy-making
establishment and by encouraging schools to make space for CIE’s. However, a
major role in which the academic community can make a contribution is in teacher
education, both at the pre- and in-service level. Teacher education and professional
development courses should design and incorporate into their programs the explicit
treatment of learning mathematics with technology, including theoretical,
epistemological, pedagogical, and practical issues. Accordingly, a research agenda
must accompany the implementation of such programs.
Long-term effects
What would be the long-lasting influence, if any, on students emerging from a CIE
like the one in this study? Would there be any influence in their further studies of
algebra, both in terms of the contents itself and in terms of their ways of learning (for
example, would spreadsheets be part of their readily available repertoire of tools to
which they could spontaneously turn in order to support the learning of new topics?)
To what extent would students be able to re-adapt to traditional mathematics classes
that they most likely will encounter sooner or later in their further schooling?
Theory, methodology, and their interrelationship
In this research study, the combination of cognitive paradigms with socio-cultural
perspectives was considered essential for capturing the complex processes of learning
taking place in this CIE. However, theoretical and methodological issues not fully
resolved including the strong interdependence between “shared knowledge”, as can be
documented in classroom interactions and “individual knowledge” (Hershkowitz et
al., in press). These and other issues will continue to challenge the research
community for years to come, especially in the study of rich learning environments.
Final words
The theoretical and practical work of this dissertation, from which I learned so much
as a teacher, as a researcher, and as a plain citizen, aspires to insert itself in a new
educational vision. In such a vision computers are viewed as a powerful medium that
has started to convey a “new increment of intellectual power that rivals what
284

conventional literacy has given us”, and envisions that education will “be transformed
by the computer’s presence so that children learn much more, learn it earlier, and
more easily, and fundamentally, learn it with a pleasure and commitment that only a
privileged few now feel toward school learning.” (diSessa, 2000, p. ix).
285

Appendix 1: the post-test (assessment activity) and its
statistical analysis
The test presented here was administered to students participating in the experiment.
This included the first comparison groups at the beginning and the end of the school
year, of both cohorts. Some of the test items required students to generalize; however,
no symbolic generalization was needed. This means that there was no reason to expect
differences between the experimental and comparison students, since the subjects
addressed in the test were not explicitly part of the learning that took place during 7 th
grade.
Nevertheless, I discuss the following test items, and the ensuing statistical analysis.
which compares the mean grade of each item. The results will be discussed.
286

Assessment Activity (The Postest)
In the following, you will find questions on subjects with which you may or may not
be familiar. Please answer each question as best you can.
1. Pizza Shop:
The price of one pizza slice is 6.0 IS.
The price of each extra is 0.75 IS.
The following extras are available:
Yellow CheeseOlives
Green PepperRed Sweet Pepper
Hot PepperOnion
CornWhite Cheese
AnchovyGreen Onion
a. Ron ordered a Pizza slice with three extras. The Pizza sauce spilled over the
bill, and it was impossible to read the price.
Can you suggest a way to calculate Ron's bill?
b. Write your answer to the previous question differently (if you can).
c. Dan ordered a Pizza slice with extras for a price of 9.0 IS.
Give a possible order, and explain your answer.
2. a. Write a number in the empty square so that the answer will be
a number between 1 and 10:
b. Explain how you found your answer.
Name:
287

3. Add an operation in the circle, so that the expression will be correct.
20 < 0.3 10 : , , - , +
Circle all the appropriate operations.
4. Chains of operations:
a. Choose a number. Write it in the square, and follow the instructions that
are written on the arrows. What did you get in the rhombus?
b. Repeat the procedure with a different number.
c. What did you get? Explain.
d. Create your own chain of operations. Explain how you
constructed your chain.
6 3: 2 4:
6 3: 2 4:
288

5. a. Write a number in the square to get a correct expression:
2 < - 3
b. Are there any other numbers that you could write in the square and get a
correct expression?
If not, explain. If yes, give an example and explain the common
characteristics of the numbers.
6. Nir is about to subscribe to a magazine for one year. He saw the following
advertisements:
a. If Nir reads only five booklets a year, which magazine should he
choose?
b. Write a hypothesis: for what number of booklets a year would you
advise Nir to read the Teenager life, and for what number of
booklets for Teenager news?
c. Prove / refute your hypothesis using mathematical methods.
d. Nir knows he will read 24 booklets a year. Which magazine should he
choose?
Teenager newsSix booklets for free!
.$3.5for each booklet
Teenager lifeFour booklets for free!
$3 for each booklet
289

7. The followings are "train-sticks":
One-square train
Two-square train
Three-square train
Eight-square train
a. Fill in the Table:
Number of Squares in the
Train
Number of Sticks
1
27
104
819
b. How many sticks are needed to make a 15-square train?
____________ Explain your answer.
c. How many squares will be on a train made of 61 sticks? _______ Explain your answer.
290

d. Estimate, how many squares will be on a train made of 10,000 sticks. Explain your answer.
e. Nir saw a picture of stick-trains in a mathematics book for 7th
grade, and it was written: "Dan thinks that the expression that describes the number of sticks
needed to build a stick-train with a squares is: 1 + 3a.
Ran thinks that the expression that describes the number of sticks
needed to build a stick-train with a squares is: 4 + 3*(a – 1)".
Nir did not understand the text.
What do you think?
291

Table 4 presents the means of the experimental and comparison groups, followed by
observations that can be made.
Table 4: A comparison between the experimental and the comparison groups
for each test item (means and t-test values).
Item number Experimental group means (%)
First comparison group means (%)
Differences between the experimental and comparison means
t-test values
1a 89.78 89.56 0.221b 70.22 54.78 15.44 -1.76 *1c 97.78 98.26 -0.482a 71.11 84.78 -13.67 1.90 *2b 84.44 85.87 -1.433 90.22 89.13 1.094a 97.78 100 -2.22 1.00 **4b 97.78 100 -2.22 1.00 **4c 80 89.13 -9.13 1.35 *4d 88.88 90.76 -1.885a 97.78 98.91 -1.13 0.46 **5b 83.11 83.26 -0.156a 100 94.56 5.44 -2.29 **6b 95.56 83.48 12.08 -2.48 *6c 82.22 61.52 20.76d 97.78 90.87 6.91 -1.9 **7a 99.56 95.22 4.34 -3.18 **7b 90.22 91.52 -1.37c 91.56 78.48 13.08 -2.48 *7d 84.89 80.87 4.027e 76.44 68.70 7.74 1.35 *total 89.5 86.44 3.06* Statistically significant difference** Statistically significant difference because one of the groups' means is 100 (or almost 100).
The following observations can be made based on the data presented in Table 4:
The mean differences in general are small. A significant difference was found in only
6 out of the 21 items. In two items the comparison group performed better (items 2a
and 4c), whereas in four items the experimental group performed better (items 1b, 6b,
7c, and 7e). There is no typical characteristic for the items in either of the above
groups' items. Nevertheless, the following is an attempt to take a closer look at each
of the six items.
292

Items in favor of the comparison group
Item 2a: In the experimental group one can find a common wrong answer of
providing a number, which after multiplying it by 100 equals 1 or 10.
Item 4c: This question requires generalization of the structure of the given "chain".
This kind of generalization was not common to activities and tasks that were given to
students during 7th grade. Possibly the use of CIE emphasizes this kind of
generalizations, and hence experimental students gained less on this item. At any rate,
the difference is rather small.
Items in favor of the experimental group
Item 1b: Some of the comparison students did not provide an additional
representation to the one they produced in item 1a. Possibly the experimental students
were more used to working with several representations.
Item 6b: Some of the comparison students did not write any hypothesis. This may be
connected to the classroom norm of writing an hypothesis before starting to work in a
computerized environment.
Item 7c and 7e: By definition, finding the number of sticks when the number of
squares is given is a hard task. In Item 7e students had to relate to two given symbolic
expressions. It is possible that the experimental students were more flexible than the
comparison students in relating to various symbolic expressions, due to the experience
they had gained while working in CIE.
It is worth noting that there is a difference of 3 points, out of 100, in the totals (see
table 4)
This indicates that both groups had (more or less) a similar achievement level in that
kind of knowledge.
293

References
Ainley, J. (1996). Purposeful contexts for normal notation in spreadsheet
environment. Journal of Mathematics Behavior, 15, 405-422.
Arcavi, A. (1994). Symbol sense: informal sense-making in formal mathematics. For
the Learning of Mathematics, 14 (3), 24-35.
Artigue, M. (2002). Learning mathematics in a CAS environment: The genesis of a
reflection about instrumentation and the dialectics between technical and
conceptual work. International Journal of Computers for Mathematical
Learning, 7, 245-274.
Ball, L. D. (2000). Working on the inside: using one's own practice as a site for
studying teaching and learning. In A. E. Kelly, & R. A. Lesh (Eds.), Handbook
of Research Design in Mathematics and Science Education (pp. 365-402).
Mahwah, NJ: Lawrence Erlbaum.
Balacheff, N., & Kaput, J. (1996). Computer-based learning environment in
mathematics. In A.J. Bishop, K. Clements, C. Keitel, J. Kilpatrick, & C.
Laborde (Eds.), International handbook of mathematics education (pp. 469-
501). Dordrecht, The Netherlands: Kluwer.
Bednarz, N., Kieran, C., & Lee, L. (Eds.) (1996). Approaches to Algebra.
Perspectives for Research and Teaching. Dordrecht, The Netherlands: Kluwer.
Dettori, G., Garuti, R., & Lemut, E. (2001). From arithmetic to algebraic thinking by
using a spreadsheet. In R. Sutherland, T. Rojano, A. Bell, & R. Lins (Eds.),
Perspectives on School Algebra (pp. 191-208). Dordrecht, The Netherlands:
Kluwer.
diSessa, A. A. (2000). Changing minds. Computers, learning, and literacy.
Cambridge, MA: MIT Press.
Dugdale, S. (1994). K-12 teachers' use of a spreadsheet for mathematical modeling
and problem solving. Journal of Computers in Mathematics and Science
Teaching, 13 (1), 43-68.
Friedlander, A., & Tabach, M. (2001a). Promoting multiple representations in algebra.
In A. A. Cuoco, & F. R. Curcio (Eds.), The Roles of Representation in School
294

Mathematics, 2001 Yearbook (pp. 173-185). Reston, VA: The National Council
of Teachers of Mathematics.
Friedlander, A., & Tabach, M. (2001b). Developing a curriculum of beginning algebra
in a spreadsheet environment. In H. Chick, K. Stacey, J. Vincent, & J. Vincent
(Eds.), The Future of Teaching and Learning of Algebra, Proceedings of the
12th ICMI Study Conference (Vol. 2, pp. 252-257). The University of
Melbourne, Australia.
Gardner, J., Morrison, H., & Jarman, R. (1993). The impact of high access to
computers on learning. Journal of Computer Assisted Learning, 9, 2-16.
Goldenberg, P. (1999). Principles, art, and craft in curriculum design: the case of
Connected Geometry. International Journal of Computers for Mathematics
Learning, 4, 191-224.
Gravemeijer, K., & Doorman, M. (1999). Context problems in realistic mathematics
education: A calculus course as an example. Educational Studies in
Mathematics, 39, 111-129.
Haspekian, M. (2005). An ”instrumental approach” to study the integration of
computer tool into mathematics teaching: The case of spreadsheets.
International Journal of Computers for Mathematics Learning, 10 (2), 109-141.
Heid, M. K. (1995). Curriculum and Evaluation Standards for School Mathematics,
Addenda Series: Algebra in a Technological World. Reston, VA: The National
Council of Teachers of Mathematics.
Hershkowitz, R., Dreyfus, T., Ben-Zvi, D., Friedlander, A., Hadas, N., Resnick, T.,
Schwarz, B., & Tabach, M. (2002). Mathematics curriculum development for
computerized environments: A designer-researcher-teacher-learner activity. In
L.D. English (Ed.), Handbook of International Research in Mathematics
Education (pp. 656 – 694). Mahwah, NJ: Lawrence Erlbaum.
Hershkowitz, R., Hadas, N., Dreyfus, T., & Schwarz B.B. (In press). Processes of
abstraction, from the diversity of individuals’ constructing of knowledge to a
group’s “shared knowledge”. To appear in Mathematical Education
Research Journal.
295

Hershkowitz, R., & Kieran, C. (2001). Algorithmic and meaningful ways of joining
together representatives within the same mathematical activity: An experience
with graphing calculators. In M. van den Heuvel-Panhuizen (Ed.), Proceedings
of the 25th Conference of the International Group for the Psychology of
Mathematics Education (Vol. 1, pp. 96-107). Utrecht, The Netherland: PME.
Hershkowitz, R., Schwarz, B., & Dreyfus, T. (2001). Abstraction in context:
Epistemic action. Journal for Research in Mathematics Education, 32 (2), 195-
222.
Kaput, J. (1992). Technology and mathematics education. In D.A. Grouws (Ed.),
Handbook of Research on Mathematics Teaching and Learning (pp. 515-556).
Reston, VA: National Council of Teachers of Mathematics.
Kaput, J. (1998). Technology as a transformative force in education: What else is
needed to make it work? Paper presented at the New Tools – New Practices
conference, Melbourne, Australia. Retrieved July 30, 2007, from
http://www.simcalc.umassd.edu/library/
Kieran, C. (1992). The learning and teaching of school algebra. In D. A. Grouws
(Ed.), Handbook of Research on Mathematics Teaching and Learning (pp. 390-
419). Reston, VA: National Council of Teachers of Mathematics.
Kieran, C. (2004). The core of algebra: Reflections on its main activities. In K.
Stacey, H. Chick, & M. Kendal (Eds.), The Future of Teaching and Learning of
Algebra: 12th ICMI Study (pp. 21-34). Dordrecht, The Netherlands: Kluwer.
Knuth, E. J., Stephens, A. C., McNeil, N. M., & Alibali, M. W. (2006). Does
understanding the equal sign matter? Evidence from solving equations. Journal
for Research in Mathematics Education, 37 (4), 297-311.
Laborde, C. (2003). Technology used as a tool for mediating knowledge in the
teaching of mathematics: the case of Cabri-geometry. In W. C. Yang, S. C. Chu,
T. de Alwis, & M. G. Lee (Eds.), Proceedings of the 8th Asian Technology
Conference in Mathematics (Vol. 1, pp. 23-38). Chung Hua University, Hsinchu
Taiwan ROC.
Lagrange, J.B., Artigue, M., Laborde, C., & Trouche, L. (2003). Technology and
mathematics education: a multidimensional study of the evolution of research
and innovation. In A.J. Bishop, M.A. Clements, C. Keitel, J. Kilpatrick, &
296

F.K.S. Leung (Eds.), Second International Handbook of Mathematics Education
(pp. 239-271). Dordrecht, The Netherlands: Kluwer.
Lampert, M. (1990). When the problem is not the question and the solution is not the
answer: mathematical knowing and teaching. American Educational Research
Journal, 27 (1), 29-63.
Lewis, S. (2005). Laptops in the Middle School Mathematics Classroom. In W. J.
Masalski (Ed.), Technology-Supported Mathematics Learning Environments,
Sixty-seventh Yearbook (pp. 267-280). Reston, VA: The National Council of
Teachers of Mathematics.
Mariotti, A. (2002). Technological advances in mathematics learning. In L. D. English
(Ed.), Handbook of International Research in Mathematics Education (pp. 695-
723). Mahwah NJ: Lawrence Erlbaum.
Mason, J., Graham, A., Pimm, D., & Gowar, N. (1985). Routes to / Roots of Algebra.
Milton Keynes, U.K.: The Open University.
Pea, R.D. (1985). Beyond amplification: Using the computer to reorganize mental
functioning. Educational Psychologist, 20 (4), 167-182.
Radford, L. (2000). Signs and meanings in students` emergent algebraic thinking: A
semiotic analysis. Educational Studies in Mathematics, 42 (3), 237–
268.
van Reeuwijk, M. (1995). Students' knowledge of algebra. In L. Meira & D. Carraher
(Eds.), Proceedings of the 19th International Conference for the Psychology of
Mathematics Education (Vol. 1, pp. 135-150). Recife, Brazil: Universidade
Federal de Pernambuco.
Rockman et al. (1997). Report of a Laptop Program Pilot. Retrieved Mars 15, 2006,
from http://www.microsoft.com/education/downloads/aal/resrch_1.rtf
Rockman et al. (1998). Powerful Tools for Schooling: Second Year Study of the
Laptop Program. Retrieved Mars 15, 2006, from
http://www.microsoft.com/education/downloads/aal/research2.rtf
Rockman et al. (1999). A More Complex Picture: Laptop Use and Impact in the
Context of Changing Home and School Access. Retrieved Mars 15, 2006, from
http://download.microsoft.com/download/8/d/c/8dc3ebfe-6849-4534-a4b7-
846a8c327874/Research3Report.doc
297

Rojano, T. (2002). Mathematics learning in the junior secondary school: students'
access to significant mathematical ideas. In L.D. English (Ed.), Handbook of
International Research in Mathematics Education (pp. 143 – 164). Mahwah, NJ:
Lawrence Erlbaum.
Star, J. R. (2005). Re-conceptualizing procedural knowledge. Journal of Research in
Mathematics Education, 36 (5), 404-411.
Star, J. R. (2007). Foregrounding procedural knowledge. Journal for Research in
Mathematics Education, 38 (2), 132-135.
Shternberg, B. & Yerushalmy, M. (2003). Models of functions and models of
situations: On the design of modeling-based learning environments. In H. M.
Doerr, & R. Lesh (Eds.), Beyond Constructivism: A Model and Modeling
Perspective on Teaching, Learning, and Problem Solving in Mathematics
Education (pp. 479-498). Mahwah, NJ: Lawrence Album. Retrieved Aug 5,
2007, from http://construct.haifa.ac.il/~michalyr/chapter7.10FINAL.pdf
Sutherland, R., & Rojano, T. (1993). A spreadsheet approach to solving algebra
problems. Journal of Mathematical Behavior, 12, 353-383.
Tabach, M. (1999). Emphasizing multiple representations in algebraic activities. In O.
Zaslavsky (Ed.), Proceedings of the 23rd Conference of the International Group
for the Psychology of Mathematics Education (Vol. 1, p. 322). Haifa, Israel:
PME.
Tabach, M., & Hershkowitz, R. (2002). Construction of knowledge and its
consolidation. In A. D. Cockburn, & E. Nardi (Eds.), Proceedings of the 26th
Conference of the International Group for the Psychology of Mathematics
Education (Vol. 4, pp. 265-272). Norwich, UK: PME.
Tabach, M., Hershkowitz, R., Arcavi, A., & Dreyfus, T. (In press). Computerized
environments in mathematics classrooms: A research - design view. To appear
in L. D. English (Ed.), Handbook for International Research in Mathematics
Education, 2nd edition. Mahwah, NJ: Lawrence Erlbaum.
Tabach, M. Hershkowitz, R., & Schwarz, B. (2001). The struggle towards algebraic
generalization and its consolidation. In M. van den Heuvel-Panhuizen (Ed.),
Proceedings of the 25th Conference of the International Group for the
Psychology of Mathematics Education (Vol. 4, pp. 241-248). Utrecht, The
Netherlands: PME.
298

Treffers, A. (1987). Three dimensions. A model of goal and theory description in
mathematics education: The Wiskobas Project. Dordrecht, The Netherlands:
Reidel.
Vérillon, P., & Rabardel, P. (1995). Cognition and artifact: A contribution to the study
of thought in relation to instrumented activity. European Journal of Psychology
in Education, 9 (3), 1-33.
Wiest, L. (2001). The role of fantasy contexts in world problems. Mathematics
Education Research Journal, 13, 74-90.
Wilson, K., Ainley, J., & Bills, L. (2005). Naming a column on a spreadsheet: Is it
more algebraic? In D. Hewitt, & A. Noyes (Eds.), Proceedings of the Sixth
British Congress of Mathematics Education (pp. 184-191). Warwick, U.K.
Yerushalmy, M. (2005). Challenging known transitions: Learning and teaching
algebra with technology. For the Learning of Mathematics, 2 (3), 37-42.
Yerushalmy, M. & Chazan, D. (2002). Flux in school algebra: curricular change,
graphing technology, and research on students learning and teacher knowledge.
In L. D. English (Ed.), Handbook of international research in mathematics
education (pp. 725-755). Mahwah, NJ: Lawrence Erlbaum.
Yerushalmy, M. & Schwartz, J. (1993). Seizing the opportunity to make algebra
mathematically and pedagogically interesting. In T. A. Romberg, E. Fennema, &
T. P. Carpenter (Eds.), Integrating Research on Graphical Representation of
Functions (pp. 41-68). Hillsdale, NJ:Lawrence Erlbaum.
299

