the x factor 1 the x factor of charitable giving: are
TRANSCRIPT
The X Factor 1
The X Factor of Charitable Giving:
Are Nonprofit Organizations Engaging the Generation X Donor?
by
LesLee L. Burnett
Submitted in partial fulfillment of the requirements for the Degree of
Master of Arts
in
Organizational Psychology
at
John F. Kennedy University
July 2006
Approved:
_____________________________________ ______________ Advisor/Research Coordinator Date
_____________________________________ ______________ Second Reader Date

The X Factor 2
Table of Contents
Introduction………………………………………………………………………..………………3
Literature Review……………………………………………………………..…………………...5
Charitable Giving Motivation………………………………………………..………………….5
Fundraising Trends………………………………………………………………..…………….7
Generation X…………………………………………………………..………………………. 8
Method……………………………………………………………………….…………………. 12
Data Collection and Analysis…………………………………………………………………..13
Results……………………………………………………………………………..……………..15
Discussion………………………………………………………………………….…………….36
Recommendations……………………………………………………………………...………40
Summary……………………………………………………………………………………….41
Bibliography…………………………………………………………………………………..…42
Appendix A……………………………………………………………………………………...46
Appendix B………………………………………………………………………………………47
Appendix C……………………………………………………………………………………....48
Deleted: Page Break

The X Factor 3
The X Factor of Charitable Giving:
Are Nonprofit Organizations Engaging the Next Generation of Donors?
Statistics show there are more than 1.4 million registered, nonprofit organizations in the United
States today (National Center for Charitable Statistics, January 2008). As this number increases,
nonprofit organizations will no doubt face increased competition for charitable dollars.
Donations made by individuals represent the largest source of charitable contributions, even
when compared to foundation and corporate gifts. In 2006, approximately 75 percent of all
charitable contributions came from individual donors for a total of $222.89 billion (Giving USA
Foundation, 2007).
Knowing one’s donors as well as understanding what factors drive their charitable giving
behavior may enhance a nonprofit organization’s fundraising success. Charitable giving attitudes
and behaviors appear to vary among generations (Eastman, 1995). It is thought that each
generation’s philosophy and approach to philanthropy has been shaped by historic and cultural
events that occurred while growing up. Things like war, economic prosperity or hardship, and
technological advancements significantly impact one’s world view and attitude toward society.
Generation X, typically categorized as those born between 1965 and 1976, is a unique
group in that it grew up in a rapidly changing society characterized by soaring divorce rates,
recession, the AIDS epidemic, and technological advancements never experienced by previous
generations. They were the first generation raised on television, personal computers, and video
games. As young adults, they came out of college into an unstable economy and a deteriorating

The X Factor 4
job market. Then, in the late 1990s, they found unprecedented success and prosperity with the
technology boom only to see it crumble a few years later.
Early on, words like jaded, apathetic, and slacker were used to describe Generation X.
But as its members age, Generation X is shedding those stereotypes. Many of those in
Generation X started careers later than the previous generation. However, statistics show that, in
their thirties, more members of Generation X are homeowners and wealthier than their parents
and Baby Boomers (typically considered those born between 1946 and 1964) were at the same
age (Kleber & Associates, 2005).
As the members of Generation X grow older (the oldest will be 43 years old in 2008),
have children, establish careers, and develop personal wealth, they are likely to become more
involved in charitable giving for personal and economic reasons. As competition for charitable
dollars among nonprofit organizations increases, nonprofits will need to examine this donor base,
understand what motivates it to make charitable donations, and find creative ways to engage it in
the charities’ missions. Old fundraising techniques may no longer be effective.
The goal of this project is to examine current fundraising techniques utilized by nonprofit
organizations and determine if there are best practices or techniques to encourage charitable
giving among Generation X. To gather data, a sample of no less than 50 nonprofit organizations
with annual budgets of no less than $25,000 will be surveyed using a web-based survey. The
survey will attempt to determine if charitable organizations collect information about the age of
their donors and, if so, whether they adapt their fundraising efforts given the age of the donors.
Also, the survey will seek to identify any specific fundraising techniques that have proven
successful with Generation X.

The X Factor 5
Literature Review
It is not enough to simply look at Generation X and predict how social and historical
events might influence that generation’s charitable behavior. The goal is to create a more
complete picture of Generation X and charitable giving by examining internal and external
factors at play. As a way to do this, the following literature review focuses on three main topics:
charitable giving motivation, fundraising trends, and Generation X.
Charitable Giving Motivation
Why does someone give money to a charitable organization? There are many factors at
play, and not all are altruistic. One’s culture has a strong influence on charitable giving, but
donors also seek to meet psychological needs, whether they realize it or not. Clary and Snyder
(1995) created what they call a “functional approach” (p. 112) to understanding charitable giving
by focusing on donor motivation. They identified the following six functions of charitable
giving. The first function is personal values. Charitable giving is a way to express personal
values such as altruism, the importance of community involvement, and the responsibility to help
others in need. The second is social influence. One’s decision to make a charitable gift may be
influenced by a perceived social pressure. A friend or colleague may ask someone to donate to a
child’s school fundraiser, and the person perceives that not making a donation could adversely
affect his or her social standing. The third function is career advancement, in which a donor is
motivated by financial or career gain. For example, a donor may make a gift to charity to receive
an income-tax deduction. Or, one may feel obligated to make a gift to his or her office’s annual
United Way fundraising campaign because the boss has encouraged all employees to give. The
fourth is protection. Charitable giving may be done as an act of contrition or as a way to alleviate
feelings of guilt, such as when a donor’s motivation to give comes from the feeling that he or she
Deleted: ¶

The X Factor 6
“may have so much while others have so little” (p. 116). The fifth function is enhancement. An
Independent Sector survey found that one of the leading motivators to give to charity was the
gained “sense of personal satisfaction” (as cited in Giving and Volunteering 1992, p. 224). In
other words, people give to charity because it makes them feel good. The sixth and final function
is understanding, which states that charitable giving is motivated by a donor’s desire to learn
more about a particular cause or to “enhance the cultural and intellectual life of their
community” (Clary and Snyder, 1995, p. 117). For example, some donors may see charitable
giving as a way to promote personal and community growth.
In their study, Schervish and Havens (1998) set out to discover what motivates charitable
giving. As part of the study, the researchers developed some basic assumptions as to why people
donate to charity. Schervish and Havens called these assumptions the “Identification Model” (p.
1). The Identification Model is comprised of five motivational elements:
1. Communities of participation. This element says charitable giving is
motivated by social and community groups of which a donor is a member.
2. Frameworks of consciousness. Here one’s personal beliefs, such as religious
or political beliefs, influence one’s choice to donate to charity.
3. Direct requests. This element assumes that simply being asked to give to
charity is a motivating factor.
4. Discretionary resources. This element states that if someone has the monetary
means to donate to charity, they will do so.
5. Models and experiences from youth. This final element says that if someone
was exposed to charitable giving, either by their parents, school, or church, he
or she will be motivated to give as an adult.

The X Factor 7
Next, Schervish and Havens compared their Identification Model to data gathered in a
national survey on charitable giving and volunteering that included questions about donor
motivation and beliefs. Not surprisingly, they found that people tend to give more to charity
when all five elements are at play. Looking at the data more closely, the researchers determined
that three of the five elements had the greatest impact on charitable giving. They were, in order
of importance, (a) communities of participation, (b) direct requests, and (c) discretionary
resources. The elements, frameworks or consciousness, and experiences from youth, proved to
have no statistical significance.
Fundraising Trends
After evaluating 30 years of data on charitable giving in the United States, as presented in
the 2002 edition of the AAFRC Trust for Philanthropy’s Giving USA, Grizzard (2006) gleaned
three significant trends in fundraising: the continuous increase of gifts to charity, the
contradiction between the state of the economy and the success of fundraising, and the ever
increasing competition for charitable dollars.
First, charitable giving continues to increase regardless of the United States’ economic
climate. There was only one exception to this in 1987 when charitable giving decreased. That
decrease was attributed to two factors. The first was the stock market crash in October 1987.
Secondly, in 1986, after Congress passed a reduction in individual tax rates that took effect in
1987, many taxpayers transferred their 1987 charitable deductions to 1986 where it was more
advantageous.
The second trend Grizzard found was that successful fundraising efforts do not appear to
be related to economic conditions. He claimed success was based more on a nonprofit’s
fundraising strategy and execution (¶ 7). In others words, nonprofits whose fundraising efforts
The X Factor 8
remain diligent and well-planned tend to be consistently successful, regardless of the state of the
economy.
Finally, the third trend shows that competition for charitable dollars is increasing among
nonprofits. There are simply more charitable organizations in existence today seeking support.
Also, fundraisers are doing an increasingly better job in raising money for their organizations,
thus increasing the challenge of fundraising.
In Dreger’s (n.d.) article, Fundraising Trends for 2004 and Beyond, he outlined three
trends that are currently impacting the field of nonprofit fundraising and will continue to do so in
the future. The first trend is that charitable giving will continue to increase. Improvements in the
stock market and a stronger economy were initially the main drivers for this trend. The second
trend identified by Dreger is the continuing increase in competition among nonprofits for
charitable donations. This trend can be attributed to the growing number of charitable
organizations, the increasing need for services, and the “greater demand for accountability and
transparency” (¶ 12) in the nonprofit world. The final trend is the need for nonprofits to become
more technically savvy. Increasingly, donors want to be able to research nonprofits, receive
updates, and make donations online. It will be imperative for nonprofits to make electronic
communications and online giving part of their fundraising strategy.
Generation X
In 1991, Douglas Copeland coined the infamous generational name of those born
between 1965 and 1976: Generation X. In his novel, Generation X: Tales for an Accelerated
Culture, Copeland (1991) portrayed a generation of self-centered, unmotivated, jaded,
unconnected slackers with no sense of purpose or direction in life. Along with the name, these
stereotypes stuck with this generation whether they were accurate or not.

The X Factor 9
In her book, Boomers, Xers, and Other Strangers, Hicks (1999) identified the cultural
and historic events that have shaped and influenced the generations. Starting with the 1920s
through the 1990s, she looked at a variety of factors: everything from heroes of the day and
popular music to economic climate and international relations. Culture and historic events that
have shaped Generation X include a declining economy and job market both in the 1980s and
early 1990s, the advent of the personal computer, the technology boom of the late 1990s and
early 2000s, the AIDS epidemic, the increasing divorce rate, and the increasing rate of women
entering the workforce.
It has been 15 years since Douglas’ book was first published, and Generation X has
grown up. But many of the Generation X stereotypes remain. Kleber & Associates (2005)
identified some prevalent myths about Generation X and, using current statistics, attempted to
gauge the accuracy of those myths today.
Myth #1: Generation X is overeducated and underemployed. It is thought that Baby
Boomers’ disappointment with the job market in the 1990s was projected onto Generation X,
thus painting a bleak picture for Generation X as it entered the workforce for the first time.
Statistics show that Generation X, at a younger age, has made more money than their Baby
Boomer counterparts. Generation X’s average household income is also greater than Baby
Boomers’ average household income was at the same age.
Myth #2: Generation X lives with their parents longer. The downturn in the 1990s job
market may have influenced Myth #2. It was just assumed that Generation X would have trouble
finding employment or would be making less money and in turn they would not be able to afford
a home of their own. Statistics show that Generation X has been able to buy homes sooner than

The X Factor 10
Baby Boomers. Also, more single Generation X women have been able to buy houses than their
female Baby Boomer counterparts.
Myth #3: Generation X favors intangibles over possessions. Members of Generation X
have been spending money since they were teens and they have not stopped. According to a
Consumer Expenditure Survey, they have spent more money on “eating out, clothing,
transportation, entertainment, audio/visual equipment and housing” (¶ 22) than the average
consumer.
Myth #4: Generation X is cynical. This appears to be the only myth that could not be
disproved. Members of Generation X are not as idealistic as their parents and Baby Boomer
counterparts and are known for their sarcastic and ironic perception of the world around them.
Generation X, comprised of those born between 1965 and 1976, is proving to be a hard
donor group to reach. In a study conducted in 2003 by members of Indiana University’s Center
on Philanthropy, Richard Steinberg and Mark Wilhem found that when compared with two
previous generations, Generation X gave significantly less money to charity (Panepento, 2005).
Study results showed that a little more than 50% of households headed by a member of
Generation X reported making an annual donation of $25 or more (¶ 9), whereas 75% of Baby
Boomer headed households and 80 percent of pre-World War II headed households reported
making an annual gift of $25 or more (¶ 9).
But this does not mean Generation X is apathetic or disinterested in charitable giving.
Rather, its members approaching philanthropy differently than their parents and grandparents. It
is thought that the era in which Generation X grew up has had a significant effect on its
charitable behavior. Unlike the two previous generations, Generation X did not have “massive

The X Factor 11
social movements” (¶ 13), like World War II or the Civil Rights movement, around which to
rally. Thus, they did not develop a strong sense of community.
Generation X seems to be looking for ways to connect with their community, to build
“social networks” (¶ 13), and to put their skills to good use, not just give money outright. Some
nonprofits recognize this and are starting to tap into this generation’s need for a sense of
community. Instead of simply asking for money, nonprofits are asking for volunteer hours first.
They are targeting professionals less than 40 years of age and creating volunteer opportunities
where individuals can interact with their peers while performing a needed service for the
nonprofit. This way, they get to know a nonprofit personally and see the results of their volunteer
efforts firsthand.
It is this feeling of connectedness that seems to appeal most to Generation X. Some
nonprofits have begun to adapt their fundraising approach in response. Nonprofits are finding
that when they can connect Generation X to a cause, they not only get dedicated volunteers but
eventually much needed funding as well. One nonprofit that designed a program that matched
young professionals with senior-level executives to receive training on how to serve on a
nonprofit board of directors received about 300 new gifts from donors under the age of 40.
Statistics show members of Generation X are less likely to give money to charity than
previous generations (Semuels, 2004). One author, William Strauss, who has written books about
generational trends, claims that Generation X’s parents were not nurturing. Couple this lack of
nurturing with the absence of a major event, like a Vietnam War, to rally around and Generation
X has developed a sort of apathy towards helping others.
Even though statistics do show Generation X is giving less money to charity, some do not
believe they are not philanthropically inclined. Simply asking for money may not be the best

The X Factor 12
approach. Generation X is “more inclined to believe in something strongly and do something
about it” (¶ 12), says Larry Biddle, a thirty-year, non-profit fundraising professional. Biddle
suggests nonprofit organizations may be overlooking twenty and thirty year-olds thinking there
is no opportunity for monetary gifts. He believes many people in Generation X have money to
give and would do so if they truly felt the money would be used for a good cause.
Method
Research methodology is determined by the type of data to be gathered (Leedy, 1993). If
the data are verbal (i.e., descriptions of experiences, personal beliefs, or feelings) the
methodology is qualitative. Conversely, if the data are numeric (i.e., how many times a specific
event occurs over a period time) the methodology is quantitative. Though research design tends
to follow one or the other, the two methodologies are not mutually exclusive, and elements of
both will be used in this study. Data will be gathered using a combination of qualitative and
quantitative questions. For example, participants will be asked to describe fundraising practices,
but, they will also be asked questions such as geographic location, populations served, and
annual budget.
A survey will be used to collect data. This will allow a larger participant pool from which
to collect data. The survey will consist of open-ended questions that will require the participants
to provide answers in a comment box. There will also be multiple choice and fixed questions,
such as those requiring only a “yes” or “no” answer. However, comment boxes will also be
placed after these questions to capture any additional comments the participants may wish to
convey.

The X Factor 13
Leedy (1993) outlined certain elements that must be considered when creating an
effective survey. First, the questions must be extremely clear. Jargon with which participants
may not be familiar should be avoided. The construction of each question should make its
purpose clear, make it easy for the participant to answer, and elicit the desired answer the
researcher is seeking.
Second, the survey should be created to achieve a specific research objective. The design
of the survey is imperative. Each question should be objective, consistent, relevant, and
appropriate for gathering the desired data. The survey should be easy to read and complete and
be as brief as possible. It is also important to think about how it will be perceived by the
participants. It is helpful to consider how you would react if you were asked to complete the
survey. Does it look too long and overwhelming? Are the instructions easy to understand? Is the
goal of the survey clear?
Finally, how the participants are approached to take part can affect the success of the
survey. When inviting someone to take part, the researcher should focus on what the study’s
objective is and what the participant has to gain from it. Disclosing personal information about
the researcher is irrelevant to the study. Instead, the researcher should make the participant the
focal point of the solicitation. He or she should be specific about what the participant can gain
from taking part in the study.
Data Collection and Analysis
Approximately 150 nonprofit organizations will be indentified using specific criteria. The
organizations must (a) have a reported annual budget of $25,000 or more; (b) be registered with
the Internal Revenue Service as 501(c)(3) tax-exempt, nonprofit organizations; (c) provide
neither educational nor religious services; and (d) have an email address to which the online

The X Factor 14
survey can be sent. The organizations will be identified using the website GuideStar.org, a
searchable database of over a million IRS recognized nonprofit organizations in the United
States. The type of services the organizations provide will be determined using NTEE (National
Taxonomy of Exempt Entities) codes as developed by the National Center for Charitable
Statistics. GuideStar.org allows users to filter searches by NTEE code.
The survey will be hosted online at SurveyMonkey.com (www.SurveyMonkey.com). An
email invitation will be sent to the participants via the SurveyMonkey website. The email
invitation will include the purpose of the study, what participants can expect when taking the
survey, and a brief background of the researcher. The email invitation will also provide a link
that will give participants instant access to the online survey. Participants can then take the
survey immediately or return to it later. One week from when the email invitation was originally
sent, a reminder email will be sent to all participants who have not returned a completed survey.
Data will be gathered and stored by SurveyMonkey.com. The site provides only high-
level data analysis, so additional data analysis will be conducted. Survey data will be exported
from SurveyMonkey.com into an Excel spreadsheet for compilation and analysis. Data will be
divided into different demographics (i.e. annual budget or geographic location) to search for
differences and similarities. Patterns and relational connections among the data will be examined
as well.
A final component of this project will be to develop an educational piece for the survey
participants, post-data analysis. An executive summary will be created that will include
information on the motivational factors of charitable giving, the charitable giving behavior of
Generation X, and current fundraising strategies. The results of the survey will be presented

The X Factor 15
along with a discussion of the findings and how they may relate to the future charitable giving
behaviors of Generation X.
Results
The purpose of this research was to identify fundraising techniques utilized by nonprofit
organizations when targeting potential donors between the ages of 31 and 42, to examine the
charitable giving behavior of this particular donor group, and to identify any best practices that
encourage charitable giving from it. Data was collected using an online survey comprised of
multiple-choice and open-ended questions. Nonprofit organizations were selected using specific
criteria. The organization (a) had a reported annual budget of $25,000 or more; (b) provided
neither educational nor religious services; and (c) had an email address to which the online
survey could be sent. However, there was one exception. One respondent represented an
organization with an educational mission. One of the organizations that received the original
survey invitation forwarded it to an acquaintance, which in turn completed the survey.
In total, 176 nonprofit organizations were invited to participate in the online survey. The
return rate was 6%, with eleven organizations completing the survey. This low response rate
could be attributed to several factors, for example, an overabundance of email phishing scams
and spam email messages, the lack of recognition of the sender’s name, or simply not having the
time to complete the survey.
Follow-up telephone calls were made to four organizations that did not respond to the
online survey. The contacts at the organizations were simply asked why they chose not to
complete the survey. Representatives of two organizations responded similarly that they did not
recognize the name or email address of the sender of the survey invitation and simply deleted it.

The X Factor 16
Both were then asked if they thought the email invitation was spam. One reported being skeptical
of the email but did not necessarily consider it to be spam. He said, “My first thought was, ‘I
have no idea who this person is.’ I didn’t have the time to follow-up on the information you
provided about yourself and your study to find out if it was legitimate. So, I just deleted your
email.” The individual from the other organization said she never responds to emails from
unknown senders for fear of computer viruses. The third organization’s representative intended
to complete the survey but because of time limitations put it off until she thought it was too late
to respond. As for the fourth organization, I was never able to talk to a representative in person,
and messages were not returned.
The following section presents the findings from responding organizations.
1. How many years has your organization been in operation?
Answered question 11
Skipped question 0
Answer Options Response Percent Response Count Participant
Less than 1 year 0% 0 -
1-3 years 0% 0 -
4-6 years 9.1% 1 P8
7-9 years 0% 0 -
10-12 years 0% 0 -
13-15 years 18.2% 2 P3 and P10
Longer than 15 years
72.7% 8 P1, P2, P4, P5, P6, P7, P9, and P11
Total 100% 11
Participant Additional comments:
P6 We were founded in 1937
The X Factor 17
All participants answered Question #1. Of the 11 organizations surveyed, 10 had been in
existence for 13 years or longer, with 8 of those in existence for longer than 15 years. There was
one outlier. One organization reported being in existence for only 4-6 years. It is not known if
these percentages reflect those of the group of organizations invited to take the survey as years in
existence was not a criteria used for selecting them.
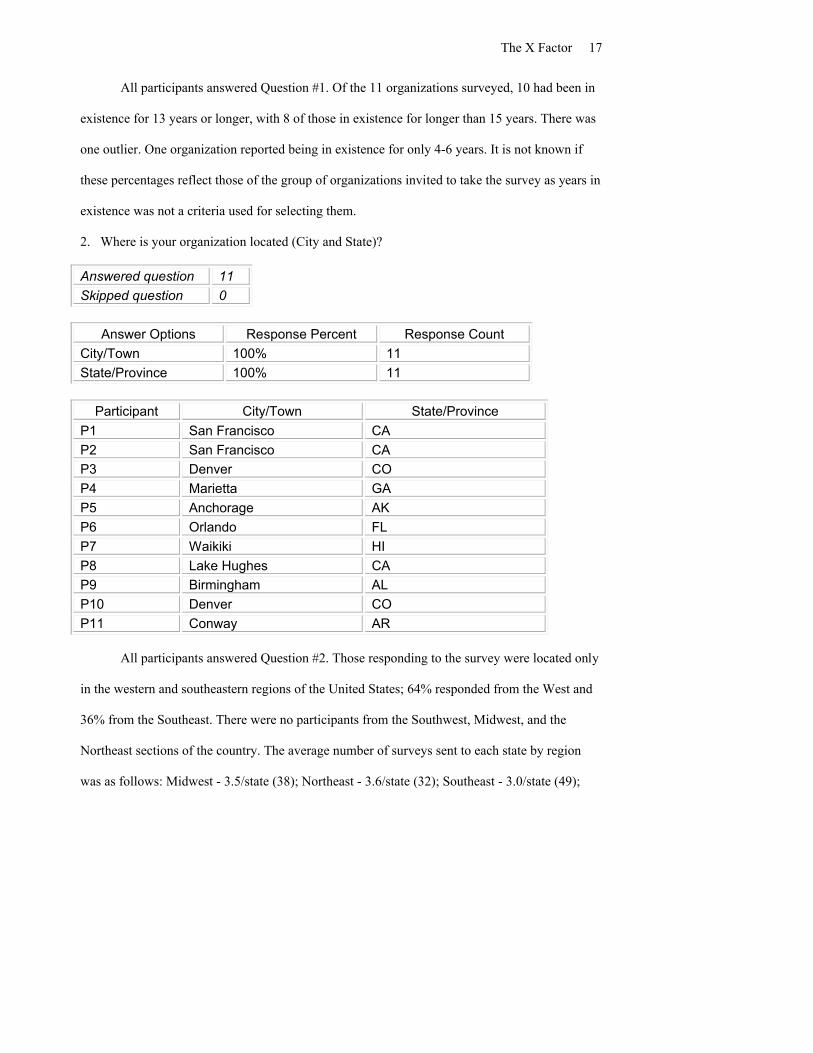
2. Where is your organization located (City and State)?
Answered question 11
Skipped question 0
Answer Options Response Percent Response Count
City/Town 100% 11
State/Province 100% 11
Participant City/Town State/Province
P1 San Francisco CA
P2 San Francisco CA
P3 Denver CO
P4 Marietta GA
P5 Anchorage AK
P6 Orlando FL
P7 Waikiki HI
P8 Lake Hughes CA
P9 Birmingham AL
P10 Denver CO
P11 Conway AR
All participants answered Question #2. Those responding to the survey were located only
in the western and southeastern regions of the United States; 64% responded from the West and
36% from the Southeast. There were no participants from the Southwest, Midwest, and the
Northeast sections of the country. The average number of surveys sent to each state by region
was as follows: Midwest - 3.5/state (38); Northeast - 3.6/state (32); Southeast - 3.0/state (49);

The X Factor 18
Southwest - 3.5/state (14); and West - 3.9/state (43). The higher average for the West can more
than likely be attributed to the fact that eight nonprofit organizations in California were sent
survey invitations, whereas all other states received approximately three survey invitations each.
This corresponds to receiving more completed surveys (3) from California than any other state. I
sent additional survey invitations to a handful of colleagues who were involved with fundraising
efforts for nonprofit organizations in the Western region of the United States.
3. Which of the below categories best represent the type of services your organization
provided?
Answered question 11
Skipped question 0
Answer Options Response Percent
Response Count
Participant
Arts, Culture & Humanities 18.2% 2 P4 and P5
Environment & Animals 9.1% 1 P6
Health 0 0 -
Human Services 54.5% 6 P1, P3, P7, P8, P9, P10 and P11
Social Justice 0 0
Other 18.2% 2 P2 and P10
Total 100% 11
Participant Other:
P2 Health and Human Services with an animal welfare based mission
P10 Education
All participants answered question #3. More than half (54.5%) reported providing
“Human Services” related services. Two organizations reported providing services relating to
“Arts, Culture, and Humanities.” One reported services related to “Environment and Animals.”
Another organization reported its services to be a combination of both “Health and Human

The X Factor 19
Services” and “Animal Welfare.” Finally, one organization reported that it provided services
related to “Education.” Educational organizations were excluded from the original group of
participants. The above percentages do not reflect those of the original group. Approximately
equal numbers of organizations were selected from each NTEE category: Arts, Culture, and
Humanities; Environment and Animals; Health; Human Services; and Social Justice.
4. What is the organization’s annual budget?
5. What percentage of the organization’s budget is derived from fundraising/donations?
Answered question 11
Skipped question 0
Annual Budget Percentage of Budget Derived from Fundraising
Participant Type of Organization
$5.00 38% P6 Environment & Animals
$500,000.00 100% P2 Health & Human services w/ animal welfare based mission
$600,000.00 36% P3 Human Services
$875,000.00 20% P7 Human Services
$900,000.00 1% P11 Human Services
$1,100,000.00 80% P10 Education
$1,500,000.00 90% P9 Human Services
$1,800,000.00 100% P8 Human Services
$2,000,000.00 25% P5 Arts, Culture & Humanities
$3,500,000.00 35% P4 Arts, Culture & Humanities
$5,000,000.00 15% P1 Human Services
Mean Annual Budget $1,615,909.55
Range $5.00 - $5,000,000.00
Mean Percentage of Budget from Fundraising
49%
Range 1% - 100%

The X Factor 20
Both Questions #4 and #5 were answered by all eleven participants. One participant, P6,
reported an annual budget of $5.00. This, more than likely, was a data entry error. No
organization reported an annual budget of less than $500K or more than $5M, with the exception
of the above mentioned outlier. More than half (55%) of the organizations reported an annual
budget of more than $1M. Forty-five percent reported their annual budget as $900K or less.
Percentages of the annual budget derived from fundraising ranged from 1% to 100%, a
wide range. Seven of the respondents claimed 38% or less of their organizations’ annual budgets
came from fundraising. The remaining four claimed 80% or more of their organizations’ annual
budgets was generated by fundraising efforts.
6. What percentage of the organization’s budget is dedicated to fundraising efforts (including
staff salaries)?
7. How many staff members are dedicated to fundraising?
Answered question 11
Skipped question 0
Percentage of Budget Dedicated
to Fundraising
Number of Staff Dedicated to Fundraising
Annual Budget Participant
7% 3 $5.00 P6
21% 1.25 $500,000.00 P2
5% 2 $600,000.00 P3
30% 2 $875,000.00 P7
1% 1 $900,000.00 P11
10% 0.5 $1,100,000.00 P10
11% 2 $1,500,000.00 P9
14% 5 $1,800,000.00 P8
15% 1 $2,000,000.00 P5
6% 2 $3,500,000.00 P4
4% 1.5 $5,000,000.00 P1

The X Factor 21
Mean Percentage of Budget Dedicated to Fundraising
11%
Range 1% - 30%
Mean Number of Staff Dedicated to Fundraising
1.93
Range 0.5 - 5
All eleven participants answered Questions #6 and #7. All reported having at least one
half-time staff member dedicated to fundraising; the most reported was five. Both organizations
with the least and most numbers of fundraising staff had annual budgets of over $1M but less
than $2M. The majority of participants (8) reported having 1-2 staff members dedicated to
fundraising. Organizations with an annual budget of less than $1M averaged 1.85 staff members
performing fundraising activities. Those with an annual budget over $1M average two
fundraising staff members. A larger annual budget did not correlate to more staff dedicated to
fundraising efforts.
8. Do you collect demographic information about your donors?
Answered question 11
Skipped question 0
Answer Options Response Percent Response Count Participants
Yes 90.9% 10 P1, P2, P3, P4, P5, P6, P7, P8, P9, P10
No 9.1% 1 P11Total 100% 11
Participant Additional comments:
P2 Very basic info though
Question #8 was answered by all participants. All but one organization, P11, reported
collecting some type of demographic information about their donors. Participant P11 also

The X Factor 22
reported the lowest percentage of budget (1%) generated from fundraising activities in Question
#6.
9. If yes, what types of data are collected? (check all that apply)
Answered question 10
Skipped question 1
Answer Options Response percent
Response Count
Location (City and State) 100% 10
Age 30% 3
Sex 50% 5
Annual household income 10% 1
Education level 20% 2
Other (please specify) 20% 2
Participant Location(City & State)
Age Sex Annualhousehold
income
Educationlevel
Other
P1 P2 P3 P4 P5 P6 P7 P8 P9 P10 P11
Participant Other (please specify)
P5 student with organization or have a child in the classes
P10 Because I run an alumni association, I have the benefit of knowing most of this information from their graduate year, degree, etc.

The X Factor 23
One participant did not answer Question #9. Of the ten participants who did answer this
question, all reported collecting some type of demographic information. The city and state in
which their donors resided was recorded by all participants. In addition to the location of their
donors, half recorded the sex of their donors and one third recorded the age of their donors. On
average, at least two kinds of demographic data were collected. However, participant P10 noted
having access to donors’ demographic data because the participant managed an alumni
association.
10. If you do not collect demographic information about your donors, why not?
Answered question 6
Skipped question 5
Participant Responses
P2 Not easily available. Donors don’t want to reveal such personal info when they give.
P3 We collect demographic information somewhat sporadically and when data is readily available. We need to develop this area.
P4 We have collected demographic information via surveys (both money survey and surveys in our lobby) but they have been answered by only a small percentage of our donors.
P5 we don’t do more than above because we don’t do anything with it due to lack of time and staff.
P6 Staff has too hard a time getting basics entered correctly
P11 In prior years did not raise funds. Received funding through the United Way in prior years.
Though all but one participant reported collecting some kind of demographic data, six
provided a reason why they do not. Reasons that prevented the collection of demographic data
ranged from donors’ unwillingness to provide it when asked to a lack of staff to collect it.
Participant P11 reported having not received money from fundraising in previous years, thus the
organization did not have individual donors from which to collect demographic data.
11. Is donor demographic data used in planning and developing fundraising campaigns?

The X Factor 24
Answered question 9
Skipped question 2
Answer Options Response Percent Response Count Participant
Yes 88.9% 8 P1, P2, P3, P4, P5, P6 P8, P10
No 11.1% 1 P7Total 100% 9
Participant Additional comments:
P2 We look at zip codes for direct mail and past history of giving
P3 Somewhat. We target our fundraising campaigns to certain professions, political affiliations, and to a lesser extent age and sex.
P11 All events and donors are local
Two participants did not answer this question. Only participant P7 did not use donor
demography when planning a fundraising campaign. However, in Question #9, P7 reported
collecting donors’ locations, sexes, and ages. Participant P2 used zip codes to target potential
recipients of direct mail campaigns. Participant P3 used additional demographic data (profession
and political affiliation) rather than those kinds specifically mentioned in Question #9.
12. When developing a fundraising campaign, is a donor’s age a factor?
Answered question 11
Skipped question 0
Answer Options Response Percent Response Count Participant
Yes 54.5% 6 P1, P3, P6, P9, P10, P11
No 45.5% 5 P2, P4, P5, P7, P8
Total 100% 11
Participant Additional comments:
P2 But I'm open to that in the future.

The X Factor 25
P8 Not at this time but as we move toward implementing a planned giving program, we will attempt to capture more demographics to target certain age brackets.
P10 I am new to this position, but plan to use much more electronic communication and social networking services to help advance our fundraising activities
All eleven participants answered Question #12. Half of the participants (P1, P3, P6, P9,
P10, and P11) reported considering a potential donor’s age when developing a fundraising
campaign; however, only P10 said his or her organization actually gathered the age of its donors
(Q #9). On the other hand, of those who said they do not factor a donor’s age into the
development of fundraising campaigns, two participants actually collect that exact demographic
data. Of the five participants who reported a donor’s age was not a factor in creating a
fundraising campaign, two, P2 and P8, said they wanted to or planned to rate it in the future.
13. Approximately what percentage of your donors is between the ages of 31 and 42?
Answered question 6
Skipped question 5
Participant Percentage of Donors Between the Ages of 31 & 42
P1 15-25%
P2 Don’t know
P5 60%
P6 41%
P7 1%
P10 20%
Mean 28%
Range 1% - 60%
Almost half of the eleven participants did not answer this question. Of those that did
answer, only one, P2, reported not knowing how many donors are between the ages of 31 and 42.

The X Factor 26
Participants P1, P5, and P6 recorded a percentage but reported they did not collect the age of
their donors in Question #9, so one could assume this is an approximation or a guess. The
percentage of donors reported between those ages varied between 1% and 60%, with an average
of 28%.
14. In terms of dollars donated, approximately what percentage comes from donors between the ages of 31 and 42?
Answered question 7
Skipped question 4
Participant Percentage of Dollars Donated from Donors Between the
Ages of 27 & 43
P1 10-15%
P2 Don’t know
P5 30%
P6 85%
P7 1%
P9 5%
P10 15%
Mean 25%
Range 1% - 85%
Question #14 was not answered by four participants, one of whom, P4, stated his or her
organization collects donors’ ages (see table in Q9). P7 and P10, the only two other participants
who reported collecting donors’ ages, responded 1% and 15%. One could assume that their
figures in the above table were the most accurate and the rest were again approximations or
guesses. Perhaps participants were unable to say that they did not know. The responses to this
question varied from 1% to 85%, with the average percentage being 25%. One participant, P2,
stated that he or she did not know the percentage. All but one of those participants that
approximated the percentage of donations that came from this age group reported it as only 30%

The X Factor 27
or less. The exception was P6, who reported it at 85%. P6 was the only participant who described
his or her organization’s sole mission as Environmental and Animals related. However in
Question #9, P6 claimed not to collect donors’ ages.
15. Do your fundraising efforts specifically target potential donors between the age of 31 and 42?
Answered question 11
Skipped question 0
Answer Options Response Percent Response Count Participant
Yes 45.5% 5 P1, P3, P6, P8, P10
No 54.5% 6 P2, P4, P5, P7, P9, P11
Total 100% 11
Participant Additional comments:
P1 We hold youth related events but do not target youth in direct mail
P3 Depending on the campaign
P6 We split the efforts into several demographics - don't want to forget the elders
P8 We have two regional advisory groups that are currently comprised of mostly young professionals.
All participants answered this question, and the responses were split fairly evenly (5 -
Yes and 6 - No). Participants P1, P6, and P8 claim to target donors between 31 and 42 years of
age but do not collect that specific data from their current donors. It is interesting to note that the
word youth usually refers to children and teenagers. It is not clear what age group it is referring
to here: the children of these donors or the donors themselves.
16. If you answered “Yes” to Question 15, what fundraising techniques have been most
successful to engage donors between the ages of 31 and 42? What techniques have proven
unsuccessful?

The X Factor 28
Answered question 5
Skipped question 6
Answer Options Response Count
Successful 5
Unsuccessful 2
Participant Successful Unsuccessful
P1 Youth Events are the most successful
Direct Mail/Street Fair sign-ups
P3 We are planning a young, hip event for fashion entrepreneurs in the Denver area for December
-
P6 Special events -
P8 special events -
P10 Electronic newsletters, online doantion programs, recurring donations, easy to forward fundraising emails, giving in leiu of things like wedding favors (worked at a previous employer) [sic]
Reduced price tickets to fundraising events targeting older donors - just did not respond, as the event really did not appeal to younger people
Only five participants answered Question #16. It is interesting to note that P4 and P7, two
of the three respondents who reported asking the age of donors, did not respond to these more
specific questions regarding how to target a specific age group. When asked to give examples of
successful and unsuccessful fundraising techniques, a larger number of successful ones were
provided: five successful techniques and two unsuccessful techniques. All but one successful
fundraising technique noted had to do with special events. Of those who provided fundraising
techniques that proved successful with donors between the ages of 31 and 42, only participant
P10 reported knowing the age of donors in Question #9. P10 also reported specific and detailed
activities.
17. If you do not target potential donors between the ages of 31 and 42, why not?

The X Factor 29
Answered question 7
Skipped question 4
Participant Responses
P2 Again, we don't segment based on age. Although we did do a volunteer recruitment campaign aimed at people in their 20's and 30's.
P3 This is an area we are developing. The young crowd is relatively new for us (35 and under)
P4 don't have a sophisticated enough development plan to target by age
P5 don't collect that kind of demographic information
P7 Our membership base is comprised of mostly senior adults
P9 Coming off capital campaign-have not had opportunity to map out development plan
P11 We have not developed the data base to obtain information about ages of donors
Question #17 was answered by seven participants. It now becomes clearer as to why P4
and P7 did not respond to questions targeting this specific age group. P4 thought his fundraising
development plan was not “sophisticated” enough to focus on a particular age group. P7 targets
senior adults, donors older than this age group. As for others that did not report that they
captured age data on their donors, Participant P2 did not aim fundraising efforts toward potential
donors between 31 and 42 years of age but did aim a volunteer recruitment campaign toward
them. P3 was just beginning to focus on this age group. P5 simply does not collect the age of
donors, whereas P11’s organization has no means of doing so. P9 has not yet begun development
of future fundraising campaigns.
18. Do future fundraising efforts include targeting this age group?
Answered question 10
Skipped question 1
Answer Options Response Percent Response Count Participant

The X Factor 30
Yes 60% 6 P1, P3, P6, P7, P10, P11
No 40% 4 P2, P4, P5, P8Total 100% 10
Participant If no, why not?
P5 don't specifically target based on age
P8 We are more concerned with building a major gifts program aimed at more senior-level prospects at this time.
All but one participant answered this question. Sixty percent said they will target
potential donors between the ages of 31 and 42 in the future; forty percent said no. Of those that
said “Yes,” only two, P7 and P10, currently collect the ages of their donors. Similarly, the four
participants who answered “Yes,” (P1, P3, P6, and P10) reported that they have fundraising
campaigns that currently target this age group.
19. In your experience, have you found donors between the ages of 31 and 42 give more, less, or
about the same as donors between the ages of 43 and 61?
Answered question 10
Skipped question 1
Answer Options Response Percent Response Count Participant
More 10% 1 P7
Less 90% 9 P1, P2, P3, P4, P5, P6, P8, P9, P10
About the same 0% 0
Total 100% 10
Participant Additional comments:
P2 Slightly less, because their funding priorities tend to be around their kids
P11 Unknown

The X Factor 31
All but one participant answered Question #19. Only one participant, P7, reported donors
between the ages of 31 and 42 give more than those between 43 and 61. In Question #17, P7
responded that donors tended to be older than the 31 to 42 age group. All other participants said
the younger age group gave less. No participants reported the two age groups gave in similar
amounts.
20. In your experience, which of the following have you found to be true in regards to your
donors between the ages of 31 and 42?
Answered question 10
Skipped question 1
Answer Options Response Percent
Response Count
Participant
They donate more money than volunteer time 0% 0 -
They donate more volunteer time than money 70% 7 P1, P3, P6, P7, P8, P9, P10
They donate money only 10% 1 P4
They donate volunteer time only 0% 0 -
They donate comparable amounts of both money and volunteer time
20% 2 P2, P5
Total 100% 10
Additional comments:
P2 This is based on trends in the field and observations I've made
P3 We use countless volunteers under the age of 35. We want to transition them into financial donors/investors.
P11 Unkown [sic]
One participant (P6) did not answer Question #20. Seventy percent of the participants
said those between the ages of 31 and 42 donated more volunteer time than money; no one
reported that they gave more money than volunteer time. Only one participant, P4, said this age
group gave money only. Two, P2 and P5, said they gave equal amounts of both. No participant

The X Factor 32
reported this age group gave volunteer time only and no money. As noted in the Additional
Comments, P2’s response came not from experience with donors, but rather from “trends in the
field and observations.”
21. In your experience, what fundraising techniques have been successful with your donors
between the ages of 31 and 42? (check all that apply)
Answered question 10
Skipped question 1
Answer Options Response Percent
Response Count
Direct mail solicitations 20% 2
Traditional fundraising events (Galas, balls, luncheons, etc.)
50% 5
Interactive fundraising events (Runs or walks) 60% 6
Other (please specify) 50% 5
Participant Direct Mail Solicitations
Traditional Fundraising
Events (Galas, balls,
luncheons, etc.)
Interactive Fundraising
Events(Runs or walks)
Other
P1 P2 P3 P4
P5 P6 P7 P8 P9 P10 P11
Participant Other (please specify)
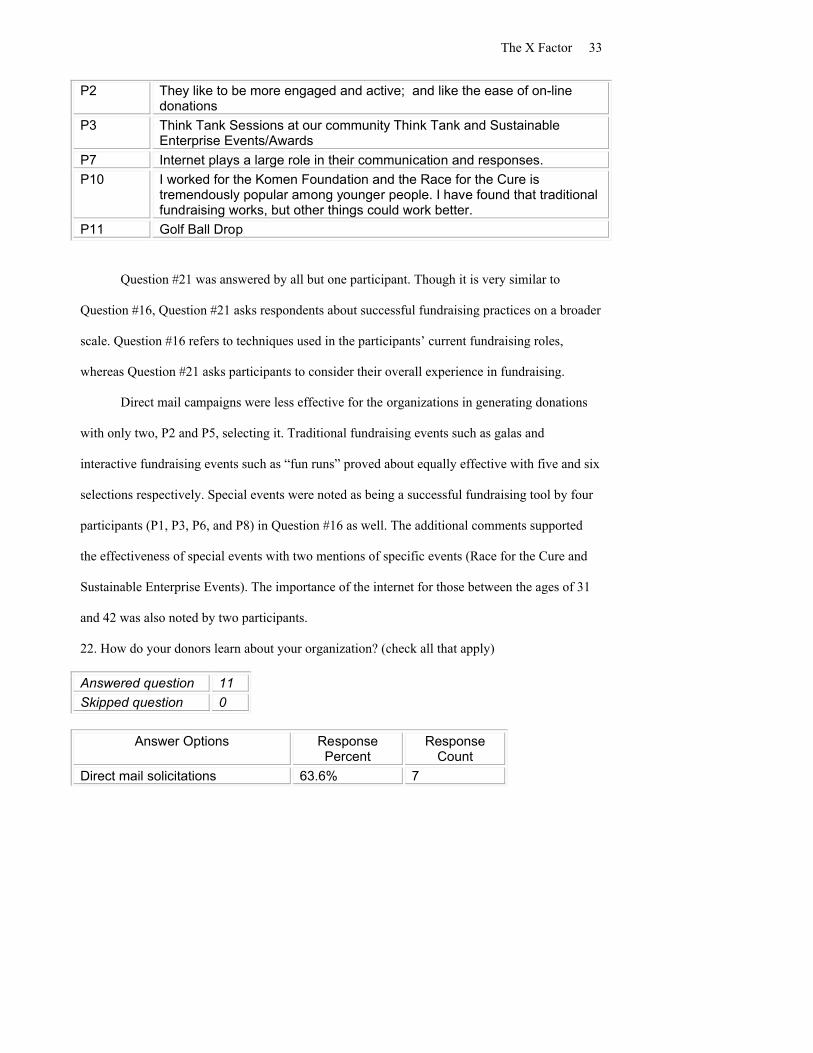
The X Factor 33
P2 They like to be more engaged and active; and like the ease of on-line donations
P3 Think Tank Sessions at our community Think Tank and Sustainable Enterprise Events/Awards
P7 Internet plays a large role in their communication and responses.
P10 I worked for the Komen Foundation and the Race for the Cure is tremendously popular among younger people. I have found that traditional fundraising works, but other things could work better.
P11 Golf Ball Drop
Question #21 was answered by all but one participant. Though it is very similar to
Question #16, Question #21 asks respondents about successful fundraising practices on a broader
scale. Question #16 refers to techniques used in the participants’ current fundraising roles,
whereas Question #21 asks participants to consider their overall experience in fundraising.
Direct mail campaigns were less effective for the organizations in generating donations
with only two, P2 and P5, selecting it. Traditional fundraising events such as galas and
interactive fundraising events such as “fun runs” proved about equally effective with five and six
selections respectively. Special events were noted as being a successful fundraising tool by four
participants (P1, P3, P6, and P8) in Question #16 as well. The additional comments supported
the effectiveness of special events with two mentions of specific events (Race for the Cure and
Sustainable Enterprise Events). The importance of the internet for those between the ages of 31
and 42 was also noted by two participants.
22. How do your donors learn about your organization? (check all that apply)
Answered question 11
Skipped question 0
Answer Options Response Percent
Response Count
Direct mail solicitations 63.6% 7
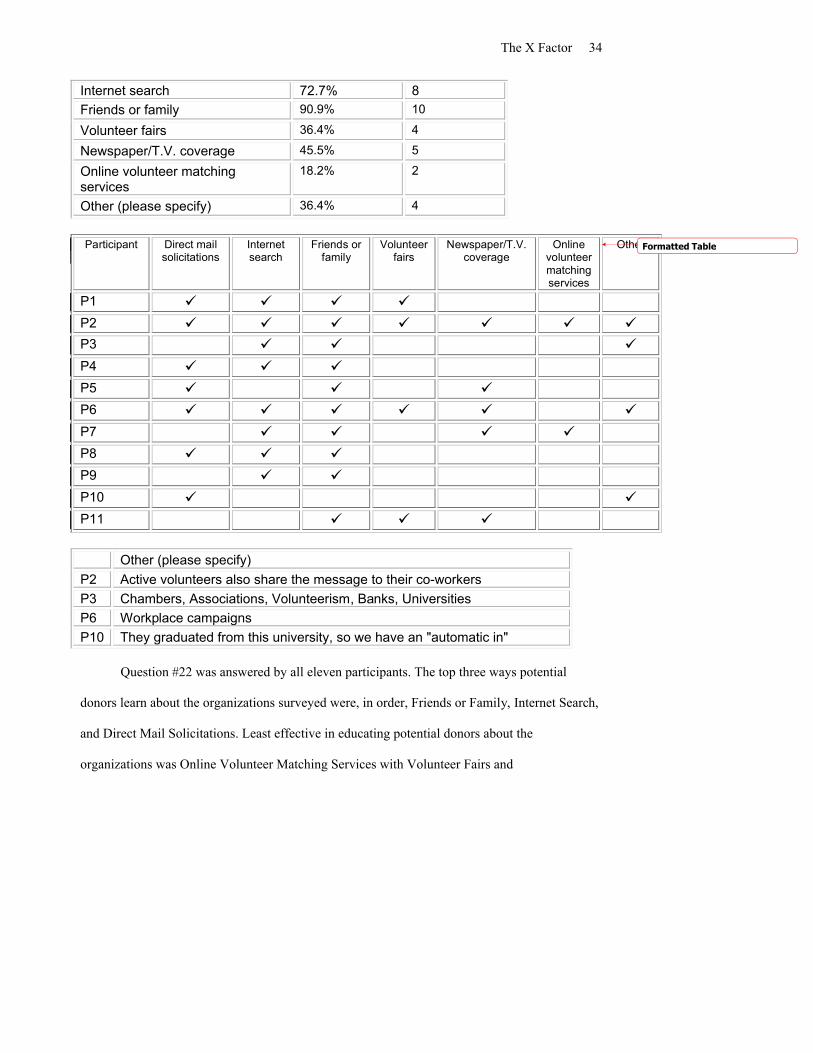
The X Factor 34
Internet search 72.7% 8
Friends or family 90.9% 10
Volunteer fairs 36.4% 4
Newspaper/T.V. coverage 45.5% 5
Online volunteer matching services
18.2% 2
Other (please specify) 36.4% 4
Participant Direct mail solicitations
Internet search
Friends or family
Volunteer fairs
Newspaper/T.V. coverage
Online volunteer matching services
Other
P1 P2 P3 P4 P5 P6 P7 P8 P9 P10 P11
Other (please specify)
P2 Active volunteers also share the message to their co-workers
P3 Chambers, Associations, Volunteerism, Banks, Universities
P6 Workplace campaigns
P10 They graduated from this university, so we have an "automatic in"
Question #22 was answered by all eleven participants. The top three ways potential
donors learn about the organizations surveyed were, in order, Friends or Family, Internet Search,
and Direct Mail Solicitations. Least effective in educating potential donors about the
organizations was Online Volunteer Matching Services with Volunteer Fairs and
Formatted Table

The X Factor 35
Newspaper/T.V. coverage next. Though effective in introducing potential donors to the
organizations, Direct Mail Solicitations were not effective in generating actual charitable dollars.
Two participants noted in additional comments that potential donors learn about their
organizations in the workplace, either through coworkers who are volunteers or giving
campaigns. One participant noted that potential donors become aware of his or her organization
through community organizations and businesses such as chambers, banks, and universities.
23. Does your organization accept online donations via its website?
Answered question 11
Skipped question 0
Answer Options Response Percent Response Count Participant
Yes 81.8% 9 P1, P2, P3, P6, P7, P8, P9, P10, P11
No 18.2% 2 P4, P5Total 100% 11
Additional comments:
P5 we are not set up at this time but will on the new web site
All eleven participants responded to this question. Nine organizations provide their
donors with online functionality to make donations through their website, whereas only two
organizations reported not being able accept donations via their website.
24. Thank you for completing the survey! If you would like to receive a summary of the survey
results, please provide your email address below.
Answered question 10
Skipped question 1

The X Factor 36
Number of Participants Who Provided an Email Address
10
All but one (P3) of the eleven participants provided an email address in order to receive a
summary of the survey results.
In summary, it appears that participants are not giving much thought to donors between
the ages of 31 and 42, let alone any other age group. Though most participants (91%) collect
some type of demographic information about their donors, only 30% reported knowing the age
of their donors. Similarly, 91% of the participants were able to name specific fundraising
techniques that were successful with donors between the ages of 31 and 42 even though only
64% of the participants claimed they knew what percentage of their donors were 31 to 42 years
of age. The contradicting responses of the participants seem to point to a lack of awareness of the
demographic differences of their donors.
Discussion
The overall purpose of this study was to determine if nonprofit organizations were
engaging Generation X donors, those donors between 31 and 42 years of age. More specifically,
the study sought to identify fundraising techniques utilized by nonprofit organizations when
targeting potential Generation X donors, examine the charitable giving behavior of this particular
donor group, and identify any best practices that encourage its charitable giving. Data were
collected using an online survey comprised of multiple-choice and open-ended questions.
Organizations invited to participate were selected using specific criteria. The organization (a)
had a reported annual budget of $25,000 or more; (b) was registered with the Internal Revenue
Service as a 501(c)(3) tax-exempt, nonprofit organization; (c) provided neither educational nor
religious services; and (d) had an email address to which the online survey could be sent. In total,

The X Factor 37
176 nonprofit organizations were invited to participate in the online survey. The return rate was
6%, with eleven organizations completing the survey.
Initially, I anticipated a 10%-15% rate of return which would have resulted in
approximately 17-26 completed surveys. However, my response rate turned out to be only 6%
with eleven surveys completed. I was surprised by this at first but soon suspected that spam,
email phishing scams, and the threat of computer viruses probably had a significant impact on
the response rate. According to SpamUnit.com, a website dedicated to the spam email
phenomenon, statistics show that every twenty-four hours approximately 100 billion spam email
messages are sent around the world (Spanky, 2007). My suspicion was later confirmed when I
spoke with two organizations that did not complete the survey. Though neither of the two
mentioned spam specifically, they were no doubt influenced by past experience with it. Because
they did not recognize the sender’s name or email address, they chose not to respond to the
survey invitation. It is also possible that the recipients reviewed the survey, felt the topic was
unimportant, and discarded it. This could be a sign that just as corporations are proving to be
slow in addressing the retirement of the Baby Boomer workforce, nonprofits do not yet see the
necessity for defining their donors by age.
After analyzing the survey results, two unexpected themes emerged: (a) the lack of
demographic data collected by the participants and (b) the apparent lack of awareness of the
charitable giving behaviors and needs specific to Generation X donors (actual and potential).
Ten of the eleven participants reported collecting some kind of demographic data. The
data most recorded were City and State. This seems obvious as organizations could probably
extrapolate this information without asking donors directly for it. Based on responses to direct
mail solicitations, mailing lists could be matched up with donations received, or, organizations
The X Factor 38
may know gifts come from local donors. The second most collected demographic data was the
sex of the donor with 50% of the participants reporting that they recorded it. This could easily be
determined based on the donor’s first name. However, what was most surprising was that only
30% of the participants actually knew the age of their donors while claiming age was a factor in
developing fundraising campaigns. Even if the organizations know the general ages of their
donors, such anecdotal information cannot be used to its fullest advantage when creating a
fundraising campaign.
From the results, it appears that the nonprofit organizations are aware of their Generation
X donors but are not factoring them into fundraising strategies. This is consistent with what is
currently happening in the fundraising world at large. Today, fundraising campaigns are aimed
more toward those who are either Generation Y (typically considered those born between 1977
and 1997) or Baby Boomers rather than Generation X (Barbargallo, 2005). Generation X is
simply being overlooked. Perhaps this is because of the prevailing assumption that they are an
apathetic lot or because there just are not as many of them in the United States as Generation Y
and Baby Boomers, at approximately 81 million and 78 million respectively, .
But why should nonprofit organizations be thinking about Generation X, its charitable
giving behavior, and how to get it invested in their missions? First, consider that between 1996
and 2006, the number of nonprofit organizations in the United States increased approximately
36% (National Center for Charitable Statistics, 2007). This means there is an increasing number
of nonprofit organizations seeking support from the public. With this increased competition for
charitable dollars, it will become more difficult for nonprofits to fundraise. They will need to
find ways to distinguish themselves from other organizations with similar missions.

The X Factor 39
Next consider that Baby Boomers and Generation X have different charitable giving
behaviors. Generation X has already proved it is behaving differently and needs to be engaged
differently than Baby Boomer donors. Statistics show more Baby Boomers give to charity than
do Generation X. In a study conducted in 2003 by members of Indiana University’s Center on
Philanthropy, Richard Steinberg and Mark Wilhem found that when Generation X was compared
to Baby Boomers, Generation X gave significantly less money to charity (Panepento, 2005).
Study results showed that a little more than 50% of households headed by a member of
Generation X reported making an annual donation of $25 or more; 75% of Baby Boomer headed
households reported making an annual gift of $25 or more (¶ 9).
However, this does not mean that Generation X is less charitably inclined. At this phase
in their lives, the members of Generation X are seeking more than just an opportunity to give
money. In volunteering, they find opportunities to connect with other people in their community
and to utilize and improve their skills, which are all strong needs for them (Panepento, 2005).
The participants in this survey echoed that with 70% of them reporting that their Generation X
donors gives more volunteer time than money. Generation X is also strapped for cash. They are
the first generation to graduate from college with substantial student loans; they are experiencing
a high cost of living coupled with a lower standard of living as compared to their parents at the
same age (O’Shaughnessy, 2008).
Finally, a significant shift in donor demographics could be close at hand due to the
following three factors. First, the oldest Baby Boomers will be eligible for Social Security
retirement benefits in 2008 when they turn 62 years old (U.S. Social Security Administration,
2007). Second, people tend to increase their charitable giving over time as they grow older, but
there is a point where that upward trend ends: at age sixty-five (Havens, O’Herlihy & Schervish,

The X Factor 40
2006). Finally, there are approximately 78 million Baby Boomers in the United States, but only
about 47 million people make up Generation X (Hicks, 1999). Combine these three factors and
there is a good chance that more nonprofit organizations will be competing for charitable dollars
from a smaller donor group who statistically give less to charity.
Recommendations
Nonprofit fundraising is not so different from for-profit marketing. Though the products
are very different, the need to sell a message or value in order to be successful is similar. Not
unlike a for-profit company’s efforts to outsell its competitors, nonprofit fundraisers must
convince people that their cause is the most important and that their organization is the best at
serving that cause. With each passing year, as the number of nonprofit organizations seeking
funding grows, the competition for charitable dollars increases. Combined with a shifting donor
demographic, traditional fundraising techniques may prove to be less successful with Generation
X. However, there is a simple, yet powerful, way for nonprofit organizations to create an
advantage with fundraising campaigns, and it is one of the most basic principals of marketing:
know your audience.
In the book Robin Hood Marketing (Andresen, 2006), principals of for-profit marketing
are applied to nonprofit fundraising. Knowing your audience is one of the marketing principals
Andresen stresses, and research is how that is accomplished. Andresen (p. 47) recommends
nonprofits research the following about the people at which they plan to aim fundraising
campaigns: (a) the demographic and geographical groups they belong to, (b) what they care
about most, and (c) what their values and wants are.

The X Factor 41
Given the potential shift in donor demographics and what is known about the charitable
giving behavior of Generation X, it would behoove nonprofits to start asking the above questions
of their donors. At the very minimum, nonprofits should be asking their donors how old they are.
With just that simple piece of information, they can identify and analyze how their donors prefer
to communicate (email vs. traditional mail), how they give (online vs. writing a check), what
they give (money vs. stocks, money vs. volunteer time) and, finally, why they give (motivations
and rewards). Using that information to design a strategic fundraising campaign targeted directly
to Generation X donors will help nonprofit organizations create and maintain a competitive
advantage on an increasingly crowded playing field.
Summary
One hundred and seventy-six nonprofit organizations were invited to participate in the
online survey to determine if they were engaging Generation X donors, those between 31 and 42
years of age, with specific fundraising techniques. Though the rate of return was lower than
expected at 6%, the results provided valuable insight into the nonprofit organizations’ approach
to Generation X. Though the organizations seemed to be aware of their Generation X donors,
they were not leveraging the unique charitable giving behaviors and needs of this group to their
advantage. Considering the combination of a donor demographic shift and increased competition
for charitable dollars, it is imperative that nonprofit organizations take Generation X more
seriously to continue their successful fundraising efforts.

The X Factor 42
Bibliography
Andresen, K. (2006). Robin hood marketing. San Francisco: Jossey-Bass.
Barbargallo, P. (2005). Generation x: The post-boomer babies now are young adults poised
to offer greener pastures for organizations seeking new donors. Fundraising Success.
Retrieved April 26, 2008, from
http://www.fundraisingsuccessmag.com/story/story.bsp?sid=32305&var=story
Clary, E.G. & Snyder, M. (1995). Motivations for volunteering and giving: A functional
approach. Cultures of Giving II(8), 111-123.
Copeland, D. (1991). Generation x: Tales for an accelerated culture. New York: St.
Martin’s Press.
Dreger, D.C. (n.d.). Fundraising trends for 2004 and beyond. Retrieved May 15, 2006, from
http://www.cdsfunds.com/fundraising_trends_for_2004_and_beyond.html
Eastman, C. L. (1995). Philanthropic cultures of generational archetypes. Cultures of
Giving II(8), 137-149.
Giving USA Foundation (2007). Giving usa 2007. Glenview: Giving USA Foundation.
Grizzard, C. (2006). Fundraising forecast: Who will succeed? Retrieved November 29,
2006, from http://www.onphilanthropy.com/site/News2?id=5611&page=NewsArticle
Grizzard, C. (2003). Three fundraising trends that really matter. Retrieved May 15, 2006,
from
http://www.onphilanthropy.com/site/News2?JServSessionIdr011=5d9tmq5ze3.app14a&p
age=NewsArticle&id=5313&security=1&news_iv_ctrl=1042
Hall, H. (2006). The vanishing donor. The Chronicle of Philanthropy. Retrieved November
29, 2006, from http://philanthropy.com/free/articles/v19/i04/04002101.htm

The X Factor 43
Havens, J.J., O’Herlihy, M.A., & Schervish, P.G. (2006). Charitable giving: How much, by
whom, to what, and how? In The Non-Profit Sector: A Research Handbook (chap. 23).
Retrieved April 20, 2008, from http://bc.edu/research/cwp/meta-
elements/pdf/charitablechapter.pdf
Hicks, K. (1999). Boomers, xers, and other strangers. Wheaton: Tyndale House
Publishers.
Hornblower, M. (1997). Great xpectations. Time. Retrieved May 15, 2006, from
http://www.time.com/time/magazine/article/0,9171,986481,00.html
Independent Sector (1992). Giving and volunteering the united states. Washington, DC:
Independent Sector.
Kleber & Associates (2005). Lingering myths about generation x. Retrieved March 25, 2006,
from http://www.housingzone.com/article/CA503868.html
Klein, K. (2004). The ten most important things you can know about fundraising [Electronic
version]. Grassroots Fundraising Journal, January/February, 11-14.
Leedy, P.D. (1993). Practical research: Planning and design.Upper Saddle River, NJ:
Prentice Hall.
Leonhardt, D. (2008, March 9). What makes people give? New York Times. Retrieved
March 10, 2008, from http://www.nytimes.com/2008/03/09/magazine/09Psychology-
t.html
Moore, C. (2003). Generation my: Not seeing your xer garden grow? Retrieved May 15,
2006, from http://www.onphilanthropy.com/site/News2?page=NewsArticle&id=6157
Nichols, J.E. (2005). The new face of donors. Fundraising Success. Retrieved June 1,
2008, from

The X Factor 44
http://www.fundraisingsuccessmag.com/story/story.bsp?sid=27318&var=story&publicati
on=FundRaising%20Success&publicationDate=7/19/05&slug=The+New+Face+of+Don
ors&category=None§ion=Unknown&swd=judith%20e.%20nichols
National Center for Charitable Statistics (2008). Registered nonprofits organizations by state.
Retrieved June 1, 2008, from http://nccsdataweb.urban.org/NCCS/Public/index.php
O’Shaughnessy, L. (2008, May 19). Debt-squeezed gen x saves little. USA Today. Retrieved
May 20, 2008, from
http://www.usatoday.com/money/perfi/retirement/2008-05-19-generation-x-
retirement_N.htm?loc=interstitialskip
Panepento, P. (2005). Connecting with generation x. The Chronicle of Philanthropy.
Retrieved March 25, 2006, from
http://philanthropy.com/free/articles/v17/i12/12003301.htm
Schervish, P.G. & Havens, J.J. (1998). Why do people give? The Not-For-Profit CEO Monthly
Newsletter, 5(7), 1-3.
Semuels, A. (2004, October 4). Generation x not in the giving mood – yet. Pittsburgh Post-
Gazette. Retrieved March 25, 2006, from
http://www.post-gazette.com/pg/04278/389735.stm
Spanky, T. (2007). Spam statistics. Retrieved June 1, 2008, from
http://www.spamunit.com/spam-statistics/
Texas Commission on the Arts (n.d.). Trend watch. Retrieved June 1, 2008, from
http://www.arts.state.tx.us/toolkit/leadershiptransitions/trendwatch.asp
U.S. Social Security Administration (2007). Nation’s first baby boomer files for social security

The X Factor 45
retirement benefits – online. Retrieved June 1, 2008, from
http://www.ssa.gov/pressoffice/pr/babyboomerfiles-pr.htm

The X Factor 46
Appendix A
Email Invitation to Participate in the Online Survey
Subject: What is Your Organization Doing to Engage the Next Generation of Donors?
Your feedback is requested as part of a study examining the giving behavior and needs of donors 31-42 years of age (often known as Generation X). I am conducting a short online survey to identify fundraising techniques currently utilized by nonprofit organizations to engage these donors. I am undertaking this study as part of a Master of Arts in Psychology program at John F. Kennedy University in Pleasant Hill, CA.www.jfku.edu
The survey is confidential and will only take about 10-15 minutes. Participants will have the opportunity to receive a summary of the survey results once the data has been collected and analyzed.
Do not miss this opportunity to learn what other organizations are doing to connect with Generation X donors. To participate, simply click on the link below.
[SurveyLink]
Thank you for your consideration.
Sincerely,
LesLee Burnett

The X Factor 47
Appendix B
Survey Purpose and Instructions
Thank you in advance for taking the time to complete this survey. Detailed information about the survey is provided below.
What is the purpose of this survey?The purpose of this survey is to examine the charitable giving behavior of people between the ages of 31 and 42. This group is often referred to as Generation X. In addition, the survey will attempt to identify current fundraising techniques utilized by nonprofit organizations to target this age group and determine if there are best practices or techniques to encourage their charitable giving. I am undertaking this project as part of a Masters of Arts in Psychology program at John F. Kennedy University in Pleasant Hill, CA.
How long will it take?The survey should take approximately 10 minutes to complete, depending on how much commentary you choose to include. After some questions, you will find a text box where additional comments can be made. You are strongly encouraged to provide specific examples and comments in support of your responses.
Is the information confidential?Yes. Survey data will be compiled and analyzed in aggregate and participants will not be identified. Additional comments provided by participants may be reported verbatim, but will not include who submitted them.
Will the survey results be shared?Yes. A survey results summary will be made available to all participants. At the end of the survey you will be asked to provide your email address in order to receive the summary via email.
Do not hesitate to contact me should you have any questions regarding the study or this survey at [email protected]. And again, thank you for your participation.
Sincerely,
LesLee Burnett

The X Factor 48
Appendix C
Survey Questions
1. How many years has your organization been in operation?o Less than 1 yearo 1-3 yearso 4-6 yearso 7-9 yearso 10-12 yearso 13-15 yearso Longer than 15 years
Additional comments: [Open text box]
2. Where is your organization located (City and State)?o City/Towno State/Province
3. Which of the below categories best represent the type of services your organization provided?
o Arts, Culture and Humanitieso Environmental and Animalso Healtho Human Serviceso Social Justiceo Other (please specify)
[Open text box]
4. What is the organization’s annual budget?
[Open text box]
5. What percentage of the organization’s budget is derived from fundraising/donations?
[Open text box]
6. What percentage of the organization’s budget is dedicated to fundraising efforts (including staff salaries)?
[Open text box]
7. How many staff members are dedicated to fundraising?
[Open text box]

The X Factor 49
8. Do you collect demographic information about your donors?o Yeso No
Additional comments: [Open text box]
9. If yes, what types of data are collected? (check all that apply)o Location (City and State)o Ageo Sexo Annual household incomeo Education levelo Other (please specify)
[Open text box]
10. If you do not collect demographic information about your donors, why not?
[Open text box]
11. Is donor demographic data used in planning and developing fundraising campaigns?o Yeso No
Additional comments: [Open text box]
12. When developing a fundraising campaign, is a donor’s age a factor?o Yeso No
Additional comments: [Open text box]
13. Approximately what percentage of your donors is between the ages of 31 and 42?
[Open test box]
14. In terms of dollars donated, approximately what percentage comes from donors betweenthe ages of 31 and 42?
[Open text box]
15. Do your fundraising efforts specifically target potential donors between the age of 31 and 42?
o Yeso No
Additional comments: [Open text box]

The X Factor 50
16. If you answered “Yes” to Question 15, what fundraising techniques have been most successful to engage donors between the ages of 31 and 42? What techniques have proven unsuccessful?
Successful [Open text box]
Unsuccessful [Open text box]
17. If you do not target potential donors between the ages of 31 and 42, why not?
[Open text box]
18. Do future fundraising efforts include targeting this age group?o Yeso No
If no, why not? [Open text box]
19. In your experience, have you found donors between the ages of 31 and 42 give more, less, or about the same as donors between the ages of 44 and 61?
o Moreo Lesso About the same
Additional comments: [Open text box]
20. In your experience, which of the follow have you found to true in regards to your donors between the ages of 31 and 42?
o They donate more money than volunteer timeo They donate more volunteer time than moneyo They donate money onlyo They donate volunteer time onlyo They donate comparable amounts of both money and volunteer time
Additional comments: [Open text box]
21. In your experience, what fundraising techniques have been successful with your donors between the ages of 31 and 42? (check all that apply)
o Direct mail solicitationso Traditional fundraising events (Galas, balls, luncheons, etc.)o Interactive fundraising events (Runs or walks)o Other (please specify)
[Open text box]
22. How do your donors learn about your organization? (check all that apply)o Direct mail solicitations

The X Factor 51
o Internet searcho Friends or familyo Volunteer fairso Newspaper/T.V. coverageo Online volunteer matching serviceso Other (please specify)
[Open text box]
23. Does your organization accept online donations via its website?o Yeso No
Additional comments: [Open text box]
24. Thank you for completing the survey! If you would like to receive a summary of the survey results, please provide your email address below.
[Open text box]