the wheat book : principles and practice
TRANSCRIPT

Research Library Research Library
Bulletins 4000 - Research Publications
2000
The Wheat book : principles and practice The Wheat book : principles and practice
W K. Anderson
J R. Garlinge
Follow this and additional works at: https://researchlibrary.agric.wa.gov.au/bulletins
Part of the Agricultural and Resource Economics Commons, Agricultural Science Commons,
Agriculture Commons, Agronomy and Crop Sciences Commons, Horticulture Commons, Plant Biology
Commons, Plant Breeding and Genetics Commons, and the Water Resource Management Commons
Recommended Citation Recommended Citation Anderson, W K, and Garlinge, J R. (2000), The Wheat book : principles and practice. Department of Primary
Industries and Regional Development, Western Australia, Perth. Bulletin 4443.
This bulletin is brought to you for free and open access by the Research Publications at Research Library. It has been accepted for inclusion in Bulletins 4000 - by an authorized administrator of Research Library. For more information, please contact [email protected].

The Wheat Book
WESTERN AUSTRAL
IA
TH
E
GOVERNMENTO
F
Bulletin 4443ISSN 1326-415XAgdex 112-01October 2000
The Wheat BookPrinciples and PracticePrinciples and Practice

Compiled by W.K. Anderson and J.R. Garlinge
Agriculture Western Australia
Funded by the Grains Research and Development Corporation
Agriculture Western AustraliaBulletin 4443
Replaces Bulletin 4196ISSN 1326-415X
Agdex 112/01
© Chief Executive Officer, Department of Agriculture, Western AustraliaOctober 2000
The Wheat BookPrinciples and Practice

ii
The second edition of The Wheat Book has beensomewhat changed from the original edition. Some of theauthors of the chapters of the first edition have moved onor were no longer available to revise their contributions.The editors and authors of the second edition acknowledgethe original contributors, especially Michael Perry andBrian Hillman who edited the first edition. Some of thechapters in the second edition are revisions of the originalchapters and in these cases the original authors areacknowledged at the start of each chapter.
There are some new chapters or sections on weedmanagement, grain quality, marketing, durum wheat, feedwheat and triticale and several chapters have beenconsiderably expanded. All chapters have been revised toinclude new information where applicable.
The reaction from readers of the first edition of TheWheat Book has indicated that major users have includedconsultants, company agronomists, undergraduatestudents, technical specialists in machinery companies,seed merchants and fertilizer companies, in addition towheat growers. As a consequence we have decided toslightly change the emphasis of the second edition from “Atechnical manual for wheat producers” to “Principles andpractice of wheat production” to accommodate this widergroup of users.
The Grains Research and Development Corporationhas funded the printing costs of the second edition. Mostof the authors are employed by Agriculture WesternAustralia and most have contributed their time and talentsas an extra-curricular activity.
W. K. Anderson and J. Garlinge (editors)
THE WHEAT BOOK
iii
ACKNOWLEDGEMENTS

iv

Chapter 1: Environment ..................................................................................1
Chapter 2: The Structure and Development of the Cereal Plant ..................23
Chapter 3: Germination, Vegetative and Reproductive Growth ....................37
Chapter 4: Crop Water Use ............................................................................55
Chapter 5: Nutrition ......................................................................................69
Chapter 6: Wheat in Farming Systems ........................................................109
Chapter 7: Crop Management ......................................................................131
Chapter 8: Wheat Quality and the Uses of Western Australian Wheat........165
Chapter 9: Tillage ........................................................................................175
Chapter 10: Diseases ....................................................................................201
Chapter 11: Insect Pests ................................................................................229
Chapter 12: Weed Control in Wheat ..........................................................245
Chapter 13: Markets and Marketing ............................................................259
Chapter 14: Special Wheats ..........................................................................271
Appendix 1: Climate data for locations in the wheatbelt ............................308
Appendix 2: Main soil groups occurring in the wheat growingareas of Western Australian ......................................................314
THE WHEAT BOOK
v
CONTENTS

vi

Chapter Coordinator: Ian FosterWheatbook 1 authors: J. Cramb, M.W. Perry, S. McKeague, M.J. MulcahyRevised by: J. Cramb, J. Courtney and P. Tille
Global circulations affecting weather in south-western Australia ....................3The easterlies ..........................................................................................................3The westerlies..........................................................................................................3Long range weather forecasting ..............................................................................4
Climate in relation to agriculture in south-western Australia ........................5Rainfall ....................................................................................................................5Solar radiation ........................................................................................................7Temperature ............................................................................................................7Synoptic events........................................................................................................7Climatic sub-division of the wheatbelt ..................................................................8Australian climates used for wheat production ......................................................8
Climate variability and seasonal forecasting ..................................................11Mechanisms that modify the seasons....................................................................11El Nino – Southern Oscillation ............................................................................12ENSO and South-west WA..................................................................................13Indian Ocean Dipole ............................................................................................13The Antarctic Circumpolar Wave ........................................................................13Wet and dry years ................................................................................................14Explaining the variations – some examples ..........................................................14What does it mean for seasonal forecasts? ............................................................14Climate trends in rainfall and temperature ..........................................................15
Calculating rainfall probabilities from deciles ..............................................16Deciles ..................................................................................................................16Using deciles to track seasonal conditions ............................................................16
Landforms and soils of south-western Australia ............................................18General soil characteristics ....................................................................................18History and geology..............................................................................................18Salt in the landscape..............................................................................................18Soils of the wheat growing areas ..........................................................................19Soils and cereal growing........................................................................................20
References ........................................................................................................21
THE WHEAT BOOK CHAPTER 1 – ENVIRONMENT
1
CHAPTER ONE
ENVIRONMENT

CHAPTER 1 – ENVIRONMENT THE WHEAT BOOK
2

THE WHEAT BOOK CHAPTER 1 – ENVIRONMENT
3
John CrambWestern Australian Regional Office,Bureau of Meteorology
The climate of Western Australia’s wheatbelt is stronglyinfluenced by the position of a band of high pressureknown as the sub-tropical ridge. An example is presentedin Figure 1.1.
This ridge, which circles the hemisphere, separates theeasterlies and the westerlies. The sub-tropical ridge movesnorth and south each year in response to the movement ofthe zone of maximum solar heating in the tropics. Onaverage, the axis of the sub-tropical ridge is farthest southin the summer, well to the south of Albany. In winter itreaches its northern-most average latitude, near Geraldton.
The fundamental energy source that drives allatmospheric circulations is the unequal heating of theearth’s surface by the sun. The earth’s wind patterns andweather systems re-distribute energy from the hotter to thecolder latitudes.
Warm, energy-laden air rises over the tropics, travelsaway from the equator in the upper atmosphere, then sinksback towards the surface forming the sub-tropical ridge.The sinking motion creates a warm, dry air mass, except ina relatively shallow layer close to the surface, where thecharacter of the air is determined more by the nature of thesurface over which it has been passing. The result is mostlyfine weather under the sub-tropical ridge, frequently withclear skies, though cloud or fog may result if the trajectoryof the air near the surface has allowed it to becomesufficiently moist.
The sub-tropical ridge is not a continuous band, butrather consists of a number of discrete high pressure cells –the highs we usually see on the weather map – separated byareas of lower pressure. These low pressure areas may allowthe ridge to be penetrated by air from the north or thesouth, to disturb the weather.
The easterliesIn a broad band extending north from the ridge, the air
flow near the surface is generally from the south-east. Theseare the trade winds, which extend back into the tropics tocomplete the cycle, rising again with renewed energy. Overland, these winds are more variable in direction and areoften referred to as simply ‘the easterlies’. This is the normalregime that prevails over the wheatbelt throughout thesummer and over the northern wheatbelt for much of thewinter as well.
The easterlies assume the characteristics of the surfaceover which they have been passing, usually becoming hotand dry in the summer and cool and dry in the winter, butwith variations well know to those who live in the area.Above the surface, the atmosphere is generally stable so fineweather is the norm but occasional disturbances occur.
Some of these disturbances originate deep in the tropics– such as decaying tropical cyclones moving south. More
common are the ‘upper air disturbances’, which originatefrom upper-level westerlies, and the ‘cut-off lows’, whichare lows that have either developed downwards fromupper-air disturbances or else moved out of the surfacewesterlies further to the south.
Even more common in the wheatbelt, however, arethose disturbances forming in the west coast trough, whichdevelops during the warmer months because of thecontrast in air density across the west coast, as the air isheated over the land and cooled over the sea. The westcoast trough is associated with most of the weather changesthroughout the warmer part of the year.
The westerliesTo the south of the sub-tropical ridge, the air flow
varies mostly between north-west and south-west. Becauseof their maritime origin, the westerlies are usually cool andmoist as they reach our coast, though they become drier asthey progress inland.
Atmospheric disturbances are much more common inthe westerlies, with cold fronts passing through perhapstwice a week or more in winter. The density contrasts inthe westerlies form a ready energy source for thedevelopment of depressions, and of the cold fronts whichmark the boundaries of new bursts of cold air.
The main process by which the atmosphere achievesthe necessary energy transfer from north to south across thewesterly zone is different to that used in the tropics.Because of the rotation of the earth, the large-scaleconvection cells that operate between the deep tropics andthe sub-tropical ridge are unable to extend all the way tothe poles. Instead, the westerly flow above the surfacemeanders, forming giant waves which are called planetarywaves or simply long waves. Energy-laden air, warm andfrequently moist, is transported pole-ward ahead of thelong wave troughs, while cold air moves north to the westof the troughs.
The waves can often be detected in the pressurepatterns on the surface weather map for the hemisphere,
GLOBAL CIRCULATIONS AFFECTING WEATHER IN SOUTH-WESTERN AUSTRALIA
Figure 1.1
A typical summer weather map showing the sub-tropical ridge tothe south of Western Australia.

particularly if pressures are averaged over a few days.However, the waves are really to be found in the strongerwesterly flow at higher levels in the atmosphere, where theyare usually easy to distinguish on charts of wind flow orpressure pattern.
There are normally about three or four long wavesaround the southern hemisphere. There is no stableconfiguration, so the pattern keeps changing. They usuallymove from west to east, but occasionally move the otherway, particularly if the spacing between the troughsbecomes large. They almost always move more slowly thanthe individual cold fronts and can sometimes persist in anarea for weeks. Because they have a strong steeringinfluence on the fronts, they often give a useful indicationof the likely weather some days ahead.
Thus, if there is a long wave trough near the west coastof Western Australia in winter, it is likely that cold frontswill continually move up towards the area, causingpersistent rainfall events over the wheatbelt. When there isa long wave ridge in our longitudes, individual fronts, ifthey arrive at all, are likely to be relatively weak.
Figure 1.2 illustrates a four-wave pattern in the upperlevel flow around the southern hemisphere, with one of thelong wave troughs just to the west of Western Australia anda long wave ridge over eastern Australia. The possiblesurface positions of cold fronts are marked.
Even though the westerlies spawn most of the rain-generating disturbances affecting the wheatbelt, thosesystems that produce the greatest rainfalls usually derivetheir moisture from the tropics. Warm air can hold muchmore water vapour than cold air. This is basically why itrains at all – air that is forced to rise can be cooled until itsmoisture condenses and falls out.
A good rain producing system will have a combinationof the following conditions in as great a measure aspossible:
The air will be moist through a great depth of theatmosphere;The lifting process will be strong, andThe lifting process will be sustained.The first condition is found particularly in northerly
and north-westerly air-streams above the surface, withmuch water vapour of tropical origin being brought south,ahead of a disturbance such as a cold front approachingfrom the west. This southward movement of tropical airmay be rapid.
Strong lifting is found particularly near the deep lowsand strong fronts that form the westerlies. The thirdingredient – prolonged lifting – is usually found in largeand/or slow-moving systems. Fronts whose progress hasbeen arrested or cut-off lows north of the ridge axis areespecially favourable, even though they may not be verystrong.
Long range weather forecastingThe motions of the atmosphere are particularly
complex, and make the task of long range forecastingparticularly difficult. Computer models, working withenormous amounts of meteorological data such astemperatures, humidities and pressures from around theglobe can solve the equations describing the motions of theatmosphere. These models are continuing to improve ourability to forecast the weather up to a few days ahead.
Longer range forecasting, months or seasons ahead andextending out to the scale of decades is receiving intensescientific effort. It is crucial that longer-term climate trendsbe investigated, particularly those that may result fromhuman activities. We are currently unable to give clearanswers to the important questions concerning the likelynature of long-term climate changes in specific areas suchas the wheatbelt. Unfortunately, such are the complexitiesof the problems involved, it could well be many years yetbefore this can be done with confidence.
GLOBAL CIRCULATIONS AFFECTING WEATHER IN SOUTH-WESTERN AUSTRALIA (continued)
CHAPTER 1 – ENVIRONMENT THE WHEAT BOOK
4
Figure 1.2
A representation of upper level wind flow around the southernhemisphere. A long wave trough is positioned just to the west ofWestern Australia.

John CrambWestern Australian Regional Office, Bureau of Meteorology
Located in the middle latitudes (30 to 40°S) theagricultural areas of south-western Australia have a dry-summer sub-tropical (Mediterranean) climate similar to theMediterranean basin, southern California, Chile and thewestern tip of Cape Province, South Africa (see Figure 1.3).
Weather patterns in these regions are dominated by theinfluence of the dry, subsiding air masses of the sub-tropical ridge. In summer, as the ridge moves poleward, theclimate has the characteristics and consistency of the drytropics; while in winter it features the changeability ofweather from the passage of the cyclonic circulations andcold fronts embedded in the westerlies.
The three characteristics of all Mediterranean climates(and expressed particularly strongly in south-westernAustralia) are:
A concentration of the rainfall in the winter season,with the summers being nearly, or completely dry;Warm to hot summers and mild winter; and High solar radiation, especially in summer.The most important climatic elements influencing
wheat production are rainfall, solar radiation andtemperature. These, both directly and indirectly (forexample, through waterlogging), determine crop growthand grain yield.
RainfallAnnual rainfall decreases rapidly from about 1200mm
on the south and south-western coasts to about 250mm atthe inland limit of agriculture. The distribution is shown inFigure 1.4.
Most wheat is produced in areas with less than 500mmannual rainfall and over 40% of production is from areasreceiving 325mm or less.
Rainfall distribution peaks sharply in mid-winter,especially in the west and north-west wheatbelt. Geraldtonand Wongan Hills receive over 80% of their annual rainfallin the winter growing season. Usually, 60 to 70% of annualrainfall is received between May and October, the
THE WHEAT BOOK CHAPTER 1 – ENVIRONMENT
5
CLIMATE IN RELATION TO AGRICULTURE IN SOUTH-WESTERN AUSTRALIA
Figure 1.3
Mediterranean climates of the world.
Figure 1.4
Distribution of annual rainfall in south-western Australia.
proportion of growing season rainfall decreasing to theeast. The growing season rainfall for certain wheatbeltcentres is listed in Table 1.1.
Table 1.1 – Annual growing season (May to October)rainfall for some major centres in the wheatbelt ofwestern Australia.
Locality Annual May to Oct May to Oct(mm) (mm) (%)
Geraldton 370 395 84Mullewa 337 253 75Mingenew 414 338 82Wongan Hills 387 297 77Bencubbin 319 211 66York 454 366 81Merredin 326 231 71Hyden 334 225 67Katanning 482 362 75Salmon Gums 342 209 61Albany 937 709 76Esperance Downs 490 334 68
The concentrated winter rainfall pattern means thatwaterlogging can be severe in winter, nutrients can bereadily leached as water penetrates below the root zone,and that recharge of watertables may be difficult toprevent, particularly under shallow rooted annual species.

CHAPTER 1 – ENVIRONMENT THE WHEAT BOOK
6
CLIMATE IN RELATION TO AGRICULTURE IN SOUTH-WESTERN AUSTRALIA (continued)
Figure 1.5
Mean monthly solar radiation (MJ/m2/day), minimum and maximum temperature (oC) for June, July and August.

THE WHEAT BOOK CHAPTER 1 – ENVIRONMENT
7
CLIMATE IN RELATION TO AGRICULTURE IN SOUTH-WESTERN AUSTRALIA (continued)
Rainfall has had another indirect, but important,influence on the agriculture of the region – salt. Thelarge amounts of salts stored in the subsoils of thewheatbelt are of maritime origin. The salts have acomposition similar to that of sea water. Over much ofthe wheatbelt between 20 and 40 kg of salt is added toeach hectare from rainfall every year.
Without the drainage systems to return this salt tothe oceans, it has accumulated in the subsoils and is nowcausing salinization of parts of the landscape where risingwatertables (caused by clearing) bring the salinegroundwaters to the surface.
Solar radiationSolar radiation is the second most important climatic
element after rainfall, because it determines the temperatureand evaporation regimes which drive plant growth. Figure1.5 illustrates the pattern of solar radiation received duringthe winter months of June, July and August. At 8 to 10megajoules per square metre per day (MJ/m2/day), solarradiation is unlikely to limit crop growth, especially as cropand pasture leaf areas are low in winter.
The solar energy reaching the ground in summer mayreach 30 MJ/m2/day due to the elevation of the sun, theclear atmosphere and cloud-less skies. These are amongstthe greatest radiation loads received at the earth’s surfaceand are one reason for the productivity of irrigated summercrops in regions of Mediterranean climates.
TemperatureMean annual temperatures for the wheatbelt follow
closely the trends of solar radiation, however, wintertemperatures are moderated close to the coast by theIndian and Southern Oceans. Coolest temperatures occurin the southern and eastern wheatbelt (Figure 1.5) wheremean temperatures are between 10 and 12°C for thewinter months. Minima for the same period are 4 to 5°C,and maxima 14 to 16°C. The optimum temperature forwheat growth is about 25°C.
Although mean temperatures indicate the suitabilityof the environment for crop growth, processes such asleaf growth, tillering and the progress of plantdevelopment are often closely related to the Accumulatedtemperature. This is expressed in °C.days (degree days)and is explained in Chapter 3. Basically, it is the sum ofthe mean temperatures for each day.
Figure 1.6 shows the accumulated temperature or‘growing °C.days’ for May to October. Accumulatedtemperatures are useful for comparing growingenvironments. From the meteorological tables in theAppendix, it is possible to calculate accumulatedtemperatures for many other purposes.
Low temperatures can stimulate the development ofsome wheats. Accumulated temperatures below 10°C
can be a measure of the ability of the environment tosatisfy a plant’s low temperature requirement.
In Western Australia, temperatures are low enough tostimulate most winter wheats to flower but the season is notlong enough to allow them to reach their full yield potential.
Figure 1.6a
Figure 1.6b
a. Growing oC days (base 0oC), and b. vernalizing oC days(accumulated temperature below 10oC for April to October).
Synoptic eventsDuring winter, there are several synoptic events (that
is, weather occurring over several days) which are ofparticular importance to agriculture. These are shown in

CHAPTER 1 – ENVIRONMENT THE WHEAT BOOK
8
CLIMATE IN RELATION TO AGRICULTURE IN SOUTH-WESTERN AUSTRALIA (continued)
the series of daily pressure maps in Figure 1.7,illustrating a typical sequence of weather events.
The most obvious is the passage of cold fronts overthe southern part of the state during days 3 and 4 of thesequence. As explained previously, this is the main sourceof rainfall during winter and spring.
Another aspect is the potential for wind erosion. If thesequence of events in Figure 1.7 occurs in late autumn orearly winter, the situation on Day 2 could present a risk ofwind erosion. Strong northerly winds can be generated as theapproaching front increases the pressure gradient betweenitself and the high to the east. If the land has minimal plantcover from grazing pressure, or from dry seeding, thensusceptible soils will suffer wind erosion. Fine particles andnutrients will be lost as dust and larger soil particles canmove across paddocks, piling up along fence or tree lines.
In late winter and spring, the last day of thesequence increases the likelihood of frost. Thepreceding days (days 3 and 4) are likely to have beencloudy, wet and cool or cold. As the new highestablishes itself the night will probably be cloud-freeand there will be no or light winds. Under theseconditions, the land surface will cool rapidly throughradiation of thermal energy to space.
The combination of preceding cool days, cold southerlyairflow and clear skies can produce low temperatures. Coldair will tend to move downslope and accumulate in thelowest parts of the landscape, often producing frost as watervapour freezes on plant surfaces. In severe cases, water insideplant tissues freezes and bursts the cells.
Frost is an important agricultural risk and is coveredin more detail in Chapter 7.
Figure 1.8
A sub-division of the south-east of Western Australia according toclimatic features.
Figure 1.7
Typical series of daily weather charts showing events during thepassage of cold fronts.
Climatic sub-division of thewheatbelt
The primary sub-division of climate for the south-west of Western Australia is a north-south separationapproximately at right angles to the western coast. Asecond sub-division can be made on the pattern ofrainfall isohyets parallel to the coast.
This map (Figure 1.8) is similar to the regional sub-divisions adopted for Agriculture Western Australia’scrop variety recommendations.
Australian climates used for wheatproduction
It is often assumed that wheat productionthroughout southern Australia takes place in arelatively similar environment: so that technology andproduction systems might be readily transferred. This isnot the case.
Although the westerlies dominate in the south, theclimate of eastern Australia is more complex. Winter rainfallfrom the westerlies is supplemented by summer rainfallfrom moist air masses from the Pacific Ocean. Rainfallgrades from strongly winter-dominant in the west, througha uniform, all-year-round distribution in Victoria andsouthern New South Wales, to strongly summer-dominantin the north. The range is illustrated in Figure 1.9.
The Australian wheatbelt can be divided into threeregions: a southern winter rainfall region, a northern regionof summer-dominant rainfall and a south-eastern region ofhigh (greater than 550mm), and evenly distributed rainfall.

THE WHEAT BOOK CHAPTER 1 – ENVIRONMENT
9
GLOBAL CIRCULATIONS AFFECTING WEATHER IN SOUTH-WESTERN AUSTRALIA (continued)
Figure 1.9
Rainfall amount and distribution for the wheatbelt of western, southern and eastern Australia.
The winter rainfall region produces about 70% ofAustralia’s cereals; and includes Western Australia, SouthAustralia, Victoria and southern New South Wales. Thecharacteristic winter peak is most extreme in the west whereGeraldton and Wongan Hills receive 80 to 85% of theannual rainfall in the growing season. More typically, 60 to70% of rainfall is received in the growing season, (Merredin66%, Clare 61 per cent, Walpeup 59% and Horsham58%). Mid-winter temperatures are mild (12 to 15°C day /5 to 8°C night) and mid-winter radiation levels low (9 to 11MJ/m2/day).
The summer rainfall region extends from centralNew South Wales to Queensland and accounts for about25% of cereal production. Rainfall is greater andincreases in both amount and summer dominance to thenorth. Dubbo, for example, receives 531mm, with 42per cent falling in winter, Narrabri 662mm (38%),Dalby 614mm (29%) and Biloela 705mm (19%).
Mid-winter temperatures are higher (15 to 19°C day/ 8 to 12°C night) than in the southern region except athigh elevation. Radiation frosts after ear emergence may
cause severe damage and planting times are adjusted toavoid flowering during the period of greatest risk of frost.
The south-eastern region, which lies to the south andeast of the present wheatbelt, is high rainfall (over550mm) with significant amounts in both summer andwinter. This region produces less than 5% of Australia’swheat.

Average AnnualRainfall
Exmouth
Port Hedland
Broome
Kalumburu
Fitzroy Crossing
Halls Creek
Derby
Wyndham
Marble BarBalgo Hills
Wittenoom
NewmanThree Rivers GilesCarnarvon
Geraldton Morawa
Mount Magnet
Leonora
Kalgoorlie-Boulder
Norseman
Forrest
Perth
PembertonAlbany
Esperance
Katanning
Northam
Meekatharra
50 100
200
300
400
600
900
1200
1800
2400
3200 Millimetres
Based on a standard 30-year climatology (1961 to 1990)
© Copyright Commonwealth of Australia, Bureau of Meteorology
CHAPTER 1 – ENVIRONMENT THE WHEAT BOOK
10

Joe CourtneyWestern Australian Regional Office, Bureau ofMeteorology
Most people tend to think of averages when talkingabout the climate of an area. The annual average rainfallmap (opposite) shows the geographic distribution ofaverage rainfall and a site’s monthly averages (Figure 1.10a)indicate the general distribution during the year. This is agood starting point but sometimes more important isknowing the variability of the climate from one year to thenext. The distribution of rainfall in each month can beexpressed using deciles or percentiles which show thechance of getting certain amounts of rainfall (Figure1.10b). For example, at Merredin in July when the medianis 48mm, in the driest 30% of July months rainfall is lessthan 37mm and in the wettest 30% of July months rainfallis at least 59mm. The lowest reading is 9mm and thehighest is 127mm.
However, this is still looking at rainfall on a monthlybasis. The timing and amount of daily rainfall is probablya better guide in determining the characteristics of aseason. For example, the years 1992 and 1994 showcompletely different rainfall patterns and would requiredifferent management strategies to optimise propertyproduction (Figure 1.11).
Mechanisms that modify the seasonsWe are quite familiar with the causes of day to day
weather patterns such as the movement of highs, lows andcold fronts. However, trying to explain the variations of theseasons one year to the next has been far more complicated.
While there is still a long way to go, research in the past20 years has uncovered some of the influences on ourseasonal weather patterns. Variations are linked to the threeoceans surrounding the continent (Indian, Pacific andSouthern). The effects of each of these wax and wane,interacting with each other, making each year differentfrom the last. Three identified effects are known as the El-Nino Southern Oscillation (ENSO) in the Pacific Ocean,the Indian Ocean Dipole, and a recent discovery of yet tobe determined significance, the Antarctic CircumpolarWave in the Southern Ocean. Each involves both theatmosphere and ocean acting together and affecting each
THE WHEAT BOOK CHAPTER 1 – ENVIRONMENT
11
CLIMATE VARIABILITY AND SEASONAL FORECASTING
60
Rai
nfa
ll (m
m)
Jan
41.3
52.1 51.3
Feb Mar Apr May June
MonthJuly Aug Sept Oct Nov Dec
Merredin Average Rainfall(annual average 326 mm)
50
40
30
20
10
0
39.4
25.7
14.2 13.1
22.020.4
15.7
11.3
19.1
Rai
nfa
ll (m
m)
Jan Feb Mar Apr May June
MonthJuly Aug Sept Oct Nov Dec
Rainfall Distribution at Merredin
Highest 30%
Middle 40%
Lowest 30%
0
20
40
60
80
100
120
140
160
180
Figure 1.10b
Average annual rainfall at Merredin.
Monthly rainfall distribution at Merredin.
Figure 1.10a
Rai
nfa
ll (m
m)
Jan Feb March April May June
Month
July Aug Sept Oct Nov Dec
Merredin Daily Rainfall 1992Total 463 mm (ave 326 mm)
0
51015
25
35
45
20
40
50
30
Rai
nfa
ll (m
m)
Month
Jan Feb March April May June July Aug Sept Oct Nov Dec
Merredin Daily Rainfall 1994Total 193 mm (ave 326 mm)
25
20
15
10
5
0
Figure 1.11b
Daily rainfall at Merredin in 1992.
Daily rainfall at Merredin in 1994.
Figure 1.11a

CHAPTER 1 – ENVIRONMENT THE WHEAT BOOK
12
CLIMATE VARIABILITY AND SEASONAL FORECASTING(continued)
other. These effects, together with others less well knownor yet to be discovered, combine to be responsible forproducing such a variable climate in Australia.
However, we are still limited in our ability to predictimportant seasonal features such as the timing of the firstsignificant cold front that is often responsible for the breakof season.
El Nino – Southern OscillationEl Nino translates from Spanish as ‘the boy-child’.
Peruvian fisherman originally used the term, a reference tothe Christ child, to describe the appearance, aroundChristmas, of a warm ocean current off the SouthAmerican coast.
Nowadays, the term El Nino refers to the extensivewarming of the central and eastern Pacific that leads to a majorshift in weather patterns across the Pacific (Figure 1.12). ElNino events are associated with an increased probability ofdrier conditions particularly in eastern Australia.
Of the three factors listed above, ENSO is the moststudied, best known and the most important feature forAustralia’s rainfall patterns. El Nino affects many parts ofthe globe, and is particularly significant for northern andeastern Australia. Its focus is the tropical Pacific Oceanwhere big changes can occur that involve both theatmosphere and the ocean interacting and affecting eachother. These changes oscillate irregularly between two mainstates: El Nino and La Nina. These extreme events last forabout 12 to 18 months with autumn often being the
Figure 1.12
Schematic diagram showing the major ENSO patterns.

transition period, although the 1990s has witnessed anabove average number of El Ninos, some in succession.
Changes to the atmosphere and ocean circulationduring El Nino events include:
Warmer than normal ocean temperatures across thecentral and eastern tropical Pacific Ocean.Increased convection or cloudiness in the centraltropical Pacific Ocean – the focus of convectionmigrates from the Australian/Indonesian regioneastward towards the central tropical Pacific Ocean.Weaker than normal (easterly) trade winds.Low (negative) values of the SOI (Southern OscillationIndex).The term La Nina refers to the extensive cooling of
the central and eastern Pacific Ocean (note: the term ‘LaNina’ has only recently become the conventionalmeteorological label for the opposite of El Nino). InAustralia (particularly eastern Australia), La Nina eventsare associated with increased probability of wetterconditions.
Changes to the atmosphere and ocean circulationduring La Nina events include:
Cooler than normal ocean temperatures across thecentral and eastern tropical Pacific Ocean.Increased convection or cloudiness over tropicalAustralia, Papua New Guinea, and Indonesia.Stronger than normal (easterly) trade winds across thePacific Ocean (but not necessarily in the Australianregion).High (positive) values of the SOI.ENSO is monitored in a number of ways. A simple but
effective measure is the SOI. The SOI is calculated fromthe monthly or seasonal fluctuations in the pressuredifference between Tahiti and Darwin. Sustained negativevalues of the SOI often indicate El Nino episodes, whilepositive values indicate La Nina episodes (Figure 1.12),also for more information see http://www.bom.gov.au/climate/glossary/elnino.shtml.
ENSO and South-west WACorrelations of ENSO with rainfall in the wheatbelt
are much less than those in the eastern states. In El Ninoyears there is a slight bias towards drier conditions at somestages of the year, while in La Nina years there is a slightbias to wetter conditions. It must be noted that thecorrelations between rainfall and ENSO vary dependingon the way in which the signals are used. For example,sometimes the trend in SOI is more useful than the actualvalues of the SOI.
Indian Ocean DipoleA dipole pattern of sea-surface temperatures (SST) in
the Indian Ocean has been related to bands of cloud thatsweep across the continent from north-west to south-east,known as north-west cloudbands. These cloudbands are
important rainfall mechanisms form April to Augustthrough the Gascoyne, Murchison and northernagricultural areas in particular, and are often associatedwith the break of the season for the northern and centralwheatbelt.
When there is warm water north of Australia and arelatively colder region in the central Indian Ocean west ofthe continent (see figure 1.13), the resulting stronger thannormal sea surface temperature gradient assists inproducing the moisture-laden north-westerly flow overAustralia enhancing the occurrence of north-west cloudbands. The reverse pattern of relatively cold water in thecentral Indian Ocean is associated with reduced rainfall bysuppressing north-west cloudbands. Research at CSIRO isinvestigating links with the SST anomalies and the depthof warm water near the surface, the sea level height, thetransport of water around the Indian Ocean and also thelinks with ocean patterns in the Pacific.
THE WHEAT BOOK CHAPTER 1 – ENVIRONMENT
13
CLIMATE VARIABILITY AND SEASONAL FORECASTING(continued)
Figure 1.13
Indian Ocean dipole.
The Antarctic Circumpolar WaveThis phenomenon has only recently been discovered
and while its impact appears to be strongest in southernAustralia, it is not yet known how significant it is forWestern Australia. The southern ocean contains a largecurrent which flows continuously around the Southernhemisphere at about 10cm per second, carrying most ofthe water with it. It takes about eight or nine years for thiscurrent to transport water completely around the globe.
Carried along with this current are two large regions ofrelatively warm water, thousands of kilometres across and1km deep, alternating with two equally large regions ofrelatively cold water. This pattern is called the AntarcticCircumpolar Wave (Figure 1.13) and, like ENSO, appearsto be due to interactions between the ocean and theatmosphere. The wave is also associated with pressure andwind patterns and the extent of sea-ice from Antarctica.
When the warm region is present south of Australia,winds carry slightly more moisture than usual causingwinters to be slightly wetter and warmer than normal.Conversely, cold water south of Australia brings cooler anddrier conditions to southern Australia. Being such a recentdiscovery it is difficult to assess the significance of thisfeature and how it affects rainfall in south-west WesternAustralia.

Wet and dry yearsA CSIRO study has compared pressure patterns
between the wet and dry winters in Western Australia(Allan and Haylock, 1993). By compositing thepressure fields they produced pressure fields andanomaly fields for both the dry and wet years (seeFigures 1.14a and 1.14b). This showed that in dry years,pressures were higher around Australia particularly tothe immediate south of the continent. In the wet years,pressures were lower around Australia (particularlysouth of Western Australia) suggesting an increase incold front activity.
Explaining the variations – someexamples
Let’s return to the years 1992 (wet) and 1994 (dry).Although El Nino events tend to last for only 12 to 18months there was an extended period of El Ninoconditions between 1991 and 1994. However, therewere noticeable differences between the two years interms of global patterns.
By early 1992 an El Nino event had reached fullmaturity and it began to weaken in autumn.Nevertheless, the average SOI for January to April was–19.4, an exceptionally low value. This weakeningcoincided with a strong Indian Ocean dipole signalassociated with considerable north-west cloudbandactivity. Well above average rainfall occurred in autumnand winter through much of southern Western Australiawith some record totals in the eastern wheatbelt andGoldfields area.
In 1994, the SOI decreased from near zero values inJanuary and February to be strongly negative for theremainder of the year signalling the re-emergence of ElNino. In addition, a reverse Indian Ocean dipole withrelatively very cold water off Indonesia led to asuppression of north-west cloudbands. Conditions inthe wheatbelt were very dry until the end of May andyearly totals were below average. While we do not fullyunderstand the mechanisms that cause these seasonalrainfall variations, it is clear that the oceans have a majorrole to play.
What does it mean for seasonalforecasts?
How these mechanisms relate to each other and thecombined affects on our rainfall are the basis of researchto improve seasonal forecasting. Until quite recently theBureau of Meteorology’s seasonal outlooks were basedentirely on ENSO. A more sophisticated scheme usingocean patterns in both the Pacific and Indian Oceans isnow operational. These are three-month outlooks givingthe probability of receiving below average, average andabove average rainfall. The accuracy varies during the
year, and with each year, according to variations in theoceanic system. A summary of the outlook is available onthe internet (http://www.bom.gov.au/climate/ahead/rain_ahead.shtml, by Weather by fax (1902 935 251) orthrough some media outlets.
The Indian Ocean Climate Initiative (IOCI) is aWestern Australian initiated partnership to foster researchinto climate variability and development in seasonalforecasting. The results from this effort are likely toimprove the understanding of seasonal mechanisms andhopefully lead to improved forecast skill on a seasonal basis.
CHAPTER 1 – ENVIRONMENT THE WHEAT BOOK
14
CLIMATE VARIABILITY AND SEASONAL FORECASTING(continued)
Figure 1.14a
Figure 1.14b

Climate trends in rainfall andtemperature
Apart from year to year variability, the issue of long-term changes in rainfall and temperature patterns is ofgreat importance, and concerns over global warming andits impacts have attracted great interest over the past decadeor so.
Rainfall has declined in the south-west over the courseof this century particularly in the far south-west since the1940s (Figure 1.15). The trend in May to October rainfallclosely matches the annual rainfall trend, although theNovember to April trend is weaker and more varied.Rainfall patterns in the eastern wheatbelt show less obvioustrends.
Trying to understand the mechanisms of these changesand ultimately to be able to predict future rainfall are aimsof a major research study. The current downward trend inwinter rainfall over the south-west may be due to a generalwarming of a wide area of the Indian Ocean over the lastfew decades and variations in the large-scale atmosphericcirculation across southern Australia since 1971. This trendmay be regarded as a part of the natural variability of theclimate system. This is supported by the fact that annualrainfall increased from the earliest rainfall records lastcentury until the early to mid part of the 20th century.
Consistent with trends elsewhere in Australia, averagemaximum and minimum temperatures have increased inWestern Australia since instrumental records began(Figures 1.16a and 1.16b). There are many difficultiesassociated with comparing historical temperaturesincluding change of instrument type, changes in observingpractices and sites, and changes in the environmentsurrounding the instrument (particularly in urban areas).Nevertheless, with these issues taken into account researchinto observations of temperature indicate a definite long-term increase.
THE WHEAT BOOK CHAPTER 1 – ENVIRONMENT
15
CLIMATE VARIABILITY AND SEASONAL FORECASTING(continued)
Figure 1.15
Trend in annual rainfall 1910-1989 (%/decade).
Figure 1.16b
Trend in annual maximum temperature (1959-94).
Trend in annual minimum temperature (1950-94).
Figure 1.16a

John CrambWestern Australian Regional Office, Bureau of Meteorology
DecilesDeciles are a method of describing rainfall probabilities
for a month, group of months or a year. They are thereforeuseful for comparing recent rainfall with the average.Because rainfall and crop yield are closely related, they maytherefore give some clue to likely yields at the end ofseason.
Deciles are obtained by dividing the historical rainfallinto tenths. The deciles obtained range from 1 to 9 andeach has a corresponding rainfall total expressed inmillimetres. For example if a monthly total of 65mm has adecile rating of 3 – less than 65mm will be received in 3years out of ten, and greater than 65mm in seven years outof ten.
Deciles can be summarized as follows:Decile 9 9 in 10 seasons receive less rainfall (or only
one season in 10 receives more)Decile 8Decile 7Decile 6Decile 5 5 in 10 seasons receive less than this amount
and 5 in 10 more.Decile 4Decile 3Decile 2Decile 1 Only 1 in 10 seasons receives less than this
amount, 9 in 10 seasons receive more.Deciles are specific to the location where the rainfall
was recorded. Decile values for monthly and annualrainfall totals have been calculated by the Bureau ofMeteorology for many centres in Western Australia and arefreely available. As an example, Table 1.2 gives the monthlyand annual decile rainfalls for Merredin.
For the annual totals for Merredin, the values oppositedecile 9 indicate that only one year in ten will have anannual rainfall greater than 410mm, whilst nine years inten will have 216mm (decile 1). Note that decile 5(301mm), the value for which half of all years will be aboveand half below, is very close to the long term average of309mm.
The same can be done to the monthly rainfalls. Forexample, June rainfall will be less than 19mm in only oneyear in ten.
Using deciles to track seasonalconditions
Deciles for the total rainfall received in two, three, ormore consecutive months can be calculated and thegrowing season conditions can be tracked. Starting inApril, compare the rainfall received for the month with the
decile 9, decile 5 and decile 1 values. Then at the end ofMay, calculate the total rainfall received for April and May,and compare this with the decile values for the two monthscombined.
CHAPTER 1 – ENVIRONMENT THE WHEAT BOOK
16
CALCULATING RAINFALL PROBABILITIES FROM DECILES
Figure 1.17c Merredin 1990
Figure 1.17b Merredin 1989
Figure 1.17a Merredin 1988
April to October rainfall and cumulative decile rainfall charts forMerredin for 1990.
April to October rainfall and cumulative decile rainfall charts forMerredin for 1988
April to October rainfall and cumulative decile rainfall charts forMerredin for 1989.
In the same way at the end of June, compare the totalrainfall for the three months with the appropriate decilesfor the three month period; and so on to the end of theseason.
The results of this analysis are most easily understoodby drawing the cumulative rainfall at the end of eachmonth on a graph with the decile values. Figure 1.17 showsthe cumulative rainfall at Merredin in 1988 (a very goodseason), 1989 and 1990 from the end of April to the endof October. The decile 1, decile 5 and decile 9 rainfallvalues are also shown.
For 1989, the season was well above average at the endof May and June, but then deteriorated to have belowaverage seasonal rainfall to the end of October. For 1990,seasonal conditions were below average.
Deciles can also be used to update the probabilities fortotal seasonal rainfall, and since this is closely related tograin yield, give some clue to the yield prospects for theseason.
If the season is going to be good, with above averagerainfall, there are likely to be good responses to additionalnitrogenous fertilizer, copper or molybdenum sprays maybe required on high biomass crops and there are likely tobe good yield responses to herbicides.
On the other hand, if the season is going to be belowaverage, the chance of profitable responses to additionalinputs is less or may even be negative.
Making such forecasts, which look ahead to the end ofthe season, is more complex than simply tracking theprogress of the season, but such services are potentially ofgreat value.
THE WHEAT BOOK CHAPTER 1 – ENVIRONMENT
17
CALCULATING RAINFALL PROBABILITIES FROM DECILES(continued)

Peter TilleAgriculture Western Australian Soils Group
General soil characteristicsThe soils of south-western Australia have a reputation
for being sandy with inherent low fertility. Many majorand minor elements such as N, P, K, S, Cu, Zn, Mn andMo are deficient for plant growth. This is largely due to theage of the soils and their high degree of weathering, therebeing a small proportion of freshly renewed soils incomparison with most other wheat growing regions of theworld. The weathering has also led to a predominance ofsandy textured topsoils consisting of highly resistant quartzgrains. Silty materials are rare and the clayey subsoils aredominated by kaolinitic minerals. The widespreadoccurrence of iron and aluminium rich laterite is anothercharacteristic of the soils and landscape. While the abovegeneralisations are broadly true, there are wide variations insoil types and fertility.
History and geologyThe distinctive landforms of south-western Australia
and the soils associated with them reflect their geologicalhistory. Much of the south-west occurs on a geologicallystable area, known as the Yilgarn Craton, which consists ofacid granitic rocks and is one of the oldest remainingportions of the earth’s surface (over 2,500 million yearsold). The western boundary of the Yilgarn Craton is theDarling Fault which extends from Mullewa and ThreeSprings to Donnybrook and Nannup. This fault is one ofthe largest lineaments on the Earth’s surface being 1,000km long with a current topographical expression of up to200 m along the Darling Scarp.
Granitic geology occurs along the south coast and atMargaret River and Northampton. While these rocks areyounger the those of the Yilgarn Craton, they are still over1,000 million years old. All of these areas have been worndown by erosion for several hundred million years. As aresult of the old age of the landscape there are no majormountain ranges, relief is low and subdued, and drainageoften sluggish.
To the west of the Darling Scarp, the underlyinggeology consists mainly of sedimentary rocks, such assandstones and siltstones. Along the coast betweenGeraldton and Busselton these are overlain by the morerecent sediments of the Swan Coastal Plain. Sedimentaryrocks are also found along the South Coast overlying thegranitic basement. In some places the sedimentary rockshave given rise to prominent landscape features such as theflat topped mesa of the Moresby Range near Geraldton.The Stirling and Barren Ranges on the South Coast haveformed on metamorphosed sediments.
Much of the south-west is overlain by a mantle ofdeeply weathered material dating back 50 million years ormore. This weathered surface is commonly 30-50 m deep,
laterite is a prominent feature which has formed overgranitic and sedimentary rocks. The lateritic profile ischaracterised by an accumulation of iron and aluminiumnear the surface. It typically consists of a surface layer ofsand and ironstone gravel overlying an iron induratedcrust of cemented gravel (duricrust). The duricrust istypically underlain by a heavily mottled clay (mottledzone) grading into a pale coloured clay from which mostof the iron has been removed (pallid zone). Below this isa partially weathered material (saprolite) which typicallyconsists of a gritty material retaining the fabric of theunderlying rock.
The extent of dissection is controlled by earthmovements mainly around the south-western margin ofthe otherwise stable Yilgarn Block. Upwarping to form theDarling Range, and a downward sag along the zone ofseismic activity running through Brookton, Beverley,Northam and beyond has led to renewed down-cutting bythe marginal rivers and streams.
The process has extended inland to truncate the ancientdrainage lines represented by the salt lake chains to a limitshown on Figure 1.18 as the Meckering Line. Somegeologists believe that the salt lake chains of the interiorrepresent ancient river systems which flowed before thesuper-continent of Gondwanaland began to break up andthe major land masses of the world drifted apart.
Upstream of the Meckering Line lies the Zone ofAncient Drainage where lateritic profiles are widespread onthe extensive uplands between the wide, flat floored trunkvalleys with low gradients.
Downstream is the Zone of Rejuvenated Drainage withmore frequent dissection, closer more incised streamsystem, and the divides are smaller. They are again crownedwith laterite and often defined by prominent breakaways.However, the pallid zone clays are still present on therelatively steep valley side slopes beneath a generallyshallow sandy veneer.
In the higher rainfall areas lateritic profile is absent onlywhere slopes are steeper and topographic relief greater.Erosional and depositional processes acting over a verylong time have dissected the lateritic landscape to exposelimited areas of fresh rock on which younger and morefertile soils have formed. In the Darling Range, despite itswell developed stream system, and generally hillytopography, lateritic materials mantle almost the wholelandscape, often in the form of duricrust. Perhaps due tothe high rainfall, weathering is even more extreme, so thatoxides of aluminium are concentrated in relation to otherconstituents to form bauxitic laterites in parts of thelandscape.
Salt in the landscapeThe deeply weathered profile in south-western
Australia contains large quantities of soluble salts, mainlysodium chloride. In the wheat growing areas the salt stored
CHAPTER 1 – ENVIRONMENT THE WHEAT BOOK
18
LANDFORMS AND SOILS OF SOUTH-WESTERN AUSTRALIA

in the landscape may amount to a million or morekilograms per hectare, most of it in the deep subsoils andsaline watertables.
The salts originate in the ocean, and are carried inlandin dilute concentration in the rainfall. While the water islost from the soils by evaporation and transpiration, thereis no escape for the salts, which are retained. Even the largeamounts present would have taken only about 10,000years to accumulate at present rates of accession, a veryshort time in comparison with the long period of leachingwhich must have preceded it.
Soils of the wheat growing areasThe major soil types of Western Australia have been
placed into 56 groups. These groups have been furtheramalgamated into 12 supergroups. The supergroups aredefined using three primary criteria:
the texture profilethe presence and nature of coarse fragmentsthe water regimeThe soil groups are further divided by the following
secondary and tertiary criteria:the presence of carbonatestopsoil colourhorizon or profile depthpH (acidity or alkalinity)soil strictureFigure 1.18 shows the distribution of these soils. This
mapping is based on the detailed (mapping scales rangingfrom 1:50,000 to 1:250,000) soil-landscape mapping ofthe agricultural area of Western Australia. Contact theNatural Resources Assessment Group of AgricultureWestern Australia for more details.
The soil types and associated natural vegetation of thewheat growing areas are shown in Figures 1.19 and 1.20.
THE WHEAT BOOK CHAPTER 1 – ENVIRONMENT
19
LANDFORMS AND SOILS OF SOUTH-WESTERN AUSTRALIA(continued)
Figure 1.18
The soils of south-western Australia.

Detailed descriptions of selected soil types are given in theAppendices.
Figure 1.19 represents a cross section of a typicalwheatbelt valley inland of the Meckering Line.Modification of the old landscape by natural erosion anddeposition is relatively minor, but nevertheless has had animportant impact on the soil pattern.
The lateritic profile is best preserved on the upland, butsands tend to accumulate in the depressions as yellowsandy earths, leaving ironstone gravelly soils on the higherareas.
On steeper valley side slopes stripping may exposemottled or pallid zones clays upslope with accumulationsof sand downslope to give extensive areas of sandy duplexsoils and loamy duplex soils with yellow or pale subsoils.
Where fresh bedrock outcrops or is close to the surfaceit provides a source of relatively unweathered materialwhich gives rise to naturally more fertile soils, often redloamy earths. These soils may be developed from thebedrock in situ or on extensive water laid deposits derivedfrom it to form the ‘heavy land’ of the broad wheatbeltvalleys.
Figure 1.19 shows the typical situation in which thedeeply weathered pallid zones lie beneath the valley floor,carrying saline water tables where the salt concentrationmy be several times that of sea water.
The salt lakes, when dry, are the source of wind blown
deposits lying generally along the south-eastern lake shores.Near the lakes they are in dune-like form, often rich ingypsum, sometimes suitable for commercial exploitation.Further out, layers of silty, calcareous and saline loams giverise to the calcareous loamy earths (the so-called ‘snuffymorrell’ soils).
Figure 1.20 shows a valley cross section downstream ofthe Meckering Line. The soil pattern is essentially thesame, but slopes are steeper, valleys more sharply incised,and salt lakes absent. Upland areas with sand thins out andthe clays approach the surface soaks or swamps with freshor brackish water appear, often developing after clearingupslope.
Soils and cereal growingCereal growing in south-western Australia presents a
variety of management problems arising directly from theinherent properties of the soils.
The sandy surface soils are extremely deficient in majorand minor nutrient elements. The low clay content meansthey have a low capacity for retention of most appliednutrients, while the presence of iron oxides leads to fixationand unavailability of applied phosphate.
Resistance to chemical change, known as bufferingcapacity, is low, so that acidity of surface soils is readilyinduced by fertilisation.
CHAPTER 1 – ENVIRONMENT THE WHEAT BOOK
20
LANDFORMS AND SOILS OF SOUTH-WESTERN AUSTRALIA(continued)
Breakaway
WEST
EAST
Saline valley floor Calcareous soils Sands and loams(often alkaline)
or
Sandy duplex soils(often alkaline)
Sands and loams(often alkaline)
Yellow sandplain
or
Grey sandplain
Heavy soils
Banksia, Sandplain pear,Tammar, Wodjil,Sanplain Mallee,Christmas Tree,Flame Grevillia
Yellow sandy earths,Acid yellow sandy earths,Yellow deep sands,Gravels Gravelly pale dep sands,Grey deep sandy duplex,Pale deep sands, Duplex sandy gravels
Alkaline grey deep sandy duplex, Alkaline grey shallow sandy duplex, Calcareous loamy earths, Saline wet soils, Salt lake soils, Loamy duplex soils
Grey shallow sandy duplex(often alkaline),Grey shallow loam duplex(often alkaline),Grey non-cracking clay,Heavy cracking clay
Grey deep sandy duplex (often alkaline),Grey shallow sandy duplex (often alkaline),Loamy earths,Sandy earths. Grey deep sandy duplex (often alkaline),Grey shallow sandy duplex (often alkaline),Duplex sandy gravels,shallow gravels
Calcareous loamy earths, Alkaline grey shallow loamy duplex, Alkaline grey shallow sandy duplex, Alkaline red shallow loamy duplex
Morrel, Salmon Gum, York Gum, Wandoo, Gimlet
Salmon Gum, Wandoo, Mallee, Gimlet Wandoo, Salmon Gum, York Gum, Jam,Sheoak
Salmon Gum, Gimlet, Morrel,Bluebush, Saltbush, Melalueca,Samphire, Barley Grass, Bare ground
VEGETATION
SOIL-LANDSCAPEGROUPING
MAJOR SOIL GROUPS
Mallee Species, Moort, Yate,Salmon Gum
Salt lake
Salt lake
Rocky outcrops
Adapted from: Lantzke and Fulton "Land Resources of the Northam Region" Land Resources Series No. 11, Agriculture Western Australia
Figure 1.19
Soil types of the eastern wheatbelt and their associated vegetation.

Some deep sands and sandy earths, particularly the acidyellow sandy earths, have naturally acid subsoils whichtend to restrict root development.
The water holding capacity of sandy soils is low, so thatalthough the soil water is readily available to plants, it canreadily escape below the root zone, contributing tosalinisation problems downslope.
Soil organic matter is low and readily lost under warmconditions, leading to poor soil structure and risk of winderosion.
Kaolinitic clays and oxides of iron and aluminium,common in lateritic materials, have a relatively lowcapacity to adsorb and retain nutrients, so that the moresoluble nutrients such as nitrogen, sulphur and potassiumcan leach readily.
The tendency of the clays to disperse in water isaccentuated by the presence of the sodium ion, leading tostructural deterioration, increased run-off andwaterlogging downslope.
Management for sustainable production will thereforealways be difficult because of the particular characteristicsof the soil resource. Advances are likely to come fromprogressive adaptation of farming systems to soil andclimatic conditions.
ReferencesAllan, R.J. and Haylock, M.R., 1993. Circulation
features associated with the winter rainfall decrease insouthwestern Australia. J. Climate, 6, 1356 – 1367.
THE WHEAT BOOK CHAPTER 1 – ENVIRONMENT
21
LANDFORMS AND SOILS OF SOUTH-WESTERN AUSTRALIA(continued)
WEST EAST
VEGETATION
Adapted from: Lantzke and Fulton "Land Resources of the Northam Region" Land Resources Series No. 11, Agriculture Western Australia
SOIL-LANDSCAPEGROUPING
MAJOR SOIL GROUPS
Sands and loams
Grey deep sandy duplex, Red deep sandy duplex,Grey shallow sandy duplex, Red shallow sandy duplex,Red deep loamy duplex,Red loamy earth
Sandyduplexsoils
Salinevalleyfloors
Grey sandplain
Grey sandplain
Sandyduplexsoils
Pale deep
sands
Gravelly pale deep sands,Grey deep sandy duplex,Pale deep sands, Duplex sandy gravels
Gravelly pale deep sands,Grey deep sandy duplex,Pale deep sands, Duplex sandy gravels
Pale deep sands, Gravelly pale deep sands,Grey deep sandy duplex,Duplex sandy gravels,Wet soils
Grey deep sandy duplex (often alkaline), Grey shallow sandy duplex (often alkaline), Saline wet soils,Loamy duplex soils
Grey deep sandy duplex, Grey shallow sandy duplex, Duplex sandy gravels,Deep sandy gravels
Grey deep sandy duplex, Grey shallow sandy duplex, Duplex sandy gravels,Deep sandy gravels
York Gum, Jam, Sheoak,Salmon Gum, Wandoo,Flooded Gum
Wandoo,York Gum,Jam,Salmon Gum, Sheoak
Sandplain Pear, Banksia,Tammar,Ti-tree,Christmas Tree,Wandoo
Sandplain Pear, Banksia,Tammar,Ti-tree,Christmas Tree,Wandoo
Wandoo, Mallet,Jam, Tammar, Salmon Gum, Sheoak
Wandoo, Mallet,Jam, Tammar, Salmon Gum, Sheoak
Banksia, Christmas Tree,Wandoo, Blackboy, Ti-tree,Rushes
Breakaway SwampRiver
Figure 1.20
Soil types and associated vegetation west of the Meckering Line.

CHAPTER 1 – ENVIRONMENT THE WHEAT BOOK
22

Chapter Coordinator: T.L. SetterWheatbook 1 authors: M.W. Perry and R.K. BelfordRevised by: T.L. Setler and G. Carlton
The Structure and Development of the Cereal Plant......................................25
Description of the Wheat Plant ......................................................................26The grain................................................................................................................26The leaf ..................................................................................................................27Tillers ....................................................................................................................28The roots................................................................................................................28The stem ................................................................................................................28The ear ..................................................................................................................29The floret ..............................................................................................................29
Glossary............................................................................................................30
Growth Scales for Identifying Plant Development ........................................31The Zadok’s growth scale: a decimal code ............................................................31Using the Zadok’s code ..........................................................................................31Seedling growth Z10 to Z19..................................................................................31Tillering Z20 to Z29..............................................................................................32Stem elongation Z30 to Z39 ................................................................................32Booting Z40 to Z49 ............................................................................................32Ear emergence Z50 to Z59 ..................................................................................32Anthesis (flowering) Z60 to Z69 ..........................................................................33Milk and dough development Z70 to Z89 ..........................................................33Ripening Z90 to Z99 ..........................................................................................33
THE WHEAT BOOK CHAPTER 2 – THE STRUCTURE AND DEVELOPMENT OF THE CEREAL PLANT
23
CHAPTER TWO
THE STRUCTURE ANDDEVELOPMENT OF THE
CEREAL PLANT

CHAPTER 2 – THE STRUCTURE AND DEVELOPMENT OF THE CEREAL PLANT THE WHEAT BOOK
24

Tim Setter and Peter CarltonThe structure of the wheat plant described in this
chapter is the starting point to understanding the growthand development of the crop, its nutrition and the reasonsfor particular management practices.
Like all of the temperate cereals, wheat undergoesprofound changes in structure through its life cycle. Thedelicate growing point at the shoot apex, at first producesleaves, and then later changes to form the flowering spikeor ear. The stem, at first compact and measuring a fewmillimetres, rapidly expands to a structure that may be athousand millimetres or longer.
Plant growth and development concerns the length ofthe plant's life cycle, its subdivision into distinct stages, andthe processes of formation of the plant's organs – theleaves, tillers and spikelets. How a wheat plant developsthese organs is important because it is the basis for theadaptation of cultivars to environments – it is the reasonwhy European cultivars are largely unsuited to Western
Australia, and why cultivars with differing developmentalpatterns are needed for different sowing dates and regions.
Structural and developmental patterns are alsoimportant because many decisions about nutrition andcrop management are best made on a developmental ratherthan a calendar time scale.
The major developmental processes for a cereal are:germination and seedling establishment initiation and growth of leavestilleringgrowth of the root systemear formation and growthstem extensionflowering and grain growth.The developmental processes overlap and are closely
linked so that the form and structure of the plant evolvesas the integration of many consecutive and interactingprocesses.
THE WHEAT BOOK CHAPTER 2 – THE STRUCTURE AND DEVELOPMENT OF THE CEREAL PLANT
25
THE STRUCTURE AND DEVELOPMENT OF THE CEREAL PLANT

The temperate cereals are all annual grasses. They haveevolved as humanity’s constant companions for about11,000 years commencing in the Middle East. Thisevolution to the modern high yielding cereals, from theirlower yielding wild ancestors, was critical to thedevelopment of modern society. The cereals group includeswheat (Triticum), barley (Hordeum), Oats (Avena), rye(Secale) and the man-made hybrid triticale (Triticosecale).
There are about 30 species of wheat, and more than40,000 cultivars have been produced in the world. Wheatspecies can be divided into three groups depending on thenumber of chromosomes present in vegetative wheat plantcells: diploid (14 chromosomes); tetraploid (28chromosomes); and hexaploid or bread wheats (42chromosomes). These species can cross breed in nature orby plant breeders.
Only three species of wheat are commerciallyimportant:Triticum aestivum – bread wheats or common wheats.
These hexaploid wheats are the most widely grown inthe world.
Triticum turgidum cv. durum – durum wheats. Thesetetraploid wheats are hard wheats (from Latin, durum,meaning ‘hard’), e.g. cv. Yallaroi and Wollaroi. Flourfrom these wheats holds together well due to highgluten content, so cultivars are usually used for pastaand bread products.
Triticum compactum – club wheats. These hexaploidwheats are identified by their compact, club-shapedhead, e.g. cv. Tincurrin. This species is sometimesconsidered a subspecies of common wheat. These areusually soft grained wheats often used for cake flour.Wheat and all other grasses have a common structure
which provides the basis for understanding the growth anddevelopment of the crop and the reasons for particularmanagement practices.
The grainThe grain is the unit of reproduction in cereals as well
as the economic product. Grain is the small (3-8 mmlong), dry, seed-like "fruit" of a grass, especially a cerealplant. (Note: kernel is an older term for the edible seed ofa nut or fruit, e.g. as in a kernel of corn).
Grain is considered as a one-seeded "fruit" (called acaryopsis) rather than a "seed" according to botanicaldefinition (see Glossary at the end of this Section). A seedis a mature ovule which consists of an embryo, endospermand the seed coat. However, a fruit is a mature ovary whichincludes the ovule or seed, in addition to the ovary wallthat surrounds the seed (pericarp).
In wheat, the pericarp is thin and fused with the seedcoat (Figure 2.1 insert), and this makes wheat grain a true"fruit". In other plants the pericarp may be fleshy as inberries, or hard and dry forming the pod casing of legumes.Crops with true "seeds" as the dispersal unit include lupinsand canola.
Seen in cross-section (Figure 2.1), the mainconstituents of grain are the bran coat, the embryo or youngplant, and the endosperm. In most wheat cultivars, theproportions of grain are: bran 14%, endosperm 83% andembryo 3%.
The bran coat covering the grain is made up of an outerpericarp derived from the parent plant ovary wall; a testa orseed coat derived from the ovule; and the aleurone layer,important as a source of enzymes and growth factors ingermination (Figure 2.1).
The endosperm makes up the bulk of the grain, it is theenergy for the germinating seed, and it is the store of starchand protein which is milled for production of white flour.In comparison, whole wheat flour is made up of the groundproducts of the entire grain and therefore naturally containsmore vitamins and minerals from the bran and embryo.
The embryo (Figure 2.1) consists of a short axis with aterminal growing point or shoot apex, and a single primaryroot known as the radicle. Around the growing point arethe primordia of the first three leaves.
CHAPTER 2 – THE STRUCTURE AND DEVELOPMENT OF THE CEREAL PLANT THE WHEAT BOOK
26
DESCRIPTION OF THE WHEAT PLANT
bran
endosperm
aleurone layer
testa
pericarp
scutellum
coleoptileandleaves
radicle
embryo
Figure 2.1
Structure of the wheat grain.

The shoot is enclosed in a modified leaf called thecoleoptile which serves as a protective sheath as the shootemerges through the soil. When wheat is sown, themaximum coleoptile length ranges from less than 60 mmto more than 90 mm in different cultivars. This differencewill affect the maximum sowing depth and potential foremergence of crops (see Chapter 7).
Below the shoot apex, but above the point ofattachment of the coleoptile, is the section of stem whichwill elongate to form the sub-crown internode. This tissueelongates during seed establishment so that the base of thestem (crown) forms close to the soil surface.
Between the embryo and the food reserves stored inthe endosperm is the scutellum (from Latin meaning
THE WHEAT BOOK CHAPTER 2 – THE STRUCTURE AND DEVELOPMENT OF THE CEREAL PLANT
27
DESCRIPTION OF THE WHEAT PLANT (continued)
Figure 2.2L9 (flag leaf)
L8
L6
L4
ear
blade
sheath
L2
T4T3T2T1
TC(coleoptile tiller)
coleoptile
nodal root
seminal root
seed
IC
Int321
Int4
Int5
L1
L3
L5
Int6
Int7
Int8Int9
L7
(coleoptile internode)
0 tiller budemerged tiller
L1-L9 leaves 1-9T1-T4 tillers 1-4Int1-Int9 internodes 1-9
Schematic diagram of a mature wheat plant highlighting tiller, leafand internode numbering and position (redrawn from Kirby andAppleyard, 1987).
Figure 2.3
Detailed structure of the stem and leaf of the wheat plant.
'shield'), a broad, elliptical structure which acts as thetransfer route for substances moving from the endospermto the growing embryo (Figure 2.1).
Both the scutellum and the coleoptile are tissues thathave been modified from the single cotyledon in cereals(monocots), and distinguish them from the doublecotyledons that occur in crops like lupins and peas(dicots).
The leafAbout three leaves are present as minute primordia
around the shoot apex of the embryo at germination. Aftergermination, more leaves are produced sequentially onalternate sides of the apex.
The odd-numbered leaves will be one side of the mainstem and one above the other, while the even numberedleaves will be on the opposite side of the stem. The finalleaf to develop before ear emergence is the flag leaf (Figure 2.2).
The coleoptile is numbered as zero and appears on the‘even' side of the plant (Figure 2.2).
The wheat leaf is long and narrow with two distinctparts: the basal sheath which encircles the stem of the plantand contributes to stem strength, and the leaf blade which isthe primary photosynthetic tissue of the plant (Figure 2.3).
The sheath and the blade grow from separate meristems
leaf blade
blade
sheath
internode
node
auricles
ligule
blade
peduncle
sheath
split
leafsheath

at their bases, so the oldest parts of a leaf are the tip of theblade and the top of the sheath. Where the blade andsheath join, there are structures called the ligule and theauricles (Figure 2.3).
Table 2.1 – Shoot structures to identify cereals and selected weeds (see Figure 2.3)
Grass Ligule Auricles Leaves Leaf sheath
Wheat fringed membrane yes – large clasping, with hairs usually twist splitclockwise; no hairs
Barley membrane yes – very large, without hairs twist clockwise; splitusually hairless
Oats membrane none twist anticlockwise; splitno hairs
Annual Ryegrass membrane (<2 mm) yes – large, clasping no hairs slight split
Barley grass membrane (<2 mm) yes – large, pointed soft hairs slight split
Wild oats membrane (<2 mm); none twist anti-clockwise; splithairless no hairs
CHAPTER 2 – THE STRUCTURE AND DEVELOPMENT OF THE CEREAL PLANT THE WHEAT BOOK
28
DESCRIPTION OF THE WHEAT PLANT (continued)
Characteristics of the shoot plant structures describedabove are representative for a species, and can be used toidentify crops and weeds, e.g. to distinguish between wheatand wild oats (Table 2.1).
TillersTillers are basal branches which arise from buds in the
axils of the leaves on the mainstem. Structurally, they arealmost identical to the mainstem, and are thus potentiallyable to produce an ear. Leaves on a tiller are also producedalternately, but they are at 90o to the orientation of leaveson the mainstem.
The tiller is initially enclosed in a modified leaf – theprophyll – which is similar to the coleoptile that enclosesthe mainstem during emergence.
A tiller is designated by the number of the leaf axis thatit occurs in. Hence, the tiller in the axis of Leaf 1 to themainstem is referred to as Tiller 1 (Figure 2.2).
Tillers produced from leaves on the main stem arecalled primary tillers; these in turn can form their owntillers, called sub-tillers or secondary tillers. Sometimes atiller originates in the axis of the coleoptile and this is calledthe coleoptile tiller (Figure 2.2). In long season winterwheats it is possible for sub-sub-tillers, or tertiary tillers tobe produced, although this is unusual.
Reduced tillering in new cereal cultivars is proposed bysome scientists to try and increase yield, i.e. by eliminatingstems that do not produce ears. However, tillers that havetheir own roots often produce ears.
Tillers may also contribute to grain yield as a source orsink for excess sugars and nutrients of the mainstem. Inlocations where insects, diseases or environmental stressesare common, tillers offer assurance that crop losses areminimal. The diversity of locations wheat is grown in willassure a diversity of cereal plant types for theseenvironments.
The rootsCereals possess two distinct root systems (Figure 2.2):Seminal roots which develop from primordia within thegrain. The word seminal comes from Latin seminalis,meaning ‘belonging to seed’. The crown, adventitious or nodal roots whichsubsequently develop from the nodes within the crown.As is the case for leaves and tillers, all the root axes of a
plant can be given designations to describe their position,type and time of appearance on the plant.
The growing, meristematic tissues of roots are locatedin the first 2-10 millimetres of the tip of each root. Hence,as roots grow the meristematic tips move further awayfrom the shoot deep into the soil. This contrasts with thestructures of blades and sheaths where the meristematictissue remains close to the stem and pushes older tissuesaway from the plant.
Why roots have evolved differently from leaves to havetheir growing meristematic tissue at the tip is unknown.One possibility is that this allows immediate control overroot growth in the event of environmental changes such aswater or nutrient supply. Hence this enables better controlof the direction of root growth in the diverse soil matrix.(The analogy is therefore similar to the justification forplacing a prime mover at the leading front, rather than atthe back, of a series of trailers.)
The stemThe stem of the wheat plant is made up of successive
nodes, or joints, and usually hollow internodes (Figs. 2.2
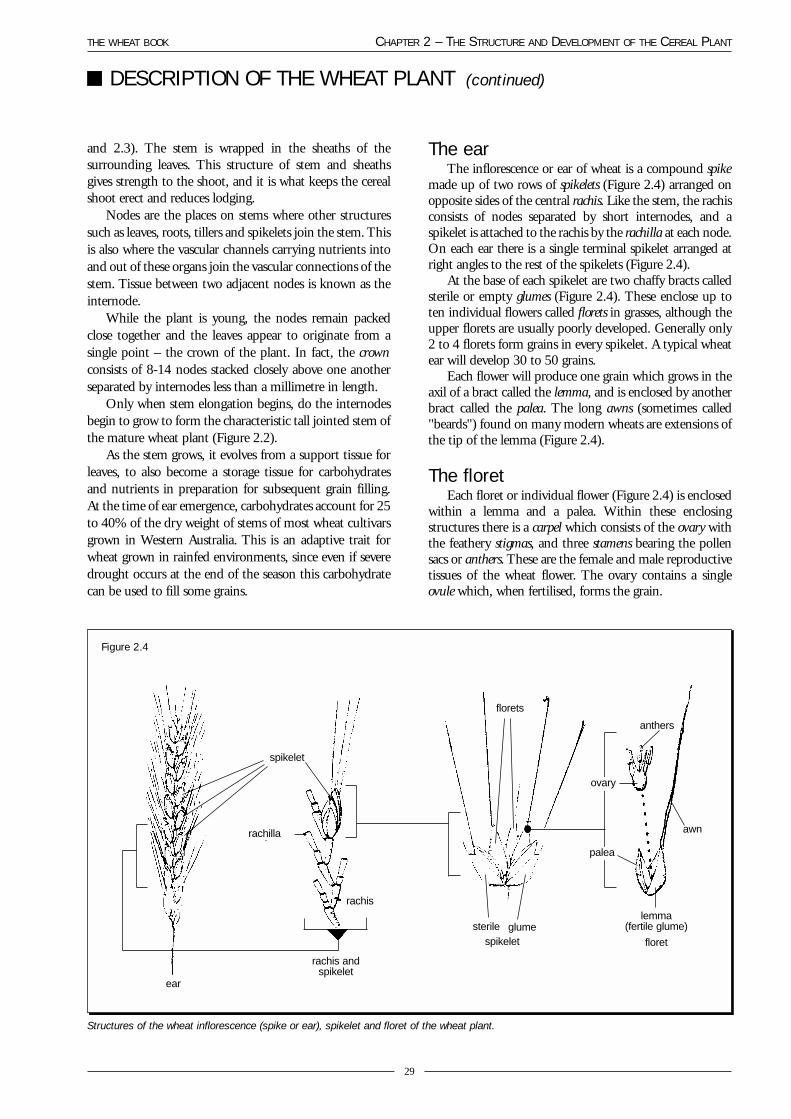
and 2.3). The stem is wrapped in the sheaths of thesurrounding leaves. This structure of stem and sheathsgives strength to the shoot, and it is what keeps the cerealshoot erect and reduces lodging.
Nodes are the places on stems where other structuressuch as leaves, roots, tillers and spikelets join the stem. Thisis also where the vascular channels carrying nutrients intoand out of these organs join the vascular connections of thestem. Tissue between two adjacent nodes is known as theinternode.
While the plant is young, the nodes remain packedclose together and the leaves appear to originate from asingle point – the crown of the plant. In fact, the crownconsists of 8-14 nodes stacked closely above one anotherseparated by internodes less than a millimetre in length.
Only when stem elongation begins, do the internodesbegin to grow to form the characteristic tall jointed stem ofthe mature wheat plant (Figure 2.2).
As the stem grows, it evolves from a support tissue forleaves, to also become a storage tissue for carbohydratesand nutrients in preparation for subsequent grain filling.At the time of ear emergence, carbohydrates account for 25to 40% of the dry weight of stems of most wheat cultivarsgrown in Western Australia. This is an adaptive trait forwheat grown in rainfed environments, since even if severedrought occurs at the end of the season this carbohydratecan be used to fill some grains.
The earThe inflorescence or ear of wheat is a compound spike
made up of two rows of spikelets (Figure 2.4) arranged onopposite sides of the central rachis. Like the stem, the rachisconsists of nodes separated by short internodes, and aspikelet is attached to the rachis by the rachilla at each node.On each ear there is a single terminal spikelet arranged atright angles to the rest of the spikelets (Figure 2.4).
At the base of each spikelet are two chaffy bracts calledsterile or empty glumes (Figure 2.4). These enclose up toten individual flowers called florets in grasses, although theupper florets are usually poorly developed. Generally only2 to 4 florets form grains in every spikelet. A typical wheatear will develop 30 to 50 grains.
Each flower will produce one grain which grows in theaxil of a bract called the lemma, and is enclosed by anotherbract called the palea. The long awns (sometimes called"beards") found on many modern wheats are extensions ofthe tip of the lemma (Figure 2.4).
The floretEach floret or individual flower (Figure 2.4) is enclosed
within a lemma and a palea. Within these enclosingstructures there is a carpel which consists of the ovary withthe feathery stigmas, and three stamens bearing the pollensacs or anthers. These are the female and male reproductivetissues of the wheat flower. The ovary contains a singleovule which, when fertilised, forms the grain.
THE WHEAT BOOK CHAPTER 2 – THE STRUCTURE AND DEVELOPMENT OF THE CEREAL PLANT
29
DESCRIPTION OF THE WHEAT PLANT (continued)
Structures of the wheat inflorescence (spike or ear), spikelet and floret of the wheat plant.
Figure 2.4
ear
spikelet
rachilla
rachis
sterile
anthers
awn
lemma(fertile glume)
floret
florets
spikeletglume
rachis andspikelet
ovary
palea
Aleurone layer. A layer of high protein cells surroundingthe storage cells of the endosperm. Its function is to secretehydrolytic enzymes to digest food reserves in theendosperm.
Auricle. A lobe at the base of a leaf; from the Latin aurismeaning "ear" (hence a lobe).
Anther. A saclike structure of the male part of a flowerin which the pollen is formed.
Anthesis. Flowering. Usually taken to mean the time atwhich pollen is shed.
Awns. A slender, often long, appendage extending fromthe tip of the lemma; occasionally referred to as the"beards" of wheat and barley.
Axil. The space between a leaf (or tiller) and the stem itis attached to. A tiller originates as a bud in the axil of a leaf.
Carpel. The female reproductive organ which in wheatconsists of an ovary and two feathery stigmas. The ovarycontains a single ovule.
Coleoptile. A sheath which protects the first leaf andshoot apex as they emerge to the surface duringgermination.
Floret. An individual flower of a cereal. Each floret hasthree anthers containing pollen and an ovary which, whenfertilised may form a grain. Up to ten florets may form ineach spikelet, but generally only 2-4 form grains.
Fruit. A mature ovary which includes the ovule (seed),in addition to the ovary wall (pericarp) that surrounds theseed.
Glumes. The outer chaffy bracts that enclose the wheatspikelet.
Internode. The stem tissue between any two nodes. Incereals, the elongation of these tissues is responsible forstem elongation and ear excertion.
Lemma. One of the thin bracts of a grass floretenclosing the caryopsis that is located on the side nearestthe embryo and opposite the rachilla (see also palea)
Ligule. A membranous or hairy lobe on the innersurface of a leaf marking the join between the leaf bladeand sheath.
Meristem. The localised region of active cell division,usually 2-10 millimetres long in cereal tissues. Meristemsinclude those of the shoot and root (apical meristems), thebases of internodes (intercalary meristems), and the tillerbuds (axillary meristems).
Node. The part of the stem from which a leaf or rootmay arise
Nodal roots. Also known as crown, coronal, oradventitious roots. Nodal roots are formed in associationwith the growth of leaves and tillers (see seminal roots)
Ovary. The part of the female part of the flowercontaining the ovule.
Ovule. The structure within the ovary of the flower thatbecomes the seed following fertilisation and development.
Palea. One of the thin bracts of a grass floret enclosingthe caryopsis that is located on the side opposite theembryo
Pericarp. The ovary wall. It may be thin and fused withthe seedcoat as in wheat, fleshy as in berries, or hard anddry as in pods of lupins.
Primary tiller. Tillers produced from leaf axis on themainstem.
Primordium(-a). Organs in their earliest stage ofdevelopment; as a leaf primordium.
Prophyll. A modified leaf that initially encloses the tiller;this tissue is similar to the coleoptile function in protectingthe shoot during emergence.
Rachis. The main axis of a grass flower; in wheat,providing the attachment of many spikelets to thepeduncle.
Rachilla. The secondary axis of a grass flower; in wheat,providing the attachment of a single spikelet to the rachis.
Radicle. The rudimentary root of a seed or seedling thatforms the primary root of the young plant.
Scutellum. A flat, plate-like structure between theembryo and the endosperm of the grain. It is often viewedas a highly modified cotyledon in monocotyledons. Itreleases hormones which initiate germination and is thepathway for nutrients fed from the endosperm to thegrowing seedling.
Secondary tillers. Tillers produced from tiller axis withthe mainstem.
Seed. A mature ovule consisting of the embryo,endosperm and seed coat (testa).
Sheath. The enclosing structure of the base of the leafaround the stem; in cereals, the leaf tissue connecting theblade to the stem node.
Shoot apex. The active growing point of a shoot.Consists of a dome of actively dividing cells which formthe new structures such as leaves and spikelets
Seminal roots. The roots that arise from the seed; fromthe Latin seminalis, "belonging to the seed" (cf. nodalroots).
Spike. A basic type of inflorescence in which the flowersarise along a rachis and are essentially sessile (stalkless).
Spikelet. The structural unit of a grass flower thatincludes two basal glumes including one to several florets.
Stamen. The organ of the flower producing pollen. Itconsists of a filament bearing a terminal anther whichcontains the pollen grains
Stigma. The part of the carpel receptive to pollen.Style. The stalk between the stigma and the ovary. Sub-crown internode. The internode between the
seminal roots and the crown of the plant. It elongatesduring seedling establishment to ensure that the crown isformed close to, but below the soil surface.
Testa. The outer covering of the seed; the seedcoat.
CHAPTER 2 – THE STRUCTURE AND DEVELOPMENT OF THE CEREAL PLANT THE WHEAT BOOK
30
GLOSSARY

Growth scales are means of quantifying the growthstage of a crop in a standardised way and are useful when:
There is a need to identify a particular growth stage forthe safe application of a herbicide or fungicide. Anexample is the use of phenoxy herbicides whereapplication too early or too late may damage the crop.Communicating the growth stage of a crop to advisersor research services when seeking advice on thedevelopment of diseases or nutrient deficiencies.Sampling plant tissues for nutrient analysis.The Decimal code or Zadok’s growth scale is a 0-99
scale of development that is recognised internationally forresearch, advisory work and farm practice. It is now usedthroughout Australia, particularly for application ofchemicals or fertilizers. The Zadok’s scale is thereforedescribed in detail in this section.
The Zadok’s growth scale: a decimal code
The Zadok’s growth scale is based on ten principalgrowth stages listed in Table 2.2.
Table 2.2 – The ten principal decimal codes (see Table 2.3 for details).
0 Germination1 Seedling growth2 Tillering3 Stem elongation4 Booting5 Ear emergence6 Flowering7 Milk development8 Dough development9 Ripening
Each scale comprises two digits, the first indicating thegrowth stage, e.g. 1 or 2, and the second, the number ofplant parts (leaves or tillers) or secondary stages ofdevelopment. This extends the scale from 00 to 99. Forexample, a Z13 indicates a seedling with three leaves.
The full decimal codes are reproduced in Table 2.3.However, in practical application, the most importantstages are Seedling Growth (1), Tillering (2) and StemElongation (3) which span the time when most problemsarise and most management decisions must be made.
Using the Zadok’s codeLike all growth scales, the decimal code includes certain
conventions and requires some practice. The scale is basedon observations of individual plants rather than the generalappearance of the crop. Therefore, it is essential to obtain arepresentative sample of plants from the crop.
Because leaf production, tillering and even stemextension may be occurring together, a number of differentdecimal codes can be applied to the same plant. This mayappear confusing at first, but only represents what ishappening in the crop. For the purposes of reporting thegrowth stage, only the most advanced decimal code needbe used.
A general description of the principle decimal code isgiven in the Sections below, and complete details are givenin Table 2.3.
Seedling growth Z10 to Z19After the crop emerges, the decimal codes are
determined by counting leaves (Table 2.3). There are someimportant rules:
Leaves are numbered from the bottom of the plant, i.e.the first, oldest leaf upward (Figure 2.2)
THE WHEAT BOOK CHAPTER 2 – THE STRUCTURE AND DEVELOPMENT OF THE CEREAL PLANT
31
GROWTH SCALES FOR IDENTIFYING PLANT DEVELOPMENT
Zadok codes for seedlings at different stages of leaf emergence (from AGWEST and 3 Tonne Club).
Figure 2.5
(a) Z13.2 (b) Z13.4 (c) Z13.7
L3 L3 L3
2/10=.2
4/10=.4
7/10=.7
10/10FULLLEAF
L1 L1
L1
L2L2
L2

Only leaves arising on the mainstem are counted andcare must be taken to exclude tillers and their leaves.A leaf can be described as unfolded or fully emergedwhen its ligule has emerged from the sheath of thepreceding leaf.A further subdivision is possible by scoring the
youngest emerging leaf in tenths, judging its size relative tothe preceding leaf. Thus Zadok codes of Z13.2, Z13.4 andZ13.7 describe seedlings with three fully emerged leavesplus a fourth leaf which is 0.2, 0.4 and 0.7 of the length ofthe third leaf respectively (see Figure 2.5a,b,c). Similarly,Z13.9 describes a seedling very close to having 4 fully-emerged leaves.
Common Western Australian wheat cultivars formbetween 8 and 14 leaves on the main stem. However,because older leaves die and the growth of tillers makes leafcounting difficult, it is seldom possible to ascertain the leafnumber beyond Z16, i.e. the 6-leaf stage.
Tillering Z20 to Z29The first tiller usually appears between the 3- and 4-leaf
stage Z13-Z14. Tillers should be counted when theyemerge from the sheath of the subtending leaf.
The important rules for counting tillers are:Count only tillers, not the mainstemCount a tiller only when it emerges from the sheath ofthe subtending leaf.Tillering is not a good guide to the development stage
of the plant because it is very dependent upon the nutritionand density of the crop.
To best indicate leaf plus tillering development, Zadokcodes may be combined. For example, a plant with 3 leavesfully emerged and the 4th leaf at 0.3 (Z13.3) which is alsotillering (code 2) with one (1) tiller is represented by thecombined code Z13.3/21 (See Figure 2.6a). Otherexamples of plants with 4-5 leaves and 2-4 tillers areexemplified in Figure 2.6b,c.
Stem elongation Z30 to Z39Stem elongation occurs by growth of the internodes of
the stem. When elongation starts, an internode in themiddle of the crown grows to a length of 1-2 cm and thenode above it swells and hardens to form the first joint ofthe stem. Stem elongation is easily detected by splitting thestem with a sharp knife and identifying the nodes asobstructions to the cavity of the hollow stem.
Z30 equates with 'ear at 1 cm'. This code is widely usedto signify that the plant is about to enter the phase of rapidstem elongation. This is a key stage for the crop becausethis is the time of most rapid growth and nutrient uptake.
Rules of scoring stem elongation are:'Ear at 1 cm' (Z30) occurs when the length of the stemreaches 1 cm. The stem length is measured by splittingopen the shoot and measuring the distance betweenwhere the lowest leaves are attached and the tip of theear.'First node detectable' (Z31) occurs when an internodeof 1 cm or more is present.
Booting Z40 to Z49Booting stages describe the appearance of the upper
portion of the stem at the flag leaf sheath. The flag leaf isthe last leaf to develop on a cereal plant and it is located justbelow the ear. As the ear enlarges and moves upwardthrough the shoot, the flag leaf sheath appears swollen andis called the boot (Plate 2.1(a)).
Ear emergence Z50 to Z59Stages 50 to 59 describe the emergence of the ear
from the boot. For example, Z55 means that half of theear has emerged from the sheath and is above the ligule ofthe flag leaf. At Z59 the ear has fully emerged (Plate2.1(b)).
CHAPTER 2 – THE STRUCTURE AND DEVELOPMENT OF THE CEREAL PLANT THE WHEAT BOOK
32
GROWTH SCALES FOR IDENTIFYING PLANT DEVELOPMENT(continued)
Zadok codes for plants at different stages of leaf and tiller emergence (from AGWEST and 3 Tonne Club).
Figure 2.6
(a) Z13.3/21 (b)Z14.7/22
L2
L2
L2
L4
L3
L3
L1
L1
L1
L
L
T1
T1
T1
T2T2
T4
T3
L5
(c) Z15.8/24

Anthesis (flowering) Z60 to Z69Anthesis means the opening of the floret or grass
flower. Florets usually open in the early morning andremain open for only a short time. Wheat is self-fertilising, and the anthers or pollen sacs within eachfloret usually shed their pollen and fertilise the ovaryshortly before anthesis.
Anthesis is usually scored when anthers are seenhanging from the spikelet (Plate 2.1(c)). These appearfirst in the middle of the ear and spread toward the topand base. In very dry conditions, stem extension isrestricted and anthesis may occur as the ears areemerging, or even within the boot.
Milk and dough development Z70to Z89
Stages 70 to 89 describe grain development. Thestages are scored by subjective assessment of the amountof solids in the grain "milk", and subsequently thestiffness of the grain "dough".
Grain growth for 7 to 14 days after fertilisation ismainly growth of the ovary wall and the formation of thecells of the endosperm which will later be filled withstarch. This early development is scored as 'Kernel
watery ripe' Z71 (Plate 2.2a). Then starch starts to bedeposited in the kernel and the ratio of solids to liquidsdetermines the early (Plate 2.2b), medium (Plate 2.2c)and late milk stages.
Dough development (Z80 to Z89) follows when noliquid remains in the grain. At this time, the grainproceeds through stages of early, soft (Plate 2.2d) andhard dough (Plate 2.2e)
Ripening Z90 to Z99Grain physiological maturity, the point where there is
no further deposition of materials in the grain, occurs atabout the hard dough stage. At this stage the grain haslost its green chlorophyll colour and turned brown. Thegrain still has a high moisture content and depending onweather conditions, it may be several days or severalweeks until the grain is ready for machine harvest – Z93(Plates 2.1d and 2.2f ).
THE WHEAT BOOK CHAPTER 2 – THE STRUCTURE AND DEVELOPMENT OF THE CEREAL PLANT
33
GROWTH SCALES FOR IDENTIFYING PLANT DEVELOPMENT(continued)
(a) A booting wheat plant (Z49and Z45 respectively). Noteswollen top of stem due toemerging ear.
(b) Complete earemergence(Z59).
(c) Anthesis(flowering; Z65).
(d) Ripening (Z93).
Plate 2.1
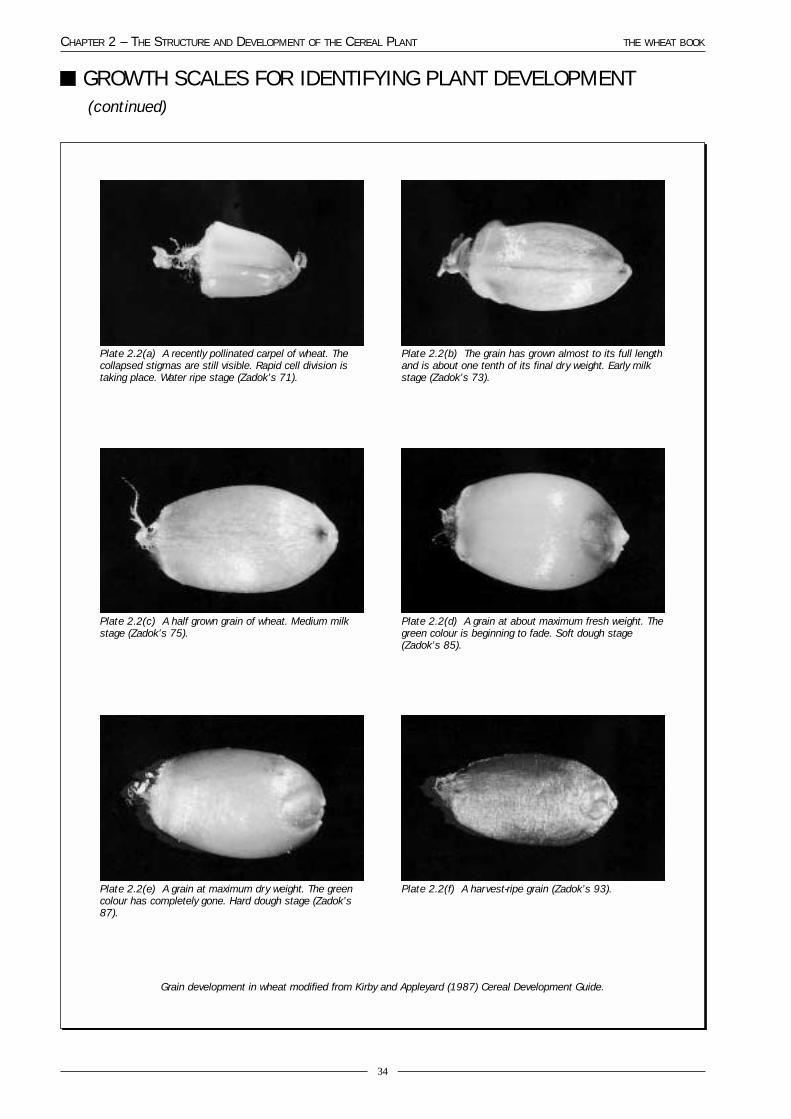
CHAPTER 2 – THE STRUCTURE AND DEVELOPMENT OF THE CEREAL PLANT THE WHEAT BOOK
34
GROWTH SCALES FOR IDENTIFYING PLANT DEVELOPMENT(continued)
Plate 2.2(a) A recently pollinated carpel of wheat. Thecollapsed stigmas are still visible. Rapid cell division istaking place. Water ripe stage (Zadok’s 71).
Plate 2.2(b) The grain has grown almost to its full lengthand is about one tenth of its final dry weight. Early milkstage (Zadok’s 73).
Plate 2.2(c) A half grown grain of wheat. Medium milkstage (Zadok’s 75).
Plate 2.2(d) A grain at about maximum fresh weight. Thegreen colour is beginning to fade. Soft dough stage(Zadok’s 85).
Plate 2.2(e) A grain at maximum dry weight. The greencolour has completely gone. Hard dough stage (Zadok’s87).
Plate 2.2(f) A harvest-ripe grain (Zadok’s 93).
Grain development in wheat modified from Kirby and Appleyard (1987) Cereal Development Guide.

0 Germination00: Dry seed01: Start of water absorption03: Seed fully swollen05: First root emerged from seed07: Coleoptile emerged from seed09: First green leaf just at tip of coleoptile
1 Seedling GrowthCount leaves on mainstem only. Fully emerged =ligule visible. Sub-divide the score by rating theemergence of the youngest leaf in tenths. Forexample, 12.4 = two emerged leaves plus theyoungest leaf at 4/10 emerged.10: First leaf through coleoptile11: First leaf emerged12: 2 leaves emerged13: 3 leaves emerged14: 4 leaves emerged15: 5 leaves emerged16: 6 leaves emerged17: 7 leaves emerged18: 8 leaves emerged19: 9 leaves emerged
2 TilleringCount visible tillers on mainstem; i.e. number of sideshoots with a leaf blade emerging between a leafsheath and the mainstem.20: Mainstem only21: Mainstem and 1 tiller22: Mainstem and 2 tillers23: Mainstem and 3 tillers24: Mainstem and 4 tillers25: Mainstem and 5 tillers26: Mainstem and 6 tillers27: Mainstem and 7 tillers28: Mainstem and 8 tillers29: Mainstem and 9 or more tillers
3 Stem elongationGenerally count swollen nodes that can be felt on themainstem. Report if dissection is used.30: Youngest leaf sheath erect31: First node detectable32: Second node detectable33: Third node detectable34: Fourth node detectable35: Fifth node detectable36: Sixth node detectable37: Flag leaf just visible39: Flag leaf ligule just visible
4 BootingScore the appearance of the sheath of the flag leaf.41: Flag leaf sheath extending43: Boots just visible swollen45: Boots swollen47: Flag leaf sheath opening49: First awns visible
5 Ear emergence from boot51: Tip of ear just visible53: Ear 1/4 emerged55: Ear 1/2 emerged57: Ear 3/4 emerged59: Ear emergence complete
6 Anthesis (flowering)Generally scored by noting the presence of emergedanthers.61: Beginning of anthesis (few anthers at middle of
ear)65: Anthesis half-way (anthers occurring half way to
tip and base of ear)69: Anthesis complete
7 Milk developmentScore starch development in the watery kernel.71: Kernel water ripe (no starch)73: Early milk75: Medium milk77: Late milk
8 Dough developmentKernel no longer watery but still soft and dough-like83: Early dough85: Soft dough87: Hard dough
9 Ripening91: Grain hard, difficult to divide92: Grain hard, not dented by thumbnail93: Grain loosening in daytime94: Over-ripe straw dead and collapsing95: Seed dormant96: Viable seed giving 50% germination97: Seed not dormant98: Secondary dormancy induced99: Secondary dormancy lost
THE WHEAT BOOK CHAPTER 2 – THE STRUCTURE AND DEVELOPMENT OF THE CEREAL PLANT
35
GROWTH SCALES FOR IDENTIFYING PLANT DEVELOPMENT(continued)
Table 2.3 – The complete Zadok’s growth scale and how to apply.

CHAPTER 2 – THE STRUCTURE AND DEVELOPMENT OF THE CEREAL PLANT THE WHEAT BOOK
36

Chapter Coordinator: T.L. SetterWheatbook 1 authors: D. Tennant, K.H.M. Siddique and M.W. PerryRevised by: T.L. Setter and G. Carlton
Germination and Emergence ..........................................................................39Germination ..........................................................................................................39Emergence..............................................................................................................39
Vegetative Growth ............................................................................................41Formation and emergence of leaves ......................................................................41Tillering..................................................................................................................42Light interception ..................................................................................................42Seminal roots..........................................................................................................43Nodal roots ............................................................................................................43Root growth ..........................................................................................................43Shoot and root dry matter production ..................................................................44
Reproductive growth and grain filling ............................................................45Ear initiation ..........................................................................................................45Stem elongation ....................................................................................................46Floret formation ....................................................................................................47Anthesis ..................................................................................................................47Grain growth..........................................................................................................47Harvest index ........................................................................................................48Yield components ..................................................................................................48Determination of yield components ......................................................................48Relationship between yield components and grain yield ......................................50Yield component compensation ............................................................................50Estimating grain yield from yield components ......................................................50
Environmental control of wheat growth and development ............................51Temperature ..........................................................................................................51Photoperiod............................................................................................................51Vernalisation ..........................................................................................................51Basic vegetative period ..........................................................................................51Cultivar adaptation ................................................................................................52Development in Australian cultivars ......................................................................52
THE WHEAT BOOK CHAPTER 3 – GERMINATION, VEGETATIVE AND REPRODUCTIVE GROWTH
37
CHAPTER THREE
GERMINATION, VEGETATIVEAND
REPRODUCTIVE GROWTH

CHAPTER 3 – GERMINATION, VEGETATIVE AND REPRODUCTIVE GROWTH THE WHEAT BOOK
38

Tim Setter and Peter CarltonThe life cycle of the wheat plant is divided in this
chapter into stages of germination, vegetative growth, andreproductive growth. Descriptions of these stages will involvefrequent reference to structural features described previouslyin Chapter 2.
Germination and emergence are particularlyimportant stages in the life cycle of the wheat plant. It isduring these stages that the plant is most vulnerable topests and environmental hazards such as waterlogging;and to management-induced problems such as depth ofsowing, fertiliser toxicities and poor contact betweenseed and soil.
The primary aim of soil management and seedingpractices should be to obtain uniform germination andrapid seedling emergence and establishment.
GerminationGermination is defined many ways and may include
a wide range of seed and plant growth stages. Somedefinitions relate germination to the first emergence ofthe coleorhiza or primary root from the seed as itbreaks through the pericarp. Other definitions, e.g. bythe International Seed Testing Association (ISTA), statethat germination must involve the completedevelopment of a healthy seedling with all of theessential structures of a shoot and roots. For thischapter we will define germination as the former, whereprimary shoot and root tissues have just emergedthrough the seed coat following imbibition.
Moisture, suitable temperatures and adequateoxygen supply are all essential for germination of nondormant seeds. The dry seed first imbibes water andthis is the trigger for both the biochemical andphysical processes of germination. Water absorptionduring imbibition is purely a physical process, sinceeven dead seeds can absorb water and swell duringimbibition.
Fresh, mature wheat grains usually develop aninnate dormancy which prevents germination in the earif adverse weather conditions, such as high rainfall,occur before harvest. However, this dormancydisappears after a few weeks storage under dryconditions. Wheat cultivars differ in the degree ofdormancy, and in some grasses (wild oats and someother grassy weeds), dormancy may preventgermination for years. When wheat seed is freshlyharvested, dormancy may be broken by severalmethods, e.g. germination for the first 3 days at about9oC, followed by germination at 20-25oC.
The minimum water content of seed for germinationis about 35 to 40%. The minimum, optimum, andmaximum temperatures for wheat germination are 3.5o-5.5o, 20o-25o and 35oC respectively.
An adequate supply of oxygen is also essential forgermination of wheat. Oxygen is required to enablerespiration of substrates in the endosperm to enableplant growth, development and survival. For wheat, theoxygen requirements for germination are usually met ina well drained soil due to rapid exchange of gases in soilwith the atmosphere. However, when waterlogging orsoil compaction occurs, oxygen supply may becomelimited. Most wheat cultivars grown in WesternAustralia have 50% death of seeds when they aregerminated in waterlogged soil for 4 days. This seeddeath is due largely to limited oxygen supply, becausegases diffuse 10,000 times more slowly in water than inair.
The processes of germination are complex, and theyinvolve the release of hormones by the embryo, thestimulation of enzyme synthesis in the aleurone layer, thedegradation of starch to sugars and their transfer throughthe scutellum to the growing embryo.
Physical swelling of the grain and rupture of the seedcoat are the first outward signs of germination. Thecoleorhiza (a protective sheath of the radicle; c/f.coleoptile) and subsequently the primary seminal rootare the first structures to appear from the base of theembryo and these are quickly followed by one or twopairs of lateral seminal roots.
As the first pair of seminal roots appear, the shoot,enclosed in the coleoptile, ruptures through the seedcoat. The growing point and its attached leaves arepushed upward through the soil by elongation of aninternode between the coleoptile and the growing point(Figure 3.1). Elongation of this internode ceases whenthe growing point is 1-2 cm below the ground surface,and the node associated with the first foliage leafbecomes the first node of the crown.
The variable elongation of this 'sub-crown internode'allows the crown of the plant to establish just below thesoil surface no matter at what depth the grain is sown.This is important because the crown is the point offormation of the leaves and tillers which wouldotherwise have to emerge from whatever depth the seedis sown.
Seeds sown very deeply can show elongation of boththe sub-crown internode, and the internode between thefirst and second foliage leaves, in order to bring thecrown of the plant close to the soil surface.
EmergenceGrowth of the coleoptile ceases as it reaches the
surface and the tip of the first leaf appears through thepore at the tip. In addition to its protective role, thecoleoptile also directs the shoot vertically upward. Verydeep sowing (and the herbicide trifluralin) restrict thelength of the coleoptile allowing the leaf to appear fromthe pore while still below the surface.
THE WHEAT BOOK CHAPTER 3 – GERMINATION, VEGETATIVE AND REPRODUCTIVE GROWTH
39
GERMINATION AND EMERGENCE

Cultivars differ in coleoptile lengths. Semi-dwarfwheats, in addition to shorter stems, usually also haveshorter coleoptiles than the tall wheats grown in the past;and for this reason are more likely to emerge poorly ifsown too deeply.
Cultivars with short coleoptiles (less than 60 mm)like Cascades, Eradu and Tammin, will take longer toemerge if sown deeply, and they may fail to emerge ifsown at depth greater than their coleoptile length.Cultivars like Cadoux, Halberd and Westonia have longcoleoptile lengths up to 90 mm.
Sowing depth is the key management practice inensuring uniform, rapid emergence and seedlingestablishment. The seedling has the capacity toestablish from as deeply as 15 cm, but field trialsshow that sowing below 6 cm generally reduces grainyield.
Depth of sowing is particularly important because:(i) deeper seed placement delays emergence –
equivalent to sowing later, and(ii) seedlings emerging from greater depth are
weaker and tiller poorly.
CHAPTER 3 – GERMINATION, VEGETATIVE AND REPRODUCTIVE GROWTH THE WHEAT BOOK
40
GERMINATION AND EMERGENCE (continued)
Figure 3.1
How wheat germinates and the seedlings establish (continued in Figure 3.7)

Germination and emergence is followed by thevegetative phase of the plant's life cycle. The plant isdeveloping the structures and beginning to gather thenutrients that will support it during the remainder of thelife cycle. The first formed leaves emerge, new leaves arestill being formed on the shoot apex, tillering iscommencing, and the plant's root systems are beginning toexplore the soil.
Formation and emergence of leavesWithin the seed, the embryo already has three leaf
primordia present, and upon germination the apex isactivated and a series of new leaf primordia are formed.
Each primordium forms on the flank of the apex ascrescent-shaped ridges and spreads laterally to encirclethe apex. This encirclement occurs within the limitingconfines of the preceding leaf primordium, and growthof the leaf is essentially upward, parallel with the axis ofthe plant.
As few as five, or as many as 20 leaves may be formedby the shoot apex before it forms the ear, but because therate of leaf formation is more rapid than the rate atwhich mature leaves appear, immature leaves accumulatearound the apex developing within the shoot. Therefore,although leaf initiation ceases when the ear is initiated,leaves continue to emerge from the shoot until shortlybefore flowering.
Rate of leaf emergenceLeaf emergence is the key to understanding and
predicting the development of the cereal plant because leafemergence is closely coordinated with growth anddevelopment changes that are often difficult to see withinthe plant. Equally important, leaves emerge at a rate set byambient temperature, and by predicting leaf number it ispossible to predict the developmental stage of a cultivar.
The rate at which leaves appear depends on the dailytemperature. Thus when the weather is cold, leaves appearslowly, and leaf appearance is more rapid when the weather
is warm. However, when leaf appearance is measured inthermal time1 – accumulated day degrees (oCd) – there is alinear relationship between leaf number and accumulatedthermal time. An example of calculating thermal time inoCd is given in Table 3.1, and the relationship of leafemergence to thermal time can be seen in Figure 3.2.
The slope of this relationship is the rate of leafemergence expressed as "leaves per day degree". There is aconstant thermal time between the emergence of one leafand the emergence of the next, and this interval is termedthe 'phyllochron'.
Wheat crops sown in early June have a phyllochron ofabout 100 oCd, equivalent to a rate of leaf emergence ofabout 0.01 leaves per oCd. If the daily mean temperature issay 10oC, a leaf will thus take 10 days to emerge. At a meantemperature of 12.5oC, only eight days will be needed (100oCd divided by 12.5oC = 8 days).
Although the rate of leaf emergence is constant forgiven cultivars and sowing time, it varies systematicallywith sowing date. The reason for this is unknown. Onesuggestion is that the rate is set when the crop emerges andthe first leaf is exposed to daylight. Another suggestion isthat the rate at which day length is changing is theenvironmental cue that sets the rate of leaf emergence; andalthough it cannot account for all observations it has
THE WHEAT BOOK CHAPTER 3 – GERMINATION, VEGETATIVE AND REPRODUCTIVE GROWTH
41
VEGETATIVE GROWTH
1Thermal timeAccumulated temperature or ‘thermal time’ is calculate as the mean daily temperature minus a base temperature. The base temperature is usually taken to be 0oC..The thermal time is then calculated as: [(maximum oC + minimum oC) /z] for each day, then summed for all the days involved.
Figure 3.2
Leaf emergence expressed in terms of thermal time.
Table 3.1 – Example of how to calculate thermal time (oCd). In this example, 89.9 oCd or heat units were accumulatedduring the week, almost enough to allow the appearance of one leaf (about 100oCd).
Date Minimum Maximum Mean Accumulated 1.c.(d)
11 June (sowing) 5.6 16.2 10.9 10.912 June 7.2 18.5 12.8 23.713 June 6.7 17.9 12.3 36.014 June 11.9 15.6 13.8 49.815 June 10.6 16.4 13.5 63.316 June 8.5 17.9 13.3 76.617 June 7.1 19.3 13.2 89.8

proven useful in developing equations to predict the rate ofleaf emergence.
For very early or very late sown crops, the rate ofchange in daylength at the time of emergence will besignificant and will lead to a lower (for early crops) orgreater (for late sown crops) rate of leaf emergence.
For practical purposes, the rate of leaf emergence fornormal commercial crops will be about 0.01 leaves peroCd; equivalent to a phyllochron interval of 100 oCd perleaf.
TilleringTillers arise from buds formed in the axils of the leaves.
Structurally they are identical to the mainstem of the plant,and when a tiller first appears it is enclosed in a modifiedleaf – the prophyll – similar to the coleoptile whichenclosed the mainstem as it emerged from the seed.
Tillers are produced in strict sequence and each has anarrow "window" of developmental time in which it canappear. The tiller at a given leaf will appear between 2.5and 3 phyllochrons after that leaf has appeared. Thus thefirst tiller (T1) will appear when the mainstem of the wheatplant has about 2.7 leaves; the second tiller (T2) willappear when the plant has about 3.7 leaves, and so on.
Leaf production on tillers occurs at the same rate (i.e.with the same phyllocron interval) as the mainstem,provided the plant is not under stress.
Tillers are identified by numbers describing theirposition on the plant. Thus the first tiller, appearing fromthe axil of leaf 1, is called T1; the tiller appearing from theaxil of leaf 2 is T2, etc. Sub-tillers follow the same scheme,and a tiller appearing from the axil of the first leaf of T1would be called T11. The coleoptile tiller is T0, and thetiller arising from the prophyll of T1 would be T10.
Production and growth of tillers is very sensitive toenvironmental and nutritional stress. Stress delays tilleremergence, and slows growth of the tillers. If stress issevere, a tiller may 'miss' its allotted developmental'window' and will then never appear. The positions andsize of tillers therefore form a record of the history ofstress experienced by the plant.
Tiller survivalIn most wheat crops, the plant produces "non
productive tillers" which do not form ears and grain.Many research programs aim to reduce these nonproductive tillers to try and increase yields of newcultivars. However, non productive tillers may act asreserves for nutrients and carbohydrates. They may alsoenable recovery if the productive tillers are damaged ordestroyed during crop growth.
Tiller production depends on cultivar, andenvironmental conditions, but tillers are produced until
about the start of stem elongation, when tiller numbersreach a maximum. Tiller numbers then decline untilanthesis, thereafter remaining more or less constant untilharvest.
Light interceptionUntil the first two leaves are unfolded, plant growth
depends mainly on the stored food in the endosperm ofthe grain. After that, the crop depends entirely on thecapture of solar radiation by the leaves and other greentissues to fuel the process of photosynthesis.
Leaves are the primary organs for radiationinterception, and the growth rates of crops are closelyrelated to the amount of solar radiation captured by theleaves. Growth is determined by both the area of leaf aswell as leaf shape, inclination and arrangement in thecanopy of the crop.
Leaf area is measured as the leaf area index (LAI), thisis the ratio of the area of leaf to the land area. Forexample, a crop with an LAI of 1.5 has 1.5 square metresof leaf for each square metre of ground. LAIdevelopment for a typical wheat crop in the easternwheatbelt is illustrated in Figure 3.3.
Initially, LAI increases only slowly in the cool winter,then increases rapidly to a maximum at about earemergence. The leaves of cereals have only a limited lifeand lower leaves senesce and die as they are shaded bythe leaves in the canopy above. Usually only the 3 to 4youngest leaves on a stem are green and active.
Leaf orientation and display are important for theefficient capture of radiation. While a LAI of 1.0 couldtheoretically intercept all radiation (if the leaf was laidflat on the ground), LAI must reach at least 3 beforenearly all radiation is intercepted and the rate of growthbecomes limited by light. This seldom occurs for verylong in Western Australia.
CHAPTER 3 – GERMINATION, VEGETATIVE AND REPRODUCTIVE GROWTH THE WHEAT BOOK
42
VEGETATIVE GROWTH (continued)
[(Maximum oC + Minimum oC)/2] for each day, then summed for all the days involved.
Figure 3.3
Leaf area index of a wheat crop grown at Merredin, WA.

Seminal rootsThe first root to appear during germination is the
radicle which emerges through the root-sheath(coleorhiza). This is followed shortly by a pair ofseminal roots. These three roots, plus a second pairof seminal roots, grow rapidly probably because oftheir well developed vascular connections to thescutellum.
In poorly developed seeds, one or both of the secondpair of seminal roots may be absent, whilst in welldeveloped seeds a sixth root may appear at this scutellarnode.
Thus, a minimum of three and a maximum of sixseminal roots can appear from the seed. These roots are fine(0.5 mm diameter), and fibrous by comparison with thenodal roots.
Nodal rootsThe first nodal roots can appear as a pair of roots at the
coleoptile node, and as such are often confused withseminal roots.
The first true 'crown' roots appear as a pair of roots onopposite sides of the stem at the level of the first leaf node,and emerge about three phyllocrons after the leaf hasemerged. Thereafter, each main stem node up to node 4 or5 produces a pair of nodal roots.
Tillers also produce nodal roots, with a single rootappearing at 90o to the main stem roots about twophyllocrons after emergence of the tiller, plus a pair of rootsanother phyllocron later. Pairs of nodal roots then appearon successive nodes at the same rate as leaves emerge.
There are thus strong connections between thenumbers of leaves, tillers and nodal roots on a plant, withalmost twice as many root axes as leaves (Figure 3.4).
The growth of nodal axes depends on the health of theplant, and environmental conditions, particularly soilmoisture and fertility.
Many of these roots appear in spring when the soil atthe surface is starting to dry rapidly, and above the depth
THE WHEAT BOOK CHAPTER 3 – GERMINATION, VEGETATIVE AND REPRODUCTIVE GROWTH
43
VEGETATIVE GROWTH (continued)
Figure 3.4
Relationship between the number of roots and the number ofleaves on the wheat plant.
Figure 3.5
Effect of soil strength on wheat root distribution on a deep yellowsand at Wongan Hills, WA. Agrowplow plots, tilled to 30cm, hadlower soil strength and more roots at depth than direct drilling (DDC).
of placed fertiliser; their growth into drying soil is oftenslow, and many axes are ineffective in taking up water andnutrients.
As tiller survival is linked to the functioning of some ofthese late formed roots, it is clear that late planted cropswill have less chance of either producing (see Tillering,above) or maintaining tillers.
Nodal roots are typically thicker ( >1 mm) and fleshierthan seminal roots, although this distinction becomes lessobvious below the surface layers of the soil profile.
Root growthRoots elongate by division and expansion of cells in a
meristem at the tip of each root; and the rate of growthdepends on temperature, and the resistance imposed by thesoil. The resistance of the soil to root penetration dependson the soil texture, soil moisture content, and the amountof cultivation.
In southern Australia root growth rates are 1.0 to 1.5cm per day; thus the seminal roots of wheat can reach atleast 150 cm by anthesis, and even deeper by the time ofphysiological maturity.
In the early stages of growth, root weight is equivalent toshoot (above ground) weight; but by anthesis, root weightaccounts for only about one third of total plant weight.
Roots start to branch (first order) about twophyllochrons after the root has appeared. The first orderbranches develop branches (second order) a further twophyllocrons later, and a third order of branching candevelop on the oldest seminal roots.
This pattern of elongation and branching means that aconsiderable length of root can develop on each plant: atypical value for cereals in Western Australia is 4.0 km perm2 of ground surface.
Root lengths are often expressed as a root lengthdensity (cm of root per cubic cm of soil), and typicalvalues for wheat in Western Australia range from 5cm/cm3 in the first 10 cm of the soil profile to less than0.1 cm/cm3 at 100 cm depth.

In Western Australia, maximum crop growth rates of160 to 180 kg/ha per day occur during the life cycle, beforethese rates decline due to leaf senesce during grain filling.In countries where radiation and temperature are moreideal, cereal crop growth rates can be more than 2 timesthese values.
Root dry matterPlants must grow extensive root systems to explore the
soil profile and collect water and nutrients. Usually moredry matter is allocated to roots than shoots in the earlygrowth stages. For Kulin, in an experiment at Merredin,65% of the total plant dry matter was found in the roots at34 days after sowing, but only 35% occurred in roots atanthesis (Table 3.2).
The total amount of dry matter in the roots issubstantial. In terms of returning organic matter to the soil,the root dry matter may equal the contribution of strawretained after harvest.
Patterns of root distribution of wheat establishedeither by direct drilling, or after deep ripping are shownin Figure 3.5. Where soil resistance is high after directdrilling, roots are more abundant near to the soil surface;whereas after ripping, there are more roots at depth, androots are deeper in the profile.
Shoot and root dry matter productionDry matter production or net photosynthesis of wheat
is determined by the sum of gross photosynthesis,photorespiration, and "dark" respiration (or simply"respiration"). Gross photosynthesis involves theconversion of water and carbon dioxide gas (CO2) from theatmosphere into carbohydrates, dry matter and oxygen(O2). This is achieved mainly by leaves but also by othergreen tissues of wheat shoots in the light.
Photorespiration is the light-dependent conversion ofspecific carbon compounds derived from photosynthesisinto more diverse substances required for plant growth. Incomparison, respiration is the conversion of substances inthe light or the dark, which is specifically linked to energyproduction essential for growth and survival. Bothphotorespiration and respiration require oxygen and boththese processes produce carbon dioxide.
The oxygen requirement of plants is how someenvironmental stresses affect plant growth. For example,reduced oxygen supply in soils during waterlogging is whywaterlogging has such adverse effects on crops. Limitedoxygen reduces respiration, which reduces energyproduction, which reduces growth and survival of roots,and this adversely affects shoots.
Respiration losses by crops commonly account forabout half of the carbon which is fixed in photosynthesis,while photorespiration reduces the amount of carbon fixedby wheat a further 15-20%.
Shoot dry matterDry matter accumulation of shoots is initially slow (see
Figure 3.6), but by August in Western Australia the wheatcrop canopy has usually closed (LAI = 2 to 3) and a periodof rapid growth ensues. Provided soil water storage isadequate, crop growth is primarily governed by theintercepted solar radiation and temperature.
CHAPTER 3 – GERMINATION, VEGETATIVE AND REPRODUCTIVE GROWTH THE WHEAT BOOK
44
VEGETATIVE GROWTH (continued)
Figure 3.6
Dry matter accumulation of a wheat crop at Merredin.
Dry
Mat
ter
(g/m
2 )
Table 3.2 – Dry matter (g/m2) in the roots and shoots of a wheat crop grown at Merredin, WA.
Trait 34 days 62 days 104 days (anthesis)
Dry matterRoots 22 75 280Shoots 12 69 509Root to shoot ratio 2/1 1/1 0.5/1Root % total dry matter 65 52 35

The vegetative stage of the life cycle ends when theshoot apex ceases forming leaves and begins theformation of the ear. This event, 'ear initiation' (SeeChapter 2) is a key point in the life cycle because thematurity of the cultivar – whether it is early or late in aparticular environment – is determined largely by thetiming of ear initiation.
Formation of the ear ends when a 'terminal spikelet' isformed. As this stage is reached, stem extension isbeginning and the plant is entering the phase of most rapidgrowth and nutrient uptake. Stem extension ceases atabout the time of anthesis when floret fertilisation occursand grain growth begins.
Ear initiationAfter germination, new leaf primordia are formed on
the shoot apex for only a short time. The total number ofleaves formed by the apex may be as few as five or as manyas 20, but in current Western Australian cultivars is usuallyonly 8 or 9.
Elongation of the apex is the first sign that theproduction of leaf primordia is about to cease and the apexis reorganising to form the ear. This stage requiresdissection of the shoot to observe (Plate 3.1).
Elongation of the apex is followed by the appearanceon the apex of a series of ridges similar to the earlier leafprimordia. These develop further to form a structurewhere the leaf and spikelet primordia are present togetherin a 'double ridge'. The lower (leaf ) ridge disappears,whilst the larger, upper structure develops as a spikelet(Plate 3.2).
THE WHEAT BOOK CHAPTER 3 – GERMINATION, VEGETATIVE AND REPRODUCTIVE GROWTH
45
REPRODUCTIVE GROWTH AND GRAIN FILLING
Plate 3.1 Shoot apex at late vegetative. Primordia at base willcontinue to grow into leaves but the development of leaf ridgesfurther up the dome will be arrested. (Adapted from Kirby andAppleyard; Cereal Development Guide, 1984).
Plate 3.2 Shoot apex at double ridge. Development of leafprimordia arrested and spikelet primordia can be identified.(Adapted from Kirby and Appleyard; Cereal Development Guide,1984).
Plate 3.3 Shoot apex at terminal spikelet. Upper most primordiadevelop into the parts of a spikelet. (Adapted from Kirby andAppleyard; Cereal Development Guide, 1984).
dome
site offuture‘spikelet’ridge
lowerleafridge
leafprimordia
Auxillary‘spikelet’ridge
lowerleafridge
terminalspikelet
floretlemmaglume
The first double ridges, and hence the first spikelets,form in the centre of the elongated apex and new spikeletsare then initiated progressively toward the top and bottomof the apex. Spikelet initiation ceases when the apical domeforms a final, single 'terminal spikelet' orientated at rightangles to the two parallel rows of spikelets on the apex(Plate 3.3).
0.5m
m s
cale
bar
1mm
sca
le b
ar
0.25
mm
sca
le b
ar

the process of separating the nodes by expansion of thetissues between each node. i.e. expansion of the internodes.
Not all internodes expand. For an early maturingcereal, each mainstem will form eight leaves and only thefour (or rarely five) uppermost internodes expand. This isillustrated in Figure 3.7.
In this example, the first internode to grow is thatassociated with leaf five. Cell division and cell expansionpush the developing ear above the ground surface. This is'Ear at 1 cm' (See Chapter 2, The Zadok’s growth scale)and is a sign that the crop is entering the phase of mostrapid growth. Internode five remains short, but as itsgrowth slows, internode six begins to expand followed inturn by internode seven.
The final internode to expand is the peduncle, theinternode above the flag leaf which is connected to the ear.Growth of the peduncle moves the ear upward within the'boot' formed by the flag leaf sheath. "Booting", theswelling of the ear within the boot, is followed by "earpeep" where the ear emerges from the flag leaf. Bycontinued growth of the peduncle, the ear is carried abovethe leaf canopy to reach flowering or anthesis.
Detecting the switch from leaf to ear formation.The primordia that are to form the leaves and
spikelets appear on the apex in two distinct phases whichdiffer in the rate at which primordia are initiated. Thepoint at which the rate changes is generally considered toindicate 'ear initiation' and the number of primordiaformed by the apex up to this point will equal the finalleaf number.
The change in rate of primordia formation and henceear initiation can be detected only in retrospect. However'double ridge' (Plate 3.2), which can be detected bydissection under a microscope, closely follows ear initiationand the two stages, for practical purposes, have beenconsidered the same.
Dissection, however, is not essential to establish earinitiation because for each cultivar there is a consistentrelationship between ear initiation and the number ofvisible emerged leaves on the stem. Note in the Zadok’sGrowth Scale described in Chapter 2, there is nodescription of ear development until after booting.
Maturity of cultivars.The significance of ear initiation is that differences in
life cycle between early, midseason and late maturingcultivars are determined by differences in the timing of earinitiation.
Short duration (early) cultivars come to ear, flower andmature quickly because ear initiation occurs after only 6-8leaf primordia have formed. Mid-season cultivars generallyform 10-11 leaves, and the late maturing cultivars 12-14leaves before ear initiation occurs.
Stem elongationRapid stem elongation occurs shortly before the
terminal spikelet stage in wheat (Plate 3.3). In southernAustralia eight to 14 leaves and about 18 spikelets havebeen formed, however the tiny embryonic ear is still only1-2 mm long, and is still located within the crown of theplant below the ground surface.
The beginning of stem elongation is described as "Earat 1 cm" because, if the mainstem leaves are stripped away,the length from the base of the tiller/root insertion to thetip of the ear is 1 cm long (Plate 3.4). Ear at 1 cm isequivalent to Zadok’s 30 stage (Chapter 2).
In the next phase, the ear and stem grow rapidly.Associated with this growth is the formation of floretswithin each spikelet and, later, the regression and death ofsome florets and spikelets and the death of some tillers.This phase is also the time of greatest dry mass increase andnutrient uptake of the plant.
Each leaf and spikelet is attached to a 'node' at the baseof the stem where the vascular tissues of the leaf enter thestem. These nodes are stacked tightly, one above the other,and the structure of the stem can be likened to a pile ofsaucers, each saucer representing a node. Stem extension is
CHAPTER 3 – GERMINATION, VEGETATIVE AND REPRODUCTIVE GROWTH THE WHEAT BOOK
46
REPRODUCTIVE GROWTH AND GRAIN FILLING (continued)
Plate 3.4 Ear at 1cm. Designates the beginning of stemelongation (Zadock’s 30 stage).

Floret formationInitiation of the terminal spikelet marks the end of
spikelet formation. Floret formation starts just beforespikelet initiation ceases, and the first florets differentiatewithin spikelets in the lower – central portion of the spike.The central spikelet of an ear can initiate up to 10 floretprimordia, however, the distally positioned spikeletsinitiate fewer florets.
In a typical wheat crop, only 30-40 % of florets setgrains. After reaching a maximum, floret number ismaintained for a short period, before the florets at eitherend of the spike shrivel and die. By anthesis, floret numberremains stable.
Floret production and survival are important becausethey determine grain number which is closely related tograin yield. Floret survival is greatest when conditionsfavour assimilate production i.e. adequate water andnutrient supplies, optimum temperatures, and high solarradiation.
There is a critical period two to three weeks beforeanthesis, and this is when water stress and/or hightemperature may greatly reduce the floret production andsurvival, greatly reducing the grain number per spikelet.
AnthesisThe final phase of the cereal life cycle begins with
anthesis and ends with the development of mature grain.Anthesis (or flowering) is the bursting of the pollen sacsand the fertilisation of the carpel.
Wheat is self-fertilising and only after fertilisation dothe glumes separate and allow the now empty anthers toappear on the outside of the ear.
THE WHEAT BOOK CHAPTER 3 – GERMINATION, VEGETATIVE AND REPRODUCTIVE GROWTH
47
REPRODUCTIVE GROWTH AND GRAIN FILLING (continued)
Figure 3.7
(see plate 3.4)
Illustration of stem elongation in wheat.
Figure 3.8
Dry matter accumulation of a wheat kernal at Merredin, WA.
Grain growthA wheat grain grows through three typical phases
shown in Figure 3.8. After anthesis there is a 'lag' phasefollowed by a short period of exponential growth. Duringthe lag phase the cells of the endosperm divide rapidly andthe potential size of the grain is determined. This periodlasts between 10 to 14 days (about 180 oCd).
In the second phase, growth in dry weight is nearlyconstant (in thermal time) as starch is deposited in theendosperm and the grain contents take on a milk-like andthen dough-like consistency. This phase lasts between 15and 35 days.
The final phase begins when waxy substances areproduced to block the vascular strands supplying the grain,and growth of grain ceases. This is physiological maturity(at about 700 oCd).

Yield componentsMany factors limit yield in wheat. The final yield is an
outcome of the interaction of genetic, environmental andcrop management factors.
Although grain yield is the final product of all thegrowth and development processes during the life cycle ofthe crop, it can be conveniently divided into a number ofsub-units called yield components.
The main yield components of a wheat crop are:The number of ears per square metre (E);The number of spikelets per ear, (Sp);The number of grains per spikelet (Gr); andThe weight of an individual grain (Wg) in grams.Grain yield in grams per square metre, can then be
expressed in terms of its yield components as;Yield (Y) = (E x Sp x Gr) WgThe above equation suggests that if one component is
increased then grain yield will be greater, but this is seldomthe case as yield components partially compensate for eachother. This 'yield component compensation' is discussed indetail later.
Past research demonstrates that the highest wheat yieldsare often the outcome of extreme values for one of the yieldcomponents, rather than a consistent set of ideal values forall these components. However, high grain number per m2,whether from ears/m2 or grains/ear, is an essentialprerequisite for high yield.
Determination of yield componentsThe cultivar sets the potential for the yield components
– tillering, spikelet number, the number of florets, andkernel weight. These are determined in a sequencethroughout the life cycle of the crop, shown in Figure 3.9.This is not a simple process, as formation of differentcomponents may overlap, and frequently, over-productionof a component at an early stage of growth is followed bydecrease at a later stage.
Generally the plant's yield potential exceeds the finalyield. Water, nutrients, temperature, light and otherenvironmental factors at sub-optimal levels reduce one or
After maturity, the water content of the grain dropsrapidly depending on the weather conditions, eventuallybecoming dry enough (10 to 20% water content) toharvest.
Since most of the final weight of the grain isaccumulated during the linear phase of growth, the rate ofgrain growth during this phase is highly correlated with thefinal weight of the grain. The absolute rate of grain growthduring the linear growth period in the field ranges between1.0 and 3.0 mg per grain per day, depending on theenvironment, cultivar and grain position within the spike.
Usually about 90% of the sugars required for graingrowth comes from photosynthesis after anthesis.However, the plant may also store considerable materials inthe stems and leaf sheaths as complex sugars (fructans) andthese are re-mobilized during grain filling. When a crop isaffected by drought, which decreases photosynthesisduring grain filling, stem stored fructans may contributeup to 70% or more of grain weight.
Harvest indexThe harvest index is the ratio of grain weight to total
weight of the crop. For example, if a crop yields 1.4 t/haand the total weight of the crop (grain plus straw) is 4.0t/ha, the harvest index is 1.4/4.0 = 0.35 or 35%.
Harvest index is not really a component of yieldbecause it can only be calculated after the crop hasmatured. It is sometimes useful, however, as a measure ofhow the yield was achieved.
A crop's potential harvest index may be determined bythe growth rates of the ear and stem when the ear is beingformed, that is, at about terminal spikelet stage. Thepotential could thus be raised by good crop husbandrywhich improves the growth rates of those structures.
Harvest index is usually low if growing conditionsduring grain filling are poor, as little grain is formedcompared to the dry matter already grown by anthesis.Where grain is filled in cool weather with adequate water,harvest index will usually be high; but there are manyexceptions such as when Septoria disease reduces grainweight and harvest index.
CHAPTER 3 – GERMINATION, VEGETATIVE AND REPRODUCTIVE GROWTH THE WHEAT BOOK
48
REPRODUCTIVE GROWTH AND GRAIN FILLING (continued)
Figure 3.9
Representation of the development of the yield components through the life cycle of the crop.

more of the yield components – often by aborting sometillers or florets after they have been formed.
Management of the wheat crop should aim to maximizeyield through an agronomic package (seed rate, sowingdepth, sowing time, fertilizers, weed and pest control)consistent with the known environmental limitations.
Number of ears (E)Ear number is the first yield component to be formed
and is set by tiller number. Tiller production depends oncultivar and environmental conditions (in particularnutrition). In most wheat crops, the plant produces moretillers than survive to form ears and grain.
Tillers are produced until roughly the start of stemelongation (soon after the terminal spikelet stage), and thenumber then declines until ear emergence; thereafterremaining almost constant until maturity. Typical patternsof tiller production and decline for old and modern wheatsgrown in Western Australia are shown in Figure 3.10.
The reasons for tiller death are not known precisely, butare probably related to competition within the plant fordry matter, water and nutrients, particularly after stemelongation when growth increases rapidly.
Tillers are not capable of surviving alone until theyhave about three leaves, and are starting to develop theirown nodal roots. In practice, only the first two or threetillers are likely to reach this stage before the plant ceasesleaf and tiller production.
Modern wheats bred for and grown in WesternAustralia generally mature earlier than older wheats. Theyalso produce fewer leaves on the main stem, consequentlyhave fewer tillering 'sites' and produce few tillers. Thisstrategy allows the plants to reach anthesis early in theseason with minimal investment in vegetative structures,and subsequently to concentrate on development beforemoisture stress develops.
A plant that produces no tillers – the 'uniculm' wheat– in which all the plant's energies can be focused onmaximizing grain numbers on a single stem – has, as yet,
THE WHEAT BOOK CHAPTER 3 – GERMINATION, VEGETATIVE AND REPRODUCTIVE GROWTH
49
REPRODUCTIVE GROWTH AND GRAIN FILLING (continued)
Figure 3.10
Tiller production of three wheat cultivars representing old purplestraw, intermediate Gamenya and modern kulin cultivars.
Figure 3.11
Formation and death of florets.
not produced more grain than conventional types. Such aplant lacks the flexibility required in rainfed fieldconditions to cope with stress, pests and disease.
Number of spikelets per ear (Sp)Spikelets are formed when the shoot apex begins
reproductive development when the apical domeelongates. In spring wheats this is when the main shoot hasabout 3 to 5 leaves. The number of spikelets per ear is setby genotype and environment, but for normal highyielding wheat cultivars, the spikelet number per ear isremarkably constant and ranges from 18 to 22.
In most crops the first two spikelets above the collar areusually infertile. Water stress at the time of spikeletdevelopment can reduce spikelet number and spike size. Insevere drought some spikelets, especially at the tip of theear, abort giving rise to 'white tipped' ears which drasticallyreduce grain yield.
Number of grains per spikelet (Gr)Potential grain number per spikelet is determined by
the number of fertile florets per spikelet.Floret formation starts just before spikelet initiation
ceases, and the central spikelet of an ear can initiate up to10 floret primordia. In a typical wheat crop, however, only30 to 40% of the florets formed actually set grains.
After reaching a maximum, floret number ismaintained for a short period, before the last florets to beformed lose turgidity and die. By anthesis floret number isstable, usually at 2 to 5 florets per spikelet. This is outlinedin Figure 3.11.
Many florets may die when the flag leaf has fullyemerged and the boot is visible. At this time, the ear andpeduncle are growing most rapidly.
The exact causes of floret death are uncertain but thedemands of the stem for dry matter may compete with theear. It is possible that selecting wheats which partition lessdry matter into the stem than the ear, at this stage, mayincrease the floret production, survival and grain number.

Estimating grain yield from yieldcomponents
The yield of a wheat crop can be estimated by:Grain yield (kg/ha) = Ears per square metre X Spikelets
per ear X Grains per spikelet X Weight per grain (g) X 10(see example below).
Ears per square metreCount the ears in a square metre of crop, or count the
number of ears in 1 metre length of row and multiply by5.6 – there are 5.62 metres of row in one square metre for7 inch or 17.8 cm row spacing. For 12 inch or 30cmspacing multiply by 3.3.
Spikelets per earCount the number on an average ear. For most crops it
will be between 16 and 20.
Grains per spikeletCount the grains in spikelets at the top, middle and
bottom of the ear. More (and heavier) grains are usually setin the central spikelets. The number should be between 2and 4, a conservative figure is 2 grains per spikelet.
Grain weightThe weight of an individual grain is impossible to
estimate without a balance. Grain weights depend ongrowing conditions and on cultivar, but will be between0.025 and 0.045 grams per grain. A good average figure is0.036 g/grain, equivalent to 28 grains per gram.
Grain yieldGrain yield can therefore be calculated as the product
of yield components:Yield = E/m2 x Sp x Gr x Wg
= 100 x (18 x 2 x 0.03)= 100 x 1.08= 108 g/m2 = 1,080 kg/ha
This leads to a simple rule of thumb, that a crop willyield about 1 t/ha for every 100 ears per square metre.
A large number of ears per square metre, caused eitherby excessive seeding rates or high rates of nitrogen, is alsoassociated with low floret survival. This occurs becausephotosynthesis per shoot is low, and therefore dry matter isin short supply.
Weight per grain (Wg)The weight per grain – usually averaged – is
determined by the photosynthetic capacity of the upperleaves, peduncle and ears; stem reserves and the storagecapacity of each grain.
Soil moisture stress during anthesis and grain growthleads to fast leaf senescence, slow photosynthesis and oftensmaller grains.
Temperature has a large effect on the duration of grainfilling. Lower temperature lengthens grain-fill duration,resulting in heavier grains. High temperature substantiallyreduces average grain weight, by shortening grain-fillduration.
Plant density does not seem to influence average grainweight significantly, but when soil moisture is deficient,grain weight may be reduced as soil moisture is depletedfaster.
Relationship between yieldcomponents and grain yield
Grain weight is usually the most stable of the yieldcomponents, so crop yield is closely related to the numberof grains that a crop produces.
Grain number is the product of the number of ears (E),the number of spikelets per ear (Sp), and the number ofgrains per spikelet (Gr); and these in turn are closely relatedto the crop biomass.
Yield component compensationThe yield components are determined sequentially
during the development of the crop. Ear and spikeletnumber are set well before anthesis, grain number aboutanthesis, and grain size between anthesis and maturity.Thus the potential yields of a wheat crop can respond toimproving or deteriorating conditions almost untilmaturity.
This flexibility is achieved by changes in the yieldcomponents. Low tiller numbers caused by stress duringtiller formation may be compensated for by greaternumbers of spikelets per ear and/or more grains perspikelet. Large numbers of ears per area from high seedingrates or excessive fertility may be compensated for bysmaller ears, or light weight grains.
The mechanisms responsible for compensationoriginate in the interactions between crop andenvironment and between different organs within theplant. They are caused by competition for dry matteroperating on the developmentally-flexible components ofthe plant.
CHAPTER 3 – GERMINATION, VEGETATIVE AND REPRODUCTIVE GROWTH THE WHEAT BOOK
50
REPRODUCTIVE GROWTH AND GRAIN FILLING (continued)

Wheat is grown commercially in a diverse range ofenvironments, in both winter and summer, from thetropics to the edge of the arctic circle. The time fromsowing to harvest can range from 60 to 330 days.Adaptation of wheat to these environments is achievedthrough genetic mechanisms governing plant response totemperature and daylength (photoperiod).
The interaction of the plant genetics with temperatureand photoperiod determines the length of the life cycle andthe cultivar’s specific adaptation. Understanding thesemechanisms and the factors controlling plant developmentis important in the generation of new cultivars and for cropmanagement.
TemperatureTemperature is the fundamental environmental
parameter that controls plant development. Increasingtemperature can advance the timing of floral initiation andflowering (in calendar time) due to the general effect oftemperature on the rate of biological processes. From about0oC to 30oC most plant processes double in rate as thetemperature increases every 10oC.
In some cultivars, development may not proceed or bedelayed until seeds or plants have been exposed to a periodof low temperature. This response is called vernalisation(from Latin ver, meaning "spring").
However, for many processes, such as leaf appearance,the rate at which the process occurs is constant in ‘thermaltime’. This concept is explained earlier in this chapter.Although temperature is the force driving plantdevelopment, photoperiod and vernalisation moderate itseffect.
PhotoperiodThe effect of the light duration each day, i.e.
photoperiod, on plant development was first recognised insoybean and tobacco which flowered when the daylengthto which they were exposed was artificially shortened.These are therefore termed "short day" plants.
This response contrasts to other plants. All of thetemperate cereals develop and flower more rapidly whengrown under long day lengths, and these are consequentlyknown as ‘long-day’ plants.
The sensitivity to reduction in daylength (photoperiod)varies greatly among wheat cultivars. When a cultivarsensitive to photoperiod is exposed to short days itresponds by forming more leaf primordia on its mainstembefore initiating the ear.
Spear is a good example of photoperiod sensitivity.Sown in early summer, Spear will flower with only sixleaves on the mainstem. But sown in the short days ofMay/June, Spear will form 10 or 11 leaves beforeflowering. A photoperiod insensitive cultivar will initiatethe same mainstem leaf number regardless of sowingdate.
THE WHEAT BOOK CHAPTER 3 – GERMINATION, VEGETATIVE AND REPRODUCTIVE GROWTH
51
ENVIRONMENTAL CONTROL OF WHEAT GROWTH ANDDEVELOPMENT
Most photoperiod sensitive wheats respond to longdays during vegetative development but can also respondduring reproductive development and stem elongation.The effect of longer days on plant development can alsovary greatly between cultivars. For some, a brief exposureto long days will initiate reproductive development, whilstother cultivars will need exposure to a longer photoperiodfor a much longer time.
VernalisationA third mechanism modifying the development of
plants to the environment is the requirement for exposureto cold before development can proceed. This is known as‘vernalisation.’
Temperatures for vernalisation to affect developmentare between 1 and 10°C. In cultivars with a vernalisationrequirement, the shoot apex will remain vegetative,producing leaf primordia only, until the cold requirementhas been satisfied. Plant development can continue if thiscold requirement is only partially satisfied, butdevelopment will still be delayed.
Vegetative plants that require vernalization tend to havea prostrate growth habit. In the northern hemispherewinter, this helps to protect the young plant by keeping itbeneath the snow.
Winter wheat cultivars are generally those with astrong response to vernalisation. They require a longperiod of exposure to the vernalising temperatures beforetheir cold requirement is satisfied and the shoot apexadvances to reproductive development and initiates floralprimordia.
The vernalisation requirement for wheat varies greatlybetween cultivars and in a quantitative manner. Four majorgenes have been identified and many with minor effects.
Basic vegetative periodPhenological differences between wheat cultivars are
normally attributed to differences in response tophotoperiod and vernalisation. The inference, is that allcultivars would flower at about the same time, if theseeffects were removed by growing vernalised plants underlong days. However, this is not the case.
The magnitude of variation amongst cultivars in theabsence of photoperiod and vernalisation effects can be asgreat as that attributable to photoperiod and vernalisation.This trait is known as the basic vegetative period (BVP)and describes the minimum time taken by the plant tocomplete its life cycle.
BVP is strongly correlated with the duration ofvegetative growth and therefore mainstem leaf number. Infact, leaf number can be used as a surrogate measure ofBVP and can vary from 6 in Spear to as many as 18 inwinter wheats such as Demeter. There is a tendency incultivars with a long BVP, and large minimum leafnumber, for leaves to emerge more slowly.

hemisphere winter wheats are very late flowering becauseour winter temperatures are not cold enough to quicklysatisfy the high vernalisation requirement. Europeanspring wheats are also late flowering when grown insouthern Australia because photoperiod is shorter here (at28 to 40oS latitude) than in northern Europe (at 40 to50oN latitude).
Development in Australian cultivarsIt was stated earlier that the greater variation to
photoperiod amongst Australian cultivars suggests it ismore common than vernalisation in determiningdifferences in development patterns of Australian springwheats.
Photoperiod is a more consistent environmentalparameter than temperature, and it would be expectedthat photoperiod sensitivity should therefore be a morereliable predictor of flowering than vernalisation andthus impart wider adaptation. This is the case for thehistorical wheats Bencubbin and Gamenya and morerecently for Spear and Stiletto. Each of these cultivarsrespond much more strongly to photoperiod than tovernalisation.
However two more recent cultivars, Tammin andCunderdin, have demonstrated good general adaptationyet only respond marginally to photoperiod. Many otherwheats grown commercially in Western Australia possessmoderate sensitivity to both photoperiod andvernalisation.
All wheats grown in Western Australia possess a BVPof about 750oCd. It has been postulated that a short BVPhas an additional effect on growth, allowing the plant tocomplete its life cycle before the onset of moisture andtemperature stresses at the end of the growing season.
The responses for some common wheats grown inWestern Australia are listed in Table 3.3 along with somenorthern hemisphere winter wheats. These examplesillustrate the great flexibility in developmental patternsavailable in different wheat cultivars.
With increasing knowledge of the effects ofphotoperiod, vernalisation and BVP, more latitude isavailable to the breeder to select for those combinationsthat optimise timing of floral initiation and flowering.Breeders have exploited this variation to producecultivars adapted to different locations, sowing dates andlengths of growing season.
It is by matching the life cycle of the cultivar to thelength of the growing season that yield potential ismaximised. This is taken up in Chapter 7 with theconcept of the ‘Flowering window’.
BVP is the basis for the rate of development of acultivar, and it is the building block on which adevelopment response is built. The addition of genes forsensitivity to photoperiod and vernalisation will slow thisinherent rate of development. The mix of BVP withphotoperiod and vernalisation can therefore be combinedby plant breeders to tailor a cultivar to specific regions orsowing dates.
Cultivar adaptationIn Western Australia the beginning and end of the
growing season are determined by the prevailing weatherand are not influenced to a great extent by genotype ormanagement. The plant life cycle has to be completedwithin these two constraints. The major consideration ofthe plant life cycle is the time of flowering in relation tothe length of the growing season. It marks the change inplant development from the production of biomass andyield bearing structures to the formation and filling ofgrain.
Measurement of cultivar adaptationAdaptation in wheat is characterised by response to
vernalisation and photoperiod and measured by the timeto flowering. Response to photoperiod is usually basedon the difference between duration under natural (shortdaylength) and an extended photoperiod of (vernalised)plants grown in the field from a June 30 planting.
Vernalisation response can be measured as thedifference between duration of vernalised (grown for 4weeks at a mean temperature of 4oC prior to transplant tothe field) and non-vernalised plants grown in the field oversummer with an 18h photoperiod. BVP can be measuredas the time to flowering for vernalised plants grown underlong photoperiod.
The above approaches are a rudimentary method ofclassifying cultivars, and they also help to explain broaddifferences in why cultivars are adapted to particularclimates.
European winter wheats are very sensitive tophotoperiod and vernalisation and can possess long BVP,allowing them to be planted in the autumn, survive overwinter, then proceed to flower in the spring. Europeanspring wheats lack the vernalisation responsiveness of thewinter wheats but still possess long BVP and/or a highsensitivity to photoperiod.
Most Australian wheats have a short BVP, little or verylow sensitivity to vernalisation, but a wide range insensitivity to photoperiod that can approach that of someEuropean cultivars. It can be inferred that photoperiod isa more common determinant of adaptation thanvernalisation in Australian wheats.
The above relationships explain why wheats fromNorthern Europe and the United States do not yield wellin south-western Australia. When grown here, northern
CHAPTER 3 – GERMINATION, VEGETATIVE AND REPRODUCTIVE GROWTH THE WHEAT BOOK
52
ENVIRONMENTAL CONTROL OF WHEAT GROWTH ANDDEVELOPMENT (continued)

THE WHEAT BOOK CHAPTER 3 – GERMINATION, VEGETATIVE AND REPRODUCTIVE GROWTH
53
ENVIRONMENTAL CONTROL OF WHEAT GROWTH ANDDEVELOPMENT (continued)
Table 3.3. – Summary of the developmental responses for some common WA and some northern hemisphere wheats. All measurements are in thermal time (ºCd) using a base temp of 0ºC (P. Carlton, unpublished).
Wheat cultivar Basic Vegetative Response to PhotoperiodPeriod Vernalisation
Australian wheatsAmery 740 90 160Aroona 680 20 280Bencubbin 840 280 360Cadoux 730 270 290Carnamah 700 210 220Cascades 720 150 190Cunderdin 690 330 200Gamenya 750 230 320Janz 790 110 280Machete 690 220 330Perenjori 760 340 160Spear 750 60 510Stiletto 810 70 410Stretton 800 160 220Tammin 810 320 100
Northern hemisphere winter wheatsCurrawa 830 170 760Demeter 1640 210 420Marksman 990 250 770N87L 210 940 2260 540Pomurka 990 1070 140Priboi 1130 1630 210Suckert Sand's Dickko 1290 1550 710

CHAPTER 3 – GERMINATION, VEGETATIVE AND REPRODUCTIVE GROWTH THE WHEAT BOOK
54

Chapter Coordinator: D. TennantAuthor: D. Tennant
Crop water use ................................................................................................57
The 'water balance' of a crop ..........................................................................58The losses ..............................................................................................................58The gains................................................................................................................58
Measuring water use ........................................................................................59Plant-available water ..............................................................................................59Wettest and driest profiles ......................................................................................59Crop water use ......................................................................................................60
Water use efficiency..........................................................................................61Measurement of water use efficiency......................................................................61An alternative approach ........................................................................................61
Estimating crop yield potential ......................................................................63The concept ..........................................................................................................63Estimating water use from growing season rainfall ................................................64Setting yield potential ............................................................................................64Problems in estimating yield potential and water use efficiency ............................64Factors affecting grain yield....................................................................................66Relationship between growing season rainfall and water use ................................66Universality of the ‘French and Schultz’ equation..................................................66
Further Reading ..............................................................................................67
THE WHEAT BOOK CHAPTER 4 – CROP WATER USE
55
CHAPTER FOUR
CROP WATER USE

CHAPTER 4 – CROP WATER USE THE WHEAT BOOK
56

David TennantIn Western Australia rainfall is usually the sole source of
water for crop production. Only water stored in the soil atsowing or rainfall during the growth of the crop isavailable.
Water uptake by plant roots depends on:The depth of the root system (which determines thewater available for extraction in the soil profile);The root length present in each layer of the soil; and The resistance to movement of water within the rootaxes.Water uptake should be greatest with a large and
deep root system. However, there is evidence that manycultivated wheats produce a larger root system than isrequired for uptake of available water – presumably as asurvival mechanism against severe drought, or damage toroots by pests and diseases such as take-all. Deeperrooting results in greater water use in deep soils that
allow differences to develop. However, on many soils,rooting depth is limited by an impermeable B horizon(duplex soils), low pH (acidity), high pH (alkalinity),boron toxicity, salinity or maybe one or more otherfactors. Species and variety differences in root depth andwater use on these soils reflect tolerances to the impedingcondition. Where the limiting condition is physical(impermeable B horizon on duplex soils) or has uniformeffect, there are little differences in species and varietyrooting depths and water use.
Also, it is important to 'meter' water in the drier partsof the wheatbelt so that crops have adequate moisture afteranthesis for grain filling. This requires the breeding ofcultivars that flower early in the season. Another option isto breed for varieties with high resistance to watermovement in root axes, to limit early water use andconserve water for use by the plant at later stages of growth.At present, this is not a feature in commercial varieties.
THE WHEAT BOOK CHAPTER 4 – CROP WATER USE
57
CROP WATER USE

The 'water balance' of a crop accounts for the varioussources of water available for growth and the pathwaysthrough which water is used in the production of grain.That is, how well the plant balances the gains and losses ofwater over the season.
The lossesWater is lost or used by run-off, drainage and
evaporation from soil and plants.Run-off: water that does not infiltrate into the soil maybe lost as run-off from the soil surface. It is notconsidered an important loss for most crops in WesternAustralia, but where it does occur, yield potential isreduced and erosion may occur.Drainage: water percolating below the rooting depth ofthe crop. Early in the season the wetting front in the soilmay exceed the root depth, however roots continue togrow and typically catch up with the wetting front. Thepotential for drainage is much greater on coarse texturedsoils because of their low capacity to hold water.Soil evaporation: water that evaporates from the surfaceof soils. While the surface is moist, water may be lost atthe same rate as from a water surface: 2 to 3 mm/dayin winter and up to 10mm/day in summer. Most wateris lost when the surface is cultivated and left bare whilstthe crop is establishing a cover of leaves.
Transpiration: water taken up by the roots andevaporated from the leaves. It is the only productivepathway of water loss. To increase yield it is essential toincrease the amount of water transpired by a crop.Ideally, crop dry matter production and yield should
be assessed in terms of water transpired, but transpirationis not easily measured in the field. Crop water use isusually measured as evapotranspiration, which is thecombination of evaporation (during crop growth) andtranspiration.
The gainsRainfall just before, and during the growing season is
the main source of water for crops. Water stored in the soilat sowing is also available to the crop. This may be fromimmediate pre-season rainfall, from heavy summer rains,or from a previous season's rainfall, stored under a fallow.
Over a set period – typically the crop growing season –the supply of water to the crop from rainfall (R) and anysoil water stored at planting (SW1), must be balanced bythe losses: run-off (RO), drainage (D), andevapotranspiration (ET). If these losses do not balance theinputs, the water stored in the soil at the end of the period(SW2) will increase or decrease to compensate. Thus thewater balance is:
R + SW1 = RO + D + ET + SW2
CHAPTER 4 – CROP WATER USE THE WHEAT BOOK
58
THE 'WATER BALANCE' OF A CROP

Of the terms in the water balance equation, onlyrainfall is easily measured. Stored soil water can bemeasured by soil sampling and determining the watercontent by weighing, drying and weighing again. A rangeof instruments are also available to measure stored soilwater. The neutron moisture meter is the most widelyused. In recent years, new instruments have becomeavailable for intensive measurement of water use and storedsoil water – Bowen Ration Apparatus to measureevapotranspiration (ET), and Time domain reflectometer(TDR) to measure profile water contents and therefore thesum of ET, D and RO. When the TDR and Bowen RatioApparatus are used in tandem, subtracting ET (BowenRatio Apparatus) from the sum of ET, DR and RO (TDR)gives a measure of DR and RO. When RO is known to benegligible, we have a measure of DR.
Run-off and drainage are particularly difficult tomeasure, even with complex instrumentation and to over-come this, most measurements of crop water use orevapotranspiration are made under conditions where run-off and drainage are negligible. This applies to most cropsgrown in the wheatbelt, so the balance becomes:
ET = R + SW1 – SW2Stored soil water at planting includes water stored from
summer and pre-sowing growing season rainfall, and maybe substantial on fine textured soils. No simple rule candetermine the amount of rainfall stored at sowing becausethe pattern, amount and timing relative to sowing willdetermine losses from evaporation and summer pasture orweed use. As an example, only 25 to 30% of fallow waterremains for the following crop.
Plant-available waterPlant-available water is water stored between ‘wilting
point’ and ‘field capacity’. It represents the soil’s capacity totemporarily store water and then release it to the plant, andis important in determining the productivity of soil types.
Wilting point is the lower limit of plant available water,and as its name implies, is the point at which the plant is
unable to extract more water and wilts. Some water remainsin the soil below wilting point, bound tightly to the soilparticles. The amount of water remaining at wilting pointdepends on the soil texture and varies from 2 to 3% oncoarse sands to 20 to 25% on clays.
Field capacity is the upper limit and represents water leftin the soil after all excess water has drained away after wettingup. It varies with soil texture and approximates about 12%for coarse textured sand-plain soils, but may be over 30% forclay soils. Water content is frequently above field capacity insome parts of the soil profile in the wetter months of thegrowing season. In extreme situations this leads towaterlogging. At other times, the plant can use some of thiswater as it drains down the profile.
Because of the almost metre to metre variability in soiltexture, only a general guide to plant-available water contentis possible. Examples of these estimates are given in Table 4.1.
Wettest and driest profilesMore practical estimates of available water in the field are
obtained by difference from the driest recorded soil watercontents down the profile. Except after late season rains, soilwater contents down the soil profile near harvest describe thelower limit of water extraction by a crop. In these ‘dry’ soilwater profiles, soil water contents near the surface, are belowwilting point, due to water loss through evaporation (usuallyto around 30 cm but sometimes to 50 cm). Water contentsbelow these depths are at first, at or near wilting point in theupper half of the profile, and then, increasingly higher thanwilting point down to the final depth of water extraction, asroot densities and capacities to extract water decrease.Wettest soil water contents are usually experienced sometimetowards the end of July. Depending on the time ofmeasurement, these can be above field capacity in the upperhalf of the profile, and tend to be lower than field capacity inthe lower half of the profile, if water has not infiltrated tomaximum depths of measurement. If measurements aremade to well beyond maximum root depths, the two profiles
THE WHEAT BOOK CHAPTER 4 – CROP WATER USE
59
MEASURING WATER USE
Table 4.1 – Effect of soil type on the amount of plant-available water (Estimates based on field and laboratory measurements)
Soil type Available water Storage to(mm/100 mm 1 metredepth of soil) (mm)
Poor white sand 1.5 to 4 15 to 40Coarse yellow and grey sands 4 to 7 40 to 70Loamy sands 5 to 9 50 to 90Sandy loam (Avon valley) 10 to 15 100 to 150Merredin sandy loam : surface (0 to 20 cm) 15 to 18 30 to 36+
: subsoil (20 to 80 cm) 18 to 25 144 to 200+
+ Add to give storage to 1 m.

tend to come together at depth. Differences between the‘wettest ‘and ‘driest’ soil water profiles provide estimates ofwater extraction from the soil by the crop. Figure 4.1illustrates wettest and driest profiles measured under wheatcrops on three soils at Merredin.
Crop water useWater use of a range of wheat cultivars and one barley
cultivar was studied at Merredin in 1987. The experimentwas sown on May 27 and included old and modern wheatcultivars. Growth and water use were measured through theseason, and the results are shown in Table 4.2.
Purple Straw was a wheat cultivar of European origingrown in Australia in the late 1800s. Successively morerecent cultivars mature earlier and yield more. Total wateruse was actually slightly less in the modern cultivars becausethe later-maturing cultivars were able to extract a little morewater from deeper in the profile and there was some laterain.
What has changed between the old and modern cultivarsis the partition of water use between the pre- and post-anthesis phases of the crop cycle. Older cultivars, basicallybecause they take longer to flower, use almost all the waterbefore flowering while modern, early flowering cultivars usemore of the water supply after flowering.
Optimum grain production seems to be obtained at aratio of pre- to post-anthesis water use of 2:1. In theexperiment at Merredin the ratio was often less than 3:1,that is, post-anthesis water use was often less than 25% oftotal water use.
Evaporation from bare soil before the crop emerges, andbefore full canopy cover is established, is an important sourceof water loss. Cool winter conditions mean canopydevelopment is slow and the soil surface is often wetted byfrequent, but small, periods of rain. For the cultivars in Table4.2, estimated soil evaporation was about 80mm or 40% oftotal water use.
Other work has estimated soil evaporation to be 63mmand 134mm for crops at Merredin and Wongan Hillsequivalent to 38 and 44% of total water use.
CHAPTER 4 – CROP WATER USE THE WHEAT BOOK
60
MEASURING WATER USE (continued)
Figure 4.1a
Figure 4.1c
Figure 4.1b
Soil water profiles for wheat crops grown on a yellow earthy sand(sandplain), loamy sand over clay (medium) and red-brown earth(heavy land) at Merredin.
Table 4.2 – Yield and water use (mm) of old and new wheat cultivars and one barley cultivar (O’Connor) grown atMerredin in 1987.
Cultivar Yield Days to Water use (mm) Ratio(kg/ha) flower Pre- Post- Total Pre/post
flower flower Flower
Purple Straw 1160 125 174 34 206 5.2Bencubbin 1620 114 157 39 196 4.1Gamenya 1680 109 147 39 186 3.8Halberd 1740 113 156 40 196 3.9Gutha 1890 103 140 46 186 3.0Eradu 1830 106 146 40 186 3.7Kulin 1890 106 145 40 185 3.5O’Connor 2120 102 145 40 185 3.6

Grain yield can be considered as the product of thewater used by the crop (WU) and a water use efficiency(WUE) expressed as yield per unit of water use (eg.kg/ha/mm). That is:
Yield = WU x WUEAnd
WUE = Yield / WU
Water use, also known as evapotranspiration (Et) hastwo components – water evaporated from the soil (Es) andwater transpired (T) through the crop. To betterunderstand WUE, we need to
(i) replace the WU term in this equation with Es and T,
WUE = Yield / (Es + T)
(ii) divide the top and bottom of the right hand sideof this equation by T,
WUE = Yield / T1 + Es / T
(iii) recognise that water loss from the soil can alsoinclude run-off (R) and deep drainage (D).
WUE = Yield / T1 + (Es + R + D) / T
In this equation, Yield / T is the transpirationefficiency (TE) of the crop. A measure of T is needed toarrive at a value for TE. T is usually calculated bysubtracting Es, R and D, from WU. Es, R and D aredifficult to measure, thus T and TE are not oftencalculated. The alternative (some would saycompromise) is to use WU and WUE. When doing this,it is important we understand that WUE is calculatedusing a water use value that in addition to T also includesEs, and in many situations R and D as well. Failure tounderstand this has led to many misunderstandingswhen using applications based on WUE.
The structure of the final equation suggests options forimproving water use efficiency.
Increasing TE, or yield produced per unit of watertranspired will increase WUE. TE can be improved byincreasing the proportion of vegetative growth duringthe cooler winter months. This can result in higher drymatter production and yield if variety choice and otherconditions are suitable. The higher yields achievedfrom early sowing are a consequence of this. TE is alsodetermined by the physiology of the plant. This aspectof TE is only improved by breeding.If water supply is limited, WUE can be improved byincreasing T at the expense of one or more of Es, R andD. The strategy here is to increase productive water useand reduce non-productive water losses. For example,in restricted rainfall environments, better agronomy forfaster early ground cover and higher dry matterproduction serves to reduce Es and increase T, to givehigher yields. The sum of Es and T, or water use, mayincrease slightly, but not substantially.If water supply is increased, WUE will only beincreased if T is increased proportionately more thanthe sum of Es, R and D.Generally, all management options to improve yields
and WUE aim at increasing the proportion of watertranspired by the crop.
Measurement of water use efficiencyIn the field, we can measure water use by measuring the
change in stored soil water between sowing and harvest andadding rainfall received over this period. WUE is thencalculated by dividing yield by water use. Table 4.3summarises some measurements of yield, water use andwater use efficiency of wheat at a number of locations inWestern Australia. The average is 8.6 kg/ha/mm and thevalues range from 5.6 to 13.6 kg/ha/mm. Similar values arereported from eastern Australia and overseas. Lowest valuesin the table occur on free draining sands where water is lostbelow the root zone, with low fertility treatments wherelittle dry matter is produced and with older lower yieldingwheat varieties.
An alternative approachTo calculate the WUE of farm yields, the yield can be
divided by the growing season rainfall. This 'rain useefficiency' index usually has a value of about 10 kg/ha/mmin the central and eastern wheatbelt of Western Australia,and has been used as a target or benchmark against whichthe efficiency of a crop enterprise can be measured.
THE WHEAT BOOK CHAPTER 4 – CROP WATER USE
61
WATER USE EFFICIENCY

Table 4.3 – Results of crop water use studies, 1979 to 1992.
Year Location Cultivar Grain Crop Water useYield Water Efficiency
(kg/ha) Use (kg/ha/mm)(mm)
1979 Wongan Hills Gamenya 1,609 212 7.6Avondale Gamenya 2,441 237 10.3Merredin Gamenya 1,647 196 8.4
1980 Wongan hills Gamenya 1,203 181 6.6Avondale Gamenya 1,429 178 8.0
1981 Wongan Hills Gamenya 2,098 290 7.21982 Wongan Hills Gamenya 1,982 256 7.71983 Wongan Hills Gamenya 3,228 299 10.8
2,613 270 7.71984 Merredin Gutha
Red-brown earth 1,873 165 11.4Duplex soil 2,131 223 9.6Acid sand 1,299 177 7.3
1985 Merredin GuthaWheat/wheat – N 1,320 168 7.9Wheat/wheat +N 1,770 171 10.4Lupin/wheat – N 1,860 186 10.0Lupin/wheat + N 1,730 181 9.6
1987 Merredin Purple Straw 1,162 206 5.6Gamenya 1,674 186 9.0Kulin 1,892 187 10.1
1988 Merredin Purple Straw 1,360 230 5.9Gamenya 2,415 239 10.1Kulin 3,006 221 13.6
East Beverley Gutha 1,980 255 7.81992 Merredin Gamenya 1870 290 6.7
Kulin 2660 292 9.1Spear 1830 298 6.2
Mullewa Gamenya 2040 234 8.7Kulin 1840 210 8.7Spear 1810 236 7.7
CHAPTER 4 – CROP WATER USE THE WHEAT BOOK
62
WATER USE EFFICIENCY (continued)
The Two Tonne Clubs established in 1979 tested this10 kg/ha/mm target by deciding to eliminate allconstraints other than water supply on grain production.
They aimed to grow a disease-free, weed-free, wellfertilized, early sown crop of a recommended variety on thebest cropping land on each farm. A quarter of the crops
grown this way achieved the target of 10 kg/ha/mm andnearly half reached 9 kg/ha/mm or better.
In the mid 80s, this idea for using growing seasonrainfall as an estimate of crop water use and a target WUEwas expanded to include the water-limited yield potential ofa crop and better seasonal estimates of water use and WUE.

The conceptThe practice of using yield potential estimates as
benchmark values for assessing the success of croppingcame out of an extensive study of yield variability and itscauses in wheat in South Australia. Yield and water usedata were collected at 62 sites over a period of 12 years(1964-75). When these yields were plotted against themeasured values of water use, the data points were widelyscattered and yields were poorly correlated with water use(Figure 4.2). To interpret this scatter, a line was drawnthrough the highest yields at different levels of water use.This line was seen to define a linear relationship betweenyield potential (maximum achievable yield) and water use.The spread of data points below this line were thought torepresent sites where yields were limited by factors otherthan water supply – extremes of temperature, agronomicdeficiencies, pests, diseases, unsuitable soil physicalconditions and waterlogging.
The yield potential line in this data set intercepted thewater use axis at 110 mm and had a slope of 20 kg/ha/mm.The implications arising were:
On average, in South Australia, up to 110 mm of water(stored water and rainfall) is lost through soilevaporation, and is not used for grain production. Water in excess of this 110 mm contributes to a water-limited yield potential, to the extent of 20 kg/ha/mm. These ‘water loss’ and ‘water use efficiency’ values
were included in what is known as the ‘French andSchultz equation’, named after the developers of theyield potential concept.
Yield potential = (Crop water use – 110) x 20
The parameters in this equation are thought of as beingconstants. While this is for the most part true for the ‘wateruse efficiency’ term, the ‘water loss’ value of 110 mm varieswith management, rainfall and soil type. Though largelymade up of soil evaporation, it can also include run off anddeep drainage. On hard setting soils in South Australia,water loss included run off and on average totals 170 mm.
In contrast, in low rainfall conditions and under cropsgrown in Queensland on stored soil water, average waterloss was of the order 75 mm and 45 mm respectively. Insimilar data derived in Western Australia, water loss was ofthe order of 130 mm on deep sand at Wongan Hills,compared to 110 mm on sandy loam and red duplex soilsat Avondale and Merredin. The difference was thought tobe due to drainage (20 mm average) at Wongan Hills. Inoverseas data, soil evaporation under a well managed crophas been estimated to be around 20% of crop water use,compared to 40% of crop water use under an average crop.Published values of soil evaporation under a crop rangefrom 20% to 60% of total water use.
While run off and drainage can this way impact onthe ‘water loss’ value, the ‘French and Schultz’ equationis in effect a simple procedure to partition water useinto its components of transpiration and soilevaporation. In reality this is a more complex process.However, the relationship between yield and water useas defined in Figure 4.2 is the best available method ofestimating the water-limited yield potential of a crop.This is because it attempts to isolate and subtract waterlost through non-productive evaporation, and to use ameasure of the efficiency of conversion of productivetranspiration to grain.
Some have argued that this measure should bearound 16 kg/ha/mm, and not 20 kg/ha/mm. There areseveral local and overseas data sets available whichsupport this view, but there are differences in the way thedata are interpreted. The 16 kg/ha/mm value is usuallyobtained when a line is fitted to the data, to give an‘average’ water use efficiency. This contrasts with the‘French and Schultz’ approach of fitting a line throughthe highest yields, to give a ‘potential’ water useefficiency of 20 kg/ha/mm. The ‘French and Schultz’equation enables the producer to set a target orbenchmark water-limited yield potential to aim at. Inthis context, the issue is more one of using a consistentwater use efficiency value than any decision on choice.
Comparison of yields achieved with a calculated yieldpotential may indicate that some property ormanagement practice is severely constraining yields.Alternatively, a simple transposition of the ‘French andSchultz’ equation enables the producer to calculate wateruse efficiency achieved by a crop, and then compare itagainst a target or potential water use efficiency, toachieve the same end.
WUE = Yield / (Crop water use – 110)Being opposite sides of the same equation, the ratio of
yield to yield potential is the same as the ratio of water useefficiency to potential water use efficiency.
The two steps required to estimate water-limited yieldpotential or water use efficiency achieved are to:
Estimate water use from growing season rainfall; andUse the ‘French and Schultz’ equation to calculate yieldpotential or water use efficiency achieved.
THE WHEAT BOOK CHAPTER 4 – CROP WATER USE
63
ESTIMATING CROP YIELD POTENTIAL
Figure 4.2
Yield and water use data used to generate the ‘French andSchultz’ equation for wheat.
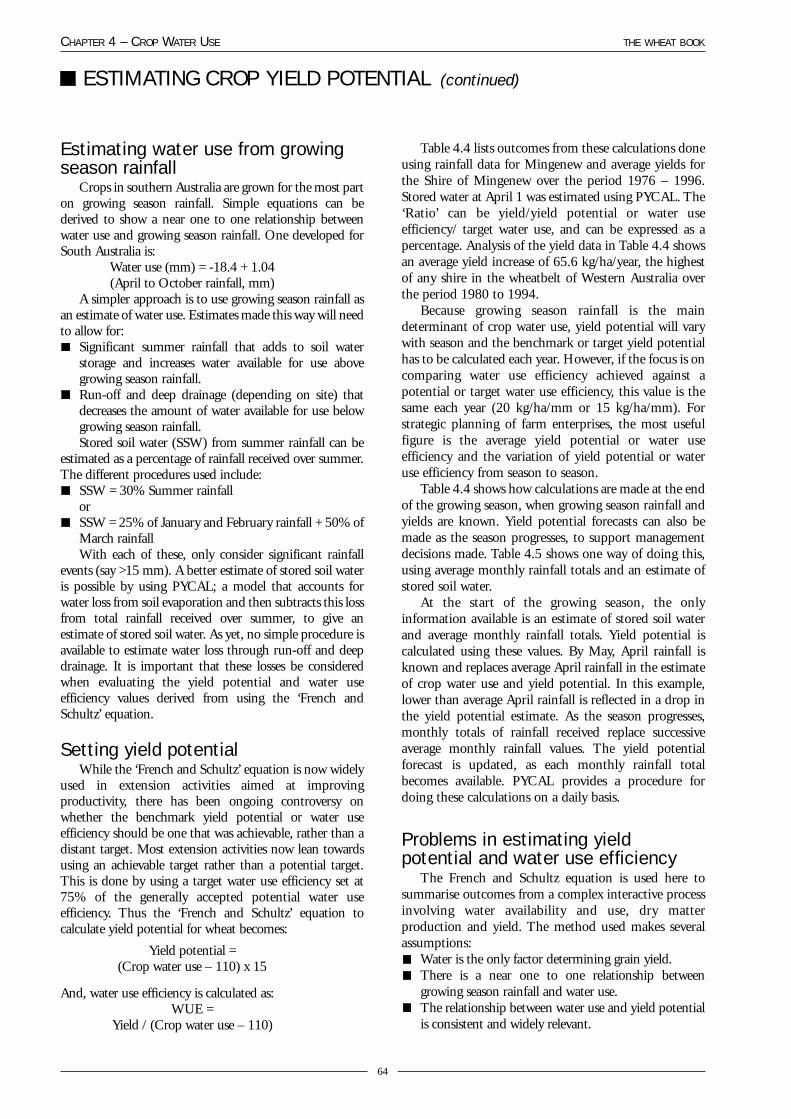
Estimating water use from growingseason rainfall
Crops in southern Australia are grown for the most parton growing season rainfall. Simple equations can bederived to show a near one to one relationship betweenwater use and growing season rainfall. One developed forSouth Australia is:
Water use (mm) = -18.4 + 1.04(April to October rainfall, mm)
A simpler approach is to use growing season rainfall asan estimate of water use. Estimates made this way will needto allow for:
Significant summer rainfall that adds to soil waterstorage and increases water available for use abovegrowing season rainfall. Run-off and deep drainage (depending on site) thatdecreases the amount of water available for use belowgrowing season rainfall.Stored soil water (SSW) from summer rainfall can be
estimated as a percentage of rainfall received over summer.The different procedures used include:
SSW = 30% Summer rainfallorSSW = 25% of January and February rainfall + 50% ofMarch rainfall With each of these, only consider significant rainfall
events (say >15 mm). A better estimate of stored soil wateris possible by using PYCAL; a model that accounts forwater loss from soil evaporation and then subtracts this lossfrom total rainfall received over summer, to give anestimate of stored soil water. As yet, no simple procedure isavailable to estimate water loss through run-off and deepdrainage. It is important that these losses be consideredwhen evaluating the yield potential and water useefficiency values derived from using the ‘French andSchultz’ equation.
Setting yield potentialWhile the ‘French and Schultz’ equation is now widely
used in extension activities aimed at improvingproductivity, there has been ongoing controversy onwhether the benchmark yield potential or water useefficiency should be one that was achievable, rather than adistant target. Most extension activities now lean towardsusing an achievable target rather than a potential target.This is done by using a target water use efficiency set at75% of the generally accepted potential water useefficiency. Thus the ‘French and Schultz’ equation tocalculate yield potential for wheat becomes:
Yield potential = (Crop water use – 110) x 15
And, water use efficiency is calculated as:WUE =
Yield / (Crop water use – 110)
Table 4.4 lists outcomes from these calculations doneusing rainfall data for Mingenew and average yields forthe Shire of Mingenew over the period 1976 – 1996.Stored water at April 1 was estimated using PYCAL. The‘Ratio’ can be yield/yield potential or water useefficiency/ target water use, and can be expressed as apercentage. Analysis of the yield data in Table 4.4 showsan average yield increase of 65.6 kg/ha/year, the highestof any shire in the wheatbelt of Western Australia overthe period 1980 to 1994.
Because growing season rainfall is the maindeterminant of crop water use, yield potential will varywith season and the benchmark or target yield potentialhas to be calculated each year. However, if the focus is oncomparing water use efficiency achieved against apotential or target water use efficiency, this value is thesame each year (20 kg/ha/mm or 15 kg/ha/mm). Forstrategic planning of farm enterprises, the most usefulfigure is the average yield potential or water useefficiency and the variation of yield potential or wateruse efficiency from season to season.
Table 4.4 shows how calculations are made at the endof the growing season, when growing season rainfall andyields are known. Yield potential forecasts can also bemade as the season progresses, to support managementdecisions made. Table 4.5 shows one way of doing this,using average monthly rainfall totals and an estimate ofstored soil water.
At the start of the growing season, the onlyinformation available is an estimate of stored soil waterand average monthly rainfall totals. Yield potential iscalculated using these values. By May, April rainfall isknown and replaces average April rainfall in the estimateof crop water use and yield potential. In this example,lower than average April rainfall is reflected in a drop inthe yield potential estimate. As the season progresses,monthly totals of rainfall received replace successiveaverage monthly rainfall values. The yield potentialforecast is updated, as each monthly rainfall totalbecomes available. PYCAL provides a procedure fordoing these calculations on a daily basis.
Problems in estimating yieldpotential and water use efficiency
The French and Schultz equation is used here tosummarise outcomes from a complex interactive processinvolving water availability and use, dry matterproduction and yield. The method used makes severalassumptions:
Water is the only factor determining grain yield.There is a near one to one relationship betweengrowing season rainfall and water use.The relationship between water use and yield potentialis consistent and widely relevant.
CHAPTER 4 – CROP WATER USE THE WHEAT BOOK
64
ESTIMATING CROP YIELD POTENTIAL (continued)

THE WHEAT BOOK CHAPTER 4 – CROP WATER USE
65
ESTIMATING CROP YIELD POTENTIAL (continued)
Table 4.5 – Procedure to make yield potential forecasts as the season progresses.Bold values show information that is known.
Stored Growing season rainfall (mm) Crop Yieldsoil water potential
water Apr May Jun Jul Aug Sep Oct Total use forecast(mm) (mm) (kg/ha)
Information available at the start of the growing season
40 23 41 54 53 38 26 19 254 294 2760
Information available May 1
40 12 41 54 53 38 26 19 243 283 2595
Information available June 1
40 12 92 54 53 38 26 19 294 334 3360
Information available July 1
40 12 92 58 53 38 26 19 298 338 3420
Table 4.4. Estimates of water use efficiency and yield potential for the Shire of Mingenew based on estimated crop wateruse, 110 mm of water loss and 15 kg/ha/mm potential water use efficiency.
Year Stored Growing Yield Calculated values:water season
estimate rainfall Crop Yield Water Ratiowater potential useuse efficiency
(mm) (mm) (kg/ha) (mm) (kg/ha) (kg/ha/mm)
1980 0 268.4 1157 268.4 2376 7.3 0.491981 0 333.7 1061 333.7 3356 4.7 0.321982 0 249.3 899 249.3 2090 6.5 0.431983 0 312.7 805 312.7 3041 4.0 0.261984 41.3 363.0 1724 404.3 4414 5.9 0.391985 0.5 211.8 989 212.3 1534 9.7 0.641986 22.4 409.7 1406 432.1 4832 4.4 0.291987 1.6 239.2 1037 240.8 1963 7.9 0.531988 0 353.1 1634 353.1 3647 6.7 0.451989 0 265.6 1534 265.6 2334 9.9 0.661990 52.8 428.6 1744 481.4 5571 4.7 0.311991 76.5 276.6 1759 353.1 3647 7.2 0.481992 15.4 395.5 1752 410.9 4513 5.8 0.391993 0 331.4 2326 331.4 3321 10.5 0.701994 0 250.1 1975 250.1 2102 14.1 0.94
Lowest 0 211.8 805 212.3 1534 4.0 0.26Average 14.0 312.6 1453 326.6 3249 7.3 0.52Highest 76.5 428.6 2326 481.4 5571 14.1 0.94

Factors affecting grain yieldMany factors other than water also influence yield. The
argument used is that water sets the upper limit for yield andthat management is focussed on optimising conditions forgrowth, development and production. However, with widerapplication of this concept, it is soon evident that otherfactors set limits and give rise to alternative yield potentials.
Different soil types often occur within a single paddockand can differ greatly in yield even though growing seasonrainfall is the same. Fertility, structure, topography, sub-surface layers and depth of water penetration contribute tothe variability. While management or agronomy can modifysurface conditions, to give higher yields and water useefficiencies, soil conditions at depth can be difficult tomanage and in the extreme be intractable. Thus, the yieldpotential on some soils can be significantly below the waterlimited yield potential.
Relationship between growingseason rainfall and water use
Water available for plant growth is made up of stored soilwater from summer rain and growing season rainfall. Asgrowing season rainfall is the largest component of availablewater, there is a close relationship between growing seasonrainfall and crop water use. However, water supply is also afunction of infiltration and distribution of growing seasonrainfall in the soil. Run off and deep drainage result in a netloss in available water that tends to increase as rainfall exceedsan optimum level, and waterlogging reduces the efficiency ofconversion of water to dry matter production and yield. Also,depending on rotation, there is often water remaining in thesoil after the previous crop or pasture, indicating lower wateruse than growing season rainfall. Access to this water in thefollowing year often results in water use being higher thangrowing season rainfall in low rainfall years. Thus therelationship between growing season rainfall and water use cannot only deviate from the expected 1:1 line but can also varydepending on soil type.
Remember also that it is generally assumed whenusing the ‘French and Schultz’ equation that the water
loss value of 110 mm is the same in low and high rainfallyears. This translates to an increasing proportion ofproductive to non-productive water use and increasingwater use efficiencies as growing season rainfall andtherefore estimated water use increases (see Table 4.6).The developers of this equation were aware of thisproblem at low levels of growing season rainfall (< 150mm) and provided an alternative estimate of water lossfor these years. PYCAL allows the user to calculate waterloss as a fixed percentage of estimated water use.Reference to the data behind the ‘French and Schultz’equation indicates that the average water loss of 110 mmequates to 1/3rd of average water use. In dry years, waterloss was lower than in wet years.
Universality of the ‘French andSchultz’ equation
When first used, many concerns were expressed as towhether a relationship established in South Australiawould apply within Western Australia. The main concernwas with the north-south variation in length of growingseason and its impact on estimates of crop water use. Workdone to investigate this showed that when allowance wasmade for length of growing season (April to September –north, April to October – central and April to November– south), the equation was robust and applied throughout.
Also, the data that gave rise to the ‘French and Schultz’equation are not unique. Similar data sets are available inthe literature for a wide range of environments. Analyses ofthese data sets show average water loss of the order of 100-110 mm and average water use efficiencies of the order of16 kg/ha/mm. As indicated earlier, the 20 kg/ha/mm wateruse efficiency value in the ‘French and Schultz’ equation,describes the water use efficiency achieved by the highestyielding crops. It is instructive to know that even highervalues are reported in the literature. To reiterate, the issue ismore one of using a consistent target water use efficiencythan one of ‘correctness’. Note also the earlier concerns withusing an apparently unachievable target water use efficiencyof 20 kg/ha/mm. The compromise choice of 15 kg/ha/mmis now often exceeded with improved management.
These and other concerns with procedure used toestimate yield potential and water use efficiency relate tolikely effects on the components of the ‘French and Schultz’equation. These are addressed in the ‘crop monitoring’programs included in applications that use the ‘French andSchultz’ equation. The aims are twofold. Firstly to learnabout the processes involved in growth, development andproduction, and to develop benchmarks along the way.Secondly, to have information at hand to interpretdifferences between achieved and target yields and water useefficiencies. Then, should this information be inadequate,further steps can be taken to resolve the problem. It isimportant that the interpretive process can distinguishbetween issues that are manageable and those that are not.For example, on some soils, yields and water use efficienciesmay never improve beyond say 50% of target values.
CHAPTER 4 – CROP WATER USE THE WHEAT BOOK
66
ESTIMATING CROP YIELD POTENTIAL (continued)
Table 4.6 – Water use efficiency, calculated asyield/water use, varies with the level of water use.
Yield is calculated from the formula:Yield = (Water use – 110) x 15
Water use Yield Yield/water use(mm) (kg/ha) (=WUE)
(kg/ha/mm)
150 600 4.0200 1350 6.8250 2100 8.4300 2850 9.5350 3600 10.3
Anderson, W.K. (1992). Increasing grain yield andwater use of wheat in a rainfed mediterranean-typeenvironment. Australian Journal of Agricultural Research 43,1-17.
French, R.J., and Schultz, J.E. (1984a). Water useefficiency of wheat in a mediterranean-type environment.I. The relation between yield, water use and climate.Australian Journal of Agricultural Research 35, 743-64.
French, R.J., and Schultz, J.E. (1984b). Water useefficiency of wheat in a mediterranean-type environment.II. Australian Journal of Agricultural Research 35, 765-75.
Gregory, P.J., Tennant, D., Hamblin, A.P., andEastham, J. (1992). Components of the water balance onduplex soils in Western Australia. Australian Journal ofExperimental Agriculture 32, 845-55.
Gregory, P.J., Tennant, D., and Belford, R.K. (1992).Root and shoot growth, and water and light use efficiencyof barley and wheat crops grown on a shallow duplex soilin a Mediterranean-type environment. Australian Journalof Agricultural Research 43, 555-73.
Hamblin, A., Tennant, D. and Perry M.W. (1987).Management of soil water for wheat production inWestern Australia. Soil Use and Management 3, 63-69.
Perry, M.W. (1987). Water use efficiency of non-irrigated field crops. In ‘Agronomy 1987 – Responding tochange’, Proceedings of the 4th Australian AgronomyConference, LaTrobe University, Melbourne, Victoria,August 1987.
Siddique, K.H.M., Tennant, D., Perry, M.W., andBelford, R.K. (1990). Water use and water use efficiency ofold and modern wheat cultivars in a mediterranean-typeenvironment. Australian Journal of Agricultural Research 41,431-437.
Stephens, D.J., and Lyons, T.J. (1998). Rainfall-yieldrelationships across the Australian wheatbelt. AustralianJournal of Agricultural Research 49, 211-23.
THE WHEAT BOOK CHAPTER 4 – CROP WATER USE
67
FURTHER READING

CHAPTER 4 – CROP WATER USE THE WHEAT BOOK
68

Chapter Coordinator: M.D.A. BollandWheatbook 1 authors: M.D.A. Bolland, J.W. Bowden, R.F. Brennan,J.W. Gartrell, M.G. Mason, W.M. Porter, G.S.P Ritchie and P.F. White.Revised by: M.D.A. Bolland, R.F. Brennan, J.W. Bowden, M.G. Mason, N.K. Edwards, M.M. Riley, S.W. Gartrell.
Nutrition ........................................................................................................71Uptake mechanisms ..............................................................................................71
Important Chemical Properties ofWheat Growing Soils in Western Australia ....................................................73Authors: M.D.A. Bolland and J.W. Bowden
Constituents of the soil ........................................................................................73Retention of nutrient elements by soils..................................................................74Adsorption in soils ................................................................................................76Soil pH ..................................................................................................................77pH buffering capacity ............................................................................................77
Phosphorus ....................................................................................................79Fertiliser phosphorus ............................................................................................79The fate of applied phosphorus ............................................................................81Phosphorus fertiliser for wheat production ..........................................................81Residual phosphorus ............................................................................................83Erosion and leaching..............................................................................................84Seed phosphorus ....................................................................................................84Rock phosphate......................................................................................................84Calculating the most profitable amount of phosphorus to apply ........................85
Nitrogen ..........................................................................................................87Plant deficiency symptoms ....................................................................................87Nitrogen in the soil ..............................................................................................87Distribution of nitrogen deficiency ......................................................................88Nitrogen requirement ..........................................................................................88Deciding on the rate of application ......................................................................88Sources of nitrogenous fertiliser ............................................................................89Time of application ..............................................................................................90Methods of application ........................................................................................90Grain protein ........................................................................................................90Effect on soil pH ..................................................................................................91
Potassium ........................................................................................................92Role ......................................................................................................................92Soil type ................................................................................................................92Rainfall ..................................................................................................................92Management ........................................................................................................92Symptoms ............................................................................................................92Soil levels ..............................................................................................................92Potassium fertiliser ................................................................................................93Treatment ..............................................................................................................93
THE WHEAT BOOK CHAPTER 5 – NUTRITION
69
CHAPTER FIVE
NUTRITION

CHAPTER 5 – NUTRITION THE WHEAT BOOK
70
Sulphur ............................................................................................................94Symptoms ............................................................................................................94Treatment ..............................................................................................................94Diagnosis ..............................................................................................................94
Copper..............................................................................................................95Distribution of copper deficient soils ....................................................................95Copper in wheat plants..........................................................................................95Factors influencing uptake by wheat plants ..........................................................95Symptoms of deficiency ........................................................................................95Degrees of copper deficiency..................................................................................96Treatment ..............................................................................................................96Soil and tissue levels ..............................................................................................97Grain ......................................................................................................................97
Zinc ................................................................................................................98Zinc functions ......................................................................................................98Distribution of zinc deficiency ..............................................................................98Symptoms of zinc deficiency ................................................................................98Treatment ..............................................................................................................98Residual effectiveness..............................................................................................99Soil and tissue levels ..............................................................................................99Soil tests..................................................................................................................99Zinc in grain ..........................................................................................................99
Manganese ....................................................................................................100Manganese in wheat ............................................................................................100Manganese in the soil ..........................................................................................100Symptoms ..........................................................................................................100Plant tissue levels ................................................................................................100Soil testing ..........................................................................................................100Manganese concentration in grain ......................................................................101Treatment ............................................................................................................101Role of manganese nutrition and take-all ..........................................................101
Molybdenum ................................................................................................102Molybdenum in plants ......................................................................................102Molybdenum in the soil ....................................................................................102Symptoms ..........................................................................................................102Treatment ............................................................................................................102Residual value ......................................................................................................103Tissue tests ..........................................................................................................103Soil test ................................................................................................................103Molybdenum in grain ........................................................................................103
Boron ............................................................................................................104Background ........................................................................................................104Symptoms of boron toxicity ..............................................................................104Genotypic variation ............................................................................................104Assessment ..........................................................................................................105
Nutrient Removal in Wheat Crop Products ................................................106Maintenance ........................................................................................................106

For profitable grain production, wheat plants requireboth the macro-nutrient element’s carbon, oxygen,hydrogen, nitrogen, phosphorus, sulphur, potassium,calcium, and magnesium, and the micro (minor)-nutrient elements, commonly called trace elements;copper, zinc, manganese, iron, molybdenum, boron andchloride. Cobalt is known to be required for legumes,but may also be required for wheat. All plants need waterwhich is taken up by plant roots from the soil. Carbon islargely taken up by leaves from the atmosphere as carbondioxide. Oxygen is also taken up by leaves from theatmosphere. Hydrogen is mostly derived from watertaken up by plant roots from the soil. All the othernutrient elements are taken up by plant roots from thesoil; the rest of this chapter considers these nutrientelements taken up from the soil.
The wheat plant combines nutrients absorbed throughthe roots with the carbohydrates made duringphotosynthesis to form new tissues. Duringphotosynthesis, which largely takes place in leaves, plantsuse solar energy to convert carbon dioxide and water tocomplex organic molecules, which are carbohydrates;oxygen is a by-product which is returned to theatmosphere via the leaves. Further reactions in the plantuse the carbohydrates to: (1) obtain energy for growth anddevelopment, a process called respiration, involvingoxygen taken up by leaves from the atmosphere; carbondioxide is a by – product returned to the atmosphere viathe leaves; (2) form amino acids and proteins bycombining the carbohydrates with nitrogen taken up fromthe soil.
Plant roots have evolved to take up water and nutrientelements from the soil; leaves have evolved to take up andreturn carbon dioxide and oxygen to the atmosphere, andto return water vapour, derived from the water taken up bythe plant roots from the soil, to the atmosphere.Consequently, except for carbon dioxide and oxygen,uptake of nutrient elements from leaves is usually minor.However, copper, zinc, manganese and molybdenum,which are minor nutrients required in much smalleramounts and which can improve profitable grain yields iftaken up by plants before flowering, can be sprayed ontowheat crops to be taken up by the leaves. This is usuallyonly done if tissue tests of crops, measured using tissuesamples collected before flowering, indicate deficiency mayreduce grain production at the end of that growing season.The crops are sprayed because in the case of these elementsprofitable grain yield increases can be obtained if deficientcrops are sprayed before flowering and grain formation.Spraying will be discussed later when each of theseelements is considered in more detail.
For the nutrient elements taken up by the soil, the ‘lawof the minimum’: ‘the yield of the plant is limited by adeficiency of any one essential nutrient, even though allothers are in adequate supply’, first proposed by von Leibigin about 1862, was a major step in helping to understand
the effects of these nutrients on plant growth and the needfor fertiliser applications.
Roots take up (absorb) nutrients from the soil solution.That is, all the nutrient elements taken from the soil areabsorbed in a water-soluble form by roots. Therefore, theconcentration of nutrients in the soil solution determinesthe rate of uptake.
Uptake of nutrient elements from the soil and intoplants depends on:
the availability of the nutrient in the soil;movement of the nutrient, in soil solution or along thesurfaces of soil constituents, to the root surface;growth of roots through the soil thereby interceptingnutrient elements released to solution from soilconstituents or from soil organic matter;uptake of nutrient into the root; andtranslocation of nutrients from root to shoot, leaves,flowers and grain.
Uptake mechanismsMass flow
During the day, when the plant is turgid and has accessto soil water, plants transpire water. In this process, water isevaporated from leaves when structures in the leaves calledstomata are open. The stomata are usually closed duringthe night, or during the day when the plants are not turgidbecause they cannot get sufficient water from dry soil.When the plants are transpiring, water is drawn all the wayfrom the soil to the leaves to replace the water evaporatedto the atmosphere. The water is dragged in a continuousstream from the soil to plant roots and then through thewater – conducting vessels in plants (xylem) to theevaporating surfaces in the leaves. This stream of water iscalled the transpiration stream or mass flow, and it isinitiated and driven by transpiration of water through theopen stomata in the leaves.
Nutrient elements that are soluble and so mobile in soilsolution are largely transported through the soil to plantroots by mass flow. Therefore, the supply of soluble andmobile nutrients such as nitrate, calcium, magnesium andsulphate, to the root surface in moist soils is largely by massflow.
Diffusion /concentration gradientLess soil-mobile nutrients (potassium) move to plant
roots along a concentration gradient by a process calleddiffusion. Concentrations of these elements are usuallylower at root surfaces as roots absorb the nutrients fromsolution and so the concentration of the elements issmallest near the portion of the roots where uptake into theplant is occurring, and is greater away from the plant roots.Because there is more of the element away from the root,most of the elements will move to the root. Therefore, thenet flow of the element in soil solution is from high to lowconcentration and so toward the root, hence the termconcentration gradient.
THE WHEAT BOOK CHAPTER 5 – NUTRITION
71
NUTRITION
Root interceptionFor very insoluble nutrients that have very low
concentrations in soil solution (phosphorus, copper, zinc),movement to roots by mass flow and diffusion is too slow.Plant roots obtain these elements by growing through thesoil and so intercepting zones of soil with reasonablequantities of the elements in solution that are inequilibrium with insoluble forms of the elements veryclose by in the soil. As the plant roots absorb the solubleforms of these very insoluble elements from solution,more of the element dissociates or dissolves from theinsoluble forms in the soil very close by the root toreplenish the soluble form of the element taken up byplant roots. All insoluble forms of all elements will dissolveto a certain extent to maintain a concentration of theelement in solution, as determined by the solubility of thecompounds involved. In addition, nutrient elementsreturned to the soil as organic matter are food for a host ofsoil organisms (soil animals, fungi, bacteria, algae,protozoa). These organisms process the organic matter,changing it physically and chemically, to eventually returnnutrient elements to soil solution where they can be takenup by plant roots.
Factors affecting uptakePlant roots take up nutrient elements from soil solution
selectively, and accumulate them at a higher concentrationwithin the plant than in the soil solution. This requires
energy which is derived by respiration using carbohydratesmade during photosynthesis.
Soil and environmental stresses that either limit theenergy available for uptake (low solar radiation, due tocloud cover and lower solar radiation from the sun duringmid winter compared with autumn and spring; lowtemperatures in mid winter; and waterlogging) or reducethe availability of the nutrient at the root surface (dry soil,compaction, low fertiliser supply, reduced root growth dueto aluminium toxicity caused by soil acidification, orpruning of roots by pests,diseases and hebicides), willtherefore restrict the uptake of nutrients and reduce thegrowth of the plant.
Topics considered in the ChapterThis chapter looks at those chemical features of
Western Australian soils which affect nutrient supply andexamines the nutrients of greatest importance to a wheatcrop in these soils: phosphorus, nitrogen, sulphur,potassium, copper, zinc, manganese, molybdenum. Noyield responses of wheat have been measured in WesternAustralia to applications of fertiliser calcium, magnesium,iron, boron or cobalt, so these elements are not consideredfurther in this chapter. Boron toxicity is a problem forwheat in some alkaline, saline soils in low rainfall areas ofWestern Australia, so boron toxicity is discussed. Soilacidification, and ways to minimise its effects on reducinggrain yields of wheat are also considered.
CHAPTER 5 – NUTRITION THE WHEAT BOOK
72
NUTRITION (continued)

M.D.A. Bolland and J.W. BowdenIt is the chemical properties of soils that affect nutrient
availability. The materials that constitute the soil determinethe chemical properties.
Constituents of the soilThe soil components are either inorganic or organic.
Inorganic componentsAll the mineral constituents of soils are originally
derived from igneous rocks which were formed by thesolidification of molten magma. Silicon, oxygen,aluminium, iron, calcium, sodium, potassium andmagnesium compose 98% of igneous rocks. Otherelements (including phosphorus and minor elements)make up the remainder. As the magma cools and formsrocks, minerals begin to form and crystallise. Differenttypes of minerals will form depending on the relative mixof elements in the magma and the conditions under whichit cools. The type of minerals that are formed will largelydetermine the type of soil formed.
Other processes, including geological pressures andreformations, and the extent of weathering of rocks by theclimate (temperature, rain and wind), are also important inthe formation of particular soils. Two other types of rocksare formed from igneous rocks. These are metamorphicand sedementary rocks. Igneous rocks can be subject topressures as the surface of the earth is bent and twisted toform mountains and valleys. In the process the igneousrocks are altered to form metamorphic rocks. In addition,material from both the igneous and metamorphic rocks areeroded by wind and/or water to another location and theredeposited material forms sedementary rocks.
Soils are formed from igneous, metamorphic andsedementary rocks as a result of changes to the rocksexposed at the earth’s surface caused by weather(temperature, wind, rainfall), and eventualy by organismsand plants growing in and on the soils.
The mineral components of a soil are present as sand,silt, clay, together with crystalline (structured) andamorphous (not structured) oxides. Amorphous oxides arechemical compounds arranged in a disorganised manner;they are like a solidified jelly rather than the crystallinestructures of sand, silt, clay and crystalline oxides. Theparticle size ranges from 50 µm and 2 mm for sand, 2 µmto 50 µm for silt and less than 2 µm for clay. The size of thecrystalline and amorphous oxides range from smaller thana clay particle to larger than a sand particle. Oxides of ironand aluminium, often called sesquioxides, are the mostimportant in most Western Australian soils used to growwheat. These oxides exist as discrete particles, as well ascoatings on the sand, silt and clay particles. Ironstonegravels are a conglomeration of iron and aluminium oxidesand have low surface areas. The iron oxides are largelyresponsible for the yellow, red and brown colours of soils,
colouring sand, clay and silt particles. The iron andaluminium oxides can act as cements to bind other soilparticles together, and play a major role in adsorption ofnutrient elements, particularly phosphorus, sulphur,copper, zinc, manganese and molybdenum.
The major clay in most Western Australian soils iskaolinite, comprising an aluminium oxide joined to asilicon oxide (an alumina octahedral layer (gibbsite) isjoined to a silica tetrahedral layer). Several of these bilayerstructures are joined to form stacks, that are the basicstructure of the clay. In its pure form, kaolinite is white incolour; very pure white deposits of kaolinite occurnaturally in Western Australia, such as near the town ofGreenbushes in the south west. However, most naturalkaolinite in Western Australian soils is stained yellow,brown and red due to the presence of iron (responsible forthe colour) and aluminium oxides, as coatings or as discreteparticles.
Organic matter, usually present near the soil surface, islargely responsible for brown and black to grey colours insoils.
The surfaces of many of the inorganic soil constituentsposseses both positive and negative charge sites. This isparicularly so for the clays and oxides. Most nutrientelements exist in soil solution as charged species, calledions, which can balance, and so neutralise, the surfacecharges. The positive ions are called cations, and thenegative ions are called anions. In this way, the nutrientelements are retained by the surfaces of the inorganic soilconstituents, and the soil is said to have a cation (positiveions retained) or anion (negative ions retained) exchangecapacity. The word exchange is used because the ions thatbalance the surface charge can be replaced by other ions ofthe same charge. For example, positive calcium ions(cations) balancing the negative surface charge sites can bereplaced by potassium or ammonium cations. In addition,many ions and molecules that exist in the soil solution,including some nutrient elements, chemically react withother ions or molecules in soil solution to form insolublecompounds that precipitate out of solution as the solubilityproduct of the compounds involved are exceeded. Thisprocess is called precipitation. Alternatively, many ions andmolecules in the soil solution chemically react withchemically unstable, and so chemically reactive ions andmolecules exposed at the surfaces of the inorganic soilconstituents to form more stable, insoluble compounds atthe surface. This process is called adsorption. Chemicals(ions and molecules) can be adsorbed by soil surfaces thathave no electrical charge or have a charge of the same signas the chemical in question or have an opposite charge. Inaddition to cation or anion exchange capacities of soils,adsorption is another way nutrient elements in soilsolution can be retained by inorganic soil constituents.Precipitation and adsorption are similar reactions thatoccur at the same time, but adsorption occurs at a solidsurface. In practise it is difficult to differentiate between
THE WHEAT BOOK CHAPTER 5 – NUTRITION
73
IMPORTANT CHEMICAL PROPERTIES OF WHEAT GROWING SOILSIN WESTERN AUSTRALIA

precipitation and adsorption reactions, so both reactionsare collectively called sorption, and both are thereforeconsidered as ways nutrient elements are retained by soils.
The clay fraction and the crystalline and amorphousoxides have the largest impact on both the chemical andphysical properties of the soil. This is because theseparticles have a very large surface area to volume ratio. Asmall percentage of, for example, clay in the soil representsa large surface area. Many of the chemical processes in thesoil involve interaction with the surfaces of clay particlesand also the smaller crystalline and amorphous oxides.
Organic componentsWhen fresh organic materials are added to a soil they
are decomposed by soil organisms to ultimately formcarbon dioxide and simple inorganic salts. This is becausesoil organic matter is a source of food for many of these soilorganisms, including earthworms, soil insects, fungi, algae,bacteria and protozoa. Some of these physically break upthe organic matter to smaller components; others bothphysically and chemically alter it. In the process, nutrientelements are released from the organic matter to soilsolution, a process called mineralisation, and so can betaken up by plant roots. However, the soil organisms neednutrient elements to live, and so remove some elementsfrom soil solution and from the organic matter they areprocessing and incorporate them into their bodies. Most ofthese elements end up as soil organic matter. In this casethe nutrient elements are rendered unavailable to plants, aprocess called immobilisation.
Complete decomposition of soil organic matter is acomplex process that proceeds over a long time. Somematerials are quickly broken down (such as plant sugarsand proteins) while some are very resistant todecomposition (for example plant lignin).
Decomposition of organic matter proceeds step by stepso that a group of organisms, such as a group of bacteria,may use a particular organic substance, converting it intointermediary compounds which are subsequently actedupon by another type of bacteria, and so on. Theseintermediary compounds are called humus. Humus is abrown to black material. It is a stable fraction of the organicmatter in the soil, being broken down only slowly.
Soil organic matter therefore comprises a series ofcompounds ranging from undecomposed plant (cropstubbles) and animal tissue, including urine and faeces ofsoil animals and animals grazing at pasture, todecomposing humus. Soil organic matter consists ofcompounds of carbon, oxygen, hydrogen, nitrogen,sulphur, potassium, and phosphorus. It also containscalcium, magnesium, sodium, and minor nutrientelements (copper, zinc, manganese, molybdenum, ironetc.). These elements are all eventually released in solubleforms to soil solution and so can be taken up by plants(mineralisation). Soil organic matter helps to bindinorganic soil particles (mainly clays and oxides) together,
thereby improving soil structure. Organic matter haspositive and negative charge sites on the surface, and so hasan anion and cation exchange capacity, which can retainnutrient elements. The negative charge sites usuallydominate, so the net surface charge of organic matter isusually negative, so the cation exchange capacitydominates. In addition, ions and molecules are adsorbedonto the surfaces of organic matter. This incudes iron andaluminium, which in turn can further adsorb other ionsand molecules from soil solution. In addition organicmatter forms a range of different compounds with manyelements, such as copper and zinc, which can affect thesupply of these elements to soil solution and so for plantuptake.
Retention of nutrient elements bysoils
This section considers retention of nutrients by soil ingreater detail.
Exchangeable cations and anionsThe surfaces of inorganic and organic soil constituents
have negative and positive charge sites which are balancedby cations and anions from soil solution. The cation andanion exchange capacities of soils provide a measure of themagnitude of the negative and positive charges of the soilssurfaces as measured by the amount of cations and anionsthat balance the charge.
Some cations and anions exist in soil solution as simpleions. Examples of simple cations are sodium, potassium,magnesium, calcium and ammonium; examples of simpleanions are chloride and nitrate. These ions are relativelychemically stable in solution in the simple form and sohave little need to chemically react to achieve greaterchemical stability. But they do neutralise charges presenton the surfaces of soil constituents and so are retained bythe soil as surface charge balancers.
Other ions (phosphate, molybdate, zinc, copper) arenot chemically stable in solution, and achieve greaterstability by reacting with ions and molecules in solution(precipitation) or on the surfaces of soil constituents(adsorption) to form more complex, insoluble, more stablecompounds, achieving greater chemical stability for all thereacting species. Simple ions are frequently invoved inthese reactions. For example phosphate ions in soil solutionreact with calcium ions in solution to form precipitates ofcalcium phosphates. Simple ions are often co-adsorbedwith adsorbing ions or molecules. For example, zinc isfrequently adsorbed onto positively charged iron oxidesurfaces in association with the chloride ion, as the singlepositively charged ZnCl+ ion, instead of the doublycharged Zn2+ ion that is more strongly repelled by positivesurface sites. Consequently the ZnCl+ ions arepreferentially adsorbed by positively charged surface sites,and Zn2+ is preferentially adsorbed by negatively chargedsurface sites.
CHAPTER 5 – NUTRITION THE WHEAT BOOK
74
IMPORTANT CHEMICAL PROPERTIES OF WHEAT GROWING SOILSIN WESTERN AUSTRALIA (continued)

Much of the cation exchange capacity of the light sandysoils in Western Australia therefore depends on the organicmatter content of the soils. An organic carbon content of1% is equivalent to about 2% organic matter and couldprovide 4 meq/100 g of soil. This would be equivalent toabout 160 mg of potassium per 100 g of soil or 2,400kg/ha per 10cm depth, if the exchange capacity onlycontained potassium.
For cations that just balance negative surface charge onsoil surfaces, the strength of binding of the cations to thesenegatively charged surfaces sites depends on the nature ofthe surfaces, the magnitude of the charge on the ions, andsize of the ions.
Cations with a single positive charge, such as sodium,potassium and ammonium, are less strongly retained to anegatively charged surface site than double-charged cationssuch as calcium and magnesium. Likewise, triple-chargedaluminium ions are more strongly retained by the negativesurface charge than double-charged calcium ions or single-charged sodium ions.
In solution, water molecules and cations and anions co-exist. Water molecules are dipolar, similar to a magnet,with one end of the water molecule being slightly negative(near the oxygen atom of the water molecule) and theother end is slightly positive (near the two hydrogen atomsthat also make up the water molecule). So water moleculesare attracted to both cations and anions; the positive end isattracted to anions and vice versa. Therefore, in solution,both cations and anions attract water molecules, but somedo so more strongly, depending on the surface density ofthe charge and the magnitude of the charge. For example,the sodium and potassium ions both have one positivecharge. But the potassium ion is bigger and so has a lowerdensity of charge on its surface (charge per unit surfacearea) than the smaller sodium ion. So sodium ions attractwater molecules more strongly. The water molecules thatare attracted to (hydrate) the potassium ions are more easilydisplaced (less energy is required to remove the hydratedwater molecules), so more potassium ions can get close tothe surface and completely neutralise the negative surfacecharge. Thus, if the concentration of sodium andpotassium ions in soil solution is the same, more potassiumions will balance the surface charge because the potassiumions are less hydrated.
Water molecules are more strongly attracted tomagnesium ions than to sodium ions. Both these ions areabout the same size, but the magnesium ion has twopositive charges and the sodium ion has one. So themagnesium ion has a greater surface density of charge andso is more strongly hydrated (the water molecules aroundthe magnesium ions are more strongly held to magnesiumions than the water molecules around sodium ions).However, the double-charged magnesium ions are alsomore strongly attracted to negative surface charge sites thanthe single-charged sodium ions. Consequently, despitebeing more hydrated, more magnesium ions balance thesurface charge.
THE WHEAT BOOK CHAPTER 5 – NUTRITION
75
IMPORTANT CHEMICAL PROPERTIES OF WHEAT GROWING SOILSIN WESTERN AUSTRALIA (continued)
There are two types of charge on soil surfaces:A permanent negative charge on clay minerals –resulting from the replacement of cations of lowercharge into positions in the clay crystals normallyoccupied by cations of higher charge. For example, thetriple-charged aluminium ion often substitutes for thequadruple-charged silicon ion in the clay crystal. Thisleaves the crystal with a net negative charge. Thedouble-charged magnesium ions often substitute forthe aluminium ion in parts of the aluminium-silicaminerals also creates a permanent negative surfacecharge.A variable surface charge is generated by the adsorptionor desorption of hydrogen ions onto or from the soilsurface. Hydrogen ions are positively charged so theiradsorption increases the magnitude of the positivesurface charge. Desorption of hydrogen ions has theopposite effect. The adsorption or desorption ofhydrogen ions onto or from the surface, and thereforethe sign and magnitude of the variable surface charge,depends on soil pH, the concentration of other ions insolution and the nature of the soil surface. This type ofcharge is common on the surfaces of iron andaluminium oxides, and on the edges of clay crystals.Both types of surface charges are balanced by retaining
anions or cations from soil solution.In practice, there is a mixture of permanent and
variable charge sites on the surfaces of soils, and even onthe same surface. For example, the negative surface chargeof kaolinite clay, the major clay in Western Australian soils,comprises both types of charge sites; the positive chargesites on kaolinite are variable surface charge sites. Someidea of the size of the cation exchange capacity (estimatingthe magnitude of the negative charge sites on the surfaces)on various surfaces is given in Table 5.1. Compared toother clay minerals, kaolinite has a very low cationexchange capacity (1 to 2 meq/100 g of soil, see Table 5.1),so even if kaolinite occurs as high as 10% in a soil, itprovides very little cation exchange capacity.
Mineral Charge(meq/100 g)†
Illite 10-40Vermiculite 130-150Kaolinite 3-15
Montmorillonite 90-110Organic matter 200 (pH > 4)
Iron oxides 10
Table 5.1. – Cation exchange capacity (permanentnegative charge) of some soil constituents
† Units: Milli-equivalents per 100 g, which is the same as cmoleper kg.

Calcium, magnesium, sodium, potassium andammonium ions will be least mobile in soils with a highcation exchange capacity. This would include organically-rich soils or soils with high clay contents. The same cationswould be leached from siliceous sands and gravels or soilswith only kaolinite clay, particularly in soils with loworganic matter.
The strength of retention of cations to soil determineswhich chemicals are present in a soil. For example, singlesuperphosphate, containing 20% calcium, has beencommonly used for subterranean clover-pastures growingon very sandy soils in high rainfall (greater than 600 mmannual) areas in Western Australia. These soils have lowcation exchange capacities, and the calcium fromsuperphosphate frequently displaces (exchanges with)naturally occurring soil potassium. Therefore, as moresuperphosphate has been applied to these soils, thedisplaced potassium is leached and the soils can becomepotassium deficient. As a result, the clover grows poorly,producing little seed, and fails to persist and disappears.
The success of using gypsum as a soil conditionerdepends in part on the ability of calcium to exchange(replace) sodium on the charged surfaces of the soil.
Adsorption in soilsThe chemistry of soil is the chemistry of the
partitioning of substances between the gaseous, the solidand the solution phases. Partitioning between the solid andsolution phase is the major process for most agriculturallyimportant chemicals (fertilisers, herbicides, pesticides,fungicides, and soil amendments, such as lime to cure soilacidity and gypsum to improve soil structure).
There are two main processes that control thepartitioning between solid and solution. They areprecipitation and adsorption.
Precipitation is determined by solution conditions (thesolubility of the precipitating element) and can occurwithout the presence of a solid phase.
Adsorption occurs at solid surfaces and can be thoughtof as surface-induced precipitation because adsorbingsubstances do not leave solution unless an adsorbingsurface is present. Both processes are important methods ofretaining nutrient elements resulting from chemicalreactions of ions and molecules in soils, either in solutionor on the surfaces of soil constituents. Neither reaction canbe distinquished and so both processes are called sorption
A soil with a low sorption capacity for a nutrient willattain high solution concentrations at relatively low inputsof that nutrient. This means that fertiliser will be moreefficient on a low adsorbing soil than on a high adsorbingsoil where more nutrient is required to reach the sameyield.
The system becomes more complicated for leachingsoils because such losses will be greatest on the soil whichhas the lower sorbing capacity.
Thus, sorption is a two-edged sword, reducing leaching
losses yet increasing the amount of fertiliser needed to growprofitable crops and pastures.
As more of a nutrient is added to a soil, then thecapacity of the soil to adsorb the nutrient usually decreases.There are two possible reasons for this. Firstly, when a soilis newly cleared and developed for agriculture andfertilisers are applied for the first time, nutrient elementsare initially adsorbed onto the most chemically reactivesorption sites that retain the nutrient more strongly so it isless readily leached or available to plants. These sites aresaturated first. In time, as more of the nutrient is added tothe soil, so a greater proportion is adsorbed onto lessreactive sites which retain the nutrient less strongly soproportionally more is leached and available to plants. Thesecond reason concerns changing the surface charge byadsorbing charged anions or cations. For example,phosphorus is usually adsorbed as phosphate anions whichare negatively charged. Like all adsorbing species, it isadsorbed by surfaces with either positive, negative or nocharge sites. But regardless, when the phosphate ion isadsorbed, it takes its negative charge onto the surface andso increases the negative charge of the surface. So as morephosphate is added to the soil, the adsorbed phosphateincreases the negative charge of the soil, increasinglyrepelling negative phosphate ions in solution and somaking it more difficult to adsorb further phosphate.Likewise adsorption of copper and zinc ions, which arepositively charged, increases the positive charge on the soilsurface, making it more difficult to adsorb furtheradditions of copper and zinc, but increasing adsorption ofnegative phosphate ions. So increasing adsorption ofphosphate ions due to increasing additions of fertilisermakes it more difficult to adsorb anions, such asmolybdate, sulphate, fluoride and further additions ofphosphate, but increases adsorption of cations such ascopper, zinc, cadmium, cobalt and lead. Adsorption ofcations (copper, zinc) has the opposite effect. This trend ismore obvious when large amounts of nutrient are requiredregularly (e.g. phosphorus, which is usually appliedannually), but is less obvious when smaller amounts offertiliser are required less frequently (e.g. copper and zinc).
Chemicals (ions and molecules) can be adsorbed by soilsurfaces that have no electrical charge or have a charge ofthe same sign as the chemical in question or have anopposite charge. Phosphorus, molybdenum, and sulphatewill adsorb strongly to soils high in iron and aluminiumoxides, and particularly on such soils with relatively highclay contents (wodgils, forest gravelly loams, karri loams).They will only be mobile on siliceous sands and organic(peaty) sands. Copper, zinc and cobalt are immobile andnot readily leached on siliceous sands because theseelements adsorb onto silicates that make up sand particles.Copper, zinc and cobalt adsorb strongly onto iron andaluminium oxides and clay minerals of all types. Theseelements precipitate from solution in neutral to high pHconditions, so they are immobile in heavy wheatbelt soilsand calcareous sands.
CHAPTER 5 – NUTRITION THE WHEAT BOOK
76
IMPORTANT CHEMICAL PROPERTIES OF WHEAT GROWING SOILSIN WESTERN AUSTRALIA (continued)

Soils are a mixture of mineral and organic matter, someof which have large, chemically reactive surface areas.These surfaces are in contact with both air and water. Thewater contains many compounds and chemicals that canbind to the soil surfaces.
The soil particle surfaces can be classified into:Mineral: which can be crystalline and/or amorphousand either electrically charged or uncharged.Organic: which can be alive (biomass), freshly dead, orlong dead (humus), which too can be charged oruncharged.The chemicals of agricultural interest in soil solution
can be simple or complex, organic or inorganic, and eitheruncharged, or carry a positive (cation) or negative (anion)charge.
The sources of the materials in soil solution are:weathering and breakdown of soil minerals; forexample iron, aluminium, sodium;exudates and breakdown products of plant microbesand animals;gaseous inputs and salts in rainfall; andfertilisers and other human inputs; for examplephosphatic fertiliser, trace elements, herbicides andpollutants.Soil systems are very complex adsorbing systems
because the materials in solution can react with some of thesoil surfaces and with each other.
Soil pHSoil pH is a measure of the concentration of hydrogen
ions (H+) in soil solution. It is expressed as the negative logof the hydrogen ion concentration in solution to create asimple scale of 1 to 14. A pH of 7 is neutral; pH values lessthan 7 are acidic; pH values greater than 7 are alkaline. SoilpH is a measure of the relative proportions of acidity andalkalinity in the soil solution. The pH is equal to 7 whenthere are equal amounts of acidity (hydrogen ions) andalkalinity (hydroxyl ions) in solution. If there are morehydrogen ions than hydroxyl ions, the pH is less than 7and a soil is acidic. If there are more hydroxyl ions thanhydrogen ions, the pH is greater than 7 and the soil isalkaline.
The pH of a soil is usually determined by measuringthe pH of a soil/liquid suspension. The liquids
commonly used include water or solutions of calciumchloride. Calcium chloride is now used in WesternAustralia.
However, the pH of a soil depends on the type andconcentration of cations in the soil solution and so theconditions under which pH determinations are made mustbe specified if their value is to be interpreted correctly. Forexample, a soil pH of 5.0 measured in a soil/watersuspension would prevent the nodulation of subterraneanclover whereas no problem would be observed for a soil asacid as 5 if the pH had been recorded using a soil/calciumchloride suspension.
The soil to solution ratio used to measure pH can vary;a ratio of 1 part soil to 5 parts 0.1 M calcium chloride isused in Western Australia.
pH buffering capacityBoth hydrogen and hydroxide ions adsorb onto the
surfaces of soil constituents. The amounts of hydrogen andhydroxide ions retained on soil surfaces are not determinedby pH measurements, which measures the concentrationof hydrogen ions in soil solution. The amounts of eitherhydrogen or hydroxide ions adsorbed are often referred toas the pH buffering capacity of the soil because theydetermine the ability of the soil to resist changes in pH. Forexample, if there are hydrogen ions on surface sites andlime is added to the soil, then hydrogen ions from surfacesites will move into solution to resist the change in pHbeing brought about by the reaction of lime with solublehydrogen ions (those in soil solution). This process isshown in Figure 5.1.
The pH buffering capacity of a soil is related to itscation exchange capacity. Soils with high exchangecapacities have a greater ability to retain hydrogen ions andhence have a higher pH buffering capacity.
Many of the sandy (light) soils in Western Australiahave low cation exchange capacities and pH bufferingcapacities. The total amount of hydrogen ions in a soil,which includes the amount of hydrogen ions in soilsolution (measured by soil pH) or retained on the surfacesof soil constituents (estimated from the pH bufferingcapacity of the soil), determines soil acidity. The totalamount of hydrogen ions in a soil is also measured bytitrating a soil suspension with alkali and is called titratable
THE WHEAT BOOK CHAPTER 5 – NUTRITION
77
IMPORTANT CHEMICAL PROPERTIES OF WHEAT GROWING SOILSIN WESTERN AUSTRALIA (continued)
Figure 5.1
pH buffering.

acidity. Titratable acidity also determines the extent of rockphosphate dissolution in soils, and therefore how effectiverock phosphates are likely to be for providing phosphorusfor plants growing in that soil.
Soil pH can affect the supply of nutrient elementspresent in the soil for plant uptake. For example, as the pHof the soil is increased by adding lime, then copper, zincand manganese are less soluble in solution so theyprecipitate out of solution, and/or adsorption of theseelements by the soil is increased. Therefore, lowerconcentrations of these elements occur in soil solution andso less is available for plant uptake. By contrast,molybdenum becomes more available to plants as soil pHis raised. This is because molybdenum becomes moresoluble and so more dissolves from insoluble sources in thesoil and less molybdenum is adsorbed by the soil.Therefore, just like hydrogen and hydroxyl ions, mostnutrients in the soil are also distributed between solubleforms in the soil solution and solid forms as shown inFigure 5.2. As the pH of a soil changes the relativeproportion of the forms that a nutrient exists in will changewhich can alter the availability of a nutrient to plants (seeFigure 5.3).
Fewer soil organisms exist in the soil as the soil pH(calcium chloride) decreases below about 5.0 or increasesabove 8.0.
Consequently, the pH of a soil has a significant effecton soil fertility because it can change the availability ofplant nutrients, the physical fertility of the soil and thesurvival of microorganisms. Therefore it has the potentialto be an accurate indicator of the suitability of a soil forplant growth.
Unfortunately, soil pH is sometimes difficult tomeasure and can vary between different sampling points inthe same soil and between seasons. In addition, majordifferences in pH values occur if subsamples of the samesoil are sent to different laboratories. This is because thereare major differences in procedures used to measure soilpH at the different laboratories. Minor differences inprocedures between laboratories also occur, which canaffect pH values. For example, two different laboratoriesmay measure the pH in 0.01 calcium chloride using a 1:5soil to solution ratio and a standard temperature of 25 ºC,but one laboratory may shake the suspension for 5 minuteswhile the other laboratory uses a 30 minute shaking time.
A pH (calcium chloride) between 5.5 and 6.5 isprobably the most suitable for plant growth except forsome legumes that are very sensitive to hydrogen ions.
CHAPTER 5 – NUTRITION THE WHEAT BOOK
78
IMPORTANT CHEMICAL PROPERTIES OF WHEAT GROWING SOILSIN WESTERN AUSTRALIA (continued)
Figure 5.2
The chemical activity in a soil.
Figure 5.3
Soil pH affects the availability of nutrients.

M.D.A. Bolland and J.W. BowdenWestern Australian wheat growing soils are mostly
ancient and highly weathered with very low levels ofnatural (indigenous or native) phosphorus. When firstcleared for agriculture, many of these soils were amongstthe most acutely phosphorus deficient soils to be foundanywhere in the World. On many of these soils, no wheatgrain was produced unless fertiliser phosphorus wasapplied; in most cases the seedlings stopped growing whenthe phosphorus reserves in the seed were depleted, and dueto lack of phosphorus in the soil, the seedlings eventuallydied.
Therefore, profitable wheat production on mostwheatbelt soils of Western Australia has only been possibleby applying phosphorus fertiliser to overcome the initialacute deficiency encountered in most of the newly andrecently cleared soils. Before 1974, there was still a lot ofland being cleared and developed for agriculture inWestern Australia. Much of this land was suitable forproducing wheat grain, and phosphorus was a majorconstraint to profitable grain production. At that timesingle superphosphate was the major phosphorus fertiliserused, and it cost $14 per tonne. To encourage farmers touse phosphatic fertiliser, the Commonwealth Governmentpaid a bounty of $12 per tonne of single superphosphate,so farmers only paid $2 per tonne. This stresses howimportant overcoming phosphorus deficiency was atachieving profitable agricultural production in most newlycleared Australian soils; this was particularly so for wheatproduction in Western Australia.
Phosphorus is an essential component of cellmembranes, plant genetic material and of the energystorage and transfer system for chemical reactions in plantcells. Early plant growth is particularly dependent onphosphorus because of the needs for rapid cell division andexpansion. Phosphorus deficiency in wheat reducestillering, head and grain numbers, and the primordia for allthese are established as the seedling germinates andemerges from the seed, so very early in the development ofthe crop.
Symptoms of phosphorus deficiency in wheat areusually non-specific and difficult to diagnose in the field.In early development, the most noticeable feature ofphosphorus deficiency in wheat is reduced growth andvigour. All the leaves become a dull dark green with slightmottling of the oldest leaf. On older leaves, chlorosis beginsat the tip and moves down the leaf on a front while the baseof the leaf and the rest of the plant remains dark green.Unlike nitrogen deficiency, necrosis of these chlorotic areasis fairly rapid, with the tip becoming orange to dark brownand shrivelling while the remainder turns yellow. At thisstage the second leaf has taken on the early symptoms ofphosphorus deficiency.
Fertiliser phosphorus is placed (drilled) with the seed ofwheat while sowing crops at 3 to 5 cm deep, or it is spread
over the soil surface of pastures grown between crops.Phosphorus taken up by plants and soil organisms (mostlypresent in the top 5 cm of soil) are returned as organicmatter to or near the soil surface. Most of the soils used togrow wheat in Western Australia sorb phosphorus so littleis leached. Consequently, most of the phophorus is presentnear the soil surface. Exceptions are for deep sandy soils inhigher rainfall (greater than 400 mm annual average) areaswith low capacities to retain phosphorus. In these soils,phosphorus is found at greater depth in the soil due toleaching down the soil profile. This has become moreobvious after about 30 years after the land was firstdeveloped because it is possible to measure the phosphorusat depth as more is applied and leached down the soil.Examples are the deep sandy soils near Esperance,Badgingarra, Kojaneerup and Eradu.
Fertiliser phosphorusPlant roots take up phosphorus from soil solution as
water-soluble phosphate. The problem is that phosphorusis not chemically stable in a water-soluble form, andrapidly reacts, principally with iron, aluminium andcalcium, present in soil solution and on the surfaces of soilconstituents, to form insoluble, more stable compounds.These reactions continue, even when the soil is dry, albeitmore slowly, to form even more stable and less solublecompounds. Consequently, fertilisers in which most of thephosphorus is present as water-soluble phosphorus aregenerally more effective than poorly soluble forms.
The original sources of phosphorus used in agriculturewere animal manures, waste vegetable materials, bones,guano and rock phosphates, which contained no water-soluble phosphorus. Therefore, only soils with naturallylarge amounts of indigenous phosphorus could be used forproductive, profitable agriculture. Single (ordinary)superphosphate was the first chemically prepared fertiliserto be manufactured on a large scale. The method ofmanufacture was first established in about the mid 1880s,and large scale production was achieved in the late 1800sand early 1900s, particularly after the first World War. Asthe World’s population increased, the need for foodrequired the development of soils that were phosphorusdeficient for productive, profitable agriculture. Indeed,most soils developed for agriculture throughout the Worldwere phosphorus deficient when first cleared of nativevegetation. Therefore, the discovery of how to make singlesuperphosphate had a huge impact on agriculture, makingit possible to use these phosphorus deficient soils to feedthe increasing world’s population.
Single superphosphate (9.1% total phosphorus, 11%sulphur and 20% calcium) is made by adding sulphuricacid to calcium rock phosphates, known as apatite rockphosphates; typically 6 tonnes of acid is added to 10tonnes of rock phosphate. The phosphorus and calciumcome from the rock phosphate, and the sulphur from
THE WHEAT BOOK CHAPTER 5 – NUTRITION
79
PHOSPHORUS

sulphuric acid. Subsequently it was found that if adifferent ratio of sulphuric acid was added to apatite rockphosphate, phosphoric acid was made. The calciumsulphate (gypsum) also made is removed by filtration.Adding phosphoric acid to apatite rock phosphate makestriple superphosphate (20% total phosphorus, 16%calcium, and up to 1.5% sulphur from the small amountof gypsum or unused acid still present in the phosphoricacid). A local Western Australian version of triplesuperphosphate, called double superphosphate, contains17.5% total phosphorus, 16% calcium and 3.5% totalsulphur. Passing ammonia through phosphoric acidmakes the ammonium phosphate fertilisers. The mostcommon are monoammonium phosphate (MAP,containing 22% total phosphorus and 11% nitrogen)and diammonium phosphate (DAP, containing 20%total phosphorus and 18% nitrogen). Ammonium is aby-product of oil refining, so manufacturing plants thatmake ammonium phosphate fertilisers are located nearoil refineries.
In Western Australia, local versions of ammoniumphosphates, originally known locally as ‘Agras’ fertilisers,are made by adding ammonium sulphate to phosphoricacid, so the fertilisers contain sulphur in addition tophosphorus and nitrogen. An example is Agras No. 1,containing 7.6% phosphorus, 15.4% nitrogen and 11.5%sulphur.
The development of methods to make thesemanufactured, solid, granulated, stable fertilisers all hadhuge impacts on developing newly-cleared soils to growprofitable wheat crops Worldwide, particularly in WesternAustralia.
Single superphosphate is manufactured in relativelysimple manufacturing plants. Such plants weredeveloped on the sea coasts of various countries,including Western Australia. Good sea-port facilitieswere essential to import rock phosphate and elementalsulphur. Elemental sulphur is used to make the sulphuricacid that is then added to the rock phosphate to makethe fertiliser. Rock phosphate used to manufacture singlesuperphosphate in Western Australia was originallyobtained from Christmas Island in the Indian Ocean,and Nauru and Ocean Islands in the Pacific Ocean.These days, the cheapest source of rock phosphate thatcontain low concentrations of cadmium for themanufacture of fertilisers in Western Australia areMorocco and other North African countries.
A major problem for the manufacture of singlesuperphosphate was that the high quality apatite rockphosphates required contained at best 16% phosphorus.Therefore, 84% inert material needed to be transportedvast distances to, in most cases, small manufacturingplants that supplied small local regions e.g. theEsperance region in Western Australia. The subsequentdevelopment of procedures to manufacture triplesuperphosphate and the ammonium phosphate fertilisers
greatly altered the economic circumstances formanufacturing single superphosphate in the traditionalsimple, small plants in coastal localities around theWorld. Triple superphosphate and the ammoniumphosphate fertilisers are made in much morecomplicated manufacturing plants. These are located atlarge deposits of good quality rock phosphate, so theneed to transport rock phosphate over great distances isavoided; the rock phosphate is mined and used tomanufacture the fertilisers at the same location. Onlyelemental sulphur, containing close to 100% sulphur,needs to be imported to make the sulphuric acid, whichis used to make the phosphoric acid required to make themore concentrated phosphorus fertilisers. These largemanufacturing plants are located close to oil refineries toobtain ammonia, and ammonia is used to make urea aswell as the ammonium phosphate fertilisers. Theseplants make and export huge amounts of urea, triplesuperphosphate and ammonium phosphate fertilisers toall locations around the World and so provide strongcompetition for the traditional small singlesuperphosphate manufacturing plants, including thefour such plants that still operate in Western Australia (atGeraldton, Bunbury, Albany and Esperance). At thelarger plants, giant freight ships are loaded with thefertiliser products, often before orders are received tosupply the products. That is, often the ships have beenloaded and left port before their final destination isknown. As a result of these developments in fertilisermanufacture, wheat growers in Western Australia haveaccess to both locally manufactured and importedfertilisers, which has helped to keep costs of fertilisers aslow as possible.
The phosphorus compounds in the water-solublemanufactured fertilisers are monocalcium phosphate insingle, double and triple superphosphates, in which about80% of the total phosphorus in water-soluble, andammonium phosphate in MAP, DAP or the Agrasfertilisers, in which greater than 90% of the totalphosphorus is water-soluble. These compounds are the fewstable water-soluble phosphorus compounds that aresuitable to make stable, granulated, solid fertilisers for usein agriculture. In field experiments, it is difficult todemonstrate differences in the effectiveness, for productionof agricultural crops or pastures, of the two different water-soluble phosphorus compounds present in the differentcommercial manufactured fertilisers. Therefore, all thesefertilisers are considered to be equally effective per unit ofphosphorus.
All the manufactured, solid water-soluble phosphorusfertilisers are granulated (typically 1 to 5 mm) and are easyto handle, store and apply. Other essential nutrientelements can be incorporated into the granules if required,and so applied in the same operation. These includepotassium, sulphur, copper, zinc, manganese,molybdenum and cobalt.
CHAPTER 5 – NUTRITION THE WHEAT BOOK
80
PHOSPHORUS (continued)

The fate of applied phosphorusPhosphorus applied as fertiliser can be taken up
(absorbed) by plants, retained by the soil, and lost througherosion or leaching.
The uptake of phosphorus by plants depends on thesupply of available phosphorus in the root zone and thedemand for the phosphorus by the growing crop. If growthrates are low for any reason then phosphorus uptake will belimited.
The supply of phosphorus to the plant is affected by:chemistry;the position of phosphorus in the soil – its placement,time of application and tillage practices;the presence of roots – determined by crop variety,growth stage, disease, hardpans, aluminium toxicityand soil wetting and drying, reduction in root growthcaused by diseases, pests and herbicides; andthe level of soil moisture – governed by rainfall,evapotranspiration and canopy development.Many of these factors interact.The supply of phosphorus depends on the
concentration of phosphorus in the soil solution which isin contact with the roots.
Phosphorus in most soils is mainly derived from fairlyrecent applications of fertiliser. This means that the‘available’ fraction of that phosphorus for plant uptake isunevenly distributed in the soil. Fertiliser phosphorus isdrilled with wheat while sowing. Seed of wheat crops inWestern Australia are typically sown 3 to 5 cm deep in rowsthat are about 18 cm apart. Therefore, the most recently-applied phosphorus is placed in concentrated strips in thesoil at about 3 to 5 cm deep and 18 cm apart. Because thephosphorus will only move slowly to the roots andtherefore not supply adequate phosphorus for profitablegrain production, the roots must intercept the phosphorusin the soil as they grow through the soil.
The plant’s yield response to fertiliser phosphorus is aresponse to the number of intersections the wheat rootsmake with concentrated zones of phosphorus in the soiland the concentration of phosphorus in those zones.
For freshly-applied phosphorus, the amount of soilaffected will depend on the number of fertiliser granulesand then on the ability of the phosphorus to diffuse fromthe granules into the soil. If soil moisture is high, more soilwill be affected. If the capacity of the soil to retainphosphorus is high, less soil will be affected.
The amount of soil affected will increase in time asmore fertiliser is applied and mixed through the soil as thesoil is cultivated to sow crops.
Phosphorus fertiliser for wheatproduction
The water-soluble phosphorus present in thesuperphosphate and ammonium phosphate fertilisers isvery hygroscopic. That is, the compounds strongly attract
water, even attracting water vapour in relatively dry soilwith moisture levels well below field capacity. Theattraction of water, as vapour or liquid, to the granuledevelops what is called an osmotic gradient from the soil tothe granule. As a result of this strong gradient, once the soilis moist, water is quickly drawn from the soil, either asvapour or as liquid, into the fertiliser granule. Once in thegranule, the water rapidly and almost completely dissolvesthe water-soluble phosphorus compounds. Theconcentrated fertiliser solution then moves rapidly out ofthe granule and into the soil, driven in this direction by thelarge concentration gradient between the dissolvedphosphorus compounds in the granule and the soil. Thereactions between the water-soluble phosphorus in thefertiliser solution and calcium, iron, aluminium, and otherelements, starts immediately, and commences in thefertiliser granule itself as soon as dissolution occurs. Rockphosphates used to make the water-soluble fertilisersfrequently contain impurities of iron and aluminium, andare calcium phosphates, so the iron, aluminium andcalcium react with the water-soluble phosphorus present inthe granule. Once the concentrated fertiliser solutionmoves into the soil, which it does within seconds ofdissolution, the water-soluble phosphorus in the solutionreacts with many element in the soil solution and onsurfaces of soil constituents, to form insoluble, morechemically stable, phosphorus compounds. Indeed, in themillimetres of soil near the fertiliser granule, theconcentrated fertiliser solution has a low pH and itdissolves silica, iron, aluminium, calcium, manganese,magnesium and potassium present in very close proximityto the granule. All these dissolved elements partake in thereactions with the water-soluble phosphorus. As a result ofthe reactions, and in the soil just millimetres outside thefertiliser granule, the solubility product of manyphosphorus compounds in the fertiliser solution isexceeded, so a range of different compounds precipitateout of the solution. In addition, water-soluble phosphorusis adsorbed onto surfaces of soil constituents by reactingwith many elements, principally iron and aluminium,exposed at the surfaces of the constituents. The firstprecipitates and adsorbed phosphorus compounds formedare metastable, and a great deal of chemical reorganisationtakes place; resulting in re-dissolution and desorption ofphosphorus followed by further precipitation andadsorption reactions. The result of these continuingreactions is that more stable, less soluble phosphoruscompounds are formed. These reactions continue to occuras the concentrated fertiliser solution moves out of thegranule and further into the soil, so the solution becomesless and less concentrated as phosphorus and otherelements (calcium, iron, aluminium) decrease due toprecipitation and/or adsorption reactions. Precipitationreactions probably dominate within the granule andmillimetres outside the granule. This is because of therelatively large phosphorus concentration in solution in
THE WHEAT BOOK CHAPTER 5 – NUTRITION
81
PHOSPHORUS (continued)

and close to the granule so that the solubility products ofmany phosphorus compounds in the solution is exceeded.Further out from the granule, the concentration ofphosphorus in solution is much less and adsorption ofphosphorus onto the surfaces of soil constituents is likelyto dominate rather than precipitation of phosphorus fromthe soil solution. In practice, it is difficult to differentiatebetween precipitation and adsorption, so both arecollectively called sorption reactions. The distribution ofphosphorus in soil adjacent to a fertiliser granule variesmarkedly depending on the capacity of the soil to retainphosphorus. For a high phosphorus retaining lateriticWestern Australian soil, about 55% of the phosphorusfrom a triple superphosphate granule was present within 5millimetres of the granule after 4 weeks in the soil. Thecorresponding value was 28% for a low phosphorusretaining sandy podzol from Western Australia as a greaterproportion of the phosphorus from the granule had movedout a greater distance into the soil.
The net result of the complex sorption reactions, isthat: (1) the concentration of phosphorus originallypresent in the concentrated fertiliser solution decreasesmarkedly with increasing distance from the granule intothe soil, and the concentration of the sorbed phosphorus isgreatest near the granule; (2) the agronomic effectiveness ofthe water-soluble phosphorus fertilisers is greatestimmediately after dissolution of the water-solublephosphorus initially present in the granule and theresultant fertiliser solution has entered the soil. This isbecause much of the phosphorus is present as dissolvedphosphorus, as water-soluble phosphorus compounds, oras metastable precipitated phosphorus compounds whichcan readily re-dissolve, or as phosphorus adsorbed onto lowenergy sites that can readily desorb. However, in time, thecontinuing precipitation and re-dissolution, and/ordesorption and adsorption reactions (sorption reactions)result in the formation of more stable less solublecompounds. Consequently, the agronomic effectiveness ofthe fertiliser-applied phosphorus for growing wheat plantsdecreases with increasing time from when the fertilisergranules were first moistened in the soil. As it turns out,wheat plants are well adapted to exploit this situation, as isnow explained.
Wheat plants take up much water-soluble phosphorussoon after the seedlings germinate and emerge from theseed. It has been shown that the seedlings can rapidly takeup most of the phosphorus that plant needs to grow andproduce grain. Any large phosphorus deficiency duringearly growth greatly reduces grain yield potential at the endof the growing season. Field experiments have shown thatapplying fertiliser phosphorus to acutely phosphorusdeficient soils 10 days after emergence of wheat cropsproduces an uneconomic increase in the grain yield. So inacutely deficient soils the phosphorus is needed early ingrowth. Once phosphorus is in the wheat plants, duringsubsequent growth, plants relocate the phosphorus from
old tissue to newly growing tissue, including flowers andgrain. For all the above reasons, it is recommendedphosphorus fertilisers are drilled with the wheat seed atsowing. In this fashion, when the soil becomes moist andthe wheat seedlings germinate and emerge, the water-soluble phosphorus from the fertiliser granules will dissolveand enter the soil near the roots of the germinating wheatseed.
Consequently, as much as possible of the water-solublephosphorus dissolved from the fertiliser granule is taken upby the seedlings to ensure phosphorus deficiency does notlimit grain production at the end of the growing season.
There is competition between the soil and plant rootsfor the water-soluble phosphorus dissolved from thegranulated water-soluble fertilisers. Most of thephosphorus is sorbed by the soil. Only between 5 to at best30% of the phosphorus is taken up by the plant. As thecapacity of the soil to sorb phosphorus increases, so agreater proportion of the phosphorus is sorbed by the soiland plant roots take up a corresponding smallerproportion. But for any one soil, as more fertiliserphosphorus is applied, so the capacity of the soil to retainphosphorus decreases with increasing addition.Consequently, the agronomic effectiveness of subsequentapplications of phosphorus for producing wheat grainincreases and a greater proportion of the added phosphorusis taken up by the plant and a smaller proportion isretained by the soil.
The water-soluble phosphorus in the solid, granulatedmanufactured fertilisers does attract moisture from the airand this water will cause dissolution of the water solublephosphorus present in the granules. This will only occur inthe granules exposed at the surface of the stacks. Farmersstore the fertilisers in dry storage sheds, or in stacks coveredin tarpaulins. Some storage, both during transport to thefarm and while applying the fertiliser, is necessary even ifthe fertiliser is purchased and spread as soon as possible.Longer-term storage needs to be in dry covered storagefacilities.
To avoid congestion near the start of the growingseason, fertiliser manufacturers and suppliers offerdiscounts to encourage farmers to purchase fertilisermonths before the start of the growing season (i.e. inDecember instead of May). This fertiliser is often appliedsoon after purchase, often during summer when the soil isusually dry. However, early morning dews or summerrainfall, will result in the dissolution of the water-solublephosphorus in the granule and its subsequent reactionswith other elements and soil as described above. This willreduce the effectiveness of the phosphorus for growingwheat planted near the start of the next growing season.The decrease in effectiveness, relative to freshly-appliedfertiliser phosphorus drilled with the wheat seed at sowing,is very obvious in acutely phosphorus deficient soils; it isnot so obvious in soils that are only marginally deficient orpossessing adequate levels of phosphorus for wheat
CHAPTER 5 – NUTRITION THE WHEAT BOOK
82
PHOSPHORUS (continued)

production. But farmers need to realise that fertiliserphosphorus applied in summer can lose up to half itseffectiveness or even more by the time the next wheat cropis sown, so they may as well have only drilled half or lessthe amount of phosphorus with the seed while sowing thecrop. Experiments done on soils that are no longerdeficient in phosphorus will often indicate no grain yielddifferences for fertiliser applied either during summer ordrilled with the seed while sowing near the start of thegrowing season. But the nil-phosphorus fertiliser treatmentwill also produce similar yields because enoughphosphorus is being supplied by the phosphorus alreadypresent in the soil from fertiliser applied in previous years.No sensible conclusion about fertiliser effectiveness forproducing wheat grain can be derived from suchexperiments. This does not mean that fertiliser phosphorusapplied in summer will not lose effectiveness from earlymorning dews and summer rainfall, as is often implied byfertiliser suppliers and manufacturers; it has been clearlyshown it will if a phosphorus deficient soil is used for theexperiments to make meaningful comparisons between thedifferent treatments.
The pH within the granules of the superphosphate andammonium phosphate fertilisers is very acidic; pH valuesare typically 2.0 to 2.5. As stated above, as the dissolvedfertiliser solution leaves the granule, its low pH can, withina few millimetres of the granule, cause dissolution of soilparticles. It is stressed that research has shown the granulesof the superphosphate and ammonium phosphatefertilisers have very little direct influence on the pH of soils.That is, the fertilisers do not directly change soil pH.Fertiliser phosphorus does this indirectly, by contributingto productive agriculture, as is discussed in the soilacidification section of this chapter.
Residual phosphorusIn the years after application of the superphosphate and
ammonium phosphate fertilisers, the phosphorus from thefertiliser that is not lost by being removed in grain, erodedor leached, is present as: (1) undissolved phosphorus in oldfertiliser granules, typically 10 to 20% of the totalphosphorus applied; (2) sorbed by the soil; and (3) asphosphorus present in organic matter. The organic mattercontains phosphorus taken up by plants and the manyorganisms growing in the soil and which has been returnedto the soil as dead remains and bodies. In addition, soilanimals and grazing animals (wheat and other cropstubbles, and pasture grown in rotation with the crops)return urine and faeces to the soil. All the sources (1) to (3)provide some water-soluble phosphorus for plant uptake inthe years after application of the fertiliser and is called theresidual value of the fertiliser. Research in the WesternAustralian wheat growing soils has shown that thesuperphosphate and ammonium phosphate fertilisers havea good residual value for grain production of wheat. Asmore fertiliser has been applied each year, the phosphorus
status of the soils has increased. Eventually, most (70 to100%) of the water-soluble phosphorus taken up by wheatplants has been provided by the residual phosphorus, withthe remainder (30 to 0%) being provided by freshly-applied fertiliser drilled with the seed in the current year. Inaddition, the research has shown that as more fertiliserphosphorus is applied, the capacity of the soils to sorbphosphorus decreases. This is because as more phosphorusis added the freshly-applied phosphorus is sorbed ontochemically less reactive sites so it can more readily desorb.Also phosphorus is sorbed onto the surfaces of soilconstituents as the negative phosphate ions. Therefore, asmore phosphate is sorbed, the sorbed phosphate increasesthe net negative charge of the soil surface, making it moredifficult to adsorb further negatively charged phosphateions. So less phosphate is sorbed. The research has alsoshown that because phosphorus is less strongly sorbed bythe soil as more fertiliser is applied, the effectiveness ofsubsequent applications of fertiliser phosphorus isincreased for growing wheat plants. That is, as morephosphorus is added to the soil, then a smaller amount offreshly-applied fertiliser phosphorus is required to producethe same percentage of the maximum yield.
The supply of phosphorus from sources (1) to (3) inthe soil is very dependent on seasonal growing conditions.Rainfall has been shown to have a big impact. In fieldexperiments in Western Australia using wheat, it has beenshown that the greater the growing seaon (May toOctober) rainfall, so the more effective are sources (1) to(3) at providing phosphorus to the crop for producinggrain. That is, relative to fertiliser phosphorus drilled withthe seed in the current year, a greater proportion of thephosphorus needed by the crop is provided from thephosphorus already present in the soil in wet years than indry years. This is because in wet years more water-solublephosphorus is released to the soil, and so is available forplant uptake, from sources (1) to (3) than in dry years.
The distance the dissolved phosphorus moves out offertiliser granules when the granules take up water for thefirst time will vary depending on the capacity of the soil tosorb phosphorus. The distance is greater as the capacity ofthe soil to sorb phosphorus decreases. Therefore, thephosphorus will move further into the soil in sandy soilswith low iron and aluminium, clay and organic mattercontents, but it will move a much shorter distance in thehigh phosphorus sorbing soils, such as the Karri loams. Inaddition, for all soils, as more fertiliser phosphorus isapplied, so further additions of phosphorus are lessstrongly sorbed, so the fresh phosphorus emerging fromrecently-applied fertiliser granules will move a greaterdistance into the soil.
Because it has a good residual value, phosphorusdeficiency eventually becomes a minor problem, even inWestern Australian soils that were originally so acutelydeficient in phosphorus that no wheat grain could beproduced if no fertiliser phosphorus was applied. So as the
THE WHEAT BOOK CHAPTER 5 – NUTRITION
83
PHOSPHORUS (continued)

phosphorus status of these soils has been increased byapplying fertiliser each year for many years, only enoughphosphorus fertiliser now needs to be applied to most ofthese soils to maintain the phosphorus status of the soils.This is to replace phosphorus removed in wheat grain(typically 0.25% phosphorus is present in the grain grownin Western Australia), lost by leaching and erosion, andwhich has become so strongly sorbed by the soil orincorporated in organic matter (humus) as to be essentiallyunavailable to crops.
Erosion and leachingSome of the total supply of phosphorus in the soil can
be lost if the fertiliser granules or soil/phosphorus reactionproducts are eroded by wind and water. On the siliceoussands or sesquioxide-free, peaty sand, the rainfall can leachphosphorus.
Seed phosphorusWhen the embryo in the seed starts to germinate and
grow, the seed itself provides most of the nutrients until aroot system is developed that can take up significantamounts of nutrients from the soil. Dependence on seedphosphorus only lasts a few days. Most of the phosphorusneeded by wheat plants to produce grain is derived fromthe soil.
Results from field experiments with cereals (wheat, oatsand barley) have shown that in some years plants grownfrom seed containing high phosphorus concentrationshave produced up to 20% more grain than plants grownfrom seed with low phosphorus concentrations. This maybe due to the effect of stress experienced by the wheatplants during the growing season. Larger deeper rootedseedlings grown from seed of the same size but with higherphosphorus concentrations may cope better with waterstress and/or stress caused by diseases, pests and herbicidesprays. Therefore, in some years these plants produce moregrain than seedlings grown from seed of the same size butcontaining lower concentrations of phosphorus.
For wheat, yield increases due to seed phosphorus areunlikely when the phosphorus concentration in the seed isgreater than 0.30%. Thus the seed for sowing the wheatcrop should have over 0.30% phosphorus. Seed should bekept from the best paddocks – those that are fertilised andhave the longest history of regular phosphate applications.
Seedlings grown from bigger seed produce biggerseedlings and sometimes produce more grain at the end ofthe growing season than seedlings grown from smallerseed. This is because larger seeds usually have largerembryoes and larger amounts of protein, carbohydratesand amounts of all plant nutrients than smaller seeds.
Rock phosphateLong term (up to 20 years) field experiments with
wheat in Western Australia have shown that all types ofrock phosphates (reactive apatite rock phosphates – themost effective rock phosphates for direct application; low-
reactive apatite rock phosphates – mainly used to makesuperphosphate and ammonium phosphate fertilisers; andcalcium iron aluminium (crandallite millisite) rockphosphates – the cheapest source of rock phosphate forWestern Australia) are highly unlikely to be profitablealternative phosphorus fertilisers to superphosphate andammonium phosphate fertilisers. Relative to theeffectiveness of freshly-applied superphosphate each year,the rock phosphates were from one third to one hundredthas effective, in both the year of application and subsequentyears (residual value). Consequently, from about three toone hundred times the amount of phosphorus as rockphosphate, applied in the current or previous years, neededto be applied to produce the same yield as freshly-appliedsuperphosphate.
Rock phosphates contain no water-solublephosphorus. In fertiliser manufacturing plants, strongacid is added to rock phophate to make water-solublephosphorus compounds. The hydrogen ions supplied bythe strong acid dissolve the rock phosphate to make thewater-soluble phosphorus compounds. When rockphosphate is directly applied to soils, the rock phosphateneeds to react with moist soil to dissolve and producewater-soluble phosphorus, which can either be taken upby plant roots or sorbed by the soil. Hydrogen ions,supplied by the soil, are required to dissolve the rockphosphate to produce water-soluble phosphorus. Thehydrogen ions can only be supplied in sufficientquantities for dissolution in acidic soils (pH less than 5.0in calcium chloride, or pH less than 6.0 in water).However, most of the acidic soils used to grow wheat inWestern Australia simply do not possess enoughhydrogen ions to cause rapid and extensive dissolution ofrock phosphate to supply enough water-solublephosphorus for uptake by wheat plants to avoidphosphorus deficiency. This is particularly so during theearly part of the growing season when wheat plants needadequate phosphorus to avoid phosphorus deficiencyand achievement of maximum grain yield potential. Thesoils also must remain moist during this period otherwiserock phosphate dissolutions cannot occur. The fertilisedsoils used to grow wheat in much of Western Australiafrequently dry out between rains throughout the wholegrowing season, including during early growth.Therefore, even if the soil did possess enough hydrogenions to cause rapid and extensive dissolution of the rockphosphate early in the growing season, the lack ofadequate moisture in the wheat-growing soils of WesternAustralia for most of the growing season is enough toprevent rock phosphate from being a profitablealternative to the manufactured granulated water-solublefertilisers. The total supply of hydrogen ions in the soilaffects rock phosphate dissolution including thehydrogen ions in solution (estimated by measuring soilpH) and on the surface of soil constituents (estimated
CHAPTER 5 – NUTRITION THE WHEAT BOOK
84
PHOSPHORUS (continued)

from the pH buffering capacity of the soil). The totalsupply of hydrogen ions in the soil available fordissolution of rock phosphate is measured by titratingthe soil suspension with alkali (titratable acidity).
Rock phosphates are not suitable for alkaline soilsbecause these soils contain too few hydrogen ions to causeany dissolution. Indeed, the most stable form ofphosphorus in alkaline soils is apatite (rock phosphate). Soonce apatite is added to alkaline soils, it has no reason toreact to achieve greater chemical stability, so it just remainsas apatite in the soil.
Phosphorus and calcium are the major products ofrock phosphate dissolution. Removal of the dissolvedphosphorus and calcium due to sorption by the soilincreases dissolution. However, once the capacity of soilto sorb phosphorus reaches moderate levels, the soilsorbs most of the phosphorus and wheat plants take uprelatively little of the dissolved phosphorus.Consequently, in wheat growing soils in WesternAustralia, relative to superphosphate, the effectiveness ofrock phosphate generally decreases as the capacity of thesoil to sorb phosphorus increases.
Research in Western Australia has shown that,relative to superphosphate, the effectiveness of rockphosphates for growing wheat grain decreases withincreasing amounts of application. This is because, likeall insoluble compounds, rock phosphate particles willdissolve until the solubility product of the rockphosphate in soil solution is exceeded. The amount ofphosphorus required to do this is the same, regardless ofhow much rock phosphate is applied. As more rockphosphate is applied, so the proportional dissolutionfrom the rock phosphate particles decreases.Consequently, rock phosphates cannot support the samemaximum yield plateau as superphosphate. So yieldpotential is forfeited if rock phosphate is used instead ofsuperphosphate. By contrast, as explained above, as soonas the soil is moist after application, all the water-solublephosphorus present in superphosphate rapidly and
almost completely dissolves and moves out of thegranule and into the soil.
In contrast to the solid, granulated superphosphate andammonium phosphate fertilisers, to enhance fertilisereffectiveness, rock phosphates need to be applied as finepowders that are incorporated through the soil horizonsexplored by plant roots. In practice, for wheat crops thismeans at least the top 10 cm of soil where most of thewheat roots reside. Banding rock phosphates with the seedor at depth in the soil reduces its effectiveness; it needs toreact with as much soil as possible to enhance itsdissolution. Fine powders are difficult to handle, store andapply and mix through the soil using existing farmmachinery.
As previously stated, rock phosphates were widely usedin agriculture before the solid, granulated, water-solublefertilisers were made. The manufacture fertilisers haveenabled profitable wheat crops to be grown in phosphorusdeficient soils all over the World. This is because theyprovide water-soluble phosphorus to meet the demand ofthe wheat plant during early growth. This is so regardlessof the soil pH, the magnitude of the capacity of the soil tosorb phosphorus, and the rainfall zone. By contrast, rockphosphates can only be used in much more limitedsituations (acidic soils with adequate hydrogen ions with alow capacity to sorb phosphorus in a high rainfall (metresof annual rainfall) areas where soils remain moist for mostof the growing season).
Calculating the most profitableamount of phosphorus to apply
To do this, it is first necessary to determine, for definedsoil types and environments, the relationship betweengrain yield of wheat and the amount of fertiliserphosphorus applied in the year of application, known asthe yield response curve (Figure 5.4). Examples of definedsoil types and environments in Western Australia are theEradu soils east of Geraldton, the loamy sandy soils in theWongan and Ballidu region, the Kumarl clay soils near
THE WHEAT BOOK CHAPTER 5 – NUTRITION
85
PHOSPHORUS (continued)
Rel
ativ
e yi
eld
P applied (kg/ha)
SOIL 1
5 20 3038
50 60 700
50
100
75
10
SOIL 2
Figure 5.4
Figure 5.4 Relationship between wheat yield and applied phosphorus

Salmon Gums, and the Fleming gravelly soils near Gibson.Yields are expressed as a percentage of the maximum(relative) yield, because for the same soil type andenvironment, yields vary from year to year due to differentseasonal condition experienced in the different years.
Yield response curves are different for different soils andare largely affected by the capacity of the soil to sorbphosphorus. For example, in Figure 5.4, soil 1 has a muchlower capacity to sorb phosphorus than soil 2. Therefore,to produce the same relative yield, more phosphorus needsto be applied to soil 2 than to soil 1. This is because agreater proportion of the phosphorus applied to soil 2 issorbed by the soil so proportionally the wheat plantsgrowing in soil 2 take up less of the applied phosphorus.
To define the complete yield response curve for eachsoil and environment, the experiments have been done onnewly cleared soil that have not been fertilised withphosphorus in previous years. However, these days farmersare dealing with soils that have been fertilised withphosphorus in previous years. For each defined soil typeand environment, the relative grain yield of wheatproduced by the phosphorus already present in the soil,before any fresh fertiliser phosphorus is applied in thecurrent year, needs to be determined. This is done with theaid of a soil test for phosphorus, using the soil phosphorustest calibration (Figure 5.5), determined for the same soiltype and environment as the yield response curve shown inFigure 5.4. For the soil phosphorus test calibration, soilsamples to measure soil test phosphorus are collected inJanuary-February, and the soil test value is related to grainyields measured later on that year. In Western Australia, thesoil test is measured using the Colwell procedure. The top10 cm of the soil is used for the test. The soil phosphoruscalibration is also largely affected by the capacity of the soilto sorb phosphorus, with larger soil test values being
required to produce the same relative yield for soil 2 thansoil 1, because soil 2 has a larger capacity to sorbphosphorus.
The soil phosphorus test calibration is used to predictwheat grain yields from the amount of phosphorus alreadypresent in the soil. How this is done for soils 1 or 2 isshown in Figure 5.5. The yield predicted from the soilphosphorus test calibration in Figure 5.5 is transferred tothe yield response curve in Figure 5.4. It is then possible todetermine the likelihood of obtaining a profitable returnfrom money spent on applying fresh phosphorus fertiliserto the next wheat crop grown in that paddock. Figure 5.6illustrates the simple theory of how the calculation can bemade. Figure 5.6 is produced by converting grain yield ofwheat and the amount of phosphorus applied to $ terms.This is done by multiplying yield, as tonnes per hectare, bythe price paid per tonne of wheat. Costs include the cost ofthe phosphorus per hectare and the cost of application. Ateach point on the curve in Figure 5.6, marginal costs andreturns can be estimated. Point A in Figure 5.6 is on thesteeply rising part of the curve, so more dollars are returnedfor each dollar spent, and it is very profitable to applyfertiliser phosphorus to a paddock at about this part of theyields response curve. At point B in Figure 5.6, marginalcosts equal marginal returns and the maximum profit ismade by adding fertiliser phosphorus up to this point. Atpoint C in Figure 5.6, there is no yield increase fromadding fertiliser phosphorus, so money is better spent onsome other factor limiting wheat yields.
CHAPTER 5 – NUTRITION THE WHEAT BOOK
86
PHOSPHORUS (continued)R
elat
ive
yiel
d
Soil test P (ppm)
SOIL 1
0
8 15
SOIL 2
50
100
75
5 10 20 25
Figure 5.5
Soil phosphorus test calibration
C•
Noslope
B• 3
3
1
5A•
P applied – $
Yie
ld –
$
Figure 5.6
Conversion of wheat yield and applied phosphorus to dollar terms

M.G. Mason and R.F. BrennanNitrogen is an essential part of many plant compounds
such as amino acids and proteins.Nitrogen also has an essential role in the production of
chlorophyll, the compound which results in the greencolour of plants and is essential for photosynthesis.
Plant deficiency symptomsWithin the plant, nitrogen can readily move to areas of
active growth, which have high metabolic demand.Consequently, a symptom of nitrogen deficiency in plantsis the yellowing of the lower (older) leaves of wheat due tonitrogen being remobilised and transported from the oldertissues to the younger, actively growing, tissues.
Responses to additions of nitrogen fertiliser aregenerally in the form of greener plants due to increasedchlorophyll production, and increased vegetative growth,photosynthetic areas and grain yield. The increase in wheatyield to added nitrogen is largely due to increased tilleringbut nitrogen fertiliser can also increase seed numbers perear. In addition, a good supply of soil nitrogen can increasethe concentration of grain protein.
On very nitrogen deficient soils, the wheat plants willutilise the added nitrogen to increase tillering and vegeta-tive growth to set up grain yield potential through theproduction of more ears and seeds per ear. An increase innitrogen supply also increases photosynthetic leaf area andthis increases the potential for carbohydrates to fill theseeds. There maybe sufficient nitrogen for growth and littleavailable for seed protein. However, if the supply ofnitrogen in the soil is further increased, vegetative growthrequirements are satisfied and more nitrogen in the plant isavailable to be transferred to the seed for proteinproduction.
Seed protein comes from the late uptake of nitrogen by
the wheat plant and the mobilisation of nitrogen fromsenescent (dying) lower leaves.
Soil organic nitrogen or nitrogen in legume residuescan be more effective in raising the protein of seed thanfertiliser nitrogen applied early in the wheat plant growthstage. The reason being that organic sources continuallybreak down throughout the season resulting in a continualsupply in plant available nitrogen. Fertiliser nitrogenapplied late in the season has little effect on yield but willbe available for transfer to the seed for protein production.However, fertiliser nitrogen has to be applied early to set uppotential yield and unless excessive amounts are applied,little nitrogen is left for later uptake. For a wheat crop, ifthere is only a low supply of soil nitrogen early in theseason yield potential will be low because tillering andhence ear numbers will be reduced.
The nitrogen required for successful growth ofwheat must be supplied either by the soil or as fertiliser.The plants can only take up nitrogen from the soil whenit is in an inorganic form, which is as ammonium ornitrate.
Nitrogen in the soilIn the soil over 98% of the nitrogen is in an organic
form, which is not available to the plant until it ismineralised to inorganic forms. The organic matter variesin its nitrogen content and its ease of mineralisation,ranging from readily mineralisable recent crop or pastureresidues to older, more stable organic matter, which ismineralised slowly.
Mineralisation continues throughout the growingseason, providing a continuous supply of nitrogen, whichmay or may not satisfy the crop requirements, and whichwill vary with temperature and soil moisture.Mineralisation is stimulated by cultivation.
The nitrogen cycle is outlined in Figure 5.7.
THE WHEAT BOOK CHAPTER 5 – NUTRITION
87
NITROGEN
Figure 5.7
The nitrogen cycle.
A large part (sometimes all) of the plants requirementfor nitrogen is supplied by the soil. However, where theavailable soil nitrogen supply is inadequate for optimumyields, nitrogen fertiliser needs to be applied to obtainmaximum economic grain yields.
Distribution of nitrogen deficiencyIn Western Australia, all soils are potentially nitrogen-
deficient. The light or coarse textured (sandy) soils are verydeficient. The heavy or fine textured (loam and clay) soilsgenerally contain higher levels of nitrogen before they arecleared but intensive cropping with non-legume crops candeplete the amount of nitrogen in the soil.
Nitrogen deficiency is more likely in higher rainfallareas because of greater chances of leaching, especially onuniform coarse textured soils or because of losses throughdenitrification due to waterlogged fine textured soils orduplex soils with a slowly permeable subsoil.
The greatest responses to addition of nitrogen fertiliserwill be obtained in higher rainfall areas on light (sandy)soilswhich have not grown legumes recently. The yield responseto fertiliser nitrogen is affected mainly by:
weather (mainly rainfall);soil type; andrecent paddock history (whether a legume has beengrown in the rotation).These factors are included in the nitrogen
recommendations, which are offered as a guide, to bevaried with specific local knowledge.
Nitrogen requirementA crop’s requirement for nitrogen will depend on:season;soil type;paddock history;soil moisture; andyield potential.
SeasonLarger yield increases will be obtained and more
nitrogen fertiliser will be needed in high rainfall years,because higher yielding crops can be grown. A dry finish tothe season will limit yield response.
If high rainfall causes waterlogging then the grain yieldincrease to nitrogen fertiliser will also be limited.
Soil typeHeavy soils naturally have more nitrogen and are less
prone to leaching losses. Consequently these soils usuallyneed less nitrogen added (often none) to produce optimumcrop yields, unless they have been cropped intensively.
Paddock historyLegume pastures and to a lesser extent, legume crops
such as lupins or peas add nitrogen to the soil. This reducesthe need for fertiliser nitrogen compared with multiple
cereal crops or where no legumes are grown in the rotation.
Soil moistureMoisture stored in the soil at the beginning of the
growing season can indicate the likelihood of a goodgrowing season (particularly on heavier soils). Rates ofnitrogen fertiliser could be varied accordingly.
Yield potentialFor grain with a 2% nitrogen concentration, 20 kg of
extra nitrogen will be contained in each tonne of wheatgrown. If the nitrogen harvest index (the proportion ofnitrogen in the plant which is contained in the grain) is75%, then about 27 kg extra nitrogen is needed in theplant. Assuming a recovery of 50% by the plant, an extra54 kg of nitrogen is needed in the soil for each tonne ofgrain produced.
If the potential yield is increased above the averagepotential, extra N will have to be supplied either by the soilor by extra nitrogen fertiliser.
Potential yield can be increased by:a good early start to the growing season which allowsearly sowing;using an appropriate high-yielding wheat variety on aproductive soil type;effectively controlling weeds;being disease-free; andmaking sure other nutrients such as phosphorus,potassium, sulphur, copper, zinc, molybdenum andmanganese are in adequate supply.Sometimes a paddock has a higher potential because of
a higher than normal soil nitrogen level after good legumepasture for a number of years. The requirement forfertiliser nitrogen could be lowered because of the greatersupply of available soil nitrogen.
The amount of nitrogen to be applied to the wheatcrop will be determined by economics. The optimumeconomic rate depends on the cost per unit of nitrogen infertilisers and the price received for wheat grain.Economics are taken into account in makingrecommendations.
Deciding on the rate of applicationSoil testing for nitrogen fractions has not proved
successful. The nitrogen requirement of a crop cannot beindicated by the soil measurement (a nitrogen soil test)because the response to N depends greatly on the seasonalconditions which cannot be forecast.
The soil test cannot measure the nitrogen which will beavailable to the crop at important times during the growingseason. A soil analysis however, will give a general idea ofthe total nitrogen status of the particular site.
Plant tissue can be analysed at various stages of growthand compared with standards, to diagnose nitrogendeficiency. However, as a predictive test to decide onapplication rates of nitrogen, tissue testing is still limited
CHAPTER 5 – NUTRITION THE WHEAT BOOK
88
NITROGEN (continued)

because by the time that there is sufficient growth toproduce an adequate amount of tissue to test, the optimumtime of fertiliser nitrogen application is likely to havealready passed. Another problem is that a subsequent yieldresponse to fertiliser nitrogen additions is still highlydependent on the conditions for the remainder of thegrowing season.
Sources of nitrogenous fertiliserSources of nitrogenous fertiliser for wheat growing in
Western Australia are listed in Table 5.2.Fertiliser nitrogen is added either as urea, ammonium-
nitrogen or nitrate-nitrogen.Urea is quickly broken down by moisture to
ammonium-nitrogen. This process is generally completewithin about one week, with most breaking down withinthree days. In most soils the ammonium-nitrogen isoxidised to nitrate by the process of nitrification. The rateof nitrification of ammonium-nitrogen depends ontemperature, moisture and pH. The process is rapid (2 to3 weeks) in alkaline or calcareous soils and slow in very acid
conditions typical of wodgil soils. With ammoniumsulphate or fertilisers based on ammonium sulphate(Agras), the rate of nitrification is generally slower than forurea or ammonium nitrate.
The form that the nitrogen is in the soil influences itsavailability to the plant and its losses from the rootingzone. If ammonium-nitrogen is applied on the surface, itstays in the surface layer while it is in the ammoniumform. If the soil surface dries, this nitrogen is unavailableto the plant. Ammonium-nitrogen also is a positivelycharged ion and is held by excess negative charges onclay, sesquioxides and organic matter in the soil and sobecomes immobile.
However, nitrate-nitrogen is a negatively charged ionand the soil has little or no hold on it. Consequently,nitrate is very mobile in the soil and can easily be lost byleaching in sandy soils, during heavy rains. In waterloggedconditions, the nitrate-nitrogen can be converted tovarious nitrogen gases by the process of denitrification andbe lost into the atmosphere. Ammonium-nitrogen is notprone to denitrification.
THE WHEAT BOOK CHAPTER 5 – NUTRITION
89
NITROGEN (continued)
An important factor in deciding which nitrogen fertiliser to use is the cost per unit of nitrogen, which can bedetermined by:Price/tonne nitrogen = Price per tonne of fertiliser x 100 (where N = nitrogen)___________________________
% N in the source
Example
Urea: Price/tonne N = 420 x 100 = $913 or 92 cents/kg N;____ ____46 1
where cost of urea (ex works) = $400/tonne, freight = $20/tonne and the N percentage content of urea = 46%. Thecontents of nitrogenous fertilisers are listed in Table 5.2.
Fertiliser % N % P
Urea 46
Ammonium sulphate 21
Ammonium nitrate 34
MAP 10-11
DAP 18
Sodium nitrate 16
Calcium nitrate 15.5
Calcium ammonium nitrate 26
Agras No. 1 17.5 7.6
Agras No. 2 12 10.4
Table 5.2 – The main nitrogen fertiliser sources and their N concentration

Sometimes a source other than the cheapest one can beused. For example, the convenience of using a compoundfertiliser at seeding; the effect on disease (an ammoniumsource where take-all is present) or the effect of anacidifying source such as ammonium sulphate onavailability of soil manganese. However, the economics ofalternatives should be examined as well as the agronomiceffectiveness of the nitrogen source compared to a delayednitrogen application.
Time of applicationMost grain yield increases to nitrogen fertiliser in
Western Australia are due to an increased number of earsor grains per ear.
Grain yield increases are largely caused by increasedtillering (seeds per unit area increases), which is determinedearly in the life of a wheat plant. The number of grains perear are also determined early in the growth cycle/stage ofthe cereal plants). Therefore, there is a need for a goodsupply of N early in crop growth.
For sandy soils in higher rainfall areas, where thechances of leaching are higher, application of fertilisernitrogen should be delayed 3 to 4 weeks. This allows thecrop to establish a reasonable root system which helps theplant take up nitrogen from the soil and avoids largeleaching losses. Optimum time of application of any oneseason can vary depending largely on the incidence ofleaching rains in relation to time of application. Profitableresponses can often be obtained up to 10 weeks aftersowing in higher rainfall regions.
Generally, the later the application of nitrogen fertiliser,the lower the grain yield increase and the greater the chanceof not getting economic grain yeild increase. Grain yieldincreases to later applications of N are generally due tobetter survival of tillers and to increased photosyntheticarea and leaf duration.
Methods of applicationThere are two concerns with nitrogen application:The effect of placement of urea on losses to theatmosphere (volatilisation).The effect on germination of placing nitrogenousfertilisers with the seed – a toxicity problem.
Volatilisation losses of nitrogenWhen urea is moistened and begins to break down,
one of the intermediate products is ammoniumcarbonate, which creates alkaline conditions around theurea granule.
In the soil there is a balance between ammonium-nitrogen and ammonia.
Under acidic soil pH conditions, most of this nitrogenis in the ammonium form.
However, under alkaline soil conditions moreammonia is produced. If the fertiliser is on the soil surface,
some of this ammonia will be lost to the atmosphere in theprocess called volatilisation.
The greatest loss by volatilisation is when the urea istopdressed onto moist alkaline soil and a period with warmtemperatures and no rain follows.
Losses can be avoided by covering the urea with soil, forexample, by topdressing immediately before sowing orwhere the nitrogen application is followed by rain heavyenough to wash the urea into the soil.
Ammonia losses are difficult to measure directly. Up to20% may be lost in extreme conditions, but generallylosses would be less than 10% in Western Australianconditions.
Volatilisation is generally not a problem with othernitrogen sources except on alkaline soils.
ToxicityThe ammonia produced when urea breaks down is
toxic to germinating seedlings, so if urea is drilled close tothe seed, it can reduce plant emergence.
The severity of the reduction depends on the amountof urea applied and the soil conditions at sowing andduring germination of wheat seedlings. Reductions ingermination of wheat seedlings will be worse with highrates of urea in moist soil but with no follow up rain forsome time. If good rains follow sowing, the effect will beless.
If there is only a small reduction in plant numbers, say10%, the crop can usually compensate by producing moretillers and grain yields may be unaffected, but higher lossesof plants can reduce yields. If more than 30 kg/ha urea isdrilled with the seed, yields can decline.
Except in alkaline soils, the other nitrogen sources donot produce toxic ammonia and are therefore less likely toreduce plant numbers or delay emergence. However, wherethe fertilisers are placed close to the seed in moist soil andthere is a long dry period following sowing, plant numberscan be reduced because of the concentrated salt solutionaround the germinating seed.
Grain proteinNitrogen is an essential part of protein, therefore,
nitrogen supply is an important determinant of grainprotein level. Many factors can affect grain protein, but therelationship between available nitrogen supply, yieldresponse and weather conditions, particularly during grain-fill, is of major importance.
During grain-fill, the nitrogen taken up by the plantafter anthesis is directed into the developing grain. Also,nitrogen in the plant vegetative parts is remobilised andtransported to the developing grain. Therefore, nitrogensupply during the growth of the plant and a late supply ofnitrogen to the plant could both be important indetermining grain protein.
The grain protein concentration/percentage willdepend on the amount of nitrogen available in the plant
CHAPTER 5 – NUTRITION THE WHEAT BOOK
90
NITROGEN (continued)

and the number of grains into which this nitrogen must bedistributed. In addition, the protein concentration in thegrain depends on how well the grain fills.
Hot, dry conditions during grain-fill affectcarbohydrate deposition in the grain more than proteindeposition. Therefore with a hot dry finish to the seasongrain protein concentration will be higher than when thereis a cool, moist seasonal finish.
The relationship between grain yield response tonitrogen fertilisers and grain protein concentration iscovered in greater detail in Chapter 7.
N spraysN as a spray has a limited advantage of increasing grain
protein of wheat seed when the spray is applied late(around the boot to anthesis growth stage). The results ofincreases in grain protein of wheat by foliar spray late in theseason have been variable (from no increase to 10-15%increase in grain nitrogen concentration).
As the season progresses, the advantage of foliarspraying increases but it is generally ineffective dependingon a range of seasonal conditions.
Effect on soil pHAll ammonium-N or ammonium-forming fertilisers
potentially have a long term acidifying effect on the soil.During the nitrification or oxidation of ammonium-nitrogen to nitrate-nitrogen in the soil, hydrogen ions areproduced in the soil and contribute to soil acidity.
Nitrogen sources (fertiliser, manure, legumes)containing or forming ammonium-N increase soilacidification. Also when nitrate-nitrogen is leached andcations move down the soil profiles are replaced byhydrogen ions, soils acidify.
The change in pH in the soil depends on the amountof fertiliser applied, the degree of leaching of the nitrateand the buffering capacity of the soil. Ammonium sulphatehas a greater acidifying effect than urea or ammoniumnitrate.
THE WHEAT BOOK CHAPTER 5 – NUTRITION
91
NITROGEN (continued)
Nitrogen source N% kg CaCO3/kg N
Ammonium sulphate 21 5.2
Ammonium nitrate 54 1.8
Urea 46 1.8
MAP 10-11 5.0
DAP 18 3.1
CAN 26 0.3-0.7
Table 5.3 – The effect of various N sources on the soil acidification of the soil, assuming leaching, and the amount oflime (calcium carbonate) required to neutralise each kilogram of N fertiliser
N.K. Edwards
RolePotassium is a major plant nutrient, required by wheat
in similar quantities to nitrogen. It is used in many plantprocesses including photosynthesis, transport of sugars,enzyme activation, maintenance of plant turgor andregulation of stomata. Plants deficient in potassium cannotuse other nutrients and water efficiently and are lesstolerant of stresses such as drought and waterlogging.Potassium deficient plants are also less resistant to pests anddiseases.
The occurrence of potassium deficiency is determinedby soil type, rainfall and management practices.
Soil typeLight textured (sandier) soils have lower potassium
reserves than heavier textured (loam and clay) soils. Theamounts and type of clay minerals present will have a largeinfluence on the ability of a soil to retain and replenishpotassium. So testing for potassium measures thepotassium that is readily available to plants. This is eitherwater soluble or exchangeable potassium that is retained onthe surface of clay particles and organic matter. In mostsandy soils, the potassium concentration is highest in thesurface layer where potassium is associated with organicmatter.
If clay or gravel occurs in the soil profile, then thepotassium level may increase near the gravel and clay downthe profile. However, it cannot be assumed that duplexsoils will have high concentrations of potassium at depth.Recent sampling of a range of duplex soils indicates thatthere is wide variability in the potassium content of duplexsubsoils. Even where exchangeable potassium levels doincrease at depth, if root growth is restricted to the surfacesoil horizons by a change in soil texture, then plants maystill not obtain sufficient potassium from the lower soilhorizons.
RainfallRainfall affects a wheat crop’s requirement for
potassium and the extent of leaching losses of potassium.Where the productivity of a crop is restricted by rainfall,the crop’s demand for potassium will be low and deficiencyunlikely.
Potassium leaches from sandy soils because theycontain less clay and organic matter to retain the potassiumin the root zone. Losses are minimal on clays and loams.Sandy soils in high rainfall areas will be the most vulnerableto leaching of potassium.
ManagementA wheat crop’s requirement for potassium will increase
as yield increases. High yielding wheat crops put large
demands on soil nutrient supply, particularly on light tomedium soils. While a soil with low potassium levels maybe able to supply sufficient potassium for a low yieldingcrop, when the yield potential is increased, potassiumdeficiency may develop. Management factors that increasethe yield potential can affect crop demand for potassium.These include cropping intensity, crop yield levels,increased nitrogenous and phosphatic fertiliser rates,sowing date, weed control, timeliness of operations andremoval of stubble residues.
Crop requirements for potassium change during thegrowing season. For wheat, potassium uptake is low at thebeginning of the growing season when plants are small, butincreases to a peak during late vegetative and floweringstages. The soil must be able to supply the crop’s potassiumneeds during periods of peak demand.
There does not appear to be a single mechanism bywhich potassium deficiency limits yield. Potassiumdeficiency can affect leaf area, dry matter produced inupper internodes and ears, the number of grains per heador the seed weight. The root system of potassium deficientplants may also be poorly developed. Restricted potassiumsupply during early growth stages may be more harmfulthan later deficiency.
SymptomsPotassium is very mobile in plant tissues. In deficient
plants it is redistributed to new growth so that symptomsappear first in the older leaves. The symptoms of potassiumdeficiency in wheat are similar to those of nitrogendeficiency, but differ slightly in initially being morerestricted to leaf tips and margins. Yellowing (chlorosis)and death (necrosis) of the tips of oldest leaves progressesdown the margin to give an ‘arrow’ of normal tissue.
In wheat, the necrotic areas of the leaf have a distinctflame red appearance. There is premature death of theoldest leaves and the plants may be stunted, with shortenedinternodes. Stems may be weakened, causing lodging.These symptoms can be difficult to distinguish from thoseof some leaf diseases. Potassium deficiency can alsoresemble drought stress.
Soil levelsIn cereals, soil testing for potassium is only of
diagnostic value in identifying deficient areas. The testcannot be used to predict the amount of potassiumrequired by the crop. Information on responses in wheatto additions of potassium fertiliser in Western Australiais limited. In Western Australia, the Colwell soil test isused to estimate the current potassium and phosphorusstatus of soils in the top 10 cm of soil. On sandplain soilswith medium to high yield potential, economicresponses to potassium are unlikely if the Colwell soiltest is above 30 parts per million (ppm, or µg k/g soil, ormg K/kg soil).
CHAPTER 5 – NUTRITION THE WHEAT BOOK
92
POTASSIUM

On duplex soils, responses are more difficult to predictbecause of variability in the potassium supply from thesubsoil and the ability of wheat plant roots to access thispotassium. In paddocks with high yield potential,profitable responses in wheat have been measured wherethe soil test was up to 45 ppm. Where the soil test is above30 ppm, topdressing test strips of potassium fertiliser ontothe crop will help determine whether economic responsescan be obtained.
Potassium fertiliserPotassium chloride, known as muriate of potash,
containing 50% potassium, is the cheapest potassiumfertiliser available in Western Australia. It is imported,mostly from Canada. The fertiliser is composed of fineparticles that are typically about 0.2 to 0.5 cm square andabout 0.2 cm thick. The fertiliser is easy to cart, store andapply. Potassium chloride can be physically mixed withphosphatic fertilisers (single, double, and triplesuperphosphate, or DAP).
Potassium sulphate (25% potassium) is also available inWestern Australia but it is rarely used for wheat crops. Thisis because potassium sulphate has about half theconcentration of potassium as potassium chloride, so it ismore expensive per unit of potassium, and more needs tobe carted and applied. Also potassium sulphate is a finepowder that is more difficult to transport and apply.
TreatmentIf a soil test shows that potassium levels are low, a
decision about whether to apply potassium fertiliser willdepend on soil type, rainfall and the expected yield of thecrop. Where the paddock is in a cereal/legume rotation,applying potassium fertiliser in the legume year mayincrease the amount of nitrogen fixed for the followingcereal crop, as well as improving the potassium status of thepaddock. In low rainfall areas where the risk of leaching islow, potassium fertiliser can be topdressed followingseeding. Potassium fertiliser should not be drilled with theseed as it can severely reduce germination.
In medium rainfall areas, it is better to delay fertiliserapplication until four weeks after germination, when theplants have developed a root system to take up the fertiliser.Where potassium deficiency is diagnosed in a crop, aneconomic response to applying muriate of potash willdepend on how much growing season rainfall is left for thecrop to respond to the fertiliser. Applying muriate ofpotash at 40 to 80 kg/ha ha generally given the mosteconomic responses to potassium in wheat.
THE WHEAT BOOK CHAPTER 5 – NUTRITION
93
POTASSIUM (continued)

R.F. Brennan and M.D.A. BollandSulphur deficiency has rarely been diagnosed in wheat
crops in Western Australia because of the widespread use ofsingle superphosphate containing 10.5% sulphur.Deficiencies of sulphur are most likely to occur on thedeeper sandy soils of the wetter margins of the wheatbelt,in situations where triple superphosphate (containing up to1.5% sulphur) or DAP (containing up to 1% sulphur)have been used for several years.
SymptomsWith low nitrogen, sulphur deficient plants have pale
younger leaves, growth is retarded and maturity delayed.Where nitrogen had been applied, the sulphur symptomsbecome more severe. The entire plant becomes lemonyellow and stems redden. Symptoms for sulphur deficiencydiffer from those of nitrogen deficiency where old leavesare severely affected first.
Deficiency most often occurs in the wetter years andprogressively becomes more severe with successive yearswhen using fertiliser with low sulphur concentrations(DAP, triple superphosphate).
TreatmentSulphur deficiency can be avoided by using sulphur
containing phosphorus fertilisers supplying 5 to 10 kgsulphur/ha. These sulphur containing fertilisers need to beused in rotation with DAP or triple superphosphate in afertiliser strategy.
DiagnosisTissue test can act as a rough guide; 0.2% sulphur in
younger leaf tissue is the critical level used for many crops,but often the nitrogen to sulphur ration (N/S) is also avaluable guide. A ratio of greater than 19:1 often indicatessulphur deficiency.
A sulphur soil test has been developed for sulphur andis being tested in Western Australia. A soil test value of lessthan 10 ppm is suggested as indicating likely sulphurdeficiency, but this has yet to be confirmed for wheatgrown in field experiments on a range of different soils inWestern Australia.
CHAPTER 5 – NUTRITION THE WHEAT BOOK
94
SULPHUR

R.F. BrennanCopper deficient soils are widespread in Western
Australia. An estimated 8 million hectares, consisting ofone-third of south-west Western Australia, has receivedcopper in fertilisers.
Distribution of copper deficient soilsIn Western Australia, copper deficient soils are
widespread and have been identified on: calcareous aeoliansands formed on coastal dunes, organic soils, a range ofsoils formed on sandstones in Gingin-Dandaragandistricts, calcareous loamy sands and siliceous sands formedon marine limestone, soils with coarse textured A horizon(< 15% clay, 0-10 cm) formed from acid igneous andsedimentary materials such as laterite, dissected laterite,granule granitic, gneisses and occasionally fine texturedsoils formed from acid igneous or sedimentary materials.
Copper in wheat plantsCopper is an essential component of many plant
enzymes such as ascorbic acid oxidase, stocyanenocyanin,superoxidase dismutase and amino oxidase.
Copper is also essential for lignification which gives thewheat plant structural strength. ‘Wilting’ of Cu deficientplants is caused by structural weaknesses.
Copper deficiency also interferes with reproductiveprocesses. The deficiency appears to interfere with pollendevelopment at or near the stage of meiosis of pollenmother cells resulting in sterile pollen, which leads to poorgrain formation and shrivelled grain.
Factors influencing uptake by wheatplantsCopper and nitrogen
Increasing the soil nitrogen either from the addition ofnitrogen fertilisers or by legume pastures can induce copperdeficiency in wheat. The increased supply of soil nitrogenincreases the yield potential so that there is also a greatercopper requirement, which can induce copper deficiencyin wheat plants grown in soils with a marginal coppersupply. It is observed that nitrogen fertiliser severelydepresses the copper concentration in the wheat shoots bypromoting rapid growth of wheat plants compared to rootgrowth. The movement of copper within the plant,especially from old leaves to new leaves depends on thenitrogen status of the plants. Under high nitrogen status,there is little of no movement of copper from old leaves tothe new growth of wheat plants.
Copper and limingThe adsorption of copper by soil surfaces increases with
increasing soil pH. Adding lime to soils increases soil pH,thereby increasing adsorption of copper by the soil, and soreducing the amount of copper in soil solution. Therefore,liming would be expected to lower the copper availabilityto plants. This has not always been observed and soil pH is
often found to have a smaller effect on the availability ofcopper as measured by plant uptake.
Copper and herbicidesGlasshouse work has shown that chlorsulfuron and
diclorfop-methyl can decrease the uptake of copper (andzinc) were incorporated together in the soil. In the field,chlorsulfuron decreases the concentration of copper inshoots by as much as 30% which can induce copperdeficiency in wheat plants if copper soil supply is marginal.
Copper and ZincCopper deficiency can be induced in wheat plants if
zinc fertilisers are applied. This interaction is only ofsignificance if copper supply in the soil is marginal andappears to involve competition in uptake between copperand zinc by plant roots. Therefore, if copper is adequatelysupplied to the soil the addition of zinc fertiliser is unlikelyto induce copper deficiency.
Symptoms of deficiencyThe symptoms of copper deficiency reflect its function
in the plant.With increasing severity of copper deficiency the
symptoms are:Weak stems between the ear and top node becauselignification is restricted.Leaves of copper deficient plants readily become limpas they lose water during warm, dry periods of the day.This may be confused with moisture stress or wilting.In severely deficient plants, leaves may completelycollapse about midway between tip and base. This iseasy to confuse with manganese deficiency.Restricted grain filling – mildly copper deficient plantsproduce shrivelled grain but this may be confused witheffects of root rots, frost, drought, herbicide damage ormolybdenum deficiency.Partially filled ears – pollen sterility produces uneven orcomplete failure of grain-set in the ears. Affectedglumes have a loose, open appearance, which can beconfused with effects of root rots, frost, drought,herbicide damage or molybdenum deficiency.Empty ears – pollen sterility or premature death ofdeveloping reproductive tissue produces empty ears.In copper deficiency, dead tissue is typically white atfirst but may darken. Tip glumes may be more affectedthan basal glumes giving a ‘rat-tail’ appearance to theear which can be confused with roots rots, frost,drought, herbicide damage, or molybdenumdeficiency.Blackening – conditions such as copper deficiency thatmay inhibit grain filling, grain setting or ear and glumeformation without killing the vegetative portion of theplant, often lead to the accumulation of sugars in thestems and ear tissues. This often produces darkpigments as the tissues dry off. Blackening due tocopper deficiency may be confused with effects ofseptoria, frost, drought, herbicide damage or
THE WHEAT BOOK CHAPTER 5 – NUTRITION
95
COPPER

mechanical damage such as from galahs nipping offgreen ears.Death of growing points – copper deficiency may stopproduction of new leaves and the ear. The first tiller isusually less affected than secondary tillers. Successivetillers are produced and abort until all growing pointsdie. This can be confused with root rots, herbicide andinsect damage.Bleaching of leaf tips – moderate and severe copperdeficiency stops chlorophyll production in youngestdeveloping leaf tissue. This usually shows as yellow-white tissue extending back from the tip of theyoungest expanded leaf, while any emerging leaves areusually totally affected and eventually die.
Degrees of copper deficiencySlight deficiency
In slight copper deficiency most ears are filled withplump grain but there are a few shrivelled grains or emptyears.
The straw is weak below the ear, stems bend and snapeasily and are prone to wind and hail loss. Straw oc-casionally turns purplish-grey on the sunny side anddarkening or blackening may be seen around nodes and onglumes.
There are no leaf symptoms.Slight deficiency is unrecognisable before maturity and
is usually only noticed during harvest.Grain yield loss may be up to 20%, or higher where
ears fall to the ground.
Mild deficiencyMost ears contain only shrivelled grain, some ears are
empty and an occasional tiller is aborted when deficiencyis mild.
Often straw is purplish-grey on the sunny side, nodesare blackened and glumes are darkened.
Affected plants remain green after unaffected plantsmature. Occasionally some slight symptoms are seen onleaves but generally the deficiency is unnoticed untilhealthy crops are maturing or during harvest.
Grain yield loss is 20 to 60%.
Moderate deficiencyIn a moderate copper deficiency, there are few normal
ears. The grain is shrivelled and many white, empty, rat-tailor tipped ears are formed. Aborted tillers are common.
Straw is often darkened and plants tend to stay greenand continue tillering.
The youngest expanded leaf is white of yellow-whiteback from tip or has broad yellow streaks. Often this seenonly on the flag leaf while older leaves appear normal. Theemerging leaf is yellow-white. It dies and the tiller aborts.The leaf tips turn pale brown, roll and twist after death.
The plant appears slightly pale and limp but this is notnoticeable unless it can be compared to healthy plants.
Older leaves are darker green and appear normal.Root development is poor.A moderate degree of copper deficiency can be readily
identified when it occurs, but in the less severe cases mayonly become obvious at the flag leaf stage.
Grain yield loss is 50 to 90%.
Severe deficiencyNearly all tillers abort, nearly all ears die prematurely
and most fail to fully emerge from the boot when copperdeficiency is severe. Plants continue to tiller to produce a‘grass clump’.
Plants are generally pale and limp, even older leavesmay be affected so that the contrast between oldest andyoungest leaf may not be marked and resembles manganesedeficiency.
The tips of the youngest leaves are white to yellow-white. They die, become pale brown and often roll or twist.Roots are very poorly developed.
Severe deficiency can be seen from early growth stagesthrough to when ears would normally emerge. It can beseen as early as two weeks after germination when seed lowin copper is sown on severely copper deficient soil.
Grain yield loss is 90 to 100%.
TreatmentA single application of 3 to 9 kg/ha copper sulphate
provides enough copper for maximum yields for mostcopper deficient soils of Western Australia.
Forms of copperMany compounds are effective in supplying copper to
wheat plants when applied as fine powders. However,copper oxide mixed dry with superphosphate was only halfas effective as copper sulphate. Both sources appear to beequally effective when granulated with superphosphate.Slow release sources do not have any real advantage overcopper sulphate in the field because copper sulphate reactswith the soil to become a slow release fertiliser. Copperchelates that have high mobility and solubility in soilsolution may appear to have an advantage for increasedavailability for plant uptake. However, this advantage is lostor partly lost when iron and calcium ions replace thechelate copper.
Copper ore as long as it is the carbonate ore has beensuccessfully used as a copper fertiliser for wheat. Thesulphide ore has been ineffective in overcoming copperdeficiency of wheat.
All sources have different concentrations so copperwithin the product and amounts applied to the soil need tobe corrected for the recommended rate (based on coppersulphate). For example, if the recommended level ofcopper for a soil is 1.5 kg copper/ha, then 6.0 kg coppersulphate (25% copper), 3.0 kg copper oxychloride (52%copper) or 15 kg/ha copper carbonate ore (10% copper)would need to be applied.
CHAPTER 5 – NUTRITION THE WHEAT BOOK
96
COPPER (continued)

PlacementDistribution of copper through the soil is critical to
its availability to wheat plants. As copper is immobile inthe soil, wheat plant roots can only take up copper ifthey are in the vicinity of particles containing copper.The effectiveness of copper fertiliser is thereforedependent on the number and position of the copperparticles per unit volume of soil. Banding of copper withthe seed is more effective than topdressing andcultivating the soil that has been banded with copperalso increases the effectiveness of the fertiliser.Topdressing copper fertiliser is usually a very ineffectiveway of trying to correct copper deficiency unless thetopdressed Cu is subsequently mixed (cultivated)throughout the soil. Copper fertiliser is ineffective in soilcontaining few roots; e.g. surface soils whether plants aregrowing on subsurface (> 10 cm) moisture. Wheat plantscan be severely deficient in these situations even thoughfertilisers containing copper have been evenly appliedthroughout the surface soils.
Large granules of fertiliser containing copper are muchless effective than smaller or fine granules mainly becausedoubling the granule size reduces the number of granulesper unit volume of soil by up to one eighth (based onspherical granules.).
Re-application has not been necessary in experimentsas long as 30 years after the initial application – exceptwhere the initial application has not been high enough tosatisfy the need of crops grown under extremely highnitrogen supply.
Residual valueCopper application generally has a long lasting effect in
the soil (called residual value). A single application of 3 to9 kg of copper sulphate per hectare provides enoughcopper for more than 100 years of cropping with presentagricultural systems within Western Australia.
Copper trials based on various copper deficient soils tomeasure the residual value have suggested that copperfertiliser when applied at recommended levels lasts at least20 years to 35 years. The residual value of previouslyapplied copper compared to freshly applied copper wasmeasured on farmer properties throughout the Lakes,Jerramungup and Esperance districts and the copper wasfound to be fully effective 23 years after the initialapplication.
Soil and tissue levelsSoil analysis for copper can easily give erroneous figures
and interpretations, but when used correctly, copperextracted from soil by ammonium oxalate can show howmuch copper the soil is capable of supplying to plants. Itcan also indicate whether copper fertilisers have previouslybeen applied to a paddock, which is useful, if a propertychanges hands.
When a soil is extracted with ammonium oxalate a
THE WHEAT BOOK CHAPTER 5 – NUTRITION
97
COPPER (continued)
copper level of 0.3 (mg/kg) parts per million (ppm) orless in the top 10 cm of a soil indicates almost certaindeficiency for wheat, 0.3 to 0.8 ppm copper may bedeficient and 0.8 ppm copper and above is almostcertainly adequate. The DTPA soil extractionprocedure has not been calibrated for WesternAustralian soils on which wheat is grown to diagnosedeficiency of copper.
Wheat tissue analysisAnalysis of the youngest emerged blade (YEB) at the 5
to 8 leaf stages, but before flowering, provides the mostaccurate method of assessing copper status of the wheatplant. Provided the sample is not a mixture of copperdeficient and healthy plants, the interpretation is relativelysimple.
Interpretation of results from analysis of the copperstatus of the YEB can be summarised as:
Copper (ppm) Status
2 Healthy
1.6 to 2 Marginal
1.3 to 1.6 Mildly deficient
Less than 1.3 Moderately to severely deficient
GrainAnalysis of grain for copper has limited usefulness,
especially, if the sample is collected from both deficientand adequate plants (i.e. a harvester sample). If copperdeficiency is suspected at harvest it would be better toobtain both adequate (plants not displaying symptoms)and deficient plants where heads are ‘rat-tailed’ andgrain shrivelled. However, trials from Western Australiahave given some indication of copper levels required onthe grain for yield responses to applied copper forwheat.
Table 5.4 – Copper concentration in wheat grain
Cu concentration Likelihood of copper deficiency(mg/kg)
0.9 Severely copper deficient
1.0-1.2 Sometimes copper deficient on
marginal soil supply
1.3-1.5 Rarely copper deficient
1.6-1.8 Low, but not deficient
1.8-2.9 Normal
> 3.0 Sufficient
Copper may also be involved in the bread-makingqualities of wheat grain. This aspect of copper nutrition hasnot been investigated within Western Australianagriculture.

R.F. BrennanZinc deficiency in agricultural plants, including the
cereals wheat, barley, and oats, has been widely reported inWestern Australia. The need for zinc for plants was firstestablished in the 1930s, when its importance for thegrowth of wheat (and pasture species) was shown. Sincethat time, zinc has become an important fertiliser forcereals grown in soils of south-western Australia.
Zinc functionsZinc is involved in the enzyme systems of wheat plants
and is essential for promoting metabolic reactions. Zinc isessential for the production of chlorophyll andcarbohydrates within a plant. As a component of proteins,zinc acts as a functional, structural and/or regulatory factorin a large number of enzymes. Many of the physiologicaleffects resulting from zinc deficiency are associated with thedisruption of normal enzyme activity.
Photosynthesis, root membrane leakiness, auxinmetabolism and reproduction are all affected by zincdeficiency. Zinc also is involved in the RNA and DNAstructures of plants. Wheat grown on soils of WesternAustralia is particularly susceptible to zinc deficiency .
Distribution of zinc deficiencyExtensive areas of zinc deficiency in wheat occur
in Australia. In western and southern Australia wide-spreadzinc deficiency occurs in several million hectaresof calcareous, and siliceous sands and loams as wellas acidic soils. The most extensive area of zinc deficientsoils comprises of 8 million ha in south-westernAustralia.
Zinc deficiency in wheat plants appears where zinc hasnot been applied to inherently deficient soils or whereplant-available zinc in the soil has declined to inadequatelevels.
Zinc deficiency in wheat has been reported to beassociated with soils with both high soil pH (alkaline) andlow soil pH (acidic) that have low extractable zinc. Zincdeficiency has also been observed in wheat grown on limedsoils. That is, the rise in soil pH (less acidic) has inducedZn deficiency in wheat.
On light soils, after the initial zinc deficiency iscorrected, the zinc supply is maintained at adequate levelsfor unimpaired plant growth by applying ordinarysuperphosphate containing 400 parts per million (ppm)zinc at 150 kg/ha or more.
The zinc impurities (60 g/ha) contained in this amountof superphosphate will often correct the zinc deficiency insome soils. In these circumstances no further zinc fertilisershave been needed. However, applying less than 150 kg/haplain superphosphate or using low-zinc fertilisers such asimported DAP, causes the zinc supply to decline and wheatyields may be reduced.
Symptoms of zinc deficiencyThe symptoms of zinc deficiency in wheat are usually
seen on young seedlings early in the growing season. Zincdeficiency is more severe when light intensity is moderateand soils are cool and wet.
Deficiencies in wheat usually show on the middleleaves and extend into the new growth. The degree andextent of the symptoms depend on the severity of thedeficiency.
One symptom suggestive of mild zinc deficiency is alongitudinal pale green stripe on each side of the mid-veinof fully emerged leaves. The leaf tissue in this strip soondies and the necrotic (dead) area turns a pale brown. Insome plants, this stripe may occur only on one side of themid-vein. Necrotic patches usually appear along thesestripes. The leaf changes from green to a muddy greyish-green in the central areas of the middle leaves.
As the deficiency becomes more severe, there is ageneral paling (chlorosis) of the leaves. Stunted plants oftenhave ‘succulent-looking’ leaves or ‘diesel-soaked’ leaves,showing necrotic areas about halfway along the leaves,causing them to bend in the middle section. The necroticareas increase and are surrounded by yellow-mottling areas.At this stage the plants’ middle leaves collapse in the centre,causing leaf tips to droop. These symptoms are generallymore advanced in the older leaves.
While grain yields may be greatly reduced in theseverest cases of zinc deficiency, near maximum yields canbe produced by plants showing some vegetative symptoms.
Seedlings and plants affected by mild zinc deficiencyearly in the season, where soil conditions are cool and wet,tend to recover naturally in drier, sunnier conditions ofspring.
TreatmentInitial applications of 1 to 2 kg/ha zinc oxide (75%
zinc), depending on the soil type, will correct thedeficiency. Zinc sulphate and zinc carbonate are suitable
CHAPTER 5 – NUTRITION THE WHEAT BOOK
98
ZINC
Source % zinc
Zinc sulphate heptahydrate 23
Zinc sulphate monohydrate 36
Zinc oxide 78
Zinc carbonate 50-56
Zinc oxy-sulphates 15-45
Chelates
Zinc EDTA 8-14
Zinc HEDTA 6-10
Zinc NTA 9-13
Table 5.5 – Zinc fertilisers and Zn concentration

alternative sources to zinc oxide. However, the level mustbe adjusted to apply the same amount of zinc as suppliedby zinc oxide. Evenness of application is important.
A foliage spray of 1 kg/ha zinc sulphate (23% zinc) in50 to 100 litres of water applied as soon as zinc deficiencyis detected will prevent its development and reduce grainyield losses. Late foliage sprays of zinc applied to crops,which are recovering naturally in drier, sunnier conditions,may provide little additional benefit.
An annual application of phosphatic fertiliserscontaining 400 ppm zinc or more is important inmaintaining adequate zinc levels in soils. Locally producedphosphatic fertilisers except plain superphosphate allcontain 600 ppm zinc.
Residual effectivenessZinc has a significant residual effectiveness (that is, the
initial application of zinc fertiliser influences the growthand yield of subsequent crops and pastures), therefore, it isnot necessary to apply zinc to crops every year. The residualeffectiveness depends on the soil type, losses from thesystem (grain, animal product removal), additions to thesystem (impurities in fertilisers) and sorption reactionswith the soil.
Superphosphate, with 400 to 600 mg/kg Zn hasprovided adequate zinc for wheat crops decades after theinitial zinc application at the development of the soils fromvirgin scrub. Experiments have shown that on sandy andgravelly wheatbelt soils, an initial application of about 1 kgzinc/ha generally prevents deficiency for at least 16 years ifDAP with low zinc concentration is used. There is littleknowledge of the residual effectiveness on the fine texturedsoils which occasionally produce zinc deficiency in wheat.
Herbicides from the sulfonyl-urea and ‘FOP’ groupsinduce zinc deficiency in wheat where the soil has amarginal supply of zinc.
Soil and tissue levelsTissue tests for zinc can be useful in assessing the zinc
status of wheat crops, particularly before the head hasstarted to run up into the boot.
Whole tops are sampled, avoiding contact with anyzinc-containing or galvanised material. Samples should notbe washed in water from galvanised roofs or tanks, or fromscheme water.
Plant tops containing less than 12 ppm zinc arenoticeably zinc deficiency. Some visual and/or growtheffects have been recorded in wheat containing 12 to 16ppm zinc while levels of 20 ppm or more are normal.
The youngest emerged blade (YEB) is useful as a planttissue test in diagnosing zinc deficiency in wheat plantsbefore flowering.
Plants containing less than 10 ppm zinc in the YEB arezinc deficient while some visual symptoms and growtheffects have been recorded with zinc levels between 10 to
14 ppm. Zinc levels of 15 ppm or more in this tissueindicate an adequate supply of zinc.
Soil testsDTPA soil extractable zinc closely mirrored the growth
of wheat plants or individual soils but the relationshipvaried markedly between soils. That is, the critical level ofsoil extractable zinc for wheat plant growth varied betweensoils of varying soil texture. The fine textured alkaline soilhad considerably higher (about 4-5 times) critical levelthan the acidic sandy soils. The differences in the criticallevels of DTPA soil extractable zinc could be accounted forconsidering the pH, clay content and organic carbonconcentration of the soil.
For wheat the critical DTPA extractable zinc (mg/kg)was:
Critical DTPA zinc = 004 + 0.019 pH + 0.004 OC +0.003 clay
where: pH = soil pH measured in 0.01 m calciumchloride
OC = percentage organic carbon, clay = clay content(%) of the soil.
For example, an acid sand (pH 5, OC 1%, clay 3%)the DTPA soil extractable critical value would be about0.15 mg/kg zinc while a alkaline sand (pH 8, OC 1%, clay3%) would be 0.21.
Alkaline (pH > 7.5) clay soils (clay % > 40%) are foundto have a critical level of DTPA extractable zinc of about0.45 mg/kg.
Zinc in grainThe concentration of zinc in grain can be used with
limited ability to assess the zinc status of crops, butunfortunately it only diagnoses past problems (postmortem diagnosis).
However, it may identify sites/soils where futurecrops will respond to applications of zinc fertilisers. WithinWestern Australia, extensive research trials have foundthat critical concentration in grain of wheat is about 10mg/kg. However, this can often be misleading as zincdeficiency causes tillers to die and the zinc that is availableto wheat plants can be transferred to grains (to a smallersink) and filled to adequate or near adequate levels ofzinc.
Generally, low zinc levels in grain would be associatedwith concentrations less than 12 mg zinc/kg for wheat.
THE WHEAT BOOK CHAPTER 5 – NUTRITION
99
ZINC (continued)
Zinc concentration in:
Plant tops YEBInterpretation
< 12 < 12 Noticeably deficient12-16 10-14 Visual and growth/
effects measured> 18 > 15 Adequate

R.F. BrennanManganese was the first micronutrient deficiency
identified in broadscale agriculture in Western Australiawhen it was associated with the ‘grey speck’ disease of oatsand wheat. Although manganese deficiency in cereals iswidely distributed throughout the south-west of WesternAustralia, it is usually confined to irregular, well-definedpatches rarely exceeding 20 ha. With severe deficiency,grain losses may exceed $200/ha.
Manganese in wheatManganese has a role in many metabolic processes and
chlorophyll production. The complete role of manganese isnot fully understood, however, it is present in chloroplastsand it is also involved as a co-factor of many enzymes (e.g.decarboxylases, dehydrogenase).
Manganese is absorbed as the Mn+2 and in deficientplants manganese is relatively immobile and little istranslocated from older tissue to growing points. Wheatappears to be intermediately susceptible to manganesedeficiency with oats more susceptible and barley lesssusceptible.
The main regions of manganese deficiency in cereals inWestern Australia include:
The south-western edge of the wheatbelt: from thegravelly white gum country south of Moora and NewNorcia, through the powder-bark wandoo and brownmallet country of West Brookton, Wandering,Narrogin, Katanning and east to the gravelly, fluffy redmorrel, blue mallet and blue mallee country ofDumbleyung, Moulyinning, Kukerin, Kulin andCorrigin. Patches of manganese deficiency are seenevery year in this region.The narrow discontinuous coastal strip of lime-sandsfrom west of Northampton to Israelite Bay. Patches ofmanganese deficiency occur every year.South Jerramungup and Esperance Plains wheremanganese deficiency is seen in drier periods, often onbroad, gently sloping, mallee soils.Minor occurrences of manganese deficiency in cerealshave been seen throughout the remainder of the south-west, usually on gravelly soils on erosion surfaces or ondeep, leached, sometimes peaty, sands.Cereals have appeared little affected by manganese
deficiency on the deep grey sand where the manganesedeficiency ‘split seed’ disorder has devastated narrow-leavedlupin (Lupinus angustifolius) crops.
Manganese in the soilDivalent manganese (Mn+2) is absorbed by clay
minerals and organic matter and is the most importantmanganese ion in the soil solution for plant nutrition.
Manganese participates in many soil reactions,including oxidation and reduction, ion exchange, specific
adsorption and solubility equilibrium. As Mn+2 level in thesoil depends on oxidation-reduction reactions, all factorswhich influence these processes have impact on manganeseavailability to wheat plants. These include soil pH, organicmatter, microbial activity and soil moisture. Theavailability of manganese increases with increasing soilmoisture and declines with increasing soil pH.
SymptomsSeedlings of wheat usually grow normally until about
early tillering in the gravels and mallee soils, but earliereffects of manganese deficiency have been seen on lime-sands. Pale yellow-green patches with irregular but clearlydefined edges develop in the crop. These become paler asthe season develops and the wheat plants tend to wilt anddroop in warmer weather although soil moisture isadequate.
All the leaves of wheat, oats and barley become pale butsymptoms show first on older leaves before extending tonewer growth. The pale leaves become limp and soft,eventually dying, producing a dead and wilted basal flagleaf. A very weak head may be produced, or none at all ifthe plant dies prematurely from severe deficiency ofmanganese.
Copper deficiency can produce similar symptoms butusually in copper deficiency the older leaves are darkergreen than the younger leaves.
Manganese deficiency can often be mistaken for thefungal root disease take-all (Guanomyces tritici) except thatoats are immune to the fungus. Manganese deficiencyusually occurs each year in definite patches of characteristicsoils, although this may not be true of lime-sands.
Plant tissue levelsIn whole tops of wheat, a manganese level below 20
ppm indicates a possible problem and below 10 ppmindicates almost certain deficiency. In youngest emergedleaf blades a level of 12 ppm would indicate manganesedeficiency.
Spraying foliar manganese in strips across the crop cancheck indications gained from tissue analysis.
Soil testingThere will probably never be a reliable soil test for
manganese. This is because the concentration ofmanganese as the Mn+2 in the soil solution can vary byorders of magnitude within short periods of time withfluctuating soil conditions (e.g. soil moisture).
The soil test is regarded as no more than a rough guide.The top 10 cm of problem soils usually contain < 2 mg/kgof manganese extractable in hydroxyquinone or < 0.5 mgmanganese/kg that can be extracted in 1 M ammoniumacetate. Soil test for DTPA extractable manganese in thesoil have not been studied in soils of Western Australia.
CHAPTER 5 – NUTRITION THE WHEAT BOOK
100
MANGANESE

or dewy conditions of early morning or late evening. Twosprays may be needed three weeks apart for completecontrol of the deficiency in wheat plants.
Foliage sprays are useful for treating the usuallyscattered manganese deficient areas, where the deficiency isnoticed for the first time, or on areas where the deficiencyoccurs in some seasons but not others. It is also usefulwhere manganese superphosphate or ammonium sulphatedrilled with the seed has not fully prevented Mn deficiencyof wheat.
Spray-grade manganese sulphate, free of impurities, isusually available at a higher price then fertiliser grade. Arange of commercial products are available (for example,manganasol®, mantrac®) and are recommended to besprayed at comparable amounts of manganese as thatapplied in maganese sulphate.
Ammonium sulphateAcid-forming nitrogenous fertilisers increase the plant
availability of any reactive manganese in the soil.Ammonium sulphate, alone or as a component of Agras,and ammonium nitrate, have markedly reducedmanganese deficiency of wheat.
Ammonium sulphate often eliminates manganesedeficiency or reduces it to patches that can be spot-sprayed.Drilling Agras at 100 kg/ha or more reduces the risk ofirreversible growth retardation before a spray can beapplied and saves wasting manganese-superphosphate onnon-deficient areas. Agras applied at > 130-150 kg/hagermination of wheat seedling may be effected, but isstrongly influenced by soil moisture and rainfall eventsfollowing the high levels of Agras used.
Ammonium sulphate based fertilisers are best choicefor country prone to manganese deficiency and wherethere is no way of establishing the location of manganesedeficient patches of wheat.
Increased yields in response to the nitrogen contentusually more than pay for the Agras even where there is nomanganese deficiency.
Role of manganese nutrition andtake-all
Manganese has been reported to decrease the severity oftake-all. However, the effectiveness of manganese fertiliserfor reducing take-all depends on the method ofapplication. Manganese sulphate spread over the soilsurface before sowing (topdressed or broadcasted) had littleeffect in decreasing take-all. Whilst manganese sulphateplaced with the seed (drilled or banded with the seed) whilesowing wheat was only partly effective because there waslimited distribution of manganese around the roots of thewheat plants. Work done in Western Australia, suggestedthat take-all is more severe where plants are deficient inmanganese. However, there were no beneficial effects ofapplied manganese if the wheat plants were adequatelysupplied with soil manganese.
THE WHEAT BOOK CHAPTER 5 – NUTRITION
101
MANGANESE (continued)
Manganese concentration in grainManganese concentration in the grain of about 15
mg/kg can be a diagnostic tool for manganese deficiency ofwheat, but suffers by being retrospective. It can, however,be misleading as during maturation retranslocation ofmanganese from vegetative plant tissue, or from greatermanganese availability late in the season from the soil assoil temperatures increase (provided there is adequate soilmoisture), manganese can reach adequate levels in thegrain.
A retrospective diagnosis of Mn by grain analysis hasnot been extensively used in Western Australia or Australiawheat growing districts.
TreatmentManganese deficiency is controlled by:mixing manganese sulphate with superphosphate anddrilling it with the seed;spraying leaves with manganese sulphate; orproprietary products cotaining plant availablemanganese for foliar application;drilling ammonium sulphate fertilisers (such as Agras)with the wheat seed.
Manganese sulphate and superphosphateOn all soils, except highly alkaline soils (e.g. coastal
lime sands), 15 kg/ha manganese sulphate (fertiliser grade)mixed with superphosphate drilled with the seed givesprofitable grain increases in all cases. Some manganesedeficiency may still develop in the most deficientsituations.
Topdressed manganese sulphate is usually only half aseffective as drilling it with the seed – so twice as muchmanganese fertiliser is needed. Coarse-granulatedmanganese sulphate is markedly less efficient than fineparticles or powder, particularly in dry conditions.
Manganese-superphosphate is most profitable wheremanganese deficiency is known to occur in patches everyseason.
Table 5.6 – Manganese fertiliser and their Mnconcentration
Source % manganese
Manganese sulphate 26-30
Manganese oxides 41-68
Manganese chelate 12
Manganese carbonate 31
Manganese chloride 17
Foliar spraysManganese sulphate (spray grade) at 4 kg/ha in
100 L/ha water is usually very effective on cereals whenapplied immediately the symptoms show and before plantgrowth is retarded. Best results are obtained in cool, moist

R.F. BrennanWestern Australia has vast areas of highly weathered
acidic soils where the native levels of plant availablemolybdenum are extremely low for the maximum growthand yield of wheat.
Molybdenum in plantsAll plants require molybdenum where nitrogen is
absorbed as the nitrate form because molybdenum is acritical component of the nitrate reductase enzyme. Incereals, molybdenum is required for grain formation, asimpaired or incomplete grain filling is observed inmolybdenum deficient wheat plants. The heads ofmolybdenum deficient wheat are often barren of grain orcontain shrivelled grain. The heads produced are oftencalled ‘deaf ears’ or white heads. This is a non-specificsymptom of molybdenum deficiency in wheat as it couldoften be confused with copper deficiency.
Molybdenum is less soluble in acidic soils, andmolybdenum is more strongly adsorbed by soils as the soilsbecome acidic. Therfore, molybdenum concentrations insoil solution decrease as soils are more acidic or acidify,thereby inducing deficiency in wheat. So deficiency is notobserved in alkaline soils, and it becomes more prevalent assoils are more acidic, or acidify due to acidification causedby productive agriculture. Results in Western Australiashow that grain yield reductions in wheat due tomolybdenum deficiency are accentuated when ammoniumsulphate is applied. This is probably because ammoniumsulphate is acidic, and when it is drilled with wheat seed atsowing, the region of soil in the band drilled with the seedbecomes more acidic, so there is less molybdenum in soilsolution.
Molybdenum deficiency in wheat is restricted to theacidic members of the yellow-brown lateritic earthy sandsand sandy earths of the south-central, central, eastern,northern and north-eastern wheatbelt – where the pH (in-water) of the top 10 cm is less than 6.
About half of the 3 million hectares of these soils aremolybdenum deficient immediately after clearing butmolybdenum deficiency is almost certain to develop on theremainder as soil acidity increases.
The acid yellow sandy earths vary considerably in soilpH, clay and iron and aluminium sesquioxideconcentration, which are important soil factors indetermining molybdenum availability to wheat plants. Theacid yellow sandy earths are commonly known as ‘wodgil’soils because of the vegetation is often dominated bytammar (Casuaria campestries), mallee (Eucalyptusburracoppinensis), flame grevillea (Grevillea excelsior),Acacia spp. and quandong (Santalum acuminatum).
Molybdenum in the soilIf there is little Mo available for wheat uptake, it may
be because the total content is low in the soil, or there is a
low concentration of molybdenum in the soil solution dueto adsorption of molybdate to soil surfaces and theformation of discrete, secondary compounds.
Soil pH and the iron and aluminium sesquioxidescontents of soils have a significant effect on molybdenumavailability to wheat plants.
(i) Soil pH. The addition of lime increasing the soilpH resulting in an increased uptake ofmolybdenum by wheat.
(ii) Iron and aluminium. Iron and aluminium as freeions, colloids or coatings on soil constituents offermajor sites for adsorption and are a major factorin determining molybdenum availability to wheatplants in soils.
SymptomsMolybdenum deficiency can decrease wheat yield by
up to 30% before symptoms are seen.As molybdenum plays a vital role in the nitrogen
metabolism of wheat plants, deficiency initially expressesitself as a nitrogen deficiency.
The major symptoms of nitrogen deficiency are:reduced tillering, foliage and shortened internodes;
andplants generally paler (confused with manganese and
copper deficiencies).In most severe cases, symptoms specific to molybdenum
deficiency are:Delayed maturity, often occurring with empty heads –can be confused with copper deficiency, root rots, frostor drought.Severely affected plants may die, yet can often occur
near healthy, individual plants. It can be confused withcopper deficiency or root rots.
A symptom, which has been observed in theglasshouse in young wheat plants, is white, necroticareas extending back along the leaves from the tips. Itcan be confused with copper deficiency or herbicidedamage.
TreatmentThe methods of applying molybdenum to crops
include application of molybdenum fertiliser to the soil,coating the seed with molybdenum compounds orapplying molybdenum to crops as a foliar spray.
Molybdenum deficiency can be corrected by using amolybdenum added to superphosphate duringmanufacture. The recommended level of molybdenumapplication for soil application in Western Australia is 75 gof molybdenum/ha.
Molybdenum can be applied in several ways:sodium molybdate (39% molybdenum), ammonium
molybdate (54% molybdenum) and molybdenum trioxide(66% molybdenum). Molybdenum trioxide is least solubleof the sources but appears to be equally effective for plant
CHAPTER 5 – NUTRITION THE WHEAT BOOK
102
MOLYBDENUM

uptate and has similar residual effects. Molybdenite (MoS2,60% molybdenum) has a low solubility and has beenfound to be ineffective for plant update.
Applications of molybdenum as a foliar spray or as aseed treatment can be more effective than a soilapplication, but it needs to be added to each crop.
Molybdenum can be sprayed on foliage. Use 50 gsodium molybdate (39.6% molybdenum grade) in 50 to100 litres of water per hectare, which gives 20 g/ha ofmolybdenum. Although this is about one-quarter of therate recommended for soil application, foliage applicationis not generally recommended because re-application isneeded regularly and because of the molybdenosis risk.There is a range of molybdenum spray products that areavailable and should be used at the same molybdenumlevel and compared on price.
Residual valueWhile application of molybdenum is recommended on
new land, little is known about the need for re-application,as information about the residual value of molybdenum isscarce.
The availability of molybdenum declines at differentrates for different soil types, depending mainly on theiracidity and content of iron and aluminium oxides.
Soils that have a pH above 5.5 (in water) (about 4.5 incalcium chloride) in the top 10 cm a single application of75 g/ha molybdenum as fertiliser applied to the soil hasremained effective for 15 years or more.
However, on some yellow-brown sandplain soils of thecentral and north-eastern wheatbelt, where the surface pHhas been below 5.5 (less than about 4.5 in calciumchloride), and the pH of the 10 to 20 cm layer has been 4.5or lower (3.9 in calcium chloride), the effectiveness ofmolybdenum fertiliser applied to the soil has declinedrapidly over two to three years.
The need for molybdenum fertiliser should be checkedby tissue analysis or by test strips of the superphosphate-molybdenum mix compared with plain superphosphate(with no added molybdenum) applied at the same rate andon the same day.
The requirement for re-application of molybdenumcan be minimised by using seed taken from ‘high fertility’paddocks (i.e. those with adequate molybdenum levels),and avoid seed from highly acidic paddocks or whereammonium sulphate based fertilisers are used.
Tissue testsA plant test can diagnose molybdenum deficiency in
wheat at the time of sampling. The critical concentrationof molybdenum in the youngest fully emerged leaf appearsto lie between 30 and 50 mg/g (0.03 and 0.05 mg/kg).However, the tissue tests for molybdenum are expensiveand few laboratories can analyse the small samples of plantmaterial accurately enough for this diagnosis.
Soil testThere is currently no soil test available for identifying
molybdenum deficient soil.
Molybdenum in grainThe concentration of molybdenum in wheat grain has
some use as to indicate if molybdenum status of the soil islow. However, grain analysis is limited in that the reducednumber of grains through molybdenum deficiency canresult in grain with adequate moybdenum levels. Marginalmolybdenum levels in grain have been tentatively set at 0.1mg molybdenum/kg.
THE WHEAT BOOK CHAPTER 5 – NUTRITION
103
MOLYBDENUM (continued)

M.M. Riley, revised by R.F. BrennanBoron deficiency has been reported in eastern Australia,
but is rare in Western Australia, and the few isolated caseshave usually been associated with lime application.However, boron toxicity of wheat (and barley) has been ofconcern in the lower rainfall areas of Western Australia.
BackgroundIn Western Australia, the land surface has been stable
for a long period in recent geologic history, with large areasof uncoordinated drainage, large inputs of cyclic salt, andhigh evaporation. The association of these factors hasresulted in the saline groundwaters and surface waters andsaline or sodic soils which are problems in much of thesouth-west of the State, particularly eastwards of the 550mm rainfall isohyet. These semi-arid conditions are alsofavourable for the accumulation of boron in the soilprofile.
In general, both total and water-soluble boron can behigh in arid and semi-arid areas in which boron hasnaturally accumulated and leaching is limited. In theseareas boron in the subsoil often exceeds that in surface soils.Boron in such soils often exists as sodium or calcium salts,and is usually found at toxic levels in saline and sodic soils.The alkaline, sodic soils associated with boron toxicity inSouth Australia are also widespread in the medium to lowrainfall areas of Western Australia where boron toxicity hasbeen reported. However, the incidence of boron toxicity inwheat and barley appears higher in salt-lake areas,particularly in the south-eastern zone of the south-westland division.
Symptoms of boron toxicityGeneral
In a study of boron toxicity in a number of plant species,it was observed that the pattern of toxicity was related totype of leaf venation. Generally, however, the symptoms ofboron toxicity are similar on most plants, consistingprimarily of chlorosis and subsequent necrosis of marginand tip portions of leaves. Boron is concentrated in therelatively small necrotic areas near the leaf tips and margins.
Accumulation of boron in relatively small necrotic areasprovides a possible explanation for the observations thatyield decreases associated with boron toxicity are oftensmall.
CerealsIn barley, foliar symptoms characteristic of boron
toxicity have been reported in a number of studies andappear similar for a wide range of barley genotypes.
Genotypic variationAs soil amelioration appears unfeasible, focus has
centred on the exploitation of genetic variation in tolerance
as a possible solution to boron toxicity. Cereals aregenerally ranked as semi-tolerant to boron excess, withrelative ranking of barley, wheat and oats differing betweenstudies. It is evident from the contradictory rankingsreported in previous studies, that variation amonggenotypes of a cereal species (i.e. intraspecific variation)may be as large as the variation between cereal species (i.e.interspecific variation) in tolerance to boron excess.
Research work in Western Australia has shown thatvariation in tolerance to boron toxicity was found to existamong the cereal genotypes. The results suggested thatintraspecific variation might be as large as interspecificvariation among cereal genotypes in tolerance to borontoxicity. For example, Eradu wheat and Stirling barleyappeared to be the least tolerant of high levels of soil boron,while Mortlock oats were the most tolerant.
The relatively high tolerance of Halberd wheat wasderived from its ability to exclude boron, particularly athigh levels of soil boron. The internal tolerance to boron ofHalberd relative to Eradu wheat was not constant over theconcentration range examined. The critical toxicityconcentration (CTC) (associated with a 10% reduction inthe dry weight of whole shoots) determined for Halberdwas markedly lower than for Eradu. If, however, CTCvalues were determined at levels associated with 30%reductions in the dry weights of whole shoot, the value forHalberd would be markedly higher than for Eradu.
Symptoms of leaf injury from boron toxicity weremarked in all the cereal genotypes before the dry weights ofwhole shoot were decreased. Although the symptoms ofdark necrotic spotting were not evident, the wheat and oatgenotypes were similar to the barley genotypes in thatlarger amounts of leaf area from the tips and marginsbecame necrotic with increasing boron toxicity.
The findings of experimental work have importantimplications for evaluating cereal genotypes for toleranceto boron toxicity in the field. They indicate that therelationship between concentrations of boron in wholeshoots, ratings of leaf injury, and plant growth are notconsistent between genotypes.
The ranking of wheat and barley genotypes by ratingsof leaf injury has limitations, as the relationship betweenratings and yield loss is not consistent among genotypes.Generally, however, the genotypes with relatively highertolerances to boron toxicity had lower ratings of leaf injuryat both a given level of soil boron or a given concentrationof boron within the whole shoot.
Among wheat genotypes, the grain yield of Halberd hasbeen shown to be relatively higher on soils with ‘toxic’ than‘normal’ levels of boron. As Halberd has been shown toaccumulate relatively lower amounts of boron in the grain,it has been suggested that Halberd is relatively moretolerant (based upon exclusion) of excess boron in soils.However, no statistical relationship has been foundbetween the yields of genotypes of wheat and theconcentrations of boron in the whole shoots or grain.
CHAPTER 5 – NUTRITION THE WHEAT BOOK
104
BORON

Similar results among wheat genotypes have been observedin field experiments in Western Australia.
Cereal genotypes tolerant of boron toxicity can only beselected, therefore, by evaluating effects on growth.
Assessment(a) Leaf symptoms are the simplest method of
identifying boron toxicity, but even whensymptoms are present, it is almost impossible toaccurately gauge the effects on grain yield.
(b) Soil testing can identify high concentration ofboron in the subsoil and therefore soils with apotential to cause problems in wheat (and barley).A range of soil chemical extractants have beenused, such as mannitol, hot water and hot calciumchloride; hot calcium chloride is the nowpreferred extractant. Soils with boron values ofmore than 20 mg/kg by the hot calcium chloridemethod could cause boron toxicity problems.
(c) Plant tissue or grain analysis is of limited value inidentifying whether grain yields are reduced,although the grain concentration can be used toidentify potential problem soils. If the grainconcentration is 3 mg/kg or higher, then the cropwas grown on soil with a potential to developtoxicity problems.
THE WHEAT BOOK CHAPTER 5 – NUTRITION
105
BORON (continued)

J.W. Gartrell and M.D.A. BollandNutrient concentrations in wheat plants and their
different parts vary greatly depending on season,management practices, available soil nutrient levels andvariety. The ranges of the amount of nutrients commonlyfound in wheat grain and straw in Western Australiancrops are shown in Table 5.7.
The amounts of nutrients removed in one tonne of‘typical’ grain, straw-stubble left after harvesting grain, andhay, and the cost of fertilisers which would replace them,are shown in Table 5.8.
MaintenanceTo maintain the level of plant-available nutrients in the
soil in successive wheat cropping systems, more nutrientsmust be applied than is removed in wheat grain or otherproducts. This is to compensate for losses other than incrop products.
The nature and extent of other losses vary betweennutrients, soil properties and the amount and seasonaldistribution of rainfall.
The burning of cereal stubble causes little or no directloss of plant-available nutrients. However, importantquantities of nutrients may be lost if burning the stubbleallows severe wind erosion that would not otherwise haveoccurred.
NitrogenNitrogen is most prone to losses by biological processes
and leaching. Commonly the amount of fertiliser nitrogenneeded to maintain fertility is double the amount ofnitrogen removed in crop products.
In rotations of wheat with legumes the legumes may,for little or no cost, add more nitrogen to the soil than thatremoved in crop products.
PhosphorusPhosphorus is most prone to losses in solubility caused
by chemical reactions (known as fixation, reversion,adsorption, sorption, retention). Phosphorus mostlyleaches out of pale, coarse sands with high rainfall.
Losses of phosphorus by fixation in our soils are in therange of 2 to 10 kg of phosphorus per hectare per year,with about 4 kg/ha phosphorus being most common.
Periodic applications of superphosphate are usuallyneeded to replace the calcium and sulphur removed in cropproducts.
PotassiumPotassium is prone to leaching on soils low in clays and
organic matter with high rainfall. Only on very sandy soilsin the wetter parts of the wheatbelt are potassium losses byleaching likely to be significant.
Potassium removal in one tonne of hay or stubbleis much higher than in one tonne of grain. Many ofour sandy soils have low reserves of plant-availablepotassium.
The need to replace potassium removed in cropproducts will become increasingly common, particularlywhere straw or hay is repeatedly removed from the paddock.
Trace elementsThe amounts of trace elements removed in crop
products have a negligible effect on their supply, in plant-available form, in soils.
The needs for application or re-application of the traceelements are almost entirely governed by processes otherthan product removal, such as soil acidity.
Most Western Australian soils have large reserves ofplant-available magnesium. Magnesium deficiency rarelyoccurs in the wheatbelt.
CHAPTER 5 – NUTRITION THE WHEAT BOOK
106
NUTRIENT REMOVAL IN WHEAT CROP PRODUCTS
N P K S Mg Ca Cu Zn Mn
16 2 3 2 1 0.2 0.002 0.1 0.01
Grain to to to to to to to to to
26 3.5 7 3 1.5 0.4 0.004 0.30 0.05
2 0.2 6 0.4 0.5 0.6 0.001 0.01 0.01
Straw to to to to to to to to to
10 1.5 16 1.5 1 2 0.003 0.03 0.06
Mineral element content (kg)In one tonne of
N = nitrogen; P = phosphorus; K = potassium; S = sulphur; Mg = magnesium; Ca = calcium;Cu = copper; Zn = zinc; Mn = manganese.
Table 5.7. – The range of nutrients in wheat grain and straw found in Western Australian crops.

THE WHEAT BOOK CHAPTER 5 – NUTRITION
107
NUTRIENT REMOVAL IN WHEAT CROP PRODUCTS (continued)
Table 5.8 – Cost of replacing nutrients removed in 1 tonne of produce with ‘typical’ nutrient levels, using anappropriate type of fertiliser (1990 price). Costs of trace elements removed are negligible
Grain (kg)N 20 Urea 43 (a) 14.60P 2.5 OSP† 2705 5.00K 4 KCI†† 8 2.70S 3 Supplied by OSP Nil
Mg 1 Dolomite 7 0.40Ca 0.3 Supplied by OSP Nil
Straw (kg)N 5 Urea 11 (a) 3.70P 0.5 OSP† 5.0 1.00K 10 KCI†† 20 6.60S 0.5 Supplied by OSP Nil
Mg 0.7 Dolomite 5 0.25Ca 1 Supplied by OSP Nil
Hay (soft dough stage)N 16 Urea 34.5 (a) 11.70P 2.1 OSP† 23 4.20K 12 KCI†† 24 7.90S 1.5 Supplied by OSP Nil
Mg 1 Dolomite 7 0.40Ca 1 Supplied by OSP Nil
Amount in1 tonne of product Type Rate (kg/ha)
Approximate cost150 km from Perth ($)
FertiliserNutrientelement
† OSP = Ordinary superphosphate (9.1% P).†† KC1 = Muriate of potash.Note: (a) Cost of nitrogen may be zero if legumes are profitably grown in rotation with wheat.

CHAPTER 5 – NUTRITION THE WHEAT BOOK
108

Chapter Coordinators: Alexandra Edward, Alan HaagensenWheatbook 1 Authors: J. Rowland and M.W. PerryRevised by: B. Bowden (nutrition), P. Blackwell (soil structure), P. Carmody(canola), M. Ewing (pastures), R. Kingwell (economics), R. Loughman (disease),I. McFarlane (animals), P. Michael (insects), P. Nelson (lupins), I. Pritchard(pulses), C. Revell (pastures), G. Riethmuller (tillage and stubble), K.H.M.Siddique (pulses), M. Sweetingham (diseases) Edited by: P. Watt
‘Rotation’ types ............................................................................................112Ley farming ........................................................................................................112All crop systems ..................................................................................................112Phase crop/pasture systems ................................................................................112
Soil fertility ..................................................................................................114Depletion of soil nitrogen ..................................................................................114Accumulation of soil nitrogen ............................................................................114Fluctuation in nitrogen levels ..............................................................................114Nitrogen balance ................................................................................................114Other nutrients ..................................................................................................115Effect of legumes on soil nitrogen ......................................................................115Nitrogen balance ................................................................................................116
Soil structure ................................................................................................117
Soil moisture ................................................................................................118
Weeds, diseases and insects ..........................................................................119
Livestock production ....................................................................................120
Effect of legumes on cereal yield and quality ..............................................121Legume pasture:cereal rotations ..........................................................................121Lupin:cereal rotations ..........................................................................................122Field pea:cereal rotations. ....................................................................................123Chickpea:cereal rotations ....................................................................................123
Effect of wheat on subsequent crop/pasture ................................................125
Disadvantages of legume rotations ..............................................................126
Canola in rotation with cereals ....................................................................127Cereal following canola ......................................................................................127Canola following cereal ......................................................................................127
Rotations and stubble ..................................................................................128
Rotations and farming systems ....................................................................129
References ......................................................................................................130
THE WHEAT BOOK CHAPTER 6 – WHEAT IN FARMING SYSTEMS
109
CHAPTER SIX
WHEAT IN FARMING SYSTEMS

CHAPTER 6 – WHEAT IN FARMING SYSTEMS THE WHEAT BOOK
110

Wheat production is a prominent and common landuse on many Western Australian farms. Wheat crops fitwell among other farming enterprises and they highlightthe benefits of growing cereal crops in rotation with otherspecies.
Rotations have commonly been defined as:“the growing of crops and/or pastures in a fixed
sequence with the aim of maximising the long termproductivity and profitability of the farm”.
In fact, this concept of rotation is proving to be toorestrictive because economic and technological changes areoccurring so fast that land use sequences are not necessarilyrepeated in a fixed sequence. However, the concept ofusing a range of species, particularly crop and pasturelegumes, between cereal crops remains a central element ofour farming system and these sequences loosely fit theconcept of rotation. The opposite of rotation is continuouscropping of a single species which with cereals, isconsidered exploitative of the environment and eventuallydetrimental to profitability.
Usually the rotation sequence includes wheat oranother cereal crop grown in rotation with a broadleaved(non-cereal) plant. The common broad-leaved plants arepasture, grain legumes and Brassica species such as canola.The benefits of rotation versus continuous cereal cropping(or fallow/crop) are due to:
improvements in fertility: nitrogen (legumes only);– recycling of nutrients, for example potassium;– improvement of soil structure;complementary soil water use, (as one phase of therotation may leave water stored for use by a subsequentcrop);reduced depletion of soil organic matter anddegradation of soil structure (Hamblin and Kyneur1993);integrated weed management: improved options forcontrolling weeds through the use of herbicides of adifferent herbicide family as well as grazing and othercultural methods such as green manuring;disease control through breaking of disease cycles;pest control: insect pests such as webworm, desiantha,and cereal cyst nematode can be controlled in rotation;better use of capital equipment and labour may bepossible if the components of the rotation are notcompetitive in their requirements; anddiversification of sources of income: particularly wherepastures and livestock production form an importantpart of the farm system.
THE WHEAT BOOK CHAPTER 6 – WHEAT IN FARMING SYSTEMS
111
WHEAT IN FARMING SYSTEMS

Ley farmingIn the past, wheatbelt pasture legumes in Western
Australia were mainly subterranean clover (Trifoliumsubterraneum), species of annual medics (Medicago) andmore recently, serradella (Ornithopus compressus). Thesespecies were chosen in part for their adaptation to commonsoil types but also for their ability to naturally regenerate,following cropping, from seed reserves in the soil. Theselegume-based pastures were sown once and were capable ofsurviving one or two years of crop before regenerating toform a legume dominant pasture. The sustainability of thissystem, commonly called the ley farming system, has beenchallenged by the adoption of longer cropping sequenceswhich now occur following the wide scale adoption ofpulses (lupins, faba beans, chickpea, field pea and lentils)and oilseed crops (canola). The seed pool of the annualpasture legume is unable to survive in sufficient numbersduring the extended cropping phase, to produce a legumedominant pasture. Self-regenerating pasture rotationsremain a particularly important rotational option insituations where the profitability of pulses is poor due tolow or unreliable yields, but where a pasture legume canpersist as part of an intensively cropped system.
All crop systemsThe development of pulse and oilseed crops have
allowed the emergence of systems that have a strongemphasis on crop production while preserving most ofthe rotational benefits previously obtained with self-regenerating pastures. Such systems also avoid theproblems of long term cereal monoculture. While simplerotations involving wheat and lupins have been aprominent and profitable land use in Western Australiain the 1980s and 1990s, there are doubts now abouttheir long-term sustainability. Heavy reliance ona narrow spectrum of weed control strategies,particularly for selective herbicides, has led to theemergence of herbicide resistant weeds which nowthreaten the profitability and sustainability of suchsystems. The inclusion of canola into such rotations ishelpful in providing an opportunity for contrasting weedcontrol strategies to be adopted, and to reduce diseasethreats by increasing the grow-back time between cropspecies. However, further increases in rotationalcomplexity are desirable, particularly the option of apasture phase.
Phase crop/pasture systems‘Phase farming’ is a modification of ley farming but
with much less connection between the crop and livestockenterprise at the paddock level (Reeves and Ewing, 1993).In the context of pastures, short term phases (one to threeyears of pasture) are used to break up long croppingsequences, restore soil fertility and control troublesomeweeds. The length of the cropping sequences are such that
pastures are unable to regenerate without intervention. Forannual pastures, resowing at the start of each pasture phaseis therefore required. Under these circumstances the highlevel of hard seed necessary to ensure persistence through acropping phase becomes unnecessary and may actuallyinhibit dense regeneration in the years followingestablishment. Plant characteristics for annual ‘phase’pasture species are quite different from traditional self-regenerating species and include
low to moderate levels of hard seed;adaptation to soils where intensive cropping ispractised; compatibility with the use of non-selective herbicidesfor weed control; ability to fix nitrogen despite a build up in soil fertility;ability to compete with volunteer species under a widerange of grazing regimes; andlow seed cost because of the need for frequent resowingand to encourage high seeding rates.Aerial seeding of pasture legume species (for example,
French serradella) is now being developed for ‘phase’pasture systems which can be directly harvested with cerealharvesting technology to reduce the cost of seed. Expandedopportunities for weed control arise in a phase pasturesystem. In the last year of the pasture phase, destructivetechniques like mowing, hay freezing, hay cutting, silagemaking and green manuring are possible since there is norequirement for legume seed production to sustain thesystem.
‘Phased’ pastures also lend themselves to the inclusionof perennials in the farming system with the associatedbenefits of a reduced groundwater recharge and theproduction of a high quality feed source outside thenormal growing season. There are clear advantages for theinclusion of herbaceous perennial legumes such as lucernein pasture phases of three to four years, followed by asimilar period of annual crops. Shrub legumes such astagasaste may also play an important role in stabilising thehydrological cycle but are more likely to be used in an alleysystem rather than a ‘phase’ pasture system.
In the Western Australian wheatbelt, pasture legumesare mainly subterranean clover (Trifolium subterraneum);species of annual medics (Medicago sp.) and serradella(Ornithopus sp.), although many new species are now beingcommercialised. The main grain legumes are the narrowleaved lupin (Lupinus angustifolius), desi chickpea (Cicerarietinum), field pea (Pisum sativuam), faba bean (Viciafaba), lentil (Lens culinaris) and vetches (Vicia sp.).Common legume species and their favoured soil types arelisted in Table 6.1.
CHAPTER 6 – WHEAT IN FARMING SYSTEMS THE WHEAT BOOK
112
ROTATION TYPES

THE WHEAT BOOK CHAPTER 6 – WHEAT IN FARMING SYSTEMS
113
ROTATION TYPES (continued)
Plant Species Soil Types
Subterranean Clover Trifolium subterraneum Acid to neutral loams and sands
Balansa clover Trifolium michelanium Wet sandy loams to clay loams
Barrel medic Medicago truncatula Alkaline heavy clay loams
Strand Medic Medicago littoralis Neutral to alkaline sandy soils
Sphere medic Medicago sphaerocarpos Mildly acidic sandy loams and loams
Burr medic Medicago polymorpha Slightly acid to heavy grey clays, loams and sandy loams
and on neutral to alkaline heavy red soils
Yellow serradella Ornithopus compressus Acidic deep sands, loamy sands
French serradella Ornithopus sativus Acidic deep sands, loamy sands
Biserrula Biserrula pelecinus Acid to neutral sands and loams
Lucerne Medicago sativus Mildly acidic loams and sandy loams and on neutral to
alkaline heavy red soils
Narrow-leaved lupin Lupinus angustifolius Acidic to neutral deep sands, sandy loams and deep
duplex soils.
Field Pea Pisum sativum Slightly acidic loams Neutral to alkaline clay loams and
loams
Chickpea Cicer arietinum Slightly acidic loams to alkaline clay loams. Neutral to
alkaline loams and clay loams.
Faba Bean Vicia faba Slightly acidic loams to alkaline clay loams
Lentil Lens culinaris Neutral to alkaline loams and clay loams
Vetches Vicia sp Wide range of soil types pH 4.5 -9.0 in Cacl2
Table 6.1 – Legume species of the Western Australian wheatbelt

Sowing the pastures to wheat caused a rapid decline intotal soil nitrogen in the first crop, but only a slowsubsequent decline. Wheat yields also increased withincreasing length of the preceding pasture phase, but themain effect was seen after the first two years of legumepasture.
Nitrogen balanceAlthough a great simplification (that is, considering all
soil nitrogen as a single pool), the balance betweenaccumulation and depletion of soil nitrogen was formalisedin a simple equation by one worker in 1971:
Change in soil N = -kN + aThe change in soil nitrogen is over some period, usually
a year; ‘k’ is a nitrogen loss coefficient for soil organicnitrogen – to account for losses like mineralisation,leaching and volatilization. ‘N’ is the nitrogen content ofthe topsoil (say 0 to 10 cm) and ‘a’ is the accumulation ofnitrogen in a specified time for the same volume of soil.The equation says simply that the change in soil nitrogenis equal to the sum of the gains and losses from the pool ofsoil nitrogen over a year.
For a fallow-wheat rotation in South Australia, ‘k’ wastaken to be 0.04 and ‘a’ was 20 kg/ha/year. The equationsuggests that from 3000 kg/ha of soil nitrogen at the startof cropping, only about 1000 kg/ha remained after 50years and an eventual new equilibrium, (where gains equallosses), of 500 kg/ha of soil nitrogen was reached.
Introducing legume pastures to a rotation changes both‘a’ and ‘k’. There have been a considerable number ofestimates of nitrogen accumulation under temperatepasture legumes in southern Australia. In a review of Nfixation in annual legumes by Unkovich et al. (1997), data
CHAPTER 6 – WHEAT IN FARMING SYSTEMS THE WHEAT BOOK
114
SOIL FERTILITY
The most important feature of legumes is that theyhave the ability to make or ‘fix’ their own nitrogen from theair, when effectively nodulated. This ‘nitrogen fixation’ isachieved by the successful symbiosis of the plant and abacteria called Rhizobium, found in nodules on thelegume’s roots. The accumulation, depletion andsubsequent cycling of soil nitrogen is the most importantinteraction in the legume-cereal rotation.
Although grain legumes have been shown to improvesoil fertility by increasing the nitrogen status of the soil, thelong-term effect of continuous cropping is a generaldecline in soil fertility and surface structural condition.
Depletion of soil nitrogenCereals remove about 18 kg of nitrogen per tonne of
grain at 10.3% protein. Burning or grazing of stubbles willcause additional losses, but these are small as little nitrogenremains in mature stubbles (which at 0.2% nitrogen, willcontain about 3.8 kg of nitrogen per tonne of grainharvested).
All cereal crops use the nitrogen that is supplied whensoil organic matter is mineralised. Mineralisation may bepartially balanced by non-symbiotic nitrogen fixation(from other free living soil microbes) and by someincorporation of fertiliser nitrogen into organic matter, butsoil nitrogen tends to decrease in continuous cerealcropping.
Accumulation of soil nitrogenUnder undisturbed leguminous pastures, soil nitrogen
increases and the quantity of symbiotically fixed nitrogenexceeds the mineralisation of organic nitrogen.
The nitrogen fixed during a legume pasture phase or bya grain legume crop is incorporated into organic matter inthe soil. This soil nitrogen does not form a single ‘pool’, butis present in many different forms depending on its sourceand age.
Some pools of nitrogen are highly resistant tobreakdown. Nitrogen derived from recent inputs of cropand pasture residues can be mineralised rapidly and be amajor contributor to subsequent plant growth. Forexample, about 3% of total organic nitrogen maymineralise over a season, however this may include 40 to50% of last year’s organic nitrogen. Any serious attempt toestimate the value of residual nitrogen for a following cropmust account for these differing pools.
Fluctuation in nitrogen levelsWhere crop and pasture phases alternate, soil organic
nitrogen will fluctuate as in Figure 6.1, where thesubterranean clover pasture increased soil nitrogen byabout 64 kg/ha/year. This is nitrogen incorporated intoorganic matter, much of which is not immediately availableto a following cereal crop.
Figure 6.1
Soil nitrogen increases under pasture and decreases in crop

nodulation and N fixation and legume crops use moresoil N where soil N levels are high (Jessop andMahoney 1985)crop N demand – crops growing vigorously requiremore N than poor crops, so will derive a greaterproportion of their N from fixationlegume species – faba bean and lupin appear to fixmore N than field pea and chickpeaThe amount of N that is left for following crops also
depends on the partitioning of N within the legume crop.One of the aims of growers and agronomists is to improveseed yields; increasing yields involves the removal of largeamounts of N in the harvested grain. In some cases, usuallywhere soil N contents are high, more N is removed in theseed than the crop actually fixes from the atmosphere. Thisresults in a depletion of soil N (Unkovich et al. 1997,Schwenke and Herridge 1998).
Grain legume crops may also enhance N supply tosubsequent crops through ‘N sparing’ (Herridge et al.1995). Nitrate levels in the root zone of legume crops areusually higher than in the root zone of non-legume crops.It has been proposed that legumes place less demand onsoil N than other crops, due to their ability to fixatmospheric N, allowing it to accumulate as it is releasedfrom soil organic matter.
Some researchers dispute this interpretation, claimingthat the elevated nitrate levels are due to N exudation fromthe crop roots, implying that standard methods underesti-mate the amount of N fixed by these crops. There isevidence in favour of both interpretations so the issuecannot be resolved at present. In either case, the amount ofN available to a subsequent crop is likely to be greater thanestimated.
THE WHEAT BOOK CHAPTER 6 – WHEAT IN FARMING SYSTEMS
115
SOIL FERTILITY (continued)
for subterranean clover pastures ranged from 0 to 188kg/ha/yr N fixed with an average of 92 kg/ha/yr (which didnot include N fixed in underground biomass). Precisemeasurement of k, the decomposition constant, is rare, butvalues of 0.029 and 0.013 have been measured for twoannual pastures. These are much lower values than for acrop where cultivation hastens mineralisation of theorganic matter.
Rotations of alternating pasture and crop willaccumulate and deplete soil nitrogen around a value whichwill depend on the length of the pasture phase. For cerealcrops, what is important is not the actual levels or trends intotal soil nitrogen but the level of mineralisation that willmake nitrogen available to the crop.
Assuming that 2% of soil organic matter ismineralised in pasture (kp=0.02) and 4% for a crop (kc =0.04), the equilibrium soil nitrogen levels, andmineralisation on breaking up the pasture are shown inTable 6.2.
Table 6.2 – Effect of rotation on equilibrium andmineralisation levels of soil nitrogen
Equilibrium soil Mineralisationnitrogen (kg N/ha)(kg N/ha)
Continuouspasture 3,350 1342 crop :4 pasture 1,925 771 crop :1 pasture 1450 58
Continuous crop 500 20
In reality, soil nitrogen does not exist as one pool; andthe values of ‘k’ and ‘a’ change with season, crops andcultural conditions. Nevertheless, the equation demon-strates how the nitrogen flows in a rotation of legumepastures and crops.
Other nutrientsIncreases in organic matter under pastures not only
store nitrogen, but also phosphorus and sulphur, whichmight otherwise be leached or bound to soil minerals.Cation exchange capacity is also increased which assists inretaining nutrients such as potassium and manganese.
Effect of legumes on soil nitrogenGrain legume crops do not derive their entire N from
fixation as some N is taken up from the soil. The Nfixation process is ‘metabolically expensive’; requiringenergy that could otherwise be used for growth. So legumestend to use soil N in preference to fixed N, especially ifthere is a large amount of soil N available.
The proportion of crop N derived from fixationdepends on:
availability of soil N – nitrate in the soil suppresses
Field pea Chickpea Faba bean Lentil0.8
1.2
1.6
2.0
0 20 40 80
(1.58) (0.57)
(4.42)(0.31)
wheat after wheat
1993
whe
at y
ield
(t/h
a)
1993 N rate (kg/ha)
1992 crop
Figure 6.2
Grain yield of Kulin wheat grown in 1993 (without N fertiliser) after
various pulse crops in 1992 (bars) at Pingaring. Figures in
parentheses are pulse yields in 1992. Black squares show the
yield of wheat in 1993 when grown after wheat with various rates
of nitrogen fertiliser (top axis – unpublished data K. Siddique).

Nitrogen balanceChickpea and field pea grown in southern Australia
generally leave behind less fixed N than narrow-leafedlupin. However, the net nitrogen balance variesconsiderably within a species depending upon otherenvironmental factors.
At Pingaring in 1993, wheat yields after chickpea wereabout the same as after field pea, but not as great as afterfaba bean or lentil. More than 50 kg N/ha had to beapplied before the wheat yields grown after wheat werematched by wheat grown after pulses in the absence of Nfertilizer (Figure 6.2).
In one trial at Goomalling in 1997, a chickpea cropyielding 0.96 t/ha produced a positive N balance of 22
kg/ha. This was equivalent to the N removed in a 1.5 t/hawheat crop (Figure 6.3).
In Western Australia we can expect cereal yields andgrain protein to be better after grain legumes than after anon-legume crop. In many, but not all cases, this will bedue to improved soil N supply.
In an experiment at Badgingarra, summarised in Figure6.4, a subterranean clover and wheat rotation maintainedtotal soil nitrogen, but a lupin:wheat rotation andcontinuous wheat reduced it steadily. Thus, grainlegume:cereal rotations, whilst providing significantrotational benefits, are in general not as effective as legumepasture in maintaining soil nitrogen.
CHAPTER 6 – WHEAT IN FARMING SYSTEMS THE WHEAT BOOK
116
SOIL FERTILITY (continued)
Figure 6.4
Different rotations affect the rate of decline of soil nitrogen
Narrow-leafed lupin
Mean 214 77 165 68
Range 53-322 29-97 30-283 -41-141
Field pea
Mean 122 68 83 14
Range 61-227 31-95 26-183 -32-96
Chickpea
Mean 115 60 70 8
Range 83-146 37-86 43-124 -41-56
Total above-groundcrop N
(kg/ha)
% total Nderived from fixation
Total N fixed
(kg/ha)
N remaining afterharvest
(kg/ha)
Table 6.3 – Summary of measurements of the nitrogen balance of narrow-leafed lupin, field pea and chickpea crops insouthern Australia (adapted from Unkovich et al. 1997)
-40
-20
0
20
40
60
80
(-)
N B
alan
ce (
kg/h
a)
(0.7)
(1.0)
(1.0)
(1.5)(0.9)
Med
ic
Whe
at
Can
ola
Fie
ld p
ea
Chi
ckpe
a
Faba
bea
n
Lupi
n
(1.8)
Figure 6.3
Nitrogen balance of various crops at Goomalling in 1997. Figures
in parentheses indicate seed yields (t/ha – unpublished data, A.
McNeil).
Tota
l soi
l nitr
ogen
(%
)

The physical structure of surface soils as measured bysuch properties as soil strength, aggregate stability andporosity, improves under pasture and decreases under crop.
Changes in percentage for water stable aggregates in theWongan Hills rotation trial (Figure 6.5), follow an almostidentical pattern to that recorded for total soil nitrogen (seeFigure 6.1).
The longer the length of the pasture, the greater theincrease in amount of water stable aggregates. Althoughaggregation increased slowly under the pasture, it decreaseddramatically in the first year of crop following cultivation,to establish a seedbed.
Degradation of soil structure is most significant on thefine textured soils such as salmon gum/gimlet and moortsoils. These soils contain silt or fine sand in the surface andwhen cultivated too frequently or when too wet, slake, andform impermeable crusts.
The physical degradation of some fine textured soilscan mean that the soil is no longer able to absorb theincident rainfall; the soil surface becomes crusted and thesoil so dense that germination and root growth areimpeded. In order to maintain soil fertility and surfacestructural condition in an intensive cropping system, it isessential that tillage is reduced to a minimum and stubbleis retained. It is also desirable to incorporate a pasture phaseinto the cropping program. Pasture has been shown to havea highly beneficial effect on soil structural condition byincreasing aggregate stability through improved soilorganic matter content.
On these (fine-textured) soils, improvement ormaintenance of a porous surface structure is vital for cropproduction, which implies that organic matter should be
accumulated in the surface. Periods of pasture are the mostbiologically effective way of providing organic matter.
New cropping techniques which reduce the loss oforganic matter caused by tillage, are also effective inmaintaining or increasing soil organic matter andstructural stability in periods of cropping.
An absence of ploughing or scarifying as well asconservation of crop stubbles, will reduce the loss oforganic matter by oxidation after cultivation and stubbleburning. Sowing with narrow points or discs (‘No-Till’)will also reduce loss of organic matter by oxidation andhelp conserve root channels.
THE WHEAT BOOK CHAPTER 6 – WHEAT IN FARMING SYSTEMS
117
SOIL STRUCTURE
Figure 6.5
Pastures increase soil aggregate stability; cropping decreases
aggregate stability
Increases in soil organic matter should improve themoisture holding capacity of poorly textured sandplainsoils.
It is possible that under pasture there may be moremoisture left further down the profile because of therelatively shallow roots of the pasture legumes. This is alsopossible after field peas which are also relatively shallowrooted. This moisture would be available to a followingcereal crop especially if there is a dry finish to the season.This is not the case with lupins which are a deep rootingplant and which remove water from deep in the profile.
CHAPTER 6 – WHEAT IN FARMING SYSTEMS THE WHEAT BOOK
118
SOIL MOISTURE

The effects of a pasture on weeds, insects and diseasesappearing in the crop have been widely acknowledged, butlittle studied. Legume pastures are seldom monoculturesbut undergo changes in composition as non-legumespecies invade to use the increasing soil nitrogen.
Grasses, which may be important components of thepastures, are alternative hosts for the serious root disease‘take-all’ (Gaeumannomyces graminis) and for cereal cystnematode (Heterodera avenae). Some legumes hostnematode diseases such as root lesion nematode(Pratylenchus neglectus) (see section on root disease,Chapter 10).
Cereal pests are usually more damaging after a pasturephase, as several species are able to increase in pastures andcarry over into the crops. In particular, webworm,redlegged earth mite and lucerne flea are clearly favouredby pasture. This transfer into crops is aided by reducedtillage methods. Most of the other pests are just as likely tocause problems after crops.
Paddocks which have been grassy through summer andautumn are likely to contain webworm which will damageemerging crops, unless the paddock is workedconventionally or insecticide is added to the knockdownherbicide. Pasture paddocks which have not been very wellgrazed in spring and summer will contain large numbers ofredlegged earth mite and lucerne flea eggs which will hatchin autumn/winter.
Grasses and broadleaved plants which have built up inthe pasture may increase weed burdens in the followingcrop. One of the advantages of including a legume crop inthe rotation is the opportunity it presents for improvingthe control of grass weeds. Broadleaved weeds arecontrolled more easily in the cereal crop.
THE WHEAT BOOK CHAPTER 6 – WHEAT IN FARMING SYSTEMS
119
WEEDS, DISEASES AND INSECTS

The introduction of legumes into pastures hasincreased livestock production through the quantity andquality of the legumes themselves and through the effect ofimproved soil fertility on the production of other pastureplants.
A further advantage of an annual legume pasture is itspotential to produce large quantities of seed. A proportionof hard seed in subterranean clover allows successfulregeneration of a pasture, even when following a year ofcrop. With medics, the higher level of hard seed can allowregeneration after two years of crop. The seed and thesurrounding burr of clovers and medics can be a valuablefeed reserve for the dry summer. However, the risk of soilerosion and a reduced pasture density in the following yearshould not be overlooked.
Similarly, lupin stubbles give valuable summer grazing.That is, provided that care is taken to minimise the risk oflupinosis and soil erosion (by destocking before theresidual seed levels fall to 50 kg/ha.
The increase in wool and meat production andinclusion of crop legumes has increased farm income andreduced income variability.
Livestock, in particular sheep, are an integral part of asustainable farming system. With increased use ofherbicides, grasses are evolving that are resistant to thesechemicals. Grazing management provides an extra tool inmanaging herbicide resistance.
Stubble from the cereal phase of the rotation can beutilised by sheep. The grazing value of the stubbles isvariable and depends on the level of grain loss duringharvest and the presence of weeds in the stubble.
CHAPTER 6 – WHEAT IN FARMING SYSTEMS THE WHEAT BOOK
120
LIVESTOCK PRODUCTION

Quantitative methods are available for estimatinginputs and run down of soil nitrogen for any statedrotation. These inputs can be related to yield and proteinlevels in following wheat crops using the SPLAT model ornitrogen calculator tables and wheels.
Legume pasture: cereal rotationsPasture legumes, notably subterranean clover
(Trifolium subterraneum) and annual Medicago speciesentered Australia in the early days of settlement, probablyin fodder or on animals loaded in Mediterranean ports. Itwas not until 1889 that Amos Howard, a South Australianfarmer, actively advocated the use of subterranean clover toimprove the native pastures.
However, recognition of the value of leguminouspasture species in increasing pasture production andquality, and as a component of crop rotations, was, slow tospread.
Even as late as 1934, the then common fallow wheat:[native] pasture rotation being practised in WesternAustralia was criticised as incapable of either maintaining‘fertility for cropping’ or of providing feed for theincreasing numbers of sheep on wheatbelt farms.
The pasture year was identified as the weak link in therotation and a modified rotation “... of continuous cloverpasture for several years followed by alternate fallow andcrop ...” was suggested Dunne and Shier (1934).
The key change, the lengthening of the pasture phase,allowed a prolific growth of subterranean clover that waspreviously suppressed in the bare fallow and crop years.
Many trials have shown the extra yield gained byincluding legumes (mainly subterranean clover) in thepasture phase of a ley farming system .
One such trial at Wongan Hills showed that twoyears of subterranean clover based pasture could liftyield by almost 1 t/ha compared to crops withoutpasture (see Figure 6.1). Further years of pastureincreased yields only slightly. However, successivecropping decreased yields.
In another trial at Merredin (see Table 6.4), grain yieldsand grain protein in a number of pasture/crop rotationsbased on burr medic pasture (without supplementarynitrogen) were equivalent to those from continuous cropssupplied with at least 80 kg/ha nitrogen. For second cropsthe pasture supplied the equivalent of 20 to 40 kg/hanitrogen (Revell, 1997).
A number of these long-term pasture:cereal rotationtrials in the wheatbelt have been continued for up to 20years. These trials are of a ‘fundamental’ rather than of anapplied nature, so not all the management practices mayappear realistic. The aim is to study the long-term effects ofrotation on yield and soil fertility.
The results from four trials are shown in Table 6.5. Thebeneficial effect of increasing the length of the pasturephase is evident, as is the decrease in wheat yield as thenumber of successive wheat crops is increased.
Since the 1980s there has been special emphasis on thedevelopment of new pasture species for soil types andclimatic regions that were not covered adequately bytraditional species such as subterranean clover and barrel
THE WHEAT BOOK CHAPTER 6 – WHEAT IN FARMING SYSTEMS
121
EFFECT OF LEGUMES ON CEREAL YIELD AND QUALITY
Continuous crop
Nil 2.17 9.2 1.02 9.1 1.04 9.5 0.57 9.7
20 2.39 10.3 1.08 9.9 1.45 9.5 0.93 9.3
40 2.46 11.5 1.07 12.2 1.75 8.9 1.50 9.3
80 2.29 13.7 1.09 15.1 2.07 10.0 1.89 10.1
1:1 pasture:crop
Nil 2.38 12.1 1.00 16.7 2.32 9.7 1.61 9.6
2:1 pasture:crop
Nil 2.38 12.1 2.32 10.0 2.04 10.3
2:2 pasture:crop
1st crop – Nil 0.90 16.9 2.06 10.3
2nd crop – Nil 2.39 10.0 1.55 10.0
Rate of Nitrogen(kg/ha)
1990 1991 1992 1993Yield Protein Yield Protein Yield Protein Yield Protein(t/ha) (%) (t/ha) (%) (t/ha) (%) (t/ha) (%)
Table 6.4 – Grain yield (t/ha) and grain protein (%) for wheat crops grown either continuously with applied nitrogenor in rotation with burr medic pasture on a red-brown sandy loam at Merredin

medic. A particular focus was on the selection of medicspecies and associated rhizobia with greater tolerance toacidic soils. This work resulted in the commercialisation ofcultivars of burr medic, murex medic and sphere medic.Subsequent work has identified new legume species whichwill complement traditional species in ley farming systems;these include yellow serradella, biserrula and balansa clover.The use of species mixtures is expected to increase thestability of the legume component of pastures, buffering thesystem through catastrophic events such as false breaks ofseason or pest outbreaks which are normally detrimental tomonoculture systems (particularly with subterranean clover).
The development of phase pasture systems has alsoadded impetus to the development of new pasture legumespecies. Aerial seeded species which can be harvested withcereal harvesting technology are desirable to reduce the costof seed. New cultivars of French serradella, crimson cloverand arrowleaf clover have been selected with theseattributes and are now being successfully incorporated into‘phase’ farming systems. Cadiz French serradella has beenparticularly well adopted across large areas of sandysurfaced soils with associated benefits in soil fertility andanimal production. Work is now being directed towardsquantifying the impact of phase pastures in terms ofsubsequent crop production and the control of weeds(particularly those that are herbicide resistant).
Lucerne is increasingly being seen as an integral part ofsustainable cropping systems on appropriate soils (pH >4.9 CaCl2). Since the mid 1990s there has been increasedresearch effort into the establishment and management oflucerne for wheatbelt regions with greater than 350 mmannual average rainfall. Early indications from sites atBorden and Pingrup (Latta et al. 1999) suggest that a
lucerne rotation will use more water (60 mm over threeyears), have lower weed burdens, fix more nitrogen (60kg/ha over three years) and increase grain yields relative toan annual pasture. Although the successful inclusion oflucerne in a pasture-crop rotation requires an extension ofthe pasture phase to a minimum of three years, the datastrongly indicates that a minimum two-year, probablythree-year cropping phase is sustainable. This contention isbased on the measured stored soil water increasing at a ratewhich would allow two or three years of shallow-rooted,annual plants before recharge recommences at the rateprior to lucerne.
Lupin:cereal rotationsProof that crop yields were improved by incorporating
lupins into the rotation was provided in 1948. The data (inTable 6.6) show the marked improvements in yield andgrain quality achieved by including the sandplain lupin(Lupinus cosentinii) in a crop rotation.
The use of grain lupins in rotation with wheat hasshown that yield of wheat grown after a lupin crop isconsistently greater than a wheat on wheat rotation. Thetwo rotations have been compared throughout Australia130 times between 1973 and 1985. The results aresummarised as:
wheat-on-wheat = 1.20 t/hawheat-on-lupin = 1.87 t/haThat is, a 56% average increase in wheat yield.In 26 comparisons of the two rotations on sandy or
duplex soils in Western Australia (without added nitrogen)the results are summarised as:
Wheat-on-wheat = 0.85 t/haWheat-on-lupins = 1.20 t/ha
CHAPTER 6 – WHEAT IN FARMING SYSTEMS THE WHEAT BOOK
122
PHOSPHORUS (continued)
Yield (t/ha)
Pasture:Crop Merredin Chapman Newdegate Salmon Gums
Continuous wheat 0.87 1.00 .040 0.89
1:1 1.06 1.66 1.16 1.31
2:1 1.09 1.88 1.46 1.42
4:1 1.21 1.93 1.65 -
3:31st crop 1.12 1.80 1.40 1.28
2nd crop 1.10 1.47 1.10 1.21
3rd crop 1.05 1.52 0.85 1.04
Table 6.5 – Average wheat yields from four wheat:pasture rotation trials
Merredin: Sandy clay loam (salmon gum), Cyprus barrel medic (M. truncatula)
Chapman: Red-brown loamy sand, subterranean clover cv. Northam
Newdegate: Grey sand over gravelly clay at 20 cm, subterranean clover cv. Nungarin.
Salmon Gums: Complex of clay loam and sandy loams, Cyprus barrel medic

0 20 40 60 80 1008
10
12
14
16
0
LSD 1993
LSD 1993
LSD 1995
LSD 1995
1
2
3
Gra
in p
rote
in (
%)
Applied N (kg/ha)
Gra
in y
ield
(kg
/ha)
Figure 6.6
Grain yield and protein response of wheat to nitrogen followingwheat or chick peas at Bencubbin. Squares represent Wilgoynewheat in 1993 and triangles, Amery wheat in 1995. Solid symbolsare after chickpea in the previous year and open symbols are afterwheat. LSD = least significant difference P<0.05 (unpublisheddata R.French).
That is, a 41% increase in wheat yield in WesternAustralia.
These 26 comparisons included rates of nitrogenfertiliser. When the responses were averaged, similar ratesof nitrogen were required for maximum yield in bothcontinuous wheat and wheat-on-lupin.
Maximum yields were 1.23 t/ha for wheat-on-wheat and 1.41 t/ha for wheat-on-lupin, an advantageof 14%. The average yield advantage due to inclusionof lupins, in the absence of nitrogen fertiliser, was 350kg/ha.
Field pea:cereal rotations.In the absence of nitrogen fertiliser, wheat following
field peas (P:W) outyielded wheat following wheat (W:W)in 16 of the 17 trials (see Table 6.8). The mean yield,without added nitrogen was 0.47 t/ha higher for P:W thanfor W:W at 37% yield increase (Rowland et al. 1993).
In addition to a general increase in wheat yieldfollowing a field pea crop, there was an increase in wheatgrain protein of almost 2% (see Table 6.8). In the trialsreported, the average nitrogen content of the field pea seedwould remove 39 kg N/ha for each 1 tonne of grainharvested. However, the stubble left behind had an averagevalue of 56 kg N/ha.
Chickpea:cereal rotationsThere have been few N balance measurements on
chickpea in Western Australia.
THE WHEAT BOOK CHAPTER 6 – WHEAT IN FARMING SYSTEMS
123
EFFECT OF LEGUMES ON CEREAL YIELD AND QUALITY (continued)
Table 6.6 – Effects of lupins on wheat grain yield and flour quality(Data are averages for 1944 to 1947)
Chapman Wongan Hills
Rotation Yield (kg/ha) Gluten (%) Yield (kg/ha) Gluten (%)
Continuous wheat 485 8.4 480 6.9
Fallow-wheat 620 6.9 950 7.4
Stubble-fallow-wheat 730 6.4 1200 7.5
Lupin-lupin-fallow-wheat 1230 8.9 1390 8.2
Table 6.7 – Details of sites of trials comparing P:W and W: W rotations
Site pH (H2O) Soil0 – 10 cm
1. Merredin Research Station 6.0 Red-brown gritty clay loam
2. Narembeen 7.5 Grey-red clay loam
3. Newdegate Research Station 4.8 Grey sand over brown clay at 10-20 cm
4. Nyabing 7.3 Brown loamy sand over clay at 5-10 cm
5. Konnongorring 6.5 Red-brown clay loam
6. Salmon Gums Research Station 8.0 Brown clay loam

At Bencubbin in 1993, and again in 1995, chickpeacontributed about 35 kg/ha, judging by the wheat responseto fertiliser N. However, no amount of fertiliser N given towheat after wheat could raise its grain protein to that ofwheat after chickpea. This indicates that non-N benefitswere also involved in increasing protein levels.
On average, chickpea may not fix or leave behind asmuch N as narrow-leafed lupin or faba bean, but on soils orin environments where it grows better than these crops, this
may not be the case. Chickpea crops that grow well but pro-duce low grain yields are likely to have the largest N benefit.
The amounts of N left behind after a chickpea crop areusually small so it will frequently be necessary to use someN fertiliser in cereals following chickpea. This will occurafter chickpea crops that had poor growth (especially ifyields were moderate), in intensive continuous croppingrotations where soil organic N may already be depleted,and in years when cereals have a high yield potential.
CHAPTER 6 – WHEAT IN FARMING SYSTEMS THE WHEAT BOOK
124
EFFECT OF LEGUMES ON CEREAL YIELD AND QUALITY (continued)
Table 6.8. – Wheat yields (t/ha) and protein (% at 11% moisture) in a P:W or W:W rotation in years shown, at varioussites
Site Year Field Peas/Wheat Continuous Wheat
Yield Grain Yield Grain Protein Protein
(t/ha) (%) (t/ha) (%)
Merredin 1987 1.34 13.2 1.11 8.8
Research 1988 2.62 9.4 1.97 8.3
Station 1989 1.51 9.4 1.19 7.9
1990 1.54 10.2 1.14 7.7
1987 1.68 10.2 0.80 8.2
Narembeen 1988 1.51 10.3 1.53 8.5
1989 2.01 - 1.38 -
Newdegate 1988 1.18 12.1 0.84 9.5
Research 1989 0.79 10.6 0.53 10.1
Station 1990 0.75 11.0 0.73 9.7
Nyabing 1988 1.88 11.0 1.40 8.7
1989 1.91 9.6 1.65 8.4
Konnongorring 1988 2.95 8.0 2.30 8.0
1989 3.18 9.0 2.18 7.4
1990 3.15 9.5 2.12 8.0
Salmon Gums 1988 1.57 10.7 0.94 9.3
Research 1989 1.93 12.7 1.15 9.0
Station 1990 0.21 14.2 0.50 10.8
Mean 1.75 10.6 1.28 8.7

Rotations are all too often discussed only in terms ofthe influence of the legume phase on a subsequent cerealcrop. The legume benefits from the cereal as well.
For lupins grown on sandplain soils the retention of thewheat stubble is essential for control of wind erosion in thefollowing lupin crop. The cereal stubble, with minimumdisturbance seeding, helps protect developing lupin plantsfrom sand blasting.
Also, good control of broadleaved weeds in the cerealcrop can reduce their density for the following lupins.
Root diseases affecting a lupin crop are less prevalentafter a cereal crop than after pasture ley. Further, thepresence of cereal stubble reduces the incidence of brownleaf spot by cutting down the spread of the spores releasedwhen raindrops hit the soil.
Cereals also use up the nitrogen built up under apasture phase. This nitrogen, if unused, would encouragethe growth of grasses and other weeds in the lupin crop.
One important and well recognised effect of cerealcropping is to decrease pasture production in the years afterthe crop. This is invariably due to reduced plant densitiesresulting from in-crop weed control, and to the declininghard seed banks of the legume species.
Self-regenerating pastures based on annual legumesneed to build up a reserve of seed in the soil which willpersist through drought years and the cropping phase ofthe rotation. The legume must be capable of setting a highproportion of hard seed which will not germinate evenwhen the soil is wet. Hardseededness and the rate of hardseed breakdown vary widely between species. For example,the medics generally have a higher proportion of hard seedsthan the subterranean clovers which makes them bettersuited to intensive cropping systems.
Stubble residues can also lead to lower plant densities inpasture but this is normally only associated with the largequantities present in header rows.
THE WHEAT BOOK CHAPTER 6 – WHEAT IN FARMING SYSTEMS
125
EFFECT OF WHEAT ON SUBSEQUENT CROP/PASTURE

A few disadvantages of legume rotations should bementioned. Legumes can:
provide too much nitrogen which produces too ‘leafy’a cereal crop that is prone to ‘haying off ’ (particularlyon heavier soils in the drier wheatbelt);lower soil pH and increase soil acidity because of theirnitrogen fixing process and accelerated nitrate leaching.Non-legumes such as capeweed present in a pasturesituation appear beneficial in slowing soil acidification;increase water repellence, which might reducegermination of future crops and pastures and increasethe risk of water erosion because of the increasedorganic matter produced;increase groundwater recharge – with risks of waterlogging and salinity because legumes are shallow-rooted; andcontribute to soil structure decline in certaincircumstances.
CHAPTER 6 – WHEAT IN FARMING SYSTEMS THE WHEAT BOOK
126
DISADVANTAGES OF LEGUME ROTATIONS
Canola is an ideal break crop for cereals because itprovides an excellent opportunity to reduce grass weedsand therefore minimise carry over of take-all root diseasefor cereals. Canola can be grown either before or after acereal crop which makes it a flexible crop in many croppingsystems.
A further possible benefit for canola is its potential forbiofumigation. This is from glucosinolates in the canolaplant residues that breakdown to act as a biocide. Thefumigating effect of canola residue may suppress harmfulsoil borne organisms that attack wheat roots (for example,take all and Rhizoctonia).
Canola will maximise the profitability of any cerealbased rotation throughout the Western Australia wheatbeltbecause of its high gross margin return.
Cereal following canolaCereals grown on canola stubble experience few crop
establishment problems. Early root diseases are usuallysuppressed and many growers have experienced increasedearly crop vigour. On paddocks which are marginal forpotash (for example, deep sandplain, especially in highrainfall areas) canola residues may highlight nutrientdeficiencies or imbalance where header trails are not spreadevenly. It is advisable to check soil tests both between andwithin the header trails if there appear to be any ‘wave-likepatterns’ in the cereal following canola.
From a nutrient management view point, cerealfollowing canola should be treated in a similar way tocereals grown on cereal stubble. This means more nitrogenis required than if it was grown after a grain legume. Wherewheat follows triazine tolerant canola in low rainfalldistricts with soils of high pH (pH > 6.5), triazine residuesmay affect the development of the wheat. Check wheatvarieties for the highest tolerance to triazines if residuecarryover is suspected.
Volunteer canola can be controlled by most broadleafherbicides during the cereal phase. If large header losseshave occurred it is advisable to control the volunteers onthe header trails with a knockdown herbicide. Canola isgenerally not considered to be hardseeded.
Canola following cerealFor canola, this is the most common rotation option
where a cereal crop is followed by canola. This system isuseful if there is a need to reduce broadleaved weeds beforegrowing canola or there is a risk of wind erosion
This system is a good strategy on sandplain soils thatare susceptible to wind erosion and the canola is at riskfrom sand blasting. The cereal stubble protects the tinycanola seedlings. However, crop establishment of canola incereal stubble requires careful management. The fineseeded canola requires good seed-soil contact. Minimumtill seeding equipment is often the best way to achieve thisbecause it allows accurate placement.
Where there are high stubble residues, they couldinterfere with sowing depth, chemical placement andseedling emergence. Sowing canola into high amounts ofcereal stubble can also encourage insect pests that are hardto reach with chemical sprays.
Phytotoxic effects of barley stubbles can suppressgerminating canola. These may be overcome by usingwide-row machinery, disc or knifepoint seeders and/orremoving the stubble.
When canola follows wheat higher nitrogen inputs maybe needed to obtain maximum yields, but there are usuallyfewer problems with insects and weeds duringestablishment. Under this rotation canola will usually havea higher oil content when compared to canola grown onlegume or pasture rotations.
THE WHEAT BOOK CHAPTER 6 – WHEAT IN FARMING SYSTEMS
127
CANOLA IN ROTATION WITH CEREALS

All small seeded crops or pastures can have a problemif too much stubble residue is present at sowing. This canbe due to cooler soil temperatures, insufficient lightreaching the soil surface and the physical barrier being toothick for the young seedlings to penetrate.
Canola, mustard, clover, medic and lucerne are cropspredisposed to this problem. Where there is long stubble itmay be better to cut the stubble short, and chop and spreadit evenly at harvest. This will encourage the stubble tobreak down. Alternatively not spreading the stubble atharvest but by burning or baling the header trails, (or byraking and burning or raking and baling) can reduce theproblem.
CHAPTER 6 – WHEAT IN FARMING SYSTEMS THE WHEAT BOOK
128
ROTATIONS AND STUBBLE

The integration of animals, legume pastures and cropsinto dryland cereal farming in the Western Australianwheatbelt has produced a stable, low-input agriculturewhich allows a range of cropping and animal enterpriseoptions.
The desirable combination of crops, pastures, areas,management, type and number of livestock are determinedby such things as the potential for profit, managementability, technical requirements and the resources available.However, the switching of land into or out of particularrotations generally follows changes in the relativeprofitabilities of the rotations. In periods of high returnsfor cereals, crop dominant rotations are introduced.Conversely, when animal and animal product returns arehigh, then pasture dominant rotations are adopted.
In the 1990s, a period of low wool prices, farmingsystems have become more crop-dominant. Rotations ongood sandplain soils have typically involved wheat andlupins. On loamy soils some pasture areas have beendisplaced by canola, field peas and other crop legumes.
Often it is technically and commercially desirable tonot adhere strictly to a rotation. At times, unfoldingweather conditions favour increased early sowing of crops.At other times, when there has been little summer rain andthe break of season is very late, then reduced sowings ofcrops can reduce potential losses. Besides the impact ofweather, changes in relative prices of commodities candiscourage the sowing of particular crops. Further,emerging problems such as herbicide tolerance in weeds ordisease problems can necessitate an alteration in therotation. In summary, land use sequences rather than fixedrotation patterns are often the norm in farming.Responding to opportunities created by weather and priceconditions is often more profitable than rigid adherence toa rotation schedule.
THE WHEAT BOOK CHAPTER 6 – WHEAT IN FARMING SYSTEMS
129
ROTATIONS AND FARMING SYSTEMS

Dunne, T.C. and Shier, F.L. (1934). A modifiedrotation for the wheat belt. Journal of Agriculture, WesternAustralia Vol 3 2nd series 172-184.
Hamblin, A. and Kyneur, G. (1993). Trends in wheatyield and soil fertility in Australia. Australian GovernmentPublishing Service: Canberra.
Herridge, D. F., Marcellos, H., Helton, W. L., turner,G. L. and Peoples, M. B. (1995). Chickpea increases soil Nfertility in cereal systems through nitrate sparing and N2fixation. Soil biology and biochemistry 27, 545-551
Jessop, R.S. and Mahoney, J. (1985). Effects of soilnitrogen on grain legume yield and nitrogen fixation.Journal of Agricultural Science, Cambridge, 105, 265-68.
Latta, R., Blacklow, L. and Matthews, C. (1999). It’stime to include lucerne in pasture-crop systems. GRDCCrop Updates – Cereals, pp 87-89.
Loss, S. P., Brandon, N. J. and Siddique, K. H. M.(1998). The Chickpea Book. A Technical Guide toChickpea Production.
Reeves, T. G. and Ewing, M. A. (1993). Is ley farmingin Mediterranean zones just a passing phase?. InProceedings of the XVII International Grassland Congress,pp. 2169-2177.
Revell, C. K. (1997). Improving the stability of burrmedic pastures in the Western Australian cereal belt. FinalReport to Grains Research and Development CorporationProject DAW45. Agriculture Western Australia.
Rowland, I., Mason, M. and Anderson, W. (1993)Value of field peas in a rotation. In Growing field peas,Bulletin number 4239, Department of AgricultureWesternAustralia.
Schwenke, G. D. and Herridge, D. (1998). Doesnitrogen fixation of commercial, dryland chickpea andfaba bean crops in north-west New South Wales maintainor enhance nitrogen? Australian Journal of ExperimentalAgriculture, 38 61-70.
Unkovich, M.J., Pate, J.S. and Sanford, P.(1997).Nitrogen fixation by annual legumes in AustralianMediterranean agriculture. Australian Journal ofAgricultural Research, 48, 267-293.
CHAPTER 6 – WHEAT IN FARMING SYSTEMS THE WHEAT BOOK
130
REFERENCES

Chapter Coordinator: B. J. ShackleyWheatbook 1 authors: W.K. Anderson, R.K. Bedford, G.B. Crosbie, S.P. Loss,M.G. Mason and M.W. PerryRevised by: W. K. Anderson, F. C. Hoyle, L. Armstrong and B. J. Shackley
Sowing time ..................................................................................................133Matching cultivar and time of sowing ................................................................133The ‘flowering window’ ......................................................................................133When is the flowering window ‘open’? ................................................................134Cultivar and sowing date ....................................................................................134Sowing time influences management ..................................................................134Sowing time and response to nitrogen (N) ........................................................134Sowing time and soil type ..................................................................................134Sowing time, diseases and pests ..........................................................................135Frost risk in early sown crops ..............................................................................135Sowing time and grain quality ............................................................................135Opportunity for very early sowing ......................................................................135
Plant population and seeding rate ..............................................................137Plant population ................................................................................................137Estimating a seeding rate ....................................................................................137The decision to resow ........................................................................................139Seed source and quality........................................................................................139
Plant establishment ......................................................................................140Depth of sowing ................................................................................................140Effects of water deficit on establishment ............................................................141Effects of waterlogging on establishment ............................................................143Row spacing ..................................................................................................143Results in Western Australia ................................................................................144Adoption of narrow row spacings ......................................................................145
Management to improve wheat quality ........................................................146Grain protein percentage ....................................................................................146Hectolitre (or test) weight ..................................................................................150Small grain seivings ............................................................................................150Production ‘packages’ for producing premium quality wheat ............................151Management to reduce Blackpoint ....................................................................151
THE WHEAT BOOK CHAPTER 7 – CROP MANAGEMENT
131
CHAPTER SEVEN
CROP MANAGEMENT

CHAPTER 7 – CROP MANAGEMENT THE WHEAT BOOK
132
Managing frost risk to maximise cereal yields in Western Australia ..........157Climatology of frost ............................................................................................157Standard temperature measurement ..................................................................157Assessing frost damage ......................................................................................159Analysis of frost risk .......................................................................................... 159Frost risks within regions .................................................................................. 160Limitations of analyses ...................................................................................... 160Time of flowering .............................................................................................. 160Choice of crop and variety ................................................................................ 161Cutting crops for hay ........................................................................................ 161Silage .................................................................................................................. 161Cutting operations ............................................................................................ 161Desiccation and hay freezing ............................................................................ 162Green manuring ................................................................................................ 162Standing crops .................................................................................................. 162Burning .............................................................................................................. 162

Matching cultivar and time ofsowing
The choice of sowing date and variety is the key tomaximising wheat yield potential in Western Australia.
Researchers have long known that earlier sowing shouldmean greater yield and water use efficiency. However, earlysowing was generally not adopted on-farm prior to thedevelopment of farming systems where improved herbicidetechnology existed, reduced tillage was practiced and highyielding, longer season cultivars were released.
Since the late 1980s, farmers have succeeded in pushingthe average sowing date of wheat from early June to midMay (2-3 weeks earlier), where seasonal conditions allow.Increased investment in sowing machinery means manygrowers can now sow their entire cropping program in lessthan two weeks from the date of opening rains.Accompanying this change, most farmers hold seed suppliesof cultivars from at least two maturity groups, to allow forthe likely range of timing of the cropping season. Inadopting new technologies and earlier sowing for some partof their cropping program, correct matching of cultivar tosowing time has become an important decision that dependson an understanding of the idea of the ‘flowering window’.
The ‘flowering window’Grain yield depends more upon flowering date than on
sowing date. Research in the wheatbelt has shown thatcrops yield most when flowering occurs in a narrow band(or ‘window’) of time, usually between 10-40 days at anylocation.
The optimum flowering time or ‘flowering window’is a balance between the risk of frost damage, diseaseinfection or poor growth if flowering occurs too early,and the inevitable high temperatures and drought
experienced if flowering occurs too late. This isillustrated in Figure 7.1.
It is important that crops flower in the ‘window’ if theyare to have the best chance of achieving their maximumyield. Crops that flower before or after the ‘window’ yieldless. The rate of reduction in yield for crops that flowerafter the optimum time varies for different parts of thewheatbelt, being greater in the warmer, short seasonenvironments of the northern and eastern wheatbelt, andless in the cooler, wetter and longer season environments ofthe South Coast (Table 7.1).
In the future, two factors may modify the situation asdescribed in Table 7.1. Firstly, the development of longerseason cultivars suitable for sowing before April 25th(the earliest advisable date with current cultivars) willextend the optimum sowing time. Secondly, there is atendency for the higher yielding and more diseaseresistant cultivars to be adapted to slightly earlier sowing
THE WHEAT BOOK CHAPTER 7 – CROP MANAGEMENT
133
SOWING TIME
Figure 7.1
Grain yield response to flowering time in wheat: the concept of the‘flowering window’.
Optimum Flowering Days sowing to flowering Yield penalty for sowing Window Short season Long season late sowing time cultivar cultivar (kg/ha/day)
North-east(Mullewa to Merredin)15/5 – 7/6 25/8 – 15/9 90 100 35
Central(Three Springs to Quairading)25/4 – 15/5 7/9 – 27/9* 110 135 25
South(Katanning to Varley)7/5 – 7/6 15/9 – 5/10* 115 135 25
South Coast(Welstead to Esperance)7/5 – 7/6 3/9 – 2/10 95 140 17
Table 7.1 – Growing seasons for wheat in Western Australia. [derived from data of Anderson, Shackley, Kerr, Smithand Heinrich, 1986 – 1995]
* the probability of a damaging frost is at least one year in 3 for the first half of the estimated ‘window’ in these regions.

times than the lower yielding cultivars of similarmaturity. The implications of these factors should be re-examined periodically.
When is the flowering window‘open’?
The unpredictability of seasonal conditions such asthe date of the opening rains, temperature and theincidence of frosts, means that the flowering window forany location will be open at different times from seasonto season.
The window can be estimated from meteorologicalrecords, but these do not account for the effects ofdiseases or individual cultivar adaptation and theincidence of frost damage cannot always be related totown records.
A more satisfactory method of estimating the floweringwindow is from sowing date experiments in the field.Flowering dates of cultivars with a wide range of maturitiescan then be observed and related to grain yields over anumber of seasons. The best estimate will be based onsome sort of average (the estimates in Table 7.1 are basedon the results of over 75 experiments in the period 1986 to1995). An example of how the flowering window wasestimated from such experiments is given for one locationin Figure 7.2.
CHAPTER 7 – CROP MANAGEMENT THE WHEAT BOOK
134
SOWING TIME (continued)
Figure 7.2
Estimated flowering window for Wongan Hills. Data are from the1986, 1987 and 1988 seasons using the cultivars Gamenya,Gutha and Aroona.
Cultivar and sowing dateOnce the flowering window is known, the next step is
to ensure that cultivar and sowing date are correctlymatched so that flowering will occur at the desired time. Inprinciple, early sowing will require long season cultivarsand late sowing will require short season (early flowering)cultivars. This is illustrated in Figure 7.3.
Figure 7.3
The suggested relationship between sowing date and floweringdate for a long season, a mid-season and a short season cultivarat Wongan Hills.
Sowing time influences managementSowing time influences the way the crop grows. Earlier
sowings (of long season cultivars) take longer in thevegetative stage and tend to produce more leaves and tillers.Early sown crops fill their grain under cooler, wetterconditions on average and usually fill a large number ofkernels to a larger size. This places a greater demand on theresources available to the crop. Later sown crops are likelyto fill their grain under more stressful conditions, andfactors such as nitrogen application must be considered.
Sowing time and response tonitrogen (N)
Wheat crops sown in May produce more grain onaverage per unit of nitrogen fertilizer applied than thosesown in June. This is illustrated by the data shown in Table7.2.
Table 7.2 – Grain yield response (t/ha) of wheat toapplied N at two sowing times [data are from 15experiments over 3 years – Anderson, Crosbie andLambe, 1996]
Sowing time N Applied (kg/ha) Yield Increase0 40 (kg grain/kg N)
May 1.92 2.46 13.5
June 1.75 1.88 3.3
The general implication of this result is that when thecost of N fertilizer is five times the value of wheat grain (ie.it takes 5 kg of grain to pay for 1kg of N), it is moreeconomical on average to apply N to the earlier sowncrops.
Sowing time and soil typeThe wide range of soils used for wheat production in
Western Australia generate a wide range of water and

Sowing time and grain qualityWheat cultivars sown at their appropriate times tend to
produce appropriate grain quality as well as maximumgrain yields, all other factors being equal. Sowing cultivarsoutside their optimum range (ie. short season cultivarssown too early or longer season cultivars sown too late), canresult in small grain sievings (2mm slotted screen) abovethe levels acceptable for milling grades. Hectolitre weightsthat are below the receival standard of 74kg/hl, are alsooften associated with mismatching cultivar and sowingdate.
In the case of short season cultivars sown too early,increased sievings and low hectolitre weights can beassociated with high levels of leaf diseases, aphid infestationor frost damage. Long season cultivars sown too late have ahigh probability of water and heat stress during grainfilling, increasing the probability of small grain sievings (<2mm).
Grain protein levels are often increased by delayedsowing after the optimum time for grain yield. In Nresponsive situations this increase is about 0.033% per dayor about 0.5% protein for a 15 day delay in sowing in thelate May to early June period. Increases in grain proteinfrom delayed sowing are seldom sufficient to offset the lossof grain yield over the same period which may be25kg/ha/day or 375kg/ha.
Matching the cultivar with the sowing time not onlyresults in the greatest grain yields but also reduces the riskof failing to meet delivery standards for test weight andsmall grains.
Opportunities for very early sowingAnalysis of weather records show that April sowing
opportunities occur on the wheatbelt of Western Australiaone year in three. Sowing as early as possible canpotentially improve grain yield, with any delay in sowingleading to yield declines (from 50 kg/ha/day). April sowncrops generally are exposed to warmer, more conducivetemperatures for crop growth and may toleratewaterlogging to a greater extent than later sown wheatcrops. However there are number of risks when sowingwheat in April, including poor crop establishment, due toprolonged dry periods after sowing and extremetemperatures and leaf diseases. No currently releasedvariety is recommended for mid April sowing. Mid seasonvarieties (such as Tammin and Janz) sown in April willflower too early, yield poorly and may be exposed to a highrisk of frost damage (Table 7.4). At present Spear andStiletto are the longest season varieties available, howeverthey also flower too early. Spear displays a high level ofphotoperiod sensitivity and can show accelerateddevelopment if sown too early in April. These varieties canbe sown with a low risk of frost damage on or after April25. In general, no variety produces greater grain yield thanSpear when sown in April (Table 7.4). Winter varieties
THE WHEAT BOOK CHAPTER 7 – CROP MANAGEMENT
135
SOWING TIME (continued)
nutrient availability. In theory, this should lead todifferences between soils in response to sowing times suchthat early sowing is more critical on soils with lower waterholding capacity for example. In practice, there is someevidence that earlier sowing (mid-May) was moreadvantageous on duplex soils than on soils with a lessrestricted root zone (loamy sands and red-brown earths).This is illustrated in Table 7.3.
Table 7.3 – Percentage yield increases for mid-Maycompared to early June sowings on duplex compared toother soils [after Anderson, French and Seymour, 1992].
Experiment Series Duplex Soils Other Soils
1. 3 experiments,1986-1988 16 02. 16 experiments,1988-1990 37 17Weighted Mean 34 14
In duplex soils, the disadvantage of later sowing ispossibly related to the waterlogging that commonly occursat the sand/clay interface. Less developed root systemsassociated with later sown crops are potentially moreaffected by waterlogging than those sown earlier, whichwould be more developed. Differences between soil typesin response to early sowing imply that the better soils canbe sown at the end of the sowing program with a lower riskof loss of yield.
Sowing time, diseases and pestsDenser, higher yielding crops often provide a more
favourable micro-climate (higher humidity, greater supplyof N and sugars) suited to the development of leaf diseasessuch as the septorias and rusts, as well as for insect pestssuch as aphids. Crops that are sown early may be moreexposed to infection by Barley Yellow Dwarf Virus(BYDV) which is transmitted by autumn aphid flights,and by the leaf diseases. Infection during the early growthstages of an early sown crop, results in a far moredeleterious effect on crop growth and yield than infectionof later sown crops at later growth stages. In general, cropsthat are expected to yield over 3 t/ha are worth spraying forprotection against insects and leaf diseases (see alsoChapters 10 and 11).
Frost risk in early sown cropsIn theory, long season cultivars sown at the
appropriate time, should on average flower at theoptimum time. In practice, if the weather is unusuallywarm and water supply is adequate, some cultivars mayflower earlier when the risk of frost is still high. If thisrisk is judged to be unacceptable, one strategy to reducethe risk is to sow the higher parts of the landscape first,delaying the sowing of the low-lying and more frostsusceptible areas until later in the program.

such as Osprey are also not suitable for April sowing,especially in the Eastern Wheatbelt. The cold requirementfor these varieties is only partially satisfied in thisenvironment hence development is delayed and they aresubjected to end of season environmental stresses. Oldervarieties such as Bencubbin, with a more ‘ideal’ plantdevelopment pattern when sown in mid April, also have alow yield potential.
The ideal variety for April sowings needs to flower 7 to10 days after Spear. It must display slightly longer vegetativeperiod than Spear and have an increased vernalisationsensitivity to prevent bolting with early sowing.
Some agronomic factors to be considered if you arethinking of sowing early include:
Minimise soil water loss through minimal tillage andstubble retentionHigher seeding rates (70-80 kg/ha) to compensate forthe possibility of seedling death from high Apriltemperatures.Plant in areas with lower probability of frostPlant on higher water holding capacity (deeper soils)Sow only a small percentage of crop in April (eg. 30%max) to spread start of season and end of season risksHigher fertiliser applications (N) to allow for thegreater biomass production associated with April sowncrops compared to later sowing.Sow on paddocks with low weed burden as an earlysowing will prevent presowing weed kill.
CHAPTER 7 – CROP MANAGEMENT THE WHEAT BOOK
136
SOWING TIME (continued)
Source: Armstrong L, Agriculture Western Australia
Average Flowering Date Grain Yield (t/ha)Variety April Sowing Later Sowing April Sowing Later Sowing
Spear 10 August 29 September 3.15 1.81
Stiletto 8 August 29 September 1.97 1.80
Tammin 8 August 29 September 1.65 1.84
Bencubbin 24 August 29 September 1.89 1.29
Osprey 13 September 8 October 1.82 1.30
Janz 4 August 29 September 1.41 1.71
l.s.d - - 0.28 0.21
Table 7.4 – Flowering Dates and Grain Yields (t/ha) of selected varieties grown at Dryland Research Institute,Merredin from 1994 to 1996 during April (12-19/4) and Later Sowing (25/5 to 13/6).

In the past, the importance of plant population hasbeen underestimated as other factors have been morelimiting to yield. Adequate populations can be establishedeasily with a wide range of seed rates and cereals cancompensate for poor stands by tillering.
However, as other limitations to production areremoved and yields are increased (particularly in highrainfall areas), plant population and row spacing may limitcrop yield. It is now important to look more closely at therelationships between seed rate, plant population and grainyield.
This section examines:Appropriate plant populations for particularenvironments andSeeding rates needed to establish the target population.
Plant population and grain yieldAs the plant population increases, grain yield increases
until a yield ‘plateau’ is reached. Yields then stay at aboutthe same level until very high populations are reached,when yield eventually declines. This is illustrated in Figure7.4.
THE WHEAT BOOK CHAPTER 7 – CROP MANAGEMENT
137
PLANT POPULATION AND SEEDING RATE
Figure 7.4
The relationship between wheat seeding rate (plant population)and grain yield. The ‘optimum’ seeding rate is defined as the pointwhere an extra 1kg of seed returns 10kg of grain.
Figure 7.5
Plant population required for optimum yield
The ‘optimum’ plant population is that at which thecost of increasing the plant population just equals thereturn from increased grain yield. Because seed is cheap,the optimum plant population is very close to that whichgives maximum grain yield.
Figure 7.4 illustrates the response of grain yield toplant population in two environments. An importantquestion is whether the optimum plant population (andtherefore required seeding rate) varies with site, season andvariety.
Many seeding rate trials have been done byAgriculture Western Australia since 1960 and in some ofthese plant populations were measured. For each of thesetrials a relationship between grain yield and plantpopulation was worked out mathematically and the
optimum plant population determined. For this exercise,the optimum population was where the marginal returnwas 10 times the marginal cost.
Figure 7.5 suggests that as grain yield increases, so doesthe plant population required to be sure that seeding ratedoes not limit grain yield. For all the points in Figure 7.5,the relation between optimum plant population and grainyield was:
Optimum plant population= 40.6+ (34.6 x expectedgrain yield).
Thus for an anticipated yield potential of 1 t/ha, a plantpopulation of 50/m2 should be sufficient to ensure thatplant population does not limit grain yield. At 4 t/ha,however, a plant population of about 200/m2 would beneeded to ensure that population did not limit yield. Othervalues are given in Table 7.5.
Table 7.5 – Plant population required to achieve yieldpotential
Anticipated yield Target plant population
potential (t/ha) Plants/sq.m. Plants/m row
1.0 50 92.0 100 183.0 150 274.0 200 36
Estimating a seeding rateFor any target plant population, the required seeding
rate must be determined. Most seeding equipment is builtto sow a given weight (or volume) of seed per unit area.However, the actual plant population established in thefield will depend on the grain size and the percentage ofgrains that establish plants when sown.
Plant establishment is a result of the germinationpercentage of the grain and the effects of stresses in theseedbed.

Seed sizeWheat varieties have a range of seed sizes, from less
than 30 mg to over 40 mg per seed. The number of seedssown for a given weight of seed can therefore vary by up to25%.
Seasonal effects are even greater, and for a single varietythe seed size may vary from 20 to 50 mg depending mainlyon the conditions during rain filling.
Percentage germinationWheat grain generally has a germination percentage of
90 to 98% given dry harvesting weather and a lack ofmechanical damage (unlike the larger pulse seeds).
Seedbed stressDepth of sowing, disease, crusting, moisture and other
stresses in the seedbed will also reduce the numbers ofplants establishing. Depth of sowing is particularlyimportant for the establishment of wheat varieties with ashort coleoptile. These factors are explained in the nextsection – Plant establishment.
Field establishment is unlikely to be greater than 90%of seed sown and may be as low as 60% if seedbedconditions are unfavorable. 70 to 80% of seeds sownusually establish a plant.
Steps in calculating the seeding rateDecide on a target plant population taking intoaccount the yield potential of the paddock, and anyother factors such as weed burdens, which may indicategreater seeding rates.Decide what percentage of seed sown will establishplants. This combines the germination percentage withseedling establishment and will generally be in therange of 70 to 90%. If seed is suspect because of poorstorage, it should be germination-tested and theestablishment adjusted accordingly.Weigh a sample of seed and calculate the individualkernel weight. If this cannot be done, the averageweights in Table 7.6 can be used, but kernel weight willvary widely depending on conditions during seedfilling.The calculation:Seed rate = plant/m2 x kernel weight (mg)__________________________
expected establishment (%)For example, if the desired plant population is 100/m2,
the kernel weight is 40 mg and the expected establishment75%, the required seeding rate is 53 kg/ha.
Some examples of seed rates calculated on the basis oftarget plant population, seed weight and establishmentpercentages are given in Table 7.6.
CHAPTER 7 – CROP MANAGEMENT THE WHEAT BOOK
138
PLANT POPULATION AND SEEDING RATE (continued)
Target population Expected establishment Seed weights (mg/seed)**(plants/sq.m)* (%) 28 34 40 46
55 (10) 60 26 31 37 42
70 22 27 31 36
80 19 23 27 32
90 17 21 24 29
110 (20) 60 52 62 74 84
70 44 53 63 72
80 39 46 54 64
90 34 42 49 56
150 (27) 60 70 85 100 115
70 60 76 86 99
80 52 64 75 86
90 47 57 67 77
180 (32) 60 84 102 120 138
70 72 87 103 113
80 63 76 90 103
90 56 68 80 92
Table 7.6 – Seeding rates (kg/ha) to achieve different plant populations
* Numbers in parentheses are plants/m of 7 inch or 18cm rows.** Typical seed weights are shown in table 7.6b.

The yield loss from later sowing and the extra cost ofre-sowing have to be balanced against the yield loss fromthe reduced plant population at the earlier sowing. Forexample:
If the crop is a long season variety sown in mid-May inthe high potential yield situation, the yield expectationis 3.55 t/ha, requiring establishment of 180 plants/m2.However, if establishment is only 50 plants/m2 theyield potential is reduced to 2.7 t/ha. If the decision isto re-sow in mid-June, the yield potential is only 2.5t/ha using a mid- or short season variety, and it wouldnot pay to re-sow.Similarly, in the low rainfall area, if an early Maysowing is chosen for a long season variety, the yieldpotential is 2.25 t/ha requiring 125 plants/m2. If theestablishment is reduced to 20 plants/m2, the potentialyield is reduced to 1.0 t/ha compared to an expectedyield from an early June sowing of 1.5 t/ha. The valueof the 0.5 t/ha difference would need to cover the re-sowing costs.
Seed source and qualityApart from the number of plants established in the field
the source of seed can affect yield.In a set of experiments at Chapman, Wongan Hills and
Newdegate in 1988 there were significant yield differencesbetween seed sources in 9 out of 21 trials. Differencesaveraged about 15% between sources and were tentativelyattributed to small seed size, low seed zinc content, lowseed phosphorus content or some combination.
Although the experiments did not exclude otherpossible causes it is clear that seed for sowing should becarefully harvested from well fertilized areas, be of goodsize, graded and stored under cool, dry conditions -possiblyin sealed, white silos.
THE WHEAT BOOK CHAPTER 7 – CROP MANAGEMENT
139
Table 7.6b – Typical seed weights (mg)
Aroona 44 Gutha 38
Bodalllin 40 Halberd 38
Canna 33 Kulin 38
Corrigin 36 Reeves 42
Cranbrook 33 Spear 42
Eradu 38 Tincurrin 33
Gamenya 34 Wilgoyne 45
Other considerations in deciding seeding ratesThe relationship between grain yield and plant
population is not completely accurate, considerablevariation exists. However, because of the yield plateau,plant populations above those calculated are unlikely toreduce grain yield.
It is difficult to show any consistent difference betweencultivars in the yield response to plant population, althoughthere are some exceptions. The tall cultivar, Gutha wasfound to require about 30% less seed to reach its maximumyield in the low rainfall zone when compared with the tallcultivar Gamenya and the semi-dwarf cultivar Aroona.Current research indicates that some of the more recentlyreleased cultivars, particularly Cascades, may have a lower‘optimum’ population than Spear or Aroona. Further workis needed to clarify how the ‘optimum’ plant populationvaries with site, season and cultivar.
Current research has found that high plant populations(above 140 plants/m2) do not necessarily lead to increases insmall grains or sievings. High plant populations may lead toproblems with small grains when sowing in June and withthe addition of other factors such as excessive nitrogen orother nutrient deficiencies. Very high plant populationsmay cause small grain in very dry environments or indrought years. This is because of ‘yield componentcompensation’ (see Chapter 3) where the greater number ofgrain sites compete for a limited supply of ‘carbohydrate’.The cultivars Tincurrin, Janz and Cunderdin are naturallysmall grained and may be most affected.
Greater plant populations compete more effectivelywith weeds, suppressing the amount of seed produced. Asherbicide tolerance in weed populations increases, seedingrates may have to be increased to compensate.
The decision to re-sowIf the established population is far below the target for
a given yield expectation, re-sowing could be worthwhile.The re-sown crop will have a smaller yield potential, beingprobably 3 to 4 weeks later and there will be some risk ofit too having less than optimum establishment.
If the decision to re-sow can be made considerablysooner than 4 weeks after sowing (such as burst seed fromheavy rain immediately after sowing) the decision will beeasier to make.
PLANT POPULATION AND SEEDING RATE (continued)

Plant establishment is the result of germination,management and the environment.
Germination percentage is set by the time the crop isharvested but bad storage can reduce seed viability.
At sowing, management and environment are the keyissues. It is crucial for the crop to germinate, emerge andestablish quickly so that yield potential is not diminished.
Depth of sowing is the main management factorinvolved but environmental stresses, such as waterlogging,may over-ride good management.
This section looks at depth of sowing and the effects ofwaterlogging on plant establishment.
Other stresses and ways to alleviate them, such asstubble retention, gypsum and direct-drilling, are discussedin Chapter 9.
Depth of sowingDepth of sowing is particularly important because:Deeper seed placement delays emergence- equivalent tosowing later; andSeedlings emerging from greater depth are weaker andtiller poorly.
If moisture is adequate, the time from sowing toemergence is determined by the depth of sowing and theprevailing temperatures, as shown in Table 7.7. Averagetemperatures in the wheatbelt vary from 10 to 15 degreesCelsius during sowing and, depending on depth, seedlingswill emerge in about 7 to 21 days.
ExampleEstimate the time to emergence for a crop sown 5 cm
deep at Wongan Hills on June 1.Average monthly temperatures are given in Appendix 1
for many sites in the wheatbelt. These temperatures can beused with Table 7.7 to calculate the time to emergence inmoist soil.
Sown on June 1, the crop will emerge in the first halfof June, average temperature over this period is bestestimated by averaging the temperatures for May and June.From Appendix 1, the average temperature for May is13.7°C and the average temperature for June is 12.1°C,which makes the average over the two months 12.9°C.Using Table 7.7, the crop would therefore be expected toemerge in about 10 days.
CHAPTER 7 – CROP MANAGEMENT THE WHEAT BOOK
140
PLANT ESTABLISHMENT
Temperature Days to emergence
Depth of seed placement (cm)
(˚C) 3.0 5.0 10.0 15.0
20 5.1 6.0 8.8 10.7
15 6.9 8.2 11.4 14.6
12.5 8.5 10.0 13.8 17.6
10 11.0 12.9 17.7 21.57.5 17.7 20.2 26.6 33.1
Table 7.7 – Effect of average temperature and depth of sowing on emergence
Figure 7.6
A representation of the effects of depth of sowing on seedling establishment. Inset: Retardation of leaf development (measured at 42 days)by increased depth of sowing

Effects of water deficit onestablishment
Wheat requires an adequate amount of soil water forgermination and seedling establishment. Germination willnot occur until the moisture content of the grain reaches35 – 45%. The greater the amount of soil water availableto the grain, the faster the germination.
As the seedling develops it becomes more susceptible towater deficit. The amount of soil water required for goodcrop establishment is dependent on a number of factorsincluding weather conditions and soil type. Fine texturedsoils with high clay content require more rainfall to wet upto a sufficient degree for crop emergence compared tolighter textured sandy soils. However finer textured soilsonce sufficiently wet will retain more soil water and willhave a higher water holding capacity. Management factorssuch as cultivation, seeding practices, stubble retention(Collins 1998) and weed control (Fee 1997) will alldetermine the extent to which soil will retain water foradequate crop establishment. The greater the soildisturbance the higher the loss to soil water. Weatherconditions including high temperatures and winds all canreduce the amount of soil water after a rainfall event. Poorcrop emergence and establishment of early sown crops at
THE WHEAT BOOK CHAPTER 7 – CROP MANAGEMENT
141
PLANT ESTABLISHMENT (continued)
As well as delaying emergence, deep sowing reducesplant vigor as is shown in Figure 7.6. After 42 days, plantssown 6 cm deep in a moist loamy sand had almost one leafless compared with plants sown shallower. This lack of aleaf can have a pronounced effect on tiller formation andgrowth of the plant.
Varieties differ in their ability to recover from deepsowing. The ability depends on coleoptile length.
Coleoptile lengthSemi-dwarf wheats, as well as having shorter stems,
have shorter coleoptiles than the tall wheats grown in thepast, so are more likely to emerge poorly if sown too deeply.Coleoptile lengths are listed in Table 7.8.
Table 7.8 – Coleoptile lengths of common wheatvarieties
Variety Length
Halberd VL
Gutha L
Spear M
Tincurrin M
Corrigin M
Cadoux L
Calingiri M
Arrino M
Wilgoyne M
Kalannie M
Kulin S
VL is very long: greater than 90mmL is long: 70-80mmM is medium: 60-69mmS is short: less than 60mm
In a trial at Merredin two varieties of differentcoleoptile length: a tall wheat (Gutha, 102mm), and asemi-dwarf wheat (Kulin, 64mm); were sown at fivedepths.
The results are shown in Figure 7.7. There was littledifference in emergence up to 68mm depth but then theemergence of the shorter coleoptile wheat droppedrapidly. Kulin seed sown 100mm deep took an extra 14days to emerge, had about 35% establishment andyielded only 25% of the plots sown at 40mm. Gutha,with the longer coleoptile, was less affected by the deepersowing.
Sowing deeper to seek moisture in dry seasons may bejustified, however varieties with a short coleoptile(including many modern cultivars) are at great risk of pooremergence.
Figure 7.7a
Figure 7.7b
Emergence and grain yield of a long coleotile, tall variety (Gutha)and a short coleoptile, semi-dwarf variety (Kulin) sown at fivedepths

Merredin has highlighted how high temperature and highsoil evaporation can result in seedling mortality(Armstrong 1999).
Field trials in Western Australia have shown that ingeneral wheat is very tolerant to drought conditions afteremergence (Heinrich 1992, Armstrong 1999). Wheat canbe successfully established on as little as 15 mm of rainfallon heavy clay soil and once established seedlings willsurvive up to 8 weeks without follow up rain in very hotand dry conditions. It has also been found that wheat seedswhich did not initially emerge after sowing, may continueto emerge if follow up rain occurs (up to 6 weeks later).
In an experiment at Merredin in 1994, Spear wheatwas sown at two times of sowing and under different soilmoisture conditions. Spear had reduced rates of seedlingemergence and increased seedling mortality under low soilwater conditions (Figure 7.8). For one sowing, seedlingswhich emerge on low available soil water reached 50%emergence later (after 14 days) than those emerging onbetter water conditions (30 or 35-40 mm, 7-11 days).
While the overall emergence of the wheat seedlingsmay not be effected by different soil water conditions at any one time of sowing, low soil water at seeding (eg less
than 20 mm) can reduce the time to seedling death by upto 17 days. However, seedlings may survive up to 45 dayssuggesting that Spear wheat is very drought tolerant.
Differences in seedling emergence between crops sownat different times on the same amount of soil water aremost likely due to other weather conditions withtemperature playing a vital role in the crop’s establishment(Figure 7.9). For example, crops emerging in extremetemperature conditions (TOS 1) such as 39˚C ambientand 61˚C wow is this right surface soil at 5 cm depthdisplayed reducing seedling emergence compared to moremoderate temperatures (TOS 2).
Given the wheat crop emerges and survives the lowmoisture seeding conditions, if it continues to be exposedto further water stress during this critical stage of theirdevelopment when leaves and tillers are emerging (up toterminal spikelet delays in growth including the time to
CHAPTER 7 – CROP MANAGEMENT THE WHEAT BOOK
142
PLANT ESTABLISHMENT (continued)
TOS1TOS2
r2 = 0.002
r2 = 0.5
20 25 30 35 40 45
25
20
15
10
5
015D
ays
to 5
0% S
eedl
ing
Em
erge
nce
Precipitation (mm)
Figure 7.8
Days to 50% seedling emergence of a Spear crop sown at twotimes of sowing and exposed to different water treatments aftersowing at Merredin Dryland Research Institute in 1994.
600
900
1200
1500
D.R. T.S.TOS2
r2 = 0.79
r2 = 0.49
The
rmal
Tim
e(d
ay °
C)
20 25 30 35 40 4515Precipitation (mm)
600
900
1200
1500
D.R. T.S.
TOS1
r2 = 0.78
r2 = 0.81
The
rmal
Tim
e(d
ay °
C)
20 25 30 35 40 4515Precipitation (mm)
Figure 7.10
Timing of different phenological stages (D.R. = double ridge andT.S. = terminal spikelet) of a Spear crop sown at two times ofsowing and exposed to different water treatments after sowing atMerredin Dryland Research Institute in 1994.
TOS1TOS2r2 = 0.77
r2 = 0.5
20 25 30 35 40 45
60
50
40
30
20
10
015
Day
s to
50%
See
dlin
g M
orta
lity
Precipitation (mm)
Figure 7.9
Days to 50% seedling mortality of a Spear crop sown at two timesof sowing and exposed to different water treatments after sowingat Merredin Dryland Research Institute in 1994.
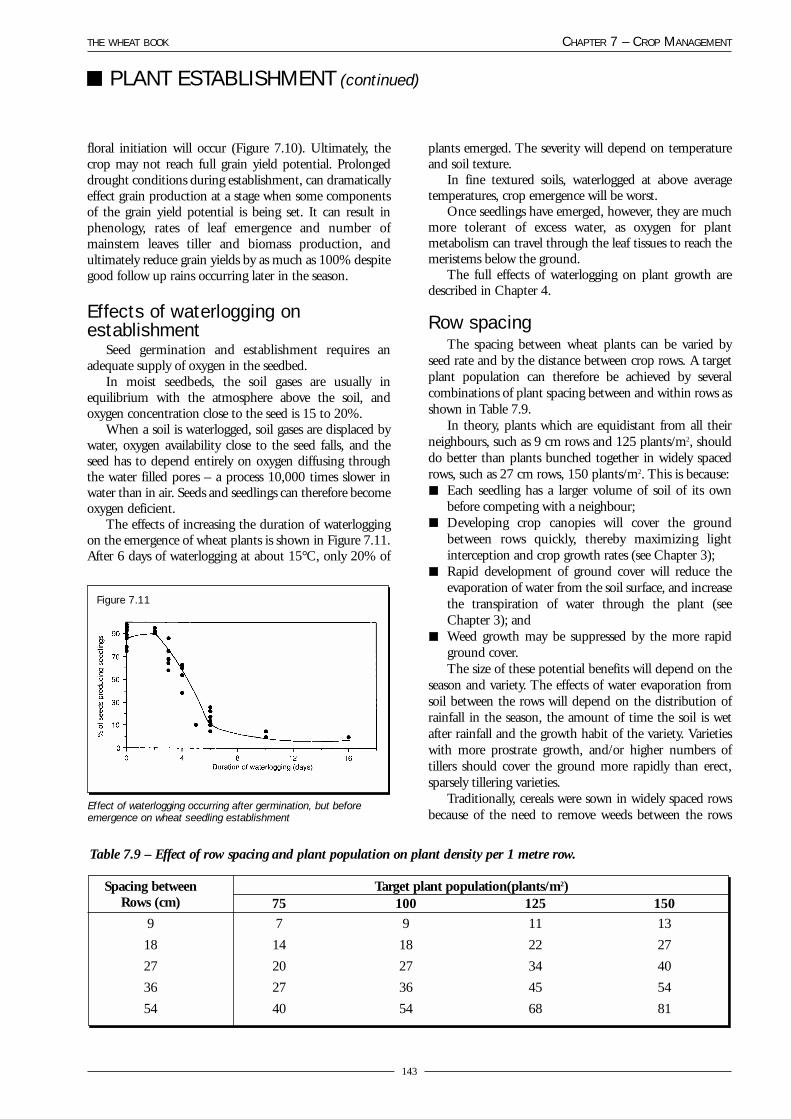
floral initiation will occur (Figure 7.10). Ultimately, thecrop may not reach full grain yield potential. Prolongeddrought conditions during establishment, can dramaticallyeffect grain production at a stage when some componentsof the grain yield potential is being set. It can result inphenology, rates of leaf emergence and number ofmainstem leaves tiller and biomass production, andultimately reduce grain yields by as much as 100% despitegood follow up rains occurring later in the season.
Effects of waterlogging onestablishment
Seed germination and establishment requires anadequate supply of oxygen in the seedbed.
In moist seedbeds, the soil gases are usually inequilibrium with the atmosphere above the soil, andoxygen concentration close to the seed is 15 to 20%.
When a soil is waterlogged, soil gases are displaced bywater, oxygen availability close to the seed falls, and theseed has to depend entirely on oxygen diffusing throughthe water filled pores – a process 10,000 times slower inwater than in air. Seeds and seedlings can therefore becomeoxygen deficient.
The effects of increasing the duration of waterloggingon the emergence of wheat plants is shown in Figure 7.11.After 6 days of waterlogging at about 15°C, only 20% of
plants emerged. The severity will depend on temperatureand soil texture.
In fine textured soils, waterlogged at above averagetemperatures, crop emergence will be worst.
Once seedlings have emerged, however, they are muchmore tolerant of excess water, as oxygen for plantmetabolism can travel through the leaf tissues to reach themeristems below the ground.
The full effects of waterlogging on plant growth aredescribed in Chapter 4.
Row spacingThe spacing between wheat plants can be varied by
seed rate and by the distance between crop rows. A targetplant population can therefore be achieved by severalcombinations of plant spacing between and within rows asshown in Table 7.9.
In theory, plants which are equidistant from all theirneighbours, such as 9 cm rows and 125 plants/m2, shoulddo better than plants bunched together in widely spacedrows, such as 27 cm rows, 150 plants/m2. This is because:
Each seedling has a larger volume of soil of its ownbefore competing with a neighbour;Developing crop canopies will cover the groundbetween rows quickly, thereby maximizing lightinterception and crop growth rates (see Chapter 3);Rapid development of ground cover will reduce theevaporation of water from the soil surface, and increasethe transpiration of water through the plant (seeChapter 3); andWeed growth may be suppressed by the more rapidground cover.The size of these potential benefits will depend on the
season and variety. The effects of water evaporation fromsoil between the rows will depend on the distribution ofrainfall in the season, the amount of time the soil is wetafter rainfall and the growth habit of the variety. Varietieswith more prostrate growth, and/or higher numbers oftillers should cover the ground more rapidly than erect,sparsely tillering varieties.
Traditionally, cereals were sown in widely spaced rowsbecause of the need to remove weeds between the rows
THE WHEAT BOOK CHAPTER 7 – CROP MANAGEMENT
143
PLANT ESTABLISHMENT (continued)
Figure 7.11
Effect of waterlogging occurring after germination, but beforeemergence on wheat seedling establishment
Table 7.9 – Effect of row spacing and plant population on plant density per 1 metre row.
Spacing between Target plant population(plants/m2)Rows (cm) 75 100 125 150
9 7 9 11 13
18 14 18 22 27
27 20 27 34 40
36 27 36 45 54
54 40 54 68 81

mechanically. With herbicides, row spacing was reduced tothe present 18 to 17cm.
It is possible to reduce the effective row spacing stillfurther, including sowing at 9cm by using multiple tineassemblies or by broadcasting seed from a fertilizerspreader, for example.
Yields of cereals increase as the spacing between rows isdecreased. Here we discuss results from work in WesternAustralia over the past decade, and outline the potentialproblems and solutions to sowing cereal crops in narrowrows.
Results in Western AustraliaTrials have been conducted since 1982 in the central,
eastern and northern wheatbelt, using several varieties, ona range of soil types, and in areas receiving between 210and 390mm of rainfall in the growing season.
Row spacings from 9 to 54cm have been tested atseeding rates from 10 to 60kg seed/ha; in some trials, seedwas also broadcast.
Stubble had been removed by burning.Overall, decreasing the row spacing has increased grain
yield, with an average 8% increase in yield for each 9cmdecrease in row spacing from 54 to 9cm (Table 7.10).
While increasing seed rate towards the optimumgenerally increased yield, there was no interaction betweenseed rate and row spacing, that is, the yield response to
reducing row spacing was the same irrespective of the seedrate used. This is not surprising since the theoreticaladvantages of reduced competition and faster ground covershould not rely on the number of seeds sown.
Broadcasting seed has not shown the benefit in yieldthat might be expected, largely because of the problems inachieving satisfactory establishment in some of the earlytrials.
The main effect of decreasing row spacing has been toincrease the number of heads per square metre, and to alesser extent, the kernel weight. Kernels per ear and harvestindex were not affected. This suggests that reducingcompetition between plants has helped tiller survival andthe availability of water during grain filling.
Effect of retained stubblesWidening row spacing to make it easier to get through
stubble is likely to reduce grain yield. However, one of thepotential problems of reducing the row spacing has beenthe ability to seed through stubbles without blockages.
A key to handling stubble at seeding time, if sowingwith tines, is to have the stubble in short lengths that ‘flow’through the machine.
In trials, stubble was mown after harvest to leave bothstanding stubble and loose straw in about 20cm lengths.Trials were direct-drilled with an experimental seeder madeby the Agriculture Western Australia’s Machinery Unit.This machine seeded on tines on each of six bars, and had
CHAPTER 7 – CROP MANAGEMENT THE WHEAT BOOK
144
PLANT ESTABLISHMENT (continued)
Table 7.10 – Effect of row spacing on yields of wheat in the absence of stubble, 1982 to 1985. (Yield from the 18cm rowspacing is taken as 100%).
Row spacing (cm)
Number of trials Topdress 9 18 27 36 45 54
7 91 - 100 92 94 - -
9 - 115 100 95 90 77 75
16 - 112 100 93 - - -
Mean response % -9 +14 - -7 -8 -23 -25
Kg grain/ha per cm change in -14 +24 - -11 -5 -23 -5row spacing
Row spacing (cm)Treatment 9 18 27 36
Stubble burnt 103 100 99 94
Stubble retained 100 100 94 93
Mean % 101 100 96 94
Grain yield (t/ha) 2.31 2.28 2.20 2.14
Source: Riethmuller GP, Agriculture Western Australia
Table 7.11 – Effect of stubble and row spacing on yield of wheat on a heavy soil (average for 1988, 89, 90, 91, 93 and95). Yield from the 18 cm row spacing is taken as 100%.
Source: Riethmuller GP, Agriculture Western Australa
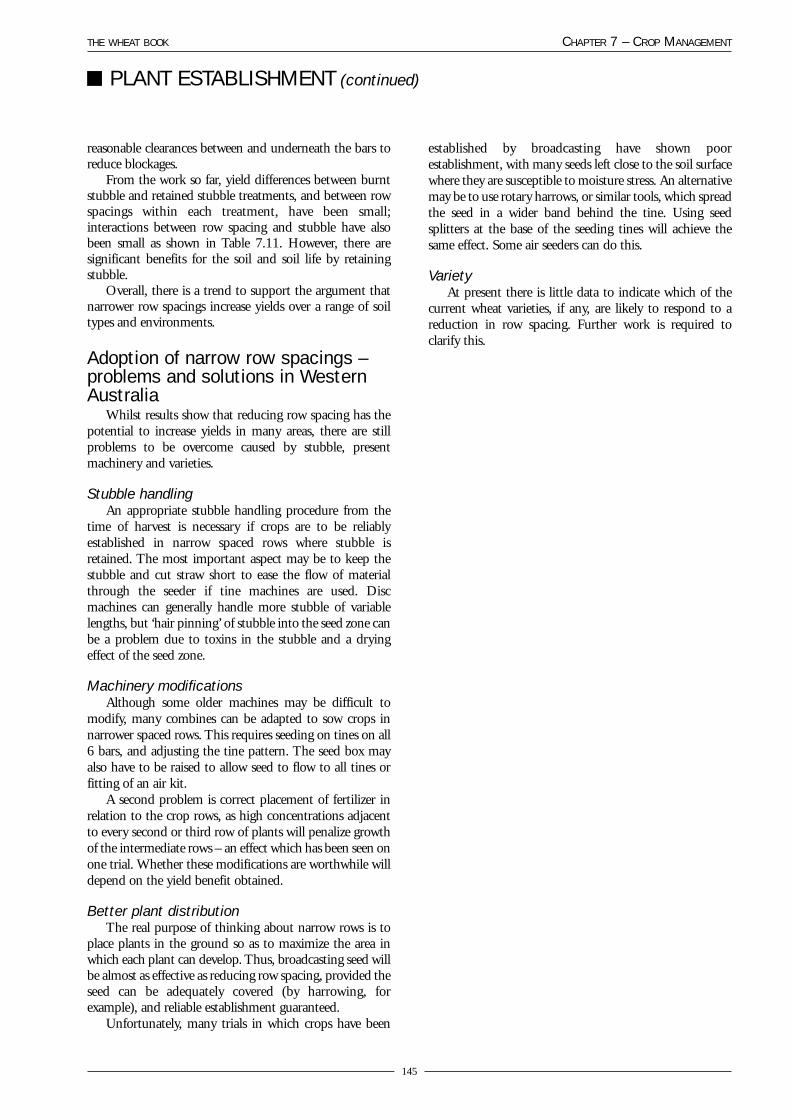
reasonable clearances between and underneath the bars toreduce blockages.
From the work so far, yield differences between burntstubble and retained stubble treatments, and between rowspacings within each treatment, have been small;interactions between row spacing and stubble have alsobeen small as shown in Table 7.11. However, there aresignificant benefits for the soil and soil life by retainingstubble.
Overall, there is a trend to support the argument thatnarrower row spacings increase yields over a range of soiltypes and environments.
Adoption of narrow row spacings –problems and solutions in WesternAustralia
Whilst results show that reducing row spacing has thepotential to increase yields in many areas, there are stillproblems to be overcome caused by stubble, presentmachinery and varieties.
Stubble handlingAn appropriate stubble handling procedure from the
time of harvest is necessary if crops are to be reliablyestablished in narrow spaced rows where stubble isretained. The most important aspect may be to keep thestubble and cut straw short to ease the flow of materialthrough the seeder if tine machines are used. Discmachines can generally handle more stubble of variablelengths, but ‘hair pinning’ of stubble into the seed zone canbe a problem due to toxins in the stubble and a dryingeffect of the seed zone.
Machinery modificationsAlthough some older machines may be difficult to
modify, many combines can be adapted to sow crops innarrower spaced rows. This requires seeding on tines on all6 bars, and adjusting the tine pattern. The seed box mayalso have to be raised to allow seed to flow to all tines orfitting of an air kit.
A second problem is correct placement of fertilizer inrelation to the crop rows, as high concentrations adjacentto every second or third row of plants will penalize growthof the intermediate rows – an effect which has been seen onone trial. Whether these modifications are worthwhile willdepend on the yield benefit obtained.
Better plant distributionThe real purpose of thinking about narrow rows is to
place plants in the ground so as to maximize the area inwhich each plant can develop. Thus, broadcasting seed willbe almost as effective as reducing row spacing, provided theseed can be adequately covered (by harrowing, forexample), and reliable establishment guaranteed.
Unfortunately, many trials in which crops have been
established by broadcasting have shown poorestablishment, with many seeds left close to the soil surfacewhere they are susceptible to moisture stress. An alternativemay be to use rotary harrows, or similar tools, which spreadthe seed in a wider band behind the tine. Using seedsplitters at the base of the seeding tines will achieve thesame effect. Some air seeders can do this.
VarietyAt present there is little data to indicate which of the
current wheat varieties, if any, are likely to respond to areduction in row spacing. Further work is required toclarify this.
THE WHEAT BOOK CHAPTER 7 – CROP MANAGEMENT
145
PLANT ESTABLISHMENT (continued)

Most quality characteristics can be modified byseasonal conditions and crop management, grain proteinpercentage being particularly sensitive.
However, several of the quality attributes of wheat areinfluenced more by cultivar than by environment ormanagement. For example, wheat cultivars are classified asacceptable for various grades according to their grainhardness, milling and dough properties.
Growers are offered premiums for protein percentageof the grain delivered and are docked for deficienthectolitre weight or excessive small grain sievings, weatherdamage and admixtures. Premiums are also offered forcultivars suitable for various grades such as Noodle(ASWN) and Australian Hard, because of their qualitiesfor specific end uses. Currently, protein percentage,hectolitre weight, sievings, weather damage and admixtureare the only aspects of grain quality that directly affect theprice paid on delivery.
Other quality attributes, such as flour yield and doughproperties (eg. extensibility, water absorption, doughstrength and development time) have a more indirect effectvia the saleability of particular grades of wheat as a whole.
While crops can be managed to reduce small grains,admixtures and weather damage, the quality factor that ismost sensitive to management is protein percentage in thegrain.
Grain protein percentageGrain (and flour) protein percentage (concentration)
contributes more to the quality of bread products than anyother factor. Protein percentage is closely linked withdesirable dough properties which lead to desirable loafproperties. It can easily and quickly be measured, makingroutine protein testing more feasible than other morecomplex characteristics.
The average grain protein percentage of wheat inWestern Australia has been about 10% in the 1990s.However, premiums are paid for cultivars suitable forsome grades at specific protein levels (eg. AustralianPremium White >10%, Australian Hard >11.5%,Australian Soft <9.5%, Noodle 9.5 to 11.5%). Theproportion of wheat received into these grades hasincreased to over 40% of the crop since the mid-1990s.
Once a cultivar has been accepted as suitable for aparticular grade the main factor that influences it’ssuitability for various end products is it’s grain proteinpercentage. For pan-type breads high concentrations ofgood quality protein are preferred. For most biscuits andcakes grain protein needs to be less than 9.5%, while forJapanese-style white, salted noodles the ideal proteinconcentration is 10.5%. For Chinese- style yellow,alkaline noodles a protein concentration over 13% ispreferred.
Grain protein percentage can be altered by:-seasonal conditionsrotationN fertilizer applicationdiseasesweeds, especially grasseschoice of soil typecultivar
Seasonal conditionsWater and nitrogen supply to the wheat crop are
affected by the amount and timing of rainfall and bytemperature. Rain during the summer months beforesowing, when temperatures are higher, can assistbreakdown of crop residues and release of organic nitrogen.This can improve nitrogen supply for the following cropand may increase protein percentage in the grain. Excessiverainfall during the growing season may inducewaterlogging or drainage of water below the root zone ofthe crop. Either factor can reduce nitrogen availability, cropgrowth and grain protein percentage.
The weather during the grain filling period of cropgrowth is probably the most important factor affectinggrain protein percentage. Over 80% of nitrogen in the cropis taken up before flowering and stored in stems and leaves.It is deposited in the grain in the form of protein at a ratethat reaches it’s maximum during the early part of grainfilling. If seasonal conditions are favourable, some nitrogenis also taken from the soil after flowering and alsocontributes to grain protein. Carbohydrate (mainly starch)is also deposited in the grain but it’s rate reaches amaximum later in the grain filling process. The eventualprotein concentration of the grain is thus a result of theamount of dilution of the protein by the carbohydratesupply.
CHAPTER 7 – CROP MANAGEMENT THE WHEAT BOOK
146
MANAGEMENT TO IMPROVE WHEAT QUALITY
Table 7.12 – Delayed sowing increases grain protein percentage but reduces grain yield. [data are the average of 8 sitesin 1987 and 1988, Anderson et al]
May Sowing June Sowing0N 50N* 0N 50N*
Grain yield (t/ha) 2.88 3.36 2.67 3.02
Grain protein (%) 9.6 10.7 10.1 11.1
* kg/ha of N applied as ammonium nitrate at sowing

Hot, dry conditions during grain filling reducecarbohydrate deposition in the grain more than proteindeposition. Therefore, with a hot, dry finish to the season,grain protein concentration will be higher than where thereis a cool, moist seasonal finish and more carbohydrate isdeposited in the grain. This effect is clearly shown (Table7.12) when comparing grain yield and grain proteinresponses from late (hot, dry finish) compared to earliersowings (cool, wet finish). It is probably never economic todelay sowing in order to increase grain protein percentagesince the increased return from protein seldomcompensates for the reduction in yield.
While seasonal conditions probably have the greatestsingle influence on grain protein percentage, thecombined effects of crop rotation, nitrogen fertilizer,diseases, insect and weed control, and choice of soil typecan substantially reduce variation in grain proteinpercentage due to seasonal effects. For example, the datain Table 7.12 indicate that later sowing increased grainprotein by about 0.5% at both nitrogen rates but theapplication of 50 kg/ha of nitrogen (economical forincreasing grain yield in this example) increased proteinby about 1% at both sowing times.
RotationRotation of wheat with either pasture legumes or pulses
significantly increases wheat protein percentage comparedwith continuous cereal cropping. Rotations with legumesalso increase grain yield substantially, which is the mainreason for including them in rotations. Some examples aregiven in Table 7.13.
Soil nitrogen, and the potential to increase grainprotein percentage, is proportional to the length of thepasture phase in the rotation provided weed control ismaintained. However, the most economical length of the
legume pasture phase will depend on the profitability ofgrain production relative to animal production (chieflywool). When profitability of the animal enterprise is high,legume pasture phases can be longer and grain proteinpercentages will be increased without the necessity for highrates of N fertilizer.
Growing field peas, chickpeas, faba beans or lentils onclay soils could also maintain soil nitrogen levels andproduce higher grain protein percentages.
Any wheat production system which includes legumesin the rotation will probably improve nitrogen supply andprovide opportunities for improved control of grass weedsand root diseases. Such systems should reduce reliance onfertilizers in the long term and arrest the decline in, or evenincrease, grain protein percentages.
Nevertheless, nitrogen fertilizers are often an importantinput for wheat production in Western Australia, yieldsbeing increased even in rotations containing legumes.
NitrogenBecause nitrogen is an essential part of protein, its
supply is an important determinant of grain proteinconcentration. At a given yield of 2 t/ha and 10% grainprotein (close to the state average yield and protein), about35 kg/ha of nitrogen is removed in the grain. The averageapplication of nitrogen fertilizer to wheat crops in WesternAustralia is also about 35 kg/ha but typically only 50% ofnitrogen applied is taken up by the crop.
This leaves about half of the nitrogen required for theaverage crop that must be supplied from other sources(largely from soil organic matter).
The generalized relationship between grain yieldand grain protein response to nitrogen fertilizer isshown in Figure 7.12. In zone A in the figure wherethere is a large yield response to added nitrogen,
THE WHEAT BOOK CHAPTER 7 – CROP MANAGEMENT
147
MANAGEMENT TO IMPROVE WHEAT QUALITY (continued)
Rotation Wheat GrainYield (t/ha) Protein (%)
Medics on a loamy clay at Salmon Gums
Continuous wheat 1.00 9.1
1 year medic: 1 year wheat 1.45 10.9
3 years medic: 1 year wheat 1.62 11.9
Peas in the eastern wheat belt
Continuous wheat 1.34 8.7
Wheat: peas 1.86 10.8
Lupins
Continuous wheat 1.37 9.5
Wheat: lupin 2.00 10.6
Table 7.13 – Legumes included in rotations increase wheat grain yield and protein concentration. [data of I. Rowlandsand M. Mason]
protein concentrations may fall or remain unchanged.In zone B, where the yield response is less, proteinlevels begin to increase. Economic rates of fertilizer willfall into zone B where yields are still responsive tonitrogen but where increases in protein level are alsolikely. In zone C grain protein is increased markedlybut yields are not increased at all.
Grain protein concentrations (and sometimes alsoyield) can be increased by late applications of nitrogen,even up to the ‘boot’ stage of development. However,under most conditions in Western Australia there isinsufficient rainfall and soil moisture to make nitrogenapplied late in the season available to the crop. Thispractice thus has a high risk, especially in the low andmedium rainfall areas.
There is an important interaction between soil type,legume rotation and response to applied nitrogen that
CHAPTER 7 – CROP MANAGEMENT THE WHEAT BOOK
148
MANAGEMENT TO IMPROVE WHEAT QUALITY (continued)
Figure 7.12
The generalized relationship between nitrogen application, grainyield and grain protein percentage.
Soil Type Legume History Economic Optimum* Grain proteinN rate*(kg/ha) at N opt (%)
Red clay loam Medic or field peas 15 12.4
Grassy pasture or cereal 36 10.5
Duplex Sub. Clover 22 10.8
Grassy pasture or canola 52 9.4
Sandplain Sub. Clover 38 11.0
Lupin 19 10.3
Table 7.14 – Soil type and legume rotation affect economic optimum N application rate and grain protein percentage.
* the N rate required to obtain a yield response of 5kg/ha of grain for 1kg/ha of N.
affects the economic optimum nitrogen rate for yield andthe grain protein percentage. It implies that soils with ahigher clay content require less nitrogen to achieveoptimum yield and achieve higher grain protein levels thansandier soils if there is a good legume rotation (see Table7.14).
DiseasesPart of the benefit of rotation with legumes (and
broadleaf crops such as canola) is to provide a disease‘break’ for the wheat crop. Cereal root diseases such astake-all and crown rot that are transmitted by grassweeds can greatly reduce wheat yields (see Table 7.15).
Leaf diseases such as the septorias can also be reducedslightly by the use of a non-cereal in the rotation. Bothtypes of diseases can devastate wheat yield in parts ofWestern Australia (see also Chapter 10), but grainprotein percentage can be reduced as well (see Table7.16).
Weed competitionWeeds compete with the wheat crop for water,
nutrients and light. Competition for water and light willprobably reduce yields but if competition for water isespecially strong during grain filling it may restrictcarbohydrate deposition in the grain causing pinched grainand increased grain protein percentage.
Competition for nitrogen will also reduce yields,especially when the soil supply is low. However, weedcompetition will also reduce grain protein levels and isespecially strong in the case of competition from grassweeds (see Table 7.17).
Control of weeds in the year before cropping canincrease yield and protein percentage. The effect probablycomes partly from reductions in diseases and partly fromincreases in the soil nitrogen supply.

Choice of soil typeIn general, the finer textured clay soils contain more
organic matter than the coarse textured sandy soils andtend to produce grain with a higher protein concentration.However, clay soils that have been heavily cropped andover-cultivated in the past can have seriously depletedorganic matter and nitrogen reserves that can produceextremely low grain protein levels. Conversely, sandy soilsthat have been well managed with longer pasture phases,stubble retention and reduced tillage can have goodorganic matter content with good nitrogen reserves andproduce relatively high grain protein levels.
The effect of soil type on grain protein percentage andthe interaction with rotation and nitrogen requirement isillustrated in Table 7.14 as discussed earlier in this chapter.The implication is that the choice of soil type andmanagement has an important bearing on the probabilityof the grain protein percentage being appropriate forvarious grades of wheat which receive premiums forquality.
Choice of cultivarThe management factor which has the least effect on
grain protein percentage is the choice of cultivar. The maindifferences between cultivars are those between grades orclasses of wheats with differences within a grade (egAustralian Premium White) being small and variable.
The major differences between grades of wheat inWestern Australia are illustrated by Figure 7.13 whichcontains the results from a large number of fieldexperiments conducted from 1989 to 1993. The figureshows that at the economic optimum nitrogen rate(where 5kg of grain is produced for each 1kg of Napplied, indicated by the dotted, vertical line in thefigure), the grain protein percentage for cultivars thatqualify for the Australian Soft grade was about 9.4%; forcultivars in the Noodle (ASWN) grade it was about10.8%; and for cultivars in the Australian Hard grade itwas about 11.2%.
Once a cultivar suitable for the target grade has beenselected, the most important challenge for producers of
THE WHEAT BOOK CHAPTER 7 – CROP MANAGEMENT
149
MANAGEMENT TO IMPROVE WHEAT QUALITY (continued)
Treatment in Grass dry matter Take-all Wheat previous year in previous pasture Incidence Severity Yield(t/ha) (t/ha) (%) (%)
Nil 0.90 20 30 1.10
Spraytop 0.40 10 18 1.85
Grass selective 0.30 7 15 1.95
Broad spectrum herbicide 0.25 5 7 2.10
Table 7.15 – Relationship between grass weed control, take-all and wheat yield. [MacLeod et al., 1993]
Treatment on clover pasture in Wheat yield Wheat proteinprevious year (t/ha) (%)
Nil 1.62 12.1
Broadleaf herbicide 2.05 12.1
Grass herbicide 2.64 13.4
Both herbicides 2.91 13.8
Table 7.16 – Weed control in the year before cropping increases wheat yield and protein percentage [data of C. Thorn]
N applied (kg/ha) Grain yield (t/ha) Grain protein (%)
‘Grass-free’ sites (3)
0 2.32 10.0
40 2.50 10.5
‘Grassy’ sites (3)
0 1.86 8.9
40 2.26 9.3
Table 7.17 – Grass weeds reduce grain yield and protein percentage.

high quality wheat is to employ management practices thatwill maximize the probability of achieving the requiredgrain protein percentage.
Hectolitre (or test) weightThe weight of grain per unit volume in kg/hl is easily
measured and is a good indicator of the yield of flour thatcan be milled from a sample of grain.
A standard of 74kg/hl has been set for all milling gradesof wheat. Grain that falls below this standard isdowngraded to the General Purpose or Feed grades. It isconsidered to be a minimum standard and wheat suitablefor high quality breads or noodles are more valuable if ahigher standard is achieved. For example, 78kg/hl is oftenmore appropriate for noodle wheat and 80kg/hl is desirablefor durum wheat for pasta.
As discussed earlier in this chapter the main factorsreducing hectolitre weight are mismatching cultivar andsowing time, diseases, aphids and frost damage. Cultivarsdiffer in their inherent hectolitre weight but there isrigorous selection against light weight cultivars so thatmodern cultivars are seldom deficient.
Small grain sievingsExcessive numbers of small grains also reduce the
amount of flour that can be extracted from a sample ofwheat. Delivery standards (mostly 5% by volume) are setto reflect the reduced commercial value of samples thatcontain excessive numbers of small grains (<2 mm slottedscreen).
Small grains most often result when the conditionsduring the period when kernel or grain number is beingdetermined (from about 20 – 30 days before and up to
flowering) are more favourable than those during the grainmaturation period. This can result from depletedcarbohydrate supply to the grain due to diseases or insects,extremes of temperature, water supply or nutrition.
There is often more than one cause of excessive smallgrains in a sample of wheat. For example, sowing a cultivarafter it’s optimum time is less likely to produce small grainsthan if it is sown with a high nitrogen and seed rate as well.Increasing seed rate is as likely to increase seed size as todecrease it, depending on the paddock history. This isillustrated in Figure 7.14 where increasing the seed rateincreased seed size in experiments following cereals orcanola where the nitrogen supply was less but decreased itwhere the experiments followed a long legume pasturephase.
In soils with a marginal soil potassium test (K<60ppm),there can be an interaction between potassium andnitrogen fertilizers that dramatically affects small grainsievings. (see Table 7.18). Potassium (K) has a role incarbohydrate metabolism that means a restricted supplyprobably reduces deposition of starches in the grains whichin turn reduces grain size (see also Chapter 5).
Deficiencies of trace elements such as copper and zincmay also play some part in the production of small grains.Such deficiencies are more likely to show up as reductionsin grain yield rather than as problems with small grain.
Most modern cultivars have been selected against smallgrain size and so are less likely to interact with managementand seasonal factors to produce excessive small grains.However, cultivars that have been selected in environmentsthat are widely different from Western Australia may havesmaller average grain size and may be more susceptible tosmall grain problems in this environment.
CHAPTER 7 – CROP MANAGEMENT THE WHEAT BOOK
150
MANAGEMENT TO IMPROVE WHEAT QUALITY (continued)
12
11
10
9
8
0 5 10
Gra
in p
rote
in (
%)
Yield response to N (kg/kg)
Figure 7.13
Relationship between grain protein and yield response to appliednitrogen. � Hard wheat, solid line, � Noodle wheat, dashed line,� Soft wheat, bottom line.
20 40 60 80 1000
1
2
3
4
5
6
7
8
Sie
ving
s <
2mm
(%
)
Seed rate (kg/ha)
Figure 7.14
Influence of seed rate and paddock history on small grain sievings(<2 mm) in a club head wheat (Corrigin) and a standard headwheat (Reeves). �� Corrigin, pasture sites, � Reeves, pasturesites, �� Corrigin, crop sites, � Reeves, crop sites. Vertical bar is2 x sed. Horizontal dashed line is upper limit for sievings foracceptance into the Soft wheat grade (3% by weight, equivalent tonew standards of 5% by volume).[Anderson and Sawkins, 1997]

Production ‘packages’ for producingpremium quality wheat
The ‘package’ approach to crop production consists ofa check list of the major agronomic practices required toachieve yields that are close to the potential for theenvironment and season. Each component of the ‘package’is based on research findings that are known to havepractical application to yield improvement. Application ofthe ‘package’ can proceed by steps as resources becomeavailable and as the producer gains confidence in the idea.It is not necessary to adopt all of the ‘package’ at once inorder to gain a yield increase in most cases. Howeveradoption of the entire ‘package’ will ensure grain yields andgrain quality are maximised.
The ‘High Yield Package’ is comprised of 5 steps:-Select good cropping landUse a legume rotationControl grass weeds 1 or 2 years before the wheat cropSelect productive cultivars and sow them at theappropriate timesIncrease nitrogen and seed rates to take advantage ofthe improved yield potentialSpecific production ‘packages’ to improve the chances
of producing grain suitable for premium-paying grades aremodifications of the ‘High Yield Package’ and have alsobeen derived from specific research projects. The ‘HighProtein Package’ is intended for producers of wheat for theAustralian Hard grade of wheat (>11.5% protein) and isalso useful for potential growers of durum wheat wheregrain protein levels of 13% are desirable.
The “High Protein Package’:-Select high quality clay loam soilsUse a legume rotation (pasture or pulse)Control grass weeds before croppingChoose high quality cultivars and sow at appropriatetimesNitrogen requirements are minimal on good clays afterlegumesUse more nitrogen fertilizer on early sown cropsFor Noodle wheat, where the protein limits are
between 9.5 and 11.5%, management is somewhat more
difficult. Nevertheless, the success rate can be improved bythe use of a more specific ‘package’.
The ‘Noodle Wheat Package”:-Select sandy loams, sands or duplex soils (protein ismore difficult to manage on clay soils)Use a good legume rotation (lupin or clover)Control grass weeds before cropping (they reduce yieldsand protein)Choose high quality varieties and sow at their optimumtimesApply N up to 20kg/ha in a good legume rotation, upto 50kg/ha otherwiseAdjust seed rate according to soil fertility, sowing timeand cultivarThe goal for producers of Australian Soft grade wheat
is to keep grain protein below 9.5%. This grade of wheat isproduced in an area that has traditionally produced lowgrain protein levels but there is considerable concern aboutprotein levels that exceed the upper limit and aboutdockage due to excessive small grains.
The ‘Soft Wheat Package’Select well drained soils with good water holdingcapacity where possibleUse soils with a low N status (after canola, pulses, 1year clover pasture)Test soil and/or tissue for potassium Sow from the second week of May onwards with theappropriate cultivarsUse seed and fertilizer rates that will optimize yield.Avoid using high seed rates if sowing late with Nfertilizer.The ‘package’ approach is increasingly being
supplemented by techniques such as crop monitoring sothat general ‘packages’ can be fine-tuned for individualfarms and paddocks.
Management to reduce Black point Black point is a significant quality issue, particularly for
the northern and south coast regions of the WesternRegion. The significance of black point as a quality issue
THE WHEAT BOOK CHAPTER 7 – CROP MANAGEMENT
151
MANAGEMENT TO IMPROVE WHEAT QUALITY (continued)
Fertilizer Grain Whole grains Grain Hectolitre Treatment yield <2mm protein weight(kg/ha) (t/ha) (%) (%) (kg/hl)
Nil 2.27 25 11.469
40N 1.49 35 11.7 65
60K 2.93 9 9.9 77
60K+40N 3.59 8 9.6 79
Table 7.18 – The effect of potassium and nitrogen fertilizers on wheat yield and grain quality. [Anderson, French andSeymour, 1992]

for Western Australia has largely been underestimated andas a consequence, it has not been a major priority forbreeding programs to date.
Excessive black point levels have the potential to reduceflour yield and end-product quality and consequently,delivery standards are imposed to reflect the reduced valueof affected grain to premium paying markets. Qualityspecifications for black point in premium wheat gradesrequire that less than five percent of grain be affected.
Mechanisms for black point expression are not wellunderstood and appear to be largely influenced byenvironment and crop maturity. Even though theunderlying cause (biological and/or metabolic) can not beagreed upon, symptomatic expression is likely to occuronly when grain is exposed to conducive conditions priorto harvest. Moist, humid conditions during crop ripeningare the major contributing factors to the development ofblack point, so it is only a problem in some regions andseasons. This suggests on-farm management and cultivarchoice can be used effectively to reduce the risk of blackpoint by influencing the development of crop growth.
Investigation of management factors affecting blackpoint incidence has been successful in determiningappropriate strategies for implementation on farms. Thesefactors include cultivar selection, sowing strategies and theidentification of high, medium and low ‘risk’ areas forproduction. Integrated application of these managementoptions has successfully lowered the incidence of blackpoint, increasing grower returns directly and aiding in theplacement of new cultivars within the wheatbelt ofWestern Australia.
Cultivar EvaluationEvaluation of cultivar performance should balance
grain yield, black point tolerance and risk of small grainscreenings in estimating the likely net return. The choice ofcultivars will depend on the perceived risk of each of theseand other factors.
In addition to management for black point, cultivarchoice is a primary factor determining risk. Evaluation of arange of new and established cultivars has indicated that
there are currently no cultivars known to be completelyresistant to black point, though a range of tolerances havebeen identified (Table 7.19).
Due to variations in cultivar susceptibility for differentregions, tolerance information largely provides acomparison of cultivar risk in the development of blackpoint, which can be utilized by growers to make moreinformed cultivar choices. Rankings represent the averagecultivar performance expected, and estimates of thelikelihood of developing black point in any season musttake into account both cultivar susceptibility and area risk.In extremely wet years and in coastal areas, growers shouldexpect poorer performance.
These rankings should be used as a guide only, as incidenceand severity will vary with location. More accurate estimatesof risk can be made by utilising both Table 7.19 and Figure7.15 below.
The range of cultivar tolerance identified underdifferent environmental and management conditions,allows a strategic seeding program to be implementedwhere risk is spread by seeding tolerant cultivars first,followed by cultivars which respond strongly to delayedseeding and allowing more susceptible cultivars to be sownlater. By using this strategy under a range of conditions,
CHAPTER 7 – CROP MANAGEMENT THE WHEAT BOOK
152
MANAGEMENT TO IMPROVE WHEAT QUALITY (continued)
Cultivar Resistance rating1-9 Scale
Corrigin, Eradu, Gutha, Tammin 2 – Very susceptible
Janz 3 – Susceptible
Stretton, Blade, Arrino, Kalannie, Wilgoyne, Westonia 4 – Moderately
Schomburgk, Amery, Aroona, Carnamah, BT-Schomburgk, Cunderdin, 5 – IntermediateDagger, Gamenya, Kite, Stiletto, Nyabing, Calingiri, Datatine, Tincurrin, Cadoux
Brookton, Spear 5/6 – Inter/moderately
Machete, Sunco, Cascades, Cranbrook, Halberd, Perenjori, Sunstate 6 – Moderately
Table 7.19 – Black Point Resistance Ratings for wheat in Western Australia
Figure 7.15
Guide to blackpoint risk in Western Australia.

both tolerant and intolerant cultivars can be used in aprogram to maximize yield and gross returns for thegrower, whilst achieving the best possible grain quality.However, in years conducive to black point, someproportion of grain is still likely to be affected, particularlyif located in coastal regions.
Evaluation of production areas likelyto be at high risk
Rain during crop ripening is the major contributingfactor to the development of black point, so it is only aproblem in some regions and seasons. Areas which aremost at risk of developing black point are indicated inFigure 7.15. These assessments will vary with season, withvery wet seasons increasing the risk of black point.
Figure 7.15 indicates areas of Western Australia whichare at low risk of producing black point affected grain andwhich are most likely to experience downgradingproblems. It is also evident from this figure, that climateremains the most significant factor influencing black point.‘Areas of risk’ that have been identified for the productionof grain affected by black point, correlate with areasexperiencing more frequent rainfall and higher humidities.These ‘Areas of risks’ provide a useful tool for cultivardecisions.
Time of sowing The promotion of early sowing has the potential to
increase returns through higher yields, but may also resultin a loss of grain quality for areas prone to black point.Significant reductions in black point levels have beenmeasured with later sowings, despite annual fluctuations inenvironmental conditions (Figure 7.16). However, in yearswhere above average rainfall is received during grain fillingand ripening, the potential for high levels of black pointremains.
Early sown crops are most at risk to blackpoint,particularly the more susceptible cultivars. The risk ofblackpoint can be reduce by using more tolerant cultivarsfor seeding earlier in the seeding program. However, thedevelopment of black point is most affected byenvironment, and in conducive years, all grain can beaffected by black point, particularly if located in coastalregions.
In general, significant yield losses were not associatedwith delayed sowing of up to 10 days at the majority ofsites. The strength of the response and maturity typehowever, will largely determine those that are likely toprovide an economic return by moving from a generalpurpose grade into a higher paying premium grade (Table7.20). Excessively wet periods during grain developmentand ripening, are likely to minimize this response.
Limited trial data from the northern agriculturalregion, indicates black point levels decline at an averagerate of 0.25% per day’s delay in sowing. The response todelayed seeding on sandplain soils was greater than on theheavier clay loam soils tested.
THE WHEAT BOOK CHAPTER 7 – CROP MANAGEMENT
153
MANAGEMENT TO IMPROVE WHEAT QUALITY (continued)
0
5
10
15
20
1996
1997
1995
Bla
ck p
oint
inci
dnce
(%)
Sowing Date
Mid May Late May Early June Mid June Late June
Figure 7.16
Linear trends for black point incidence (per cent) from 1995 to1997.
Table 7.20 – Estimate of sowing date most likely to return maximum benefit to growers
TOS1 TOS2
Low Rainfall Zone (< 325mm) Brookton, Cascades, Machete, Spear, Cadoux, Wilgoyne,Calingiri, Perenjori, Carnamah, CunderdinGamenya, Westonia, Amery, Eradu, Arrino
Medium Rainfall Zone Brookton, Cascades, Machete, Calingiri, Perenjori, Gamenya, (325-450mm) Spear, Cunderdin Cadoux, Wilgoyne, Westonia, Amery, Eradu, Arrino,
Carnamah
High Rainfall Zone (> 450mm) Brookton, Cascades, Machete, Spear, Westonia, Amery, Eradu, Calingiri, Perenjori, Gamenya, Arrino, CunderdinCadoux, Wilgoyne,Carnamah
(Data is from trials located within the northern agricultural region from 1995 to 1997. Economic analysis includes grain yield andquality assessments, including protein payments based on 1998 pool returns)

significant increase in grain weight for Machete can beassociated with the increase in black point incidence,indicating the black point response may be associated withchanges in grain weight for this cultivar. Response toincreasing seed rates, appears to be related to thesubsequent changes in grain weight, indicating a numberof factors which influence grain size may be important inthe management of black point.
ClimateRain during crop filling and ripening is the major
contributing factor to the development of black point, sothat it is only a problem in some regions and seasons.However there are other contributing factors such as cropmaturity. Through multiple regression, 84% of variation in
NitrogenThe application of nitrogen has previously been
associated with changes to black point levels in wheat andpast research suggests response may vary with backgroundsoil nitrogen. In the northern agricultural region ofWestern Australia, nitrogen application failed tosignificantly reduce the level of black point in three wheatcultivars on a range of soil types. Sandy soils wereassociated with a greater response to nitrogen, but it isunlikely that a positive economic response to nitrogen interms of black point reduction will result.
Cultivar variations in response to soil type, time ofsowing and nitrogen are evident. Figure 7.17 indicates theresponse to nitrogen is more evident at later sowings andwith higher nitrogen rates, where grain is generally smaller.
This fits well with an established relationship betweenlarger grain weight and increased levels of black point. It israre however, that a positive economic response of blackpoint to nitrogen will be observed.
Seeding rateInitial seeding rate trials indicated changes in black
point incidence are likely to be highly dependent oncultivar, with a positive response more likely at highseeding rates for some cultivars. The thicker canopyassociated with increasing plant density may create a morefavourable environment for the occurrence of blackpointwith higher relative humidity and slower dryingconditions. Alternatively, the influence of seeding rate andplant density may lie in the production of less tillers andconsequently larger grain size.
The influence of seeding rate on black point incidenceis evident in Figure 7.18, incidence increasing between 90kg/ha and 110 kg/ha for the cultivar Machete, whilstEradu showed no significant response. Interestingly, a
CHAPTER 7 – CROP MANAGEMENT THE WHEAT BOOK
154
MANAGEMENT TO IMPROVE WHEAT QUALITY (continued)
0
0 25 50 75 100
5
10
15
20
Bla
ck p
oint
(%
)
Nitorgen Applied (kg/ha)
TOS1
TOS2
Figure 7.17
Black point response to nitrogen at different times of sowing, xsites.
030 50 70 90 110
5
10
15
20
Bla
ck p
oint
(%
)
Seeding Rate(kg/ha)
EraduMachete
Figure 7.18
The effect of increasing seeding rate on black point in wheat

black point incidence was found to be attributable tocultivar, the number of rain days, average daily temperatureand flowering date. Currently, the most susceptible growthstage for the development of black point has beenidentified as approximately four weeks after flowering(Figure 7.19), though grain is susceptible throughout mostof its grain filling and ripening cycle.
The influence of drying winds is also likely to besignificant. Late rains are less likely to increase black pointdamage significantly as grain susceptibility appears todecrease at lower grain moisture content.
THE WHEAT BOOK CHAPTER 7 – CROP MANAGEMENT
155
MANAGEMENT TO IMPROVE WHEAT QUALITY (continued)
4
8
8
10
0 2 4 6 8
Bla
ck p
oint
(%
)
Time of irrigation application (weekly from anthesis)
Figure 7.19
Average black point levels for Eradu wheat irrigated from anthesisfor 6 weeks (total irrigation applied 16mm) in 1996 and 1997

Armstrong (1999) Minimising the risks for very earlysown Wheat Crops in Western Australia. A technicalreport on research conducted 1994-1998. AgricultureWestern Australia Miscellaneous Publications No.
Collins M. (1998) Marginal moisture seeding in“Highlights of Cereal Research and Development inWestern Australia 1998”, paper presented at RendezvousObservation City Western Australia 18-20 February 1998.
Doyle, A.D. and Marcellos, H. (1974). Time of sowingand wheat yield in northern New South Wales. Aust. J. Exp.Agric. & Anim. Hus. 14: 93-102.
Edward, A.Y. (Ed) (1998) Dealing with Frost.Agriculture Western Australia and Falconer Hackett. 44pp
Fee C. (1997) Crop management systems to improvethe competitiveness of wheat against weeds and reduce thereliance on herbicides. Grains Research and DevelopmentCorporation Final Report on Project DAW363W.
Fischer, R.A. (1979). Growth and water limitations todryland wheat yield in Australia. A physiologicalframework. J. Aust. Inst. Agric. Sci. 45: 83-100.
Heinrich A. (1992) Systems for very early sown wheatin the central wheatbelt of Western Australia. GrainsResearch and Development Corporation Final Report onProject DAW 11W.
Kohn, G.D. and Storrier, R.R. (1970). Time of sowingand wheat production in southern New South Wales. Aust. J.Exp. Agric. & Anim. Husb. 10: 604-09.
Loss, S.P., Kirby, E.J.M., Siddique, K.H.M., and Perry,M.W. (1989). Grain growth and development of old andmodern Australian wheats. Field Crops Res. 21: 131-46.
Loss, S.P., Perry, M.W., and Anderson, W.K. (1989).Flowering times of wheats in south-western Australia: Amodelling approach. Aust. J. Agric. Res. 41: 213-23
Perry, M.W., Anderson W.K. and Delane R. (1989)Early sowing - one key to improved yield of cereal crops. J.Agric., West Aust. 30 (1): 26-29.
White, C.A. (1999) Cereals - Frost Identification Guide.Agriculture Western Australia.
CHAPTER 7 – CROP MANAGEMENT THE WHEAT BOOK
156
REFERENCES

THE WHEAT BOOK CHAPTER 7 – CROP MANAGEMENT
157
MANAGING FROST RISK TO MAXIMISE CEREAL YIELDS INWESTERN AUSTRALIA
IntroductionSpring radiation frosts have been an irregular, but
spectacular cause of crop loss in Western Australia, withmany growers suffering some loss of income from frostdamage every year in susceptible areas. Advances incropping technology during the 1980s and 1990’s haveincreased the industry’s exposure to spring frosts. Thesechanges are:
i) greater emphasis on continuous croppingresulting from good wheat prices and low woolvalue,
ii) release and widespread adoption of earlyflowering wheat varieties,
iii) emphasis on early sowing of cereals to maximiseyield potential, and
iv) improved technical ability to sow early (i.e directdrilling, herbicides and larger machinery).
Severe and widespread frost damage wasexperienced over large areas of the Great Southern andEastern wheatbelt in 1998. Other serious andwidespread frost events also occurred in 1981 and 1985and 1994 with smaller areas of damage in 1977, 1979,1980, 1982, 1984 and 1988. The severe frosts inSeptember 1998 reduced the state’s wheat yield by anestimated 1 million tonnes. It is estimated that in thelast decade frost has cost Western Australia’s wheatindustry an average of about $1.2 million per year inactual damage to crops. As a result of these damagingfrosts, some farmers in susceptible districts are reluctantto sow crops early, even though yield advantages fromearly sowing are achievable. Consideration must begiven to frost risk management over the whole propertywith special emphasis on managing areas that areconsistently frost affected.
Climatology of Frost
Radiation FrostRadiation frosts usually occur on clear and calm nights
when heat from the crop surface flows (radiates) back tothe sky at night. The synoptic situation that mostcommonly leads to these conditions is shown in Figure 1.7Chapter 1.
The synoptic situation shows a cold front passingover the South West of Western Australia bringing coldand wet conditions with very little heat input from thesun during the cold and cloudy day. A high pressuresystem follows, allowing the influx of cold S-SWairstreams and rapidly clearing conditions. Very lowdaytime temperatures coupled with a clear and calmnight results in very high heat flow back to the sky andultimately frost.
Landscape EffectsAs warm air rises, it is replaced by cooler air. This cool
air will flow downslope. This is known as “Katabatic” air
flow (or “Katabatic wind,”) and is the reason why theseverity of frost damage from radiation frost is usually morein low lying areas. Cold air can collect against mid-slopebarriers (trees and fences) which can also lead to localisedfrosts in these areas.
Standard Temperature MeasurementThe Bureau of Meteorology standard for temperature
measurement is the temperature measured inside a screen(white louvered box or shelter) at 1.3 metres above theground. This is the “screen air temperature” and is whatyou will see quoted in the media. Standardisation oftemperature measurement is extremely important as itallows accurate comparisons to be made between locations.
It is very difficult to define a relationship between thescreen air temperature and temperature within the crop, asmany microclimatic factors are involved. An approximaterule of thumb is that crop temperature will usually be2-3˚C below the screen air temperature. With this ruleof thumb in mind, a frost on the ground is defined as whenthe screen air temperature has reached +2.2˚C or below.
The temperatures referred to in the remainder of thischapter are crop temperatures, unless stated otherwise.
Crop development and frost damageFrost damage results from a complicated interaction
between the environment and the plant. Soil type, soilmoisture content, cloud cover, daytime temperature, windspeed, humidity, position in landscape, crop species, cropnutrition, crop density and crop moisture status all influencethe occurrence of frost and the resulting level of crop injury.Of particular importance is how the crop’s tolerance to frostchanges with its stage of development (Table 7.12).
Pre Stem Elongation During seedling growth and tillering the apical
meristem (growing point) of cereals remains below the soilsurface, insulating it from freezing temperatures. Providedthe soil remains unfrozen, crop temperatures above -8˚Crarely kill the meristem of the plant, and although theleaves may be severely blighted, the apical meristem willcontinue to produce new leaves and tillers. Leaves becomefrozen at crop temperatures below about -2˚C and appearwater soaked and wilted. Several days after the damage hasoccurred they dry out and become a brown, hay colour.Damage at this stage usually goes unnoticed and hasminimal impact on crop yield.
Stem ElongationDuring stem elongation and booting the meristem
grows away from the protection of the soil, towards the topof the canopy. Crop temperatures need to fall to -4˚C orbelow to freeze stems or heads during these stages ofdevelopment. Partial freezing of the nodes of the stem andthe developing ear can distort subsequent growth of thesetissues which is easily mistaken for damage caused by

CHAPTER 7 – CROP MANAGEMENT THE WHEAT BOOK
158
MANAGING FROST RISK TO MAXIMISE CEREAL YIELDS INWESTERN AUSTRALIA (continued)
October 23 whereas at Merredin, the 30% risk occurs afterSeptember 15. The region of greatest frost risk isapproximately between York, Corrigin and Katanning(Fig. 7.13).
Table 7.12 – The dates after which the risk of a damaging frost is equal to 1 in 10, 5 and 3.3 years at various locationsin the W.A.estern Australian wheatbelt. Also indicated are the estimated critical temperatures for each MET station.
Frost Risk
Critical Temp. 10 % 20 % 30 %Frequency (˚C) 1:10 years 1:5 years 1:3.3 years
Location
Bridgetown 1.0 Nov 3 Oct 29 Oct 23
Kojonup 1.5 Nov 1 Oct 23 Oct 17
Wagin 1.5 Nov 1 Oct 28 Oct 16
Salmon Gums 0.5 Oct 27 Oct 21 Oct 13
Pingelly 2.0 Oct 25 Oct 19 Oct 11
Brookton 1.0 Oct 27 Oct 17 Oct 10
Katanning 2.0 Oct 24 Oct 17 Oct 9
Corrigin 1.5 Oct 28 Oct 13 Oct 7
Beverley 0.5 Oct 25 Oct 16 Oct 6
Goomalling 1.5 Oct 21 Oct 13 Oct 5
Kondinin -0.5 Oct 17 Oct 8 Oct 1
York 1.5 Oct 17 Oct 7 Sep 30
Collie 1.0 Oct 13 Oct 4 Sep 29
Lake Grace 2.0 Oct 13 Oct 5 Sep 28
Mount Barker 3.0 Oct 13 Oct 5 Sep 28
Narrogin 2.0 Oct 12 Oct 4 Sep 28
Wongan 2.0 Oct 17 Oct 6 Sep 28
Northam 2.0 Oct 8 Sep 30 Sep 24
Hyden 0.0 Sep 28 Sep 22 Sep 19
Cunderdin 2.5 Sep 27 Sep 23 Sep 17
Kellerberrin 1.5 Sep 25 Sep 20 Sep 16
Narembeen 1.0 Sep 28 Sep 21 Sep 16
Bencubbin 1.0 Oct 9 Sep 25 Sep 16
Merredin 0.5 Sep 30 Sep 21 Sep 15
Southern Cross 0.0 Oct 3 Sep 11 Aug 31
Wandering(Avg) 0.0 Oct 29 Oct 21 Oct 15
Wand.(Ridge) -2.0 Sep 22 Sep 15 Sep 2
Wand.(Val.Flr) 2.0 Nov 22 Nov 16 Nov 11
There are considerable differences in the risks betweenregions, however at most locations, the risks were small bylate October (Table 1). At Bridgetown there is a 30% risk(i.e. 1 year in 3.3) of a damaging frost occurring after

THE WHEAT BOOK CHAPTER 7 – CROP MANAGEMENT
159
MANAGING FROST RISK TO MAXIMISE CEREAL YIELDS INWESTERN AUSTRALIA (continued)
hormonal herbicides, nutrient deficiency, disease ormoisture stress. Blistering and cracking of the stem as aresult of freezing may also restrict the translocation ofphotosynthates to the developing ear.
Post Ear EmergenceWheat plants are most susceptible to frost injury after
ear emergence and at flowering when the ear andsensitive reproductive structures are directly exposed tothe surrounding air. Frost damage can occur at any timefrom ear emergence to the hard dough stage. In theWestern Australian wheatbelt these stages ofdevelopment often coincide with damagingtemperatures in September and October, usually onclear, still nights after a cold front passed across thesouth-west of the state. When a damaging frost occurswithin a week after ear emergence, stems, florets withinears or whole ears are often visibly blighted.Alternatively, only the reproductive parts may bedamaged, and although they may appear unaffected,they produce no grain. Damage after flowering usuallyresults in pinched or destroyed grain, either from stemdamage or direct damage to the developing grain.Similar symptoms also occur with copper deficiency,root disease or moisture stress, however unlike frostdamage, these symptoms damage all ears and usuallyfollow soil type.
Assessing frost damageIf frost damagee is suspected, timely identification
of symptoms and estimates of the degree of damage willhelp decide whether the crop should be left to harvest,or other measures should be implemented to salvagethe crop. Possible salvage measures include; cutting forhay, cultivating the crop into the soil, grazing orspraying. Each of these options has its merits anddrawbacks and will depend very much on theindividual situation. (see “Dealing with Frost” in theFurther reading section).
Important points to consider when assessing frostdamage:• Damage is likely to be sporadic within a paddock and
the overall loss will be very difficult to assess. • Damage can occur at any time between booting and
hard dough therefore crops should be inspectedbetween booting and late grain fill stages when screenair temperature falls below 2˚C at the nearest Bureau ofMeteorology (MET) station.
• Check low lying and natural drainage areas first, lightcoloured soil types, and areas with a history of frostdamage.
• Peel back leaves and open the florets to check forstem and head damage (See Plates/Fig/Frost IDGuide****.)
• Tag five to ten ears with ribbon or plastic strips. Note
the stage of growth and return every 2 days or so tocheck if grain growth has ceased or not.
• Some compensatory growth often occurs in theunaffected grains and often higher grain yields areachieved than first estimated.
Analysis of frost riskIn order to manage frost risks to maximise cereal yields,
we need to have some knowledge of what the risks are inWestern Australia. Frost risks vary between farms anddistricts or regions.
Regional Frost RisksThe difficulty in analysing frost risks from Bureau
of Meteorology data is that there is a variable differencein the temperatures recorded by MET stations and thetemperatures experienced by crops in paddocks asdiscussed earlier. The low spatial density of officialMET stations is also a factor. In order to account forthis variation, an attempt was made to calibrate thetemperature readings recorded at MET stations toobserved frost damage to cereal crops in thesurrounding districts (Loss & Perry, 1988). Dates whenfrost caused damage to cereal crops were obtained fromfarming communities and for each report theminimum temperature recorded at the nearest METstation was examined and the average criticaltemperature was calculated for each MET station. Therisk of temperatures less than the average criticaltemperature (i.e. a potential damaging frost) wasdetermined for various times of the year usinghistorical data from the Bureau of Meteorology. Theserisks are presented in Table 7.12 for each station, inorder of risk.
Fig. 7.13
Risk of frost injury across the wheatbelt.

CHAPTER 7 – CROP MANAGEMENT THE WHEAT BOOK
160
MANAGING FROST RISK TO MAXIMISE CEREAL YIELDS INWESTERN AUSTRALIA (continued)
by most farmers, since the calibration method was basedon farmer reports of frost damage.
Managing frost riskThere are many methods employed by intensive crop
industry to minimize frost damage, however none areeconomical for broad acre crops., In individual years onindividual farms frost damage can have devastating effectson production and income. The level of risk a farmerwishes to take is a personal decision and he or she may feelmore comfortable accepting a low frost risk, knowing thatthe return will be more stable even though it may not bemaximised in the long term.
Time of FloweringAt present, the main method of reducing the amount
of frost damage in wheat crops is to manipulate the crop’stime of sowing and development so that flowering isdelayed to a time of low frost risk. Studies have shown thatthe total elimination of frost damage by delaying sowingand hence flowering, will not result in maximum long termyields because of the irregular incidence of frosts and moreregular incidence of dry conditions during grain fill. Forexample, a farmer may produce higher long term yields onmost parts of the farm by sowing early, even though 1 yearin 10, frost will destroy the whole crop.
Many studies in Southern Australia have demonstratedhow yields decline at approximately 1% for each day delayin flowering, past an optimum date and this can beattributed to less efficient water use during the vegetativestages of growth and increased high temperature andmoisture stress during grain filling (Doyle and Marcellos,1974; Fischer, 1979; Kohn and Storrier, 1970, Perry et al.,1989).
If we consider a wheat crop sown at the averageposition in the landscape at Corrigin which emerges fromthe boot on October 7, the risk of a damaging frostoccurring after this date is 30% or 1 in 3.3 years. If thecrop was sown later and emerges from the boot on October13, then the frost risk is reduced by 10%. If we assume adamaging frost reduces the yield of the crop by 50%, thenthe crop sown earlier will yield 5% less than the later sowncrop because of greater frost damage. However the laterflowering crop is likely to incur a yield penalty of 6% (i.e.1% per day delayed flowering). The results of this type ofreasoning give similar results at other sites.
Row Spacing and plant densityCurrent frost research work in Western Australia
indicates that adopting wide row spacings in frostsusceptible areas results in warmer crop canopytemperatures, reduce the level of frost damage occurring inthe crop. Heat energy flow is the mechanism believed to beinvolved. The work is continuing on a range of soil typesand tillage systems.
Frost Risks Within RegionsFrost risks can vary as much within regions as between
regions, largely due to the effect of landscape and cropfactors. During radiation frosts, dense cold air tends tomove in the natural drainage lines to the lowest points thelandscape. The regional analysis of frost risk can also beused to gauge the effect of position in landscape on the riskof damaging temperatures. At Wandering, temperaturedifferences of 4.0˚C have been recorded between a ridgeand valley floor, about 400m apart. If we consider thecritical temperature for the ridge to be 2.0˚C and -2.0˚Cfor the valley, the risks are changed quite dramatically(Table 7.12). Figure 7.14 illustrates how at Wandering, therisks can change between the average position in thelandscape and a valley floor. In contrast, the risks at a ridgemuch smaller, however crop factors and soil type can a havedramatic impact on risk in these areas.
Limitations of analysesThe calculated frost risks have some limitations. It
appears the calibration method was more accurate forsome stations than for others. One may have expectedthat the risks at Narrogin to be more similar to those atPingelly and Corrigin, which is not the case with theestimated frost risks (Table 7.12). Also the risks atSalmon Gums and Wongan Hills appear to have beenover estimated. All MET stations analysed had between29 and 16 years of temperature data. In cases where thetemperature records were short and only one day in amonth was recorded less than the critical temperature forthe station, an inaccurate reading could cause an error ofbetween 5 and 10 %. Also the analysis gives an estimateof the risk of a damaging frost but the extent of thedamage caused by the frost is not defined. The level ofdamage can only be assumed to be at least that detected
Fig. 7.14
How position in the landscape influences air temperature.

THE WHEAT BOOK CHAPTER 7 – CROP MANAGEMENT
161
MANAGING FROST RISK TO MAXIMISE CEREAL YIELDS INWESTERN AUSTRALIA (continued)
Management of paddocks according to risk andposition in the landscape
The analysis of frost risk indicates the importance ofthe effect of landscape on the risk of frost damage. Thehigh risk regions of the Western Australian wheatbelt alsohave undulating landscapes which magnify the risks.Farmers in these regions usually have some knowledge ofthe frost risks of their paddocks and they sometimes sowridges and other low risk sites before progressing topaddocks lower in the landscape. The use of satellites andGPS technology is being investigated in the current frostproject, to aid in accurate identification of susceptible siteson individual farms.
Choice of Crop and VarietyIt is generally accepted that oats are much more
tolerant of frost damage than barley, and that barley isslightly more tolerant than wheat. Research in NSW andQueensland suggests that the critical crop temperature forsevere yield loss in wheat is about -3.8˚C, and for barley, -4.5˚C. Sowing oats in high risk parts of the landscape isone method adopted to minimize frost damage. Wheatbreeders in N.S.W. and Qld have been breeding for frosttolerance for more than 25 years, however the difficultiesof the selection techniques have caused slow progress.Screening programs are continuing at present. There aredifferences in the patterns of grain growth of Australianwheats (Loss et al. 1989). It appears that late flowering isrelated to shorter more rapid grain growth which could beexploited to delay flowering without a reduction in yield.
Frosted crop salvage optionsIf frost damage is suspected, timely identification of
symptoms and estimates of the degree of damage will helpdecide whether the crop should be left to harvest, or othermeasures should be implemented to salvage the crop. Anycrop material that is not harvested will have to be removedprior to seeding the following season.
Harvesting the crop, although a heartbreaking task inmany cases, is still considered a good option, as it dealswith the crop in the usual way, utilising the machinery andskills already available. Any remaining grain fromcompensatory growth will also be collected.
The approach taken by an individual will depend on theindividual’s situation including; skill level and attitude torisk, availability of machinery, availability of markets, cost(monetary and time/labour) and the relative advantages anddisadvantages of the options available at the time.
Cutting Crops for HayOversupply of hay is usually a problem when large
areas of crops or districts are affected by frost. Cuttingcrops for hay is therefore only an option if the hay can beused on farm or a market contract is available.
Other important factors to consider are:
Assess paddocks carefully for the level of damage andlikelihood of recovery. Only a proportion of the paddockmay be so severely affected to warrant cutting it down.
Cutting a crop for hay should be done as soon aspossible to prevent decrease in feed quality, but properassessments should be carried out to avoid rash decisionbeing made.
Is the appropriate machinery and labour available?
Silage
AdvantagesFrosted crops may be suitable for the production of
silage if they are still relatively green with plenty of leafmaterial. If so, the resultant feed may have a greater nutritivevalue than if the crop were cut for hay. Producing silage willensure that stubble is managed in readiness for next season.If weeds have not set seed this option helps reduce the weedburden in the paddock. This option is especially viablewhere the grower is equipped to produce silage.
DisadvantagesCereals, especially wheat, produce poor quality silage
when compared to other crops. If the skills and machineryrequired are not readily available then the production ofsilage becomes expensive. Another point to consider is theharvesting of nutrients associated with silage productionwhen compared to other options such as green manuringand some cutting/grazing options.
Cutting operations
AdvantagesSwathing/cutting can preserve some of the nutritive
value of the crop without the expense associated withapplying desiccant herbicides. Cutting retains nutrientseither through fodder conservation or recycling of plantmaterial. This option also has a weed control benefit.Due to the remaining stubble after cutting, this option,when compared to green manuring, is especially suitedto lighter textured soils where erosion can pose aproblem. Once cut down the crop can be grazed or leftto degrade. Degradation and return of nutrients to thesoil will be more rapid if the plant material is reduced tothe smallest possible size (whilst keeping in mind thatsome stubble should be retained on erosion prone soils).Burning of stubble is not recommended due to the lossof organic matter and nutrient while also leaving soilssusceptible to erosion. However, if necessary,windrowing makes a night burn possible in situationswhere the paddock must be managed to suit availablemachinery for next season’s seeding operation. Cuttingcan be performed with harvesting machines, slashers andwindrowers. Harvesters and windrowers have theadvantage of performing the cutting operation muchquicker than slashers. All cutting operations should be

the soil. Aim to leave around 40% of the plant materialon the surface if performing this operation. Thissurface material acts as mulch, retaining soil and plantmoisture. This results in a more rapid and efficientbreakdown of buried plant material through microbialdegradation. Green manuring should be performed assoon as possible in order to initiate the degradationprocess when the plant material still containsmaximum moisture.
DisadvantagesGreen manuring is not a viable proposition on light
textured soils as erosion may result and leaching of therecycled nutrients is likely in the event of summer rain. Theavailability of suitable machinery to undertake thisoperation may also pose a problem to some growers. It isimportant that straw is reduced to a suitable size not hinderthe seeding operation next season.
Standing crops
AdvantagesLeaving a crop standing may be viable when going into
pasture next season or where agistment opportunity arises.If the standing crop is to be grazed, the appropriatenumber of sheep per unit area must be considered. Moredry sheep equivalents are required to graze a standing cropthan pasture.
DisadvantagesGrazing standing crops may result in scouring and
other problems in sheep. If a crop is left standing then thedry matter must be dealt with before a sowing operationnext season.
BurningBurning is a cheap and easy method to remove the
straw for planting of next year’s crop. It may also providesome weed control especially if burnt after the break of theseason. However, with large amounts of bulk the potentialfire hazard is a problem. Burning will result in nutrient andorganic matter loss. Wind erosion before and after cropestablishment will increase with no groundcover.
CHAPTER 7 – CROP MANAGEMENT THE WHEAT BOOK
162
MANAGING FROST RISK TO MAXIMISE CEREAL YIELDS INWESTERN AUSTRALIA (continued)
performed when plant material is still relatively green tostimulate more rapid degradation of plant material, trimherbicide resistant ryegrass before seed set (thereforeswath, slash or harvest as low as possible) and to reducethe fire hazard.
DisadvantagesThere are a couple of points worth considering when
swathing and slashing. There is an accumulation ofnutrients in strips through the paddock that results froma swathing operation, and the continued growth of thinstrips of crop occurs when machinery tyres lay plants flatso they are not incised by slashing equipment. Cuttingmay also result in long straw that hinders seeding nextseason.
Desiccation and hay freezing
AdvantagesThe use of herbicides to halt crop development allows
large areas to be treated in a relatively short period of timeand retains the nutritive value of the crop for grazing. Thisnutritive value can be maintained for up to three months,depending on seasonal conditions. This not only facilitatesfodder conservation but hay-making operations can takesecond precedence over other operations if the crop is to becut for hay. Treatment with a desiccant halts cropdevelopment promptly. Therefore, the feed quality of theplant shoots is maintained. Herbicide resistant weeds canalso be controlled, reducing the requirement for weedcontrol next season.
DisadvantagesDespite the grazing benefits, hay freezing is expensive.
The possible benefit from using this option must beweighed up against the cost. This option also results in astubble management issue that will need to be addressedbefore next season.
Green manuring
AdvantagesReturning plant material to the soil facilitates the
retention of the nutritive value of the crop, reducingthe requirement for fertiliser and trace elements nextseason. Nitrogen and organic matter will increase soilfertility and soil structure respectively. A wheat cropyielding 3 t/ha contains around 30-40kg/ha ofnitrogen. The amount of nitrogen that will be returnedto the soil can be estimated based on an estimation ofcrop yield before frost damage occurred. Pulse cropscontain more nitrogen per unit dry matter than cereals,therefore, the resultant benefit from green manuringpulse crops is greater. Green manuring can beperformed with offset disks or scalloped disc harrows.It is important that not all plant material is turned into
THE WHEAT BOOK CHAPTER 7 – CROP MANAGEMENT
163
FURTHER READING
White, C.A. (1999) Cereals - Frost IdentificationGuide. Agriculture Western Australia.
White, C.A. (1997) Identifying and Assessing FrostDamage in Crops. B&W brochure. Agriculture WesternAustralia
Edward, A.Y. (Ed) (1998) Dealing with Frost.Agriculture Western Australia and Falconer Hackett. 44pp
Loss, S.P. (1989). Frost injury to wheat. J. Agric., WestAust. 30 (1): 32-4.
Loss, S.P. (1987). Factors affecting frost damage towheat in Western Australia. Technical Report No. 6.Division of Plant Research.W.A. Dept. Agric.
Single, W.V. (1984). Frost injury and the physiology ofthe wheat plant. J. Aust. Inst. Agric. Sci. 51: 128-34.
Internet siteshttp://www.agric.wa.gov.au/progserv/plants/agronomy/http://www.agric.wa.gov.au/cvt/ecvsg99/frost.htmlhttp:/www.agric.wa.gov.au/cropupdates/1999/cereals/
White.htm

CHAPTER 7 – CROP MANAGEMENT THE WHEAT BOOK
164

Chapter Coordinator: G.B. CrosbieAuthors: G.B. Crosbie and W.J. Lambe
Quality assessment ........................................................................................168Test weight ..........................................................................................................168Screenings ..........................................................................................................168Falling Number ..................................................................................................168Black point ..........................................................................................................168Moisture content ................................................................................................168Protein content ..................................................................................................168Grain hardness ....................................................................................................169Milling quality ....................................................................................................169Dough properties ................................................................................................169Starch quality ......................................................................................................169
Quality requirements for various end-uses ..................................................170
Wheat quality trends in Western Australia ..................................................171Development of new wheat grades ....................................................................171Development of Australian Soft and Australian Hard grades ............................171Development of a noodle wheat segregation ......................................................171
Blackpoint ....................................................................................................172
On-Farm quality assurance ..........................................................................173
References ......................................................................................................174
THE WHEAT BOOK CHAPTER 8 – WHEAT QUALITY AND THE USES OF WESTERN AUSTRALIAN WHEAT
165
CHAPTER EIGHT
WHEAT QUALITY AND THE USES OFWESTERN AUSTRALIAN WHEAT

CHAPTER 8 – WHEAT QUALITY AND THE USES OF WESTERN AUSTRALIAN WHEAT THE WHEAT BOOK
166

Graham Crosbie and Bill LambeThe importance of quality in relation to wheat has been
emphasized to growers in many changes that have takenplace in the Western Australian wheat industry since theearly 1970s.
Up to that time, Western Australian wheat had beenreceived and marketed principally as FAQ (Fair AverageQuality), the forerunner to the present Australian StandardWhite (ASW) (WA) grade.
Consideration of wheat quality had been mainly inrelation to suitability for bread manufacture, and newvarieties were assessed only for this end-product.
Recognition of Western Australia’s potential to produceother wheat quality types led to the development of gradesof Australian Soft (A. Soft) and Australian Hard (A. Hard)during the 1970s.
Improvement in the quality of ASW wheat resultedfrom the Australia-wide introduction of varietal control in1980/81. In 1989/90, a special segregation of wheat forJapanese-style white noodles was started in this State.
These new initiatives have combined to give anincreased emphasis to quality in the development of newvarieties, to ensure their suitability for an expanded rangeof products in overseas markets. This range of productsincludes various pan and flat breads, steamed bread,noodles, biscuits and cakes. An important local end-use ofwheat is in the manufacture of gluten and starch.
THE WHEAT BOOK CHAPTER 8 – WHEAT QUALITY AND THE USES OF WESTERN AUSTRALIAN WHEAT
167
WHEAT QUALITY AND THE USES OF WESTERN AUSTRALIANWHEAT

Many factors contribute to variation in quality amongdifferent loads of wheat. Quality potential is largelydetermined by the variety, but the extent to which thispotential is achieved depends upon factors such as seasonalconditions, soil type and management practices.
In wheat breeding, considerable attention is given toimproving the quality of varieties. Here qualitycharacteristics such as grain hardness, grain size, milling,dough properties, and starch quality are important. Inmore recent times, additional varietal improvement hasbeen sought in relation to reduced levels of black point andlate-maturity alpha amylase.
At the time of receival, quality tests are carried out tomeasure characteristics that that are influenced mainly bythe environment and grower practices – these include testweight, screenings, moisture content and protein content.Loads are also examined for the presence of stained andsprouted grain and insects.
The significance of some of the more important qualitytests is as follows:
Test weightTest weight is a measurement of the bulk density of the
grain, expressed as kilograms per hectolitre, and gives aquick guide to the extent of grain filling and its potentialsuitability for milling to produce flour. The current receivalstandard for ASW and other milling grades is 74 kg perhectolitre.
Screenings The screenings level is a measure of the amount of
material which would be lost in the cleaning process priorto flour milling. The maximum level of screenings forASW, Australian Premium White (APW), A. Soft and A.Hard is 5% by weight. Pinched grain due to a dry season,frost or disease will give higher levels of screenings. Varietieswith inherently narrower grain may also give higherscreenings in adverse seasons. Other contributors toscreenings can include broken grain and foreign seed.
Falling NumberThe Falling No is a measure of the amount of the
enzyme alpha-amylase in the grain. High levels of alpha-amylase can be present due to sprouting or a conditionknown as late maturity alpha-amylase. The lower theFalling Number value, the higher the amount of alpha-amylase. High levels of alpha-amylase are detrimental tosome end-products. Falling Number values of 300 or moreare required for the main milling grades.
Black pointBlack point is seen as undesirable by many wheat
buyers who will not pay a premium for severely affectedgrain. During the milling of wheat to produce white flour,the aim is to minimise the extent of bran contamination inthe flour. With black point affected wheat, a very small
fraction of the blackened bran carries through into theflour. This becomes most apparent in products such asnoodles and steamed buns.
Some varieties, such as Eradu and Westonia, are moresusceptible to black point than others and should beavoided in high risk areas.
Moisture contentMoisture content is seldom a problem for Western
Australian wheat growers as hot, dry harvesting weatherusually ensures that grain is delivered at well below themaximum 12% moisture content. In some years, summershowers and high humidity have combined to delayharvesting operations in south coastal areas.
Protein contentProtein content is an important factor in determining
suitability for most end-uses. It is the protein componentin flour that, when hydrated by the addition of water,forms a continuous network of gluten. This network ofgluten provides the structure to a loaf of bread, anddepending upon the quality of the gluten, may have asubstantial effect on loaf volume. Similarly, gluten providesthe structure to strands of noodles, and the level of proteinin the original flour has a pronounced effect on the textureor mouthfeel of the noodles after cooking.
Protein level generally varies little between varieties butis greatly affected by seasonal effects, soil type, and variousmanagement practices.
State weighted average protein levels are normallywithin the range 9 to 11%, with lower levels in seasons ofhigher average yield. (Crosbie and Fisher, 1987). Inindividual paddocks in most seasons, protein levels mayvary substantially – in an experiment carried out in 1962at Merredin Research Station, a protein range of 7.1-17.6% was observed in one paddock (Parish, 1963). Thiswas associated mainly with differences in soil type and soilmoisture level.
In general, higher grain protein levels occur in northernand north-eastern areas of the wheatbelt, where there is lessrainfall and a shorter growing season; also in the morefertile, lower rainfall area north of Esperance. Lowerprotein levels are found in wheat grown in southern andwestern areas, consistent with a longer growing season andhigher rainfall. (Crosbie and Fisher, 1987).
These protein patterns were key considerations indetermining the location of receival points where A. Hardand A. Soft grades were established in the 1970s.
Eligibility for receival into the special grades of A.Hard, A. Soft and Noodle wheat depend on individualloads meeting a minimum or maximum protein standardand being of an approved variety. For the Australian Hardgrade, individual loads must meet minimum standards of11.5% for AH1 and 13.0% for AH13. In regard toAustralian Soft receivals, a maximum of 9.5%% applies,with additional payments as the protein level declines to
CHAPTER 8 – WHEAT QUALITY AND THE USES OF WESTERN AUSTRALIAN WHEAT THE WHEAT BOOK
168
QUALITY ASSESSMENT

8.0%. In the ASW (Noodle) segregation, acceptancedepends upon protein levels being in the range 9.5-11.5%,but in some situations with “active stack management”deliveries as low as 9.0% or as high as 12.0% may beaccepted.
Grain hardnessGrain hardness is determined principally by variety. It
can be measured in many ways, such as by the coarsenessof wheatmeal or flour, by the ease with which outer layersof the grain can be removed by abrading, by the amount ofenergy required or noise emitted in grinding a given weightof sample, or by the amount of damage which occurs tostarch granules during flour milling.
A common method of measurement is the particle sizeindex test, which indicates the percentage of wheatmealpassing through a fine screen – typical values for soft-grained varieties are 26 to 30, whereas hard wheats givelower values, say 12 to 16.
Higher damaged starch levels, which occur in flourproduced from hard-grained varieties, result in higherwater absorption levels during dough mixing and increasedgassing power during dough fermentation in breadmaking.
Milling qualityBoth variety and the environment affect wheat milling
quality. High milling quality in wheat is indicated by ahigh yield of flour with minimal contamination by branparticles and free-flowing properties of the mill streamsduring the milling process. Bran contamination in theflour is indicated by poor colour grade and high ash levels,and mills normally have to conform to upper limitsspecified by end-users of the flour.
Dough propertiesApart from water absorption, the physical properties of
the dough are important for most end-products – theseproperties largely reflect those of the gluten or proteincomponent of the flour.
A common test applied in many cereal laboratories isthe extensograph test which measures the elastic andviscous properties of dough while being stretched – thesetwo properties are reported as resistance to extension(which is also a measure of dough strength) andextensibility of the dough, respectively. An adequatebalance between these two properties is needed for mostend-uses.
Starch quality Since the late 1970s, attention has been focused on
quality variation in the starch component of flour, and thishas been found to be of significance of certain products,particularly noodles. Critical factors influencing starchquality include the ratio of the key starch componentsamylose and amylopectin. Starch quality can be measured
in a number of ways, including the extent of swelling bystarch or flour when gelatinised or by paste viscosity tests.
THE WHEAT BOOK CHAPTER 8 – WHEAT QUALITY AND THE USES OF WESTERN AUSTRALIAN WHEAT
169
QUALITY ASSESSMENT (continued)

Good milling quality and soundness of the grain arecommon requirements for all end-uses. In regard to othercriteria however, specific qualities are needed for differentend-uses.
For loaf bread, hard wheat is generally preferred to givesufficient damaged starch levels to ensure adequate waterabsorption in the dough and a high moisture content inthe loaf, and to give good gassing power during doughfermentation. Loaf volume is increased with higher proteincontent, but only if combined with strong, extensibledough properties – these are needed for retention of carbondioxide and moisture vapour during fermentation andbaking, and to give a satisfactory crumb texture.
Flat bread is preferably made from a hard wheat, withmoderately high protein content, high water absorption,medium dough strength and adequate extensibility.
Steamed bread and buns are popular in many Asiancountries, and are made from flour milled from medium tomoderately high protein hard wheat or low protein softwheat according to type. Low levels of yellow pigment arerequired in the flour to produce a suitably white product.
Various qualities are needed for different types ofnoodles. The Japanese-style white salted noodle or udon,important to Western Australia wheat producers, requiresan essentially soft-grained wheat of about 10.5% protein,having moderately strong dough properties and starch withhigh swelling properties. Low ash level is a very importantconsideration in the manufacture of flour for noodles inJapan, particularly to ensure good noodle brightness.Moderate levels of yellow pigment in the flour are neededto give the desired creamy noodle colour. Generally higherwheat protein levels are needed for alkaline noodles –about 13.0% is needed for Japanese ramen and about11.5% for the Hokkien style noodle of S.E. Asia.
Low water absorption flour, made form low proteinsoft wheat, is preferred for the manufacture of sweetbiscuits. Weak, inelastic dough properties are also neededto allow the biscuit to spread sufficiently during baking.Cake flours are also made from this type of wheat, usuallyfrom selected high quality flour streams, and may includea chlorination treatment.
CHAPTER 8 – WHEAT QUALITY AND THE USES OF WESTERN AUSTRALIAN WHEAT THE WHEAT BOOK
170
QUALITY REQUIREMENTS FOR VARIOUS END-USES

Until the 1950s, most of the wheat varieties grown inWestern Australia were soft-grained and had weak doughproperties. This wheat was received into only one millinggrade – Fair Average Quality (FAQ). The emergence of thehard wheat Gabo in the 1950s had a substantial effect inincreasing the hardness, dough strength and breadmakingquality of Western Australian FAQ. (Crosbie, 1988).
Gabo’s effect was partially offset by Insignia, alsopopular at this time, which was cast more in the mould ofthe earlier weak, soft-grained wheats such as Nabawa andBencubbin.
Following the rust epidemic of 1963, there was a rapidgrowth in popularity of Gamenya, which proved so welladapted that it was the leading variety in Western Australiafor 21 years from 1965/66 to 1985/86. Gamenya wasunique in combining the soft grain character withmoderately high dough strength, which assisted inmaintaining the quality of FAQ.
Development of new wheat gradesAfter the introduction of Gamenya, a wider range of
quality types was sought. This was in response to animproved understanding of market requirements and therecognition of new opportunities for the marketing ofWestern Australian wheat. Important developments in the1970s were the breeding of Tincurrin wheat and theintroduction of the A. Soft grade, allowing new markets tobe developed in Malaysia and South Korea. Other keydevelopments in the 1970s were the breeding of Maddenwheat and the development of the A. Hard grade. Theintroduction of a separate noodle wheat segregation in1989/90 and the release of the noodle variety Cadoux in1992 were other important milestones.
Development of Australian Soft andAustralian Hard grades
The segregation of A. Soft was intially based on thevariety Egret, but quickly switched to Tincurrin followingthe release of this high yielding variety in 1978 (Reeves etal 1978). Since then, newer varieties such as Corrgin andDatatine have contributed to this grade.
The A. Hard segregation was based initially on thevarieties Gamenya and Falcon, but neither of these varietieshas the quality now required for this grade. Significantvarieties of higher milling quality and with a more suitablecombination of grain hardness and dough strength wereMadden (released in 1974), Bodallin (1982), Gutha(1983) and Wilgoyne (1989). More recent releases includeAmery (1993), Cascades (1994), Carnamah (1996) andKalannie (1996).
Development of a noodle wheatsegregation
During the 1970s, ASW wheat from Western Australiabecame recognised as having excellent quality for Japanese
white salted noodles or udon. This largely reflected thestarch quality of Gamenya, the leading variety in WesternAustralia from 1965 to 1985 (Crosbie et al 1990). Whileproduction levels of Gamenya in Western Australiaremained high, so did the quality of ASW for udon.However, during the 1980s there was a marked change inthe quality of the ASW mix, as growers replaced Gamenyawith higher yielding varieties which, although suitable forother end-uses, were of poor quality for noodles. This waspartly offset by the emergence of Eradu, a variety of similarquality to Gamenya. By 1988/89, the combined sowing ofGamenya and Eradu had dropped to an alarming level,representing only 17% of the total wheat area – this wasdown from 44% in 1983/84 (Crosbie, 1990). This hadmade it increasingly difficult to ensure sufficient levels ofthese key varieties in shipments to Japan. It had alsobecome difficult to meet the protein requirement of theJapanese market – 10.5% – because there were fewerreceival points with sufficient Gamenya and Eradu fromwhich to select.
Following considerable industry debate, a segregationbased on the varieties Gamenya and Eradu wascommenced in 1989/90. This concentrated the dwindlingsupplies of these key varieties which ensured an adequatepercentage of these wheats in shipments to Japan. Theintroduction of separate pooling for noodle wheat in1992/93 provided market-based premiums which helpedto offset the differential in yield between noodle wheat andalternative varieties. This also provided much needed timeto develop higher yielding noodle wheat varieties to enablegrowers to take full advantage of Western Australia’s marketlead in the production of this wheat type.
Noodle research at Agriculture Western Australiaproved vital in the development of new noodle wheatvarieties Cadoux in 1992, and Arrino and Calingiri in1997 (Crosbie, 1997). The research included:
The introduction of a visiting experts programinvolving Japanese noodle technologists Recognition of the importance of starch swellingproperties on noodle texture and the development ofthe Flour Swelling Volume test at Agriculture WesternAustralia, for use in selecting for starch quality in earlygeneration breeding lines (Crosbie, 1991; Crosbie et al,1992; Crosbie and Lambe, 1993).Recognition of substantial variation in noodle colourstability among Australia wheat varieties (Crosbie et al,1994). This lead to the development of rapid screeningtests and incorporation of improved colour stability innew varieties.
THE WHEAT BOOK CHAPTER 8 – WHEAT QUALITY AND THE USES OF WESTERN AUSTRALIAN WHEAT
171
WHEAT QUALITY TRENDS IN WESTERN AUSTRALIA

Fran HoyleBlack Point is identified primarily as a dark
discolouration of the surface tissue located at thegermination-end of wheat (Figure 8.1), but may range inextent and severity depending on cultivar and season. Earlyresearch associated symptoms with the presence andsubsequent infection of grain by field fungi (Alternariaspp.), during normal development and maturation. Recentstudies however, have been unable to provide conclusiveevidence in the implication of fungi, the development ofblack point largely affected by environment (see Chapter 7).
The presence of this grain disorder is normally notobserved during plant growth, but is only apparent oncegrain is harvested. It affects only the appearance of thegrain and is not associated with other leaf or root diseases.Receival standards currently allow a maximum 5% of‘stained or black pointed’ grain in premium segregation’s,or 25 grains per 500 grain sample.
Figure 8.1 – Sympomatic expression of black point inwheat
Seed QualityGrain affected by black point has commonly been
associated with a reduction in the germination capacityand vigor of grain used for seed, where pathogenic fungiare present. In Western Australia, black point does notusually have any significant detrimental effects on seedgermination or emergence, and does not appear to increasein stored grain under optimal storage conditions. Seedgermination may be lower where severe symptoms areexpressed, and germination tests are recommended prior tostorage and seeding, where rates may be adjusted ifrequired.
Grain QualityThe inherent quality of wheat grain associated with
black point is observed to be largely confined to adiscolouration of the grain and is not normally associatedwith reductions in flour quality, grain protein or viability.Grain quality is only slightly affected, marketability beingmost affected by the development of black point.
Severe black point can lower grain quality andinterferes with the milling and baking properties of thegrain. Milling wheat grain with severe staining at a lowerextraction rate, can increase the quality of flour producedfrom stained grain, but will cause a loss in flour andsemolina yield and may still produce a darker colour flour.Where flour discolourisation is observed, the quality of endproducts such as pasta, noodles and semolina can beseriously affected, lowering their marketability. Lowerlevels of black point and localised discolourisation may beremoved during milling and do not represent a significantreduction in grain quality. Black pointed grain iscommonly associated with a larger seed size and highergrain weight. Grain protein is generally not influenced bythe presence of black point.
CHAPTER 8 – WHEAT QUALITY AND THE USES OF WESTERN AUSTRALIAN WHEAT THE WHEAT BOOK
172
BLACK POINT

Nicole KerrQuality Coordinator – Grains AgricultureWestern Australia
Many users of grain now demand that the grain theypurchase meet prescribed quality standards, are free ofchemical residues and have been handled in a way toensure they are safe to eat. Quality assurance systems allowgrowers, and other businesses in the food supply chain, todemonstrate that they meet all of their customer’srequirements.
Quality assurance programs can offer benefits to grainproducers in two ways: firstly, through productivity gainsdue to good management practices; and secondly, throughmarketing advantages such as being a preferred supplier,attracting new markets or alternatively holding existingmarkets against competitors.
Both market pressures and legislative requirements aredriving the Australian grains industry towards embracingquality assurance.
Market pressuresDemands for assurances from end-users of grain are
increasing. More flour mills are becoming quality assured,and their quality assurance systems are putting pressures onsuppliers of the raw ingredient, wheat. There is also anincreasing awareness in some markets to chemical residuesin grain. For example, wheat destined to South Korea hasto be tested for over 100 different chemicals. A few yearsago this number was 38. A major flour mill in Japan carriesout their own additional chemical testing on wheat theyuse.
Wheat producers in other countries have started toimplement quality assurance systems on-farm. In theUnited Kingdom, a quality assurance program covers onethird of the crop, and in 1998, maltsters did not issuecontracts to growers that were not quality assured. InCanada, the federal government, in partnership withnational producer organisation, has developed theCanadian On-Farm Food Safety Program. This has startedin the meat industries, but is expected to move into grainsin the near future.
All of these activities put pressure on Australian wheatproducers to adopt an on-farm quality assurance system.
LegislationAustralians consume over 20 billion meals every year.
Of these, it is estimated that less than 0.02% result in foodborne illness. Nevertheless, this equates to about 4.2million cases of foodbourne illness every year in Australia.
Consumers now expect a guarantee of safety when itcomes to food, and many governments have introducedfood safety legislation to ensure food is safe to eat. This inturn has encouraged the adoption of quality assuranceprograms.
in Australia, the New Zealand Food Authority(ANZFA) has proposed the National Food HygieneStandard. This will apply to all food businesses includingmost primary producers.
Low risk businesses in the primary industry sector willnot have to meet the requirements of the food safetystandards. Grain production is expected to be classified lowrisk, and this will be revised in 2002. However, mediumand high risk primary industry sector operations which donot have an independently audited food safety program inplace would be expected to develop one as the food safetystandards are implemented.
Quality AssuranceBoth customers and legislation are encouraging
producers to adopt quality assurance systems. So what isquality assurance? Quality assurance is simply a formalisedsystem in which you say what you are going to do, do whatyou say and then prove it. Planned procedures are put inplace before production to ensure customer requirementsare met (often both food safety and product qualityrequirements). For example, many buyers of our wheat areconcerned with the level of chemical residues in grain. Inorder to avoid residue problems, and hence not meet ourcustomers requirements, the following measures are put inplace; only use registered chemicals at recommended rates,observe witholding periods, calibrate equipment before useand use trained staff.
Records need to kept and audited regularly, usually byan independent auditor, to give the system integrity. Thisprovides the ‘proof ’ that you have been following yourquality assurance system, and your customers can haveconfidence that you are supplying product that meetsspecifications.
There are a number of different quality assurancesystems in the market place. These include branded qualitysystems like Great Grain, Cattlecare, Flockcare and Dairyfirst. SQF 2000CM is a quality code that has beendeveloped by Agriculture Western Australia specifically forthe food industry and is not commodity specific like thebranded systems. It incorporates HACCP (HazardAnalysis Critical Control Point) which is a riskmanagement tool for use in the food industry that hasinternational acceptance. The ISO 9000 series is anotherinternationally recognised quality assurance code that isnot specifically for the food industry, but rather is usedacross a range of industries.
Quality assurance systems offer benefits to growers asoutlined earlier, however there are also costs associated withthese systems. Indirect costs include time spent trainingstaff, completing spray diaries, inspecting equipment;inputs such as those spent on pest management programsand the cost of product not meeting premium segregationstandards. Direct costs include auditing and systemdevelopment costs.
THE WHEAT BOOK CHAPTER 8 – WHEAT QUALITY AND THE USES OF WESTERN AUSTRALIAN WHEAT
173
ON-FARM QUALITY ASSURANCE

Crosbie, G.B. (1989). Soft wheat: View from Australia.Cereal Foods World. 34, 678-681.
Crosbie, G. (1990). The segregation of wheat fornoodles. J. Agric. West. Aust. (4th Series). 31, 89-94.
Crosbie, G.B. (1991). The relationship between starchswelling properties, paste viscosity and boiled noodlequality in wheat flours. J. Cereal Sci. 13, 145-150.
Crosbie, G. (1994). Holding our edge in noodle wheat.J. Agric. West. Aust. (4th Series). 35, 77 – 82.
Crosbie, G.B. (1997). Development of improvedquality noodle wheat in Western Australia. Proc. 47thAust. Cereal Chem. Conf., Perth. pp 91-95.
Crosbie, G.B., Barclay I.R. Wilson R.E. and Lambe,W.J. (1994). Advanced wheat crossbreds showing potentialfor Japanese noodles. Proc. 44th Aust. Cereal Chem.Conf., Ballarat. pp. 350-352.
Crosbie, G. and Fisher, H. (1987). Variation in wheatprotein content – the effect of environment. J. Agric. West.Aust. (4th Series). 28, 124-127.
Crosbie, G.B., Lambe, W.J., Tsutsui, H. and Gilmour,R.F. (1992). Further evaluation of the flour swellingvolume test for identifying wheats potentially suitable forJapanese noodles. J. Cereal Sci. 15, 271-280.
Crosbie, G. B. and Lambe, W. J. (1993). Theapplication of the flour swelling volume test for potentialnoodle quality to wheat breeding lines affected bysprouting. J. Cereal Sci. 18, 267-276.
Crosbie, G., Miskelly, D and Dewan T. (1990). Wheatquality for the Japanese flour milling and noodleindustries. J. Agric. West. Aust. (4th Series). 31, 83-88.
Parish, J.A. (1963) Sampling premium wheat crops. J.Agric. West. Aust. (4th Series). 4, 687-692.
Reeves, J.T., Fisher, H.M. and Crosbie, G.B. (1978).Tincurrin – a new biscuit wheat. J. Agric. West. Aust. (4thSeries). 19, 16-18.
Crosbie, G.B., Barclay I.R. Wilson R.E. and Lambe,W.J. (1994). Advanced wheat crossbreds showing potentialfor Japanese noodles. Proc. 44th Aust. Cereal Chem.Conf., Ballarat. pp. 350-352.
CHAPTER 8 – WHEAT QUALITY AND THE USES OF WESTERN AUSTRALIAN WHEAT THE WHEAT BOOK
174
REFERENCES

Chapter Coordinator: G.P. ReithmullerWheatbook 1 Authors: R. Jarvis, M.W. Perry, S. Porritt and P. WhiteRevised by: R.J. Jarvis, P. Blackwell, D. Carter, R. Hetherington, P.A. Findlater, G.P. Reithmuller, W. Crabtree, D. Patabendige, M. Collins,J. Holmes, R. Brennan, A. Diggle and D. Minkey.
Tillage – A brief history ................................................................................177
Summary of tillage strategies ........................................................................178Fine-textured soils ..............................................................................................178
Characteristics ................................................................................................ 178Tillage strategy ................................................................................................178
Loams and gravelly loams ..................................................................................178Characteristics ..................................................................................................178Tillage strategy ................................................................................................178
Yellow earths and earthy sands ............................................................................178Characteristics ..................................................................................................178Tillage strategy ................................................................................................178
Yellow earths with acid subsoils ..........................................................................178 Characteristics ..................................................................................................178Tillage strategy ................................................................................................178
White sands ........................................................................................................178Characteristics ..................................................................................................178Tillage strategy ................................................................................................178
Sandy-surfaced soils ......................................................................................179The effects of cultivation ....................................................................................179
Soil structure ....................................................................................................179Yield ................................................................................................................179Disease ............................................................................................................179
The case for reduced tillage ................................................................................179Tillage strategies for sandy soils ..........................................................................180
Loams and gravelly loams ............................................................................181
Fine textured soils ..........................................................................................182The signs of degraded soil structure ....................................................................182The importance of soil structure ........................................................................182How is the structure made unstable? ..................................................................182Management of fine textured soils ......................................................................182
Tillage ..............................................................................................................182Pasture ............................................................................................................183
The role of gypsum ............................................................................................184Further reading ..................................................................................................184
THE WHEAT BOOK CHAPTER 9 – TILLAGE
175
CHAPTER NINE
TILLAGE

Deep tillage ..................................................................................................185Traffic pans ..........................................................................................................185Factors affecting the response to deep ripping ....................................................185Yield responses to deep ripping ..........................................................................186Residual value of deep ripping ............................................................................186Additional benefits of deep ripping ....................................................................186When to deep rip ................................................................................................186Farmer adoption of deep ripping ........................................................................187Further reading ..................................................................................................187
Managing water repellent soils ....................................................................188Symptoms of repellency problems in pastures ....................................................188Symptoms of repellency problems in crops ........................................................188Advantages of water repellency ..........................................................................188Causes of water repellency ..................................................................................188
Hydrophobic organic matter ..........................................................................188Soil susceptibility ................................................................................................189Solutions ............................................................................................................189
Claying ............................................................................................................189Furrow sowing and zero-till ............................................................................189Permanent pastures ..........................................................................................189Lime and gypsum ............................................................................................189Dilution ..........................................................................................................189
Claying water repellent soils ........................................................................190Summary ............................................................................................................190Principles of claying soils ....................................................................................190Results of claying non-wetting soils ....................................................................190Types of clays ......................................................................................................190Methods of claying ..............................................................................................190
Spreading and mechanical incorporation ........................................................190Clay lifting or “delving” ..................................................................................191
Costs of claying ..................................................................................................191Further reading ..................................................................................................191
Machinery for stubble retention and wind erosion control ........................192Choice of a seeder ..............................................................................................193
Disc seeders ......................................................................................................193Tine Seeders ....................................................................................................193
No-till ............................................................................................................196
CHAPTER 9 – TILLAGE THE WHEAT BOOK
176

Ron JarvisUntil the 1970s Western Australian farmers did not
question the need for cultivation as a necessary part ofwheat farming. Cultivation was considered essential to:
Kill weeds;Prepare a seedbed;Aerate and loosen the soil for better root growth;Mineralize soil nitrogen and other nutrients to a plant-available form; andControl root disease.Nevertheless, most Western Australian farmers still
cultivated less than Australian and world standards.Disc ploughs, which had replaced the mouldboard
ploughs of earlier years were declining in favour of tinedscarifiers and chisel ploughs as the main implement forprimary cultivation. Rather than relying on complete soilinversion and burial for the initial weed kill, the tinedimplements were used to break soil-root contact,promoting weed desiccation rather than complete burial.
The newer implements were wider and could beoperated faster, allowing larger areas to be sown quicklyand with less labour. Subsequent cultivations, usuallyshallower than the primary operation, were carried out atintervals before seeding, to kill new weed germinations,uproot transplants and break down the seed bed to a finetilth before seeding.
The clover ley farming system introduced in the late1940s had placed more emphasis on rushed pre-seedingcultivations compared with the long nine-month fallowspreviously used for wheat crops.
Chemical weed control (2,4-D, MCPA) for some in-crop broadleaved weeds was available, effective, andrelatively cheap. Other chemicals became available forbroadleaved weed and wild oat control in the 1960s butwere generally considered expensive.
Cultivations from the break of the season up until, andwhile seeding, were considered essential for successfulwheat cropping.
The non-selective, non-residual desiccant herbicidesparaquat and diquat discovered in the 1950s and first soldcommercially as Spray.Seed® in Western Australia in 1972were the catalysts for the ‘minimum tillage revolution’.
Initial commercial efforts to sell the concept ofminimum tillage were based on the value of additionalgrazing made available by deferring the first cultivation ofpasture paddocks.
Reduced erosion was a benefit but it was hard toevaluate its worth.
Although there were a few enthusiastic adopters, thesystem was unpopular because of the difficulty incontrolling ryegrass in the crops established with one sprayand no subsequent cultivations.
Trifluralin, introduced in 1974, was rapidly adopted asa cheap method of ryegrass control, although it failed todecrease, and sometimes increased, cultivation because ofthe need for incorporation of the chemical into the soil.
Half a million hectares were sprayed with trifluralin in1978, compared with less than 50,000 ha sown withSpray.Seed® and reduced tillage.
By 1983 both systems were being used on about onemillion hectares.
The rapid rise in acceptance of crop establishment viaminimum tillage and dependence on a ‘knockdown’herbicide was promoted by the introduction of Hoegrass®
in 1978, for post-emergence ryegrass control, and the useof cheap and effective in-crop broadleaved weed control bymixing diuron with MCPA or 2,4-D.
Direct-drilling was the term coined for the systemwhich relied on these herbicides to control all weeds andused only one cultivation to sow the crop.
In 1977, following increasing concern over soilconservation, the then Department of Agricultureestablished 11 long-term experiments to compare reducedand zero tillage with the conventional crop establishmentpractices using numerous cultivations. Crop growth andyields, and soil properties were measured between 1977and 1995 and the results were used to derive the tillagestrategies shown later.
The recent revival of no-tillage practices started around1990 when only a few farmers direct drilled with narrowpoints. The development of the use of the hard wearingmaterial, tungsten carbide, allowed increased adoption toaround 2% of Western Australian farmers with tinesystems and around 1.5% had no-till discs systems by1993. The benefits of earlier sowing to retain the moisturefrom no-till were an important factor as well as beingrelatively inexpensive to convert to the new system. Theearlier research work was drawn upon to include the deepdig principle (with tines or coulters) and fertiliserseparation from the seed to reduce fertiliser toxicity in thenarrow slots as more of a standard for the new no-tillageprinciple. Both this and the inclusion of a low disturbancedeep-rip required on deeper yellow sandplain resulted inadoption of around 15% by 1996 and around 40% by1998. Chemical use has also increased and with herbicideresistance increasing, the option of full soil disturbancemay still be useful but only when necessary for factors suchas weed control or trace element fertiliser incorporation.
The ideal tillage strategy is one that controls weeds,maintains soil structure, will not cause erosion, controlsroot disease, allows early sowing, establishes good plantdensity with early vigorous growth, gives the greatest yield,and is cost effective.
No single system is likely to be ideal for all soils andsituations, but the following sections will help producersdevelop conservation-conscious tillage systems that willmaximize yield and nett returns for their particular farms.
THE WHEAT BOOK CHAPTER 9 – TILLAGE
177
TILLAGE - A BRIEF HISTORY
Ron Jarvis
Fine-textured soilsThe fine-textured soils include the salmon gum-gimlet
soils of the eastern wheatbelt and the widespread ‘grey clay’and moort soils.
CharacteristicsSurface structure degrades rapidly under cultivation,
leading to slaking and crusting.
Tillage strategyNo-till or direct-drill. Reduce cultivation to a single
working, and use gypsum if necessary to establish a onepass system.
Loams and gravelly loamsCharacteristics
Not responsive to cultivation.
Tillage strategyCan be successfully no-tilled or direct-drilled.
Yellow earths and earthy sandsThe extensive deep yellow sands found throughout the
central, eastern and northern wheatbelt.
CharacteristicsForm hard-setting surface crusts. These soils pack hard
under the influence of rainfall and are highly responsive tocultivation. Dry cultivated soil is at risk of wind erosion.
Tillage strategySoil disturbance is necessary for maximum yields. No-
tilling or direct-drilling lowers yield, however this may beminimized by additional deep cultivation during theseeding operation. Deep ripping increases yield.
Yellow earths with acid subsoilsSoil acidity on the yellow earths is a particular problem
throughout the eastern and north-eastern wheatbelt.
CharacteristicsHard-setting surfaces and highly acidic subsoils.
Tillage strategyNo-till or direct-drilling can be used as sub-soil acidity
negates any advantages obtained from cultivation.
White sandsCharacteristics
Coarse-textured grey and white sands. These do notform surface crusts and are susceptible to wind erosion.Rhizoctonia bare patch may be a problem.
CHAPTER 9 – TILLAGE THE WHEAT BOOK
178
SUMMARY OF TILLAGE STRATEGIES
Tillage strategyReduced cultivation is essential to reduce the risks of
wind erosion. Cultivation below the seeding depth reducesrhizoctonia bare patch.

Sandy-surfaced soils cover most of the wheatbelt ofwestern Australia. They range from coarse textured deepwhite sands to the yellow earths and yellow earthy sands –‘good sandplain’ – soils found in the northern and centralwheatbelt.
Research, as well as farmer experience, has found thatwheat crops direct-drilled on sandplain soils grow moreslowly than crops sown after cultivation and are usuallylower yielding.
The effects of cultivationCultivation of a sandy-surfaced soil:Improves soil structure;Increases yield; and Decreases some diseases.
Soil structureSandy soils have a ‘massive’ structure and do not form
stable aggregates such as are found on well-structured heavysoils. Under the impact of rainfall and traffic each season,the sand grains in the surface soil pack together forminghard surface layers with high soil strength.
Without a cultivation, root growth is impeded in thesurface, reducing early plant vigour and lowering grainyield.
Cultivation of the sandy surfaces increases porosity –‘opens’ the soil – and allows greater mineralization ofnitrogen. Roots grow more vigorously in the porous surfacesoil and nitrogen and soil water is used more efficiently.
YieldIn the absence of cereal root disease or other
problems, cultivation has given an average eleven% yieldincrease over direct-drilling from more than 200Agriculture Western Australia experiments. Results froma continuous cropping experiment at Wongan Hills beentypical (Table 9.1).
Table 9.1 – Wheat yield averaged over ten years ofcontinuous wheat cropping on yellow loamy sand atWongan Hills. All treatments were sown on the sameday and nitrogen applied 2 to 3 weeks after seeding. Alltreatments were weed free.
Wheat yield (t/ha)Nitrogen Direct-drill Direct-drill Scarify twice(kg/ha) (triple disc (combine) own with
drill) a combine
0 0.74 1.02 1.29
50 1.26 1.51 1.72
The advantage of cultivation over direct-drilling with acombine has averaged 0.27 t/ha over ten years and theapplication of nitrogenous fertilizer has failed to remove
the yield advantage of the cultivated seedbed. The verypoor yield from the ‘zero-disturbance’, triple disc drilledtreatment emphasizes the requirement for cultivation forbest yield on sandplain soils.
DiseaseRhizoctonia bare patch, which may be found
throughout the wheatbelt, but which is a particularproblem on the Esperance sandplain, is reduced bycultivation.
The case for reduced tillageWhile cultivation has increased grain yields on sandy-
surfaced soils, there are important reasons why cultivationis not desirable. Some of these are:
Increased risk of wind erosion;Loss of organic matter;Delayed time of seeding;Increased weed germination as weed seeds are broughtto the surface with cultivation; andPoorer pasture re-establishment after a crop.
Of paramount importance is the increased risk of winderosion of cultivated surfaces. The fine sands of the WestMidlands and the south coast, and the yellow sands of theEradu sandplain are particularly susceptible to erosion asthey dry within hours of cultivation and do not formsurface crusts.
An advantage of reduced cultivation is better cloverregeneration in the year following the crop. Cloverregeneration depends on the extent and depth of burial ofthe burr during tillage. Reduced tillage systems leave moreburr at a shallow depth suitable for good germination.
At Avondale and Esperance (Table 9.2), direct-drillingwith a triple disc drill, which causes virtually no surfacedisturbance, has consistently given the best clover re-establishment, the next best was direct-drilling with acombine. Where paddocks have been scarified beforeseeding, burial is presumably greater and re-establishmentpoorer. Ploughs would be expected to be worse.
Table 9.2 – Effect of tillage method on sub. cloverregeneration
Crop Clover establishment (plants/sq.m)
method Avondale Avondale Esperance1983 1985 1985
Triple disc 314 394 318drill
Direct drill 215 368 56combine
Scarify twice 137 136 29
THE WHEAT BOOK CHAPTER 9 – TILLAGE
179
SANDY-SURFACED SOILS
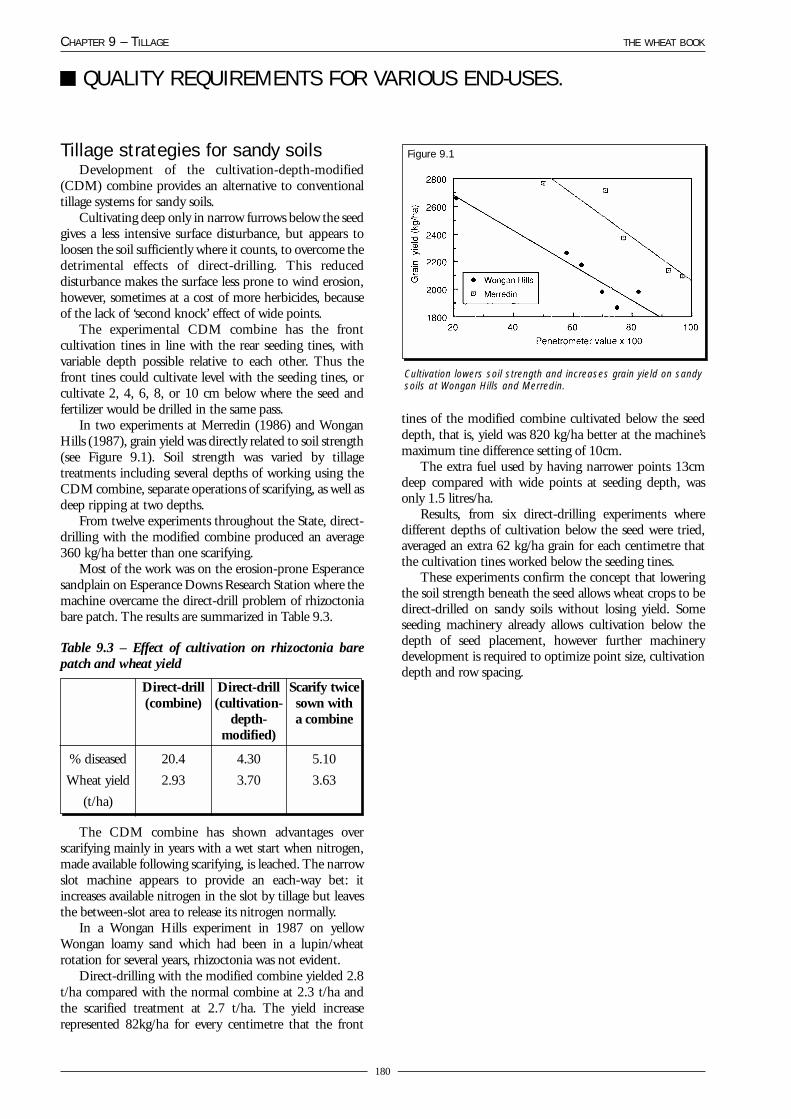
tines of the modified combine cultivated below the seeddepth, that is, yield was 820 kg/ha better at the machine’smaximum tine difference setting of 10cm.
The extra fuel used by having narrower points 13cmdeep compared with wide points at seeding depth, wasonly 1.5 litres/ha.
Results, from six direct-drilling experiments wheredifferent depths of cultivation below the seed were tried,averaged an extra 62 kg/ha grain for each centimetre thatthe cultivation tines worked below the seeding tines.
These experiments confirm the concept that loweringthe soil strength beneath the seed allows wheat crops to bedirect-drilled on sandy soils without losing yield. Someseeding machinery already allows cultivation below thedepth of seed placement, however further machinerydevelopment is required to optimize point size, cultivationdepth and row spacing.
CHAPTER 9 – TILLAGE THE WHEAT BOOK
180
QUALITY REQUIREMENTS FOR VARIOUS END-USES.
Tillage strategies for sandy soilsDevelopment of the cultivation-depth-modified
(CDM) combine provides an alternative to conventionaltillage systems for sandy soils.
Cultivating deep only in narrow furrows below the seedgives a less intensive surface disturbance, but appears toloosen the soil sufficiently where it counts, to overcome thedetrimental effects of direct-drilling. This reduceddisturbance makes the surface less prone to wind erosion,however, sometimes at a cost of more herbicides, becauseof the lack of ‘second knock’ effect of wide points.
The experimental CDM combine has the frontcultivation tines in line with the rear seeding tines, withvariable depth possible relative to each other. Thus thefront tines could cultivate level with the seeding tines, orcultivate 2, 4, 6, 8, or 10 cm below where the seed andfertilizer would be drilled in the same pass.
In two experiments at Merredin (1986) and WonganHills (1987), grain yield was directly related to soil strength(see Figure 9.1). Soil strength was varied by tillagetreatments including several depths of working using theCDM combine, separate operations of scarifying, as well asdeep ripping at two depths.
From twelve experiments throughout the State, direct-drilling with the modified combine produced an average360 kg/ha better than one scarifying.
Most of the work was on the erosion-prone Esperancesandplain on Esperance Downs Research Station where themachine overcame the direct-drill problem of rhizoctoniabare patch. The results are summarized in Table 9.3.
Table 9.3 – Effect of cultivation on rhizoctonia barepatch and wheat yield
Direct-drill Direct-drill Scarify twice(combine) (cultivation- sown with
depth- a combinemodified)
% diseased 20.4 4.30 5.10
Wheat yield 2.93 3.70 3.63
(t/ha)
The CDM combine has shown advantages overscarifying mainly in years with a wet start when nitrogen,made available following scarifying, is leached. The narrowslot machine appears to provide an each-way bet: itincreases available nitrogen in the slot by tillage but leavesthe between-slot area to release its nitrogen normally.
In a Wongan Hills experiment in 1987 on yellowWongan loamy sand which had been in a lupin/wheatrotation for several years, rhizoctonia was not evident.
Direct-drilling with the modified combine yielded 2.8t/ha compared with the normal combine at 2.3 t/ha andthe scarified treatment at 2.7 t/ha. The yield increaserepresented 82kg/ha for every centimetre that the front
Figure 9.1
Cultivation lowers soil strength and increases grain yield on sandysoils at Wongan Hills and Merredin.

Unlike sandy soils, red loamy soils of the Avon Valleydo not respond to cultivation. Even a zero-disturbancetriple disc drill produced yields equal to or better thancultivation, especially when adequate nitrogen is applied(Table 9.4).
With no benefit evident from cultivation of these soils,the system of lowest cost and best erosion prevention canbe employed.
Table 9.4 – Wheat yield averaged over ten years ofcontinuous wheat cropping on red-brown loam atAvondale Research Station. All treatments were sown onthe same day and nitrogen applied 2 to 3 weeks afterseeding. All treatments were weed free.
Wheat yield (t/ha)Nitrogen Direct-drill Direct-drill Scarify twice(kg/ha) (triple disc (combine) own with
drill) a combine
0 2.03 2.20 2.29
60 2.81 2.77 2.69
THE WHEAT BOOK CHAPTER 9 – TILLAGE
181
LOAMS AND GRAVELLY LOAMS

One of the limitations to crop production in thewheatbelt is the poor structure of fine textured soils.
Many years of fallowing and cultivation have causedthe loss of soil organic matter and the breakdown of thesoil aggregates that are essential to maintaining a stable soilstructure. This deterioration can decrease yield by morethan 50%.
Inappropriate tillage regimes are the primary cause ofthe structural breakdown.
About 3.5 million hectares of the State’s agriculturalsoils are susceptible to this form of soil degradation. Theseinclude the red-brown earths and red duplex soils (salmongum and gimlet soils) common in the eastern and centralwheatbelt, and the grey or moort clays of the south-westernwheatbelt (around Narrogin, Katanning and Lake Grace).
The signs of degraded soil structureThere is a rapid decline in the physical condition of fine
textured soils when they are cleared and cropped.The soil surface sets hard when dry.Infiltration of rainfall is slow and water ponds on thesurface during rain. Ponded water becomes cloudyfrom dispersed clay particles and remains on the surfacefor days or weeks after rain.Tillage is difficult. The soil is too hard when dry, butbecomes slippery after only a few millimetres of rain.Cultivation is only possible for a few days before thesoil again becomes too hard to work. (They become‘Sunday soils’.)Crop emergence is patchy because the tilled soil slakesand seals after rain, drying to a hard crust which isdifficult for seedlings to penetrate.
The importance of soil structureThe collection of soil particles into larger units or
aggregates gives the soil its structure. The formation ofthese units produces pores both within and between theaggregates allowing infiltration of water and air into thesoil, which is vital for good plant growth. It is importantthat these aggregates remain stable to maintain the pores.
The higher the clay content, the more important is soilstructure. In a well-structured soil the clay particles arebound together to form micro-aggregates. Soil aggregatesare then formed by these micro-aggregates binding with siltand sand particles.
The soil particles are bound into aggregates by the soilorganic matter, by electrostatic forces, that is, the attractionof positive and negative charges, and by fungal hyphae,bacterial gums, fine plant roots and cementing agents suchas iron or aluminium oxides.
Together with organic matter, the electrostatic forcesbind particles together to form the micro-aggregates, whileorganic matter, and fungal hyphae bind the largeraggregates.
How is the structure made unstable?The structure of the soil is broken down when the
amount or the strength of the binding agents is reduced bydisruptive forces breaking the aggregates into theirconstituent parts. These disruptive agents are themechanical action of cultivation and traffic, the impact ofraindrops on the surface and trampling by animals.
Of these, cultivation is the most important cause ofdeclining soil structure. Cultivation:
Decreases soil organic matter by promoting itsbreakdown. The improved aeration of the soil when itis tilled promotes more rapid microbial breakdown oforganic matter, reducing the amount of binding agentsin the soil.Mixes soil organic matter through the cultivation layer,diluting it throughout the top 8 to 10 cm of the soil.Breaks the important bonds, which, over time, havebeen formed in the soil by the organic matter. Oncebroken, the continual disruption of the soil throughcultivation prevents these bonds from being re-formed.Soil aggregate bonds are also weaker when they are wetand thus a wet soil is more susceptible to disruptiveforces than a dry soil.The result of cultivation is therefore less organic matter
forming fewer bonds; and those, which are formed, are lessable to maintain a stable structure. The soil then becomesmuch more susceptible to disruptive force – such asraindrops – that will break down aggregates and cause thesoil to slake.
Management of fine textured soilsTillage
Minimizing tillage, consistent with good cropestablishment, is the key to the management of finetextured soils for crop production. The rationale behindreduced tillage is to slow the destruction of organic matter,and to reduce the disruption of the binding materials,which maintain a stable soil structure.
Most of our knowledge about managing fine texturedsoils comes from a long-term experiment established atMerredin on a red-brown earth originally carrying salmongum and gimlet vegetation. Four crop establishmentsystems were used and the site was continuously croppedto wheat using the same tillage treatments from 1977 to1995.
Tillage treatments tested, in increasing order of soildisturbance, were:
Direct seeding with a triple disc drill;Direct seeding with a standard combine; One cultivation with a scarifier followed by seedingwith a triple disc drill;The district practice method of the time. This was ascarifying, followed by another working with a scarifier,and seeding with a standard combine. In some seasonsan extra working was required for seedbed preparation.
CHAPTER 9 – TILLAGE THE WHEAT BOOK
182
FINE TEXTURED SOILS

Weeds were controlled with knockdown and post-emergent herbicides.
Soil samples were taken five centimetres deep fromeach plot from 1981 onward and tested for water-stableaggregate percentage (WSA) which is the percentage ofaggregated material remaining on a two millimetre sieveafter sieving in water. The higher the WSA, the more stablethe soil when wet. A stable soil is less prone to crusting andsetting hard, and allows rain to infiltrate faster.
Tillage treatments influenced WSA percentagesignificantly every year. The district practice treatmentproduced a less stable soil structure than the othertreatments, while the triple disc drill produced the least soildisturbance and improved structure the most (Figure 9.2).
The wheat yields for the four tillage methods averagedover the same six years are shown in the first column ofTable 9.5.
In the early years, the treatment which had been direct-drilled with a combine each year produced an average yieldof 590 kg/ha/year or 75% more than the cultivated districtpractice where soil structure was poor.
In 1987, the district practice treatment – twoscarifications plus sowing with a combine – was changed todirect-drilling with a combine. Grain yields immediatelyimproved. Over the three years 1987 to 1989, the oncepoor yielding cultivated soil averaged 1.42 t/ha comparedwith the long-term direct-drilled treatment yield of 1.33t/ha.
The impact of cultivation on the structural breakdownof the soil will depend on the soil type, soil moisture duringcultivation, and the environment (through effects on plantgrowth). Tillage regimes therefore should be tailored forspecific situations. Experience has shown that even whereyields are not affected in the short term, excessivecultivation of fine textured soils will degrade the soil.
PastureThere are other practices which promote a stable soil
structure.Pasture increases the return of organic materials to the
soil, and promotes the proliferation of soil animals andfungal activity. A pasture phase provides a spell fromcultivation and soil aggregation increases. Fertilizerapplication on pasture increases plant growth and soilorganic matter, however, trampling by animals can reducesoil structure.
THE WHEAT BOOK CHAPTER 9 – TILLAGE
183
FINE TEXTURED SOILS (continued)
Figure 9.2
The relationship between soil structure (measured as % waterstable aggregates) and grain yield on a red-brown earth (Salmongum) soil at Merredin.
Tillage treatment since 1977 Yield (t/ha)1981 to 1986 1983 to 1986 1983 to 1986 1988 to 1995 1988 to 1995no gypsum no gypsum gypsum no gypsum* gypsum*
Triple disc drill (TDD) 1.27 1.35 1.51 - -
Scarify, then TDD 1.21 1.29 1.47 - -
District practice 0.79 0.92 1.36 - -
Direct drill with combine 1.38 1.47 1.53 1.63 1.74
Direct drill narrow points - - - 1.76 1.79
Scarify then narrow points - - - 1.56 1.66
Table 9.5 – The effect of tillage and gypsum on wheat grain yield. In 1987 the triple disc treatment was changed todirect drill 50 mm points, scarify then triple disc to scarify then 50 mm points and the district practice to direct drillwith combine.
* average of the five wheat crops during 1988 to 1995 (gypsum treatment applied 1983).

Figure 9.3 illustrates how soil structure (as measured byWSA percentage) improves in the pasture year, but arereduced when cropped. The data are from an experimentadjacent to the continuously cropped one reported in thispaper.
Introducing a pasture phase may be essential in somesituations because organic matter levels continue to declineon some soils supporting continuous wheat, even withminimum tillage.
The role of gypsumAlthough reducing cultivation can delay or reverse soil
structural decline and increase grain yields, the return toproductivity can sometimes be slow. On some soils,application of gypsum – calcium sulphate – can hasten therate of improvement when used with reduced tillage.
Gypsum improves soil structure by reversing thedispersion of the clay particles, making the soil aggregatesmore stable when wet and the soil surface more friablewhen dry.
Dispersion is the process whereby individual clayparticles migrate away from each other because theelectrostatic forces repelling them are greater than thoseattracting them.
The dispersed clay particles may then clog pores, whichwill impede infiltration of water. Also, when the soil dries,the clay particles act to cement the soil constituent togetherforming a characteristic surface crust.
The calcium in gypsum replaces sodium on clayparticles allowing them to stay together (flocculate) whichis the basis of a more stable soil structure.
Table 9.5 shows the increase in yield averaged over 4years (1983 to 1986) from a single application of gypsumin 1983 for the degraded district practice treatment. Bycomparison, there was little grain yield response where thesoil structure was good following years of direct-drilling.
Unfortunately not all dispersive clays respond to
gypsum because other factors, such as the concentration ofthe soil solution, also control the response. Somelaboratory tests give a reasonable guide for predicting theresponse of a soil to gypsum.
The aim of gypsum application is simply to preventclay dispersion. It does not in itself provide stable soilstructure. It is important to first determine if a soil willrespond to gypsum. If it will, the gypsum application mustbe supported by minimum soil disturbance and otherpractices which will promote organic matter build-up andaggregate binding, necessary to achieve a stable soil.
Further readingFarmnotes
57/90 Identifying gypsum-responsive soils. (Agdex514).
Journal of Agriculture, Western AustraliaHowell, M. (1987).Gypsum use in the wheatbelt. Vol.
28 pp 40-43.Jarvis, R.J. (1988). Tillage systems and soil stability.
Vol. 29 pp 54-57.
OthersJarvis, R.J., Hamblin, A.P. and Delroy, N.D. (1986).
Continuous cereal cropping with alternative tillage systemsin Western Australia. Western Australian Department ofAgriculture, Technical Bulletin No. 71.
White, P.F. (1989). The influence of alternative tillagesystems on the distribution of nutrients and organic carbonon some common Western Australian wheatbelt soils.Australian Journal of Soil Research Vol. 28, pp 95-116.
White, P.F., Belford, R.K., Robson, A.D., Delroy, N.D.and Jarvis, R.J. (1989). Long term effects of direct drillingand conventional cultivation on the distribution ofnutrients and organic C in soils of South WesternAustralia. Western Australian Department of Agriculture,Division of Plant Industries, Technical Report No. 20.
Jarvis, R.J. (1986). Timing and intensity of surfacecultivation and depth of cultivation affect rhizoctoniapatch and wheat yield. Australian Journal of ExperimentalAgriculture, Vol. 26, pp 703-708.
CHAPTER 9 – TILLAGE THE WHEAT BOOK
184
FINE TEXTURED SOILS (continued)
Figure 9.3
Water stable aggregates increase under pasture and decreasewhen the soil is cultivated for a crop.

Ron JarvisDeep tillage – deep ploughing, subsoiling or deep
ripping – involves disturbing the soil below the normalcultivation layer, often to 40cm without inverting the soil.It breaks up traffic-induced, or naturally occurringcompacted layers.
The practice was almost unknown in cereal productionareas of southern Australia, although research on deepripping dates from the 1890s. Some small yield increaseswere recorded but were not enough to encourage thepractice.
On a worldwide basis it is only in exceptional situationsthat deep tillage has increased crop yields in semi-aridareas.
In the early 1980s, experiments with deep ripping inWestern Australia demonstrated spectacular improvementsin wheat yield. In 1981, two experiments at Wongan Hillsand Yorkrakine gave 600 kg/ha more grain when a loamysand was ripped to 30cm.
This stimulated research into deep ripping as a soilmanagement practice. Results have shown thatcompaction pans are widespread on the deeper sandy soils;and that disruption of the pans can give large yieldincreases.
Traffic pansCompaction pans which restrict cereal growth exist on
virtually all soils which texture loamy-sand or sandier.These represent an area of 6.6M ha or 48% of theagricultural area of Western Australia (McFarlane 1984)without including the 5.2M ha of the sandy surfacedduplex soils which exhibit compaction pans if there issufficient depth to clay. These coarse-textured sandy soilsgenerally have a variety of particle sizes which arecompacted when moist by machinery travelling over thesurface.
The weight per unit area (pressure), total axle load andthe number of machine passes affect the strength anddepth of the soil compaction. Wheel slip also increasescompaction, but to a lesser extent.
Traffic pans restrict root growth, reducing plant uptakeof water and leachable nutrients such as nitrogen. Eightweeks after seeding at Wongan Hills wheat roots were30cm deep on unripped ground compared with 90 cmdeep where deep ripping had removed the traffic pan.
Wheat roots will eventually penetrate an unripped pan,but do not go as deep, resulting in less plant dry matterproduction and grain yield. In the above example, wheaton the unripped area yielded 600 kg/ha (25%) less grain.
The depth of the compacted layer depends on soil type.The lower the clay content of the soil, the deeper the hardlayer.
On loamy sand and yellow earth such as at WonganHills (Figure 9.4), which have 10 to 12% or more clay, thecompaction layer has maximum strength at about 20cmdepth.
Yellow sands and earthy sands such as Eradusandplain have 4 to 8% clay and the hard pan is about25 cm deep.
Deep white sands with little clay have a pan at 30cm ormore.
However, white sands with no apparent pan – the soilstrength keeps increasing with depth – have also showncrop responses to deep tillage.
Factors affecting the response todeep ripping
Deep ripping has proved extremely beneficial only onlight sandy soils. Even on these soils in the medium rainfallarea, yield responses to ripping have been variable. If pansare present, vegetative responses to ripping will almostalways be obtained, but if finishing rains or soil moisture islimiting, yield responses may be curtailed.
Medium textured soils such as the Avon Valley loams,and heavier soils (salmon gum-gimlet) have not showncompaction pans, although soil strength may increase withdepth. There has generally been no response to ripping,although the cultivation caused by the ripping operationsometimes has a fallowing effect as it kills the pasture. Thisis not a ripping response as it is also obtained (at a fractionof the cost) with a shallow cultivation.
Duplex soils of sand over clay and sand over gravel havetraffic pans if the sand is deep enough. Generally sand overclay soils will not respond to ripping unless the clay isdeeper than 25 cm. Sand over gravel soils have respondedto ripping if the gravel is in a sandy matrix and does notrestrict root growth completely.
Yellow loamy sands with highly acidic subsoils (wodgil)commonly form compaction pans at 15 to 20cm.However, wheat crops seldom respond to deep rippingbecause root growth (and therefore nutrient and wateruptake by the plant) is restricted by the subsoil acidity.
Even on suitable soils, responses to ripping have been
THE WHEAT BOOK CHAPTER 9 – TILLAGE
185
DEEP TILLAGE
Figure 9.4
Soil strength profiles for a yellow loamy sand before, and followingripping to 30 cm, Wongan Hills, 1986.
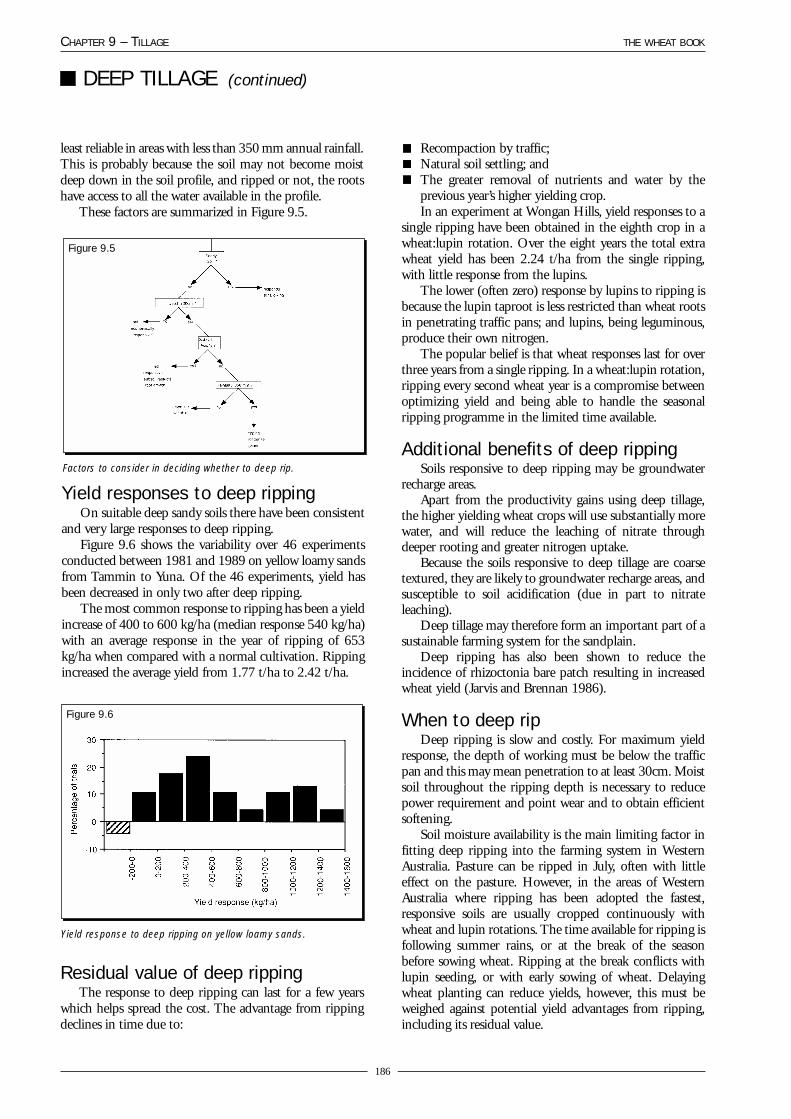
least reliable in areas with less than 350 mm annual rainfall.This is probably because the soil may not become moistdeep down in the soil profile, and ripped or not, the rootshave access to all the water available in the profile.
These factors are summarized in Figure 9.5.
Yield responses to deep rippingOn suitable deep sandy soils there have been consistent
and very large responses to deep ripping.Figure 9.6 shows the variability over 46 experiments
conducted between 1981 and 1989 on yellow loamy sandsfrom Tammin to Yuna. Of the 46 experiments, yield hasbeen decreased in only two after deep ripping.
The most common response to ripping has been a yieldincrease of 400 to 600 kg/ha (median response 540 kg/ha)with an average response in the year of ripping of 653kg/ha when compared with a normal cultivation. Rippingincreased the average yield from 1.77 t/ha to 2.42 t/ha.
Residual value of deep rippingThe response to deep ripping can last for a few years
which helps spread the cost. The advantage from rippingdeclines in time due to:
CHAPTER 9 – TILLAGE THE WHEAT BOOK
186
DEEP TILLAGE (continued)
Figure 9.6
Yield response to deep ripping on yellow loamy sands.
Figure 9.5
Factors to consider in deciding whether to deep rip.
Recompaction by traffic;Natural soil settling; andThe greater removal of nutrients and water by theprevious year’s higher yielding crop.In an experiment at Wongan Hills, yield responses to a
single ripping have been obtained in the eighth crop in awheat:lupin rotation. Over the eight years the total extrawheat yield has been 2.24 t/ha from the single ripping,with little response from the lupins.
The lower (often zero) response by lupins to ripping isbecause the lupin taproot is less restricted than wheat rootsin penetrating traffic pans; and lupins, being leguminous,produce their own nitrogen.
The popular belief is that wheat responses last for overthree years from a single ripping. In a wheat:lupin rotation,ripping every second wheat year is a compromise betweenoptimizing yield and being able to handle the seasonalripping programme in the limited time available.
Additional benefits of deep rippingSoils responsive to deep ripping may be groundwater
recharge areas.Apart from the productivity gains using deep tillage,
the higher yielding wheat crops will use substantially morewater, and will reduce the leaching of nitrate throughdeeper rooting and greater nitrogen uptake.
Because the soils responsive to deep tillage are coarsetextured, they are likely to groundwater recharge areas, andsusceptible to soil acidification (due in part to nitrateleaching).
Deep tillage may therefore form an important part of asustainable farming system for the sandplain.
Deep ripping has also been shown to reduce theincidence of rhizoctonia bare patch resulting in increasedwheat yield (Jarvis and Brennan 1986).
When to deep ripDeep ripping is slow and costly. For maximum yield
response, the depth of working must be below the trafficpan and this may mean penetration to at least 30cm. Moistsoil throughout the ripping depth is necessary to reducepower requirement and point wear and to obtain efficientsoftening.
Soil moisture availability is the main limiting factor infitting deep ripping into the farming system in WesternAustralia. Pasture can be ripped in July, often with littleeffect on the pasture. However, in the areas of WesternAustralia where ripping has been adopted the fastest,responsive soils are usually cropped continuously withwheat and lupin rotations. The time available for ripping isfollowing summer rains, or at the break of the seasonbefore sowing wheat. Ripping at the break conflicts withlupin seeding, or with early sowing of wheat. Delayingwheat planting can reduce yields, however, this must beweighed against potential yield advantages from ripping,including its residual value.

Ripping immediately after seeding avoids machineflotation and depth of seeding problems associated withseeding on soft, ripped ground (Table 9.6). In areas whichshow reliable responses to deep ripping, more than 25% ofthe area ripped each year was carried out post-seeding in1988 (Jarvis 1991) and this practice has increased sincethen.
Table 9.6 – Effect of deep ripping before and afterseeding on wheat yield
Time of deep ripping Wheat yield (t/ha)
6 days before seeding 2.18
Immediately after seeding 2.32
3 days after seeding 2.23
7 days after seeding 2.03
14 days after seeding 1.82
No rip, direct drilled 0.75
The whole operation must be carefully managed, asresearch in 1986 showed that plant number and yield canbe reduced where tractor wheel slip was high when rippingseven days after seeding. Ripping three days after seedingwas not a problem, however, an increase in seeding ratewould be worthwhile insurance. The yields from ripping 7and 14 days after seeding are higher than would beobtained for a paddock operation as the yields wereobtained from the crop area between the wheels of thetractor doing the ripping – where wheat establishment wasonly reduced by 15%. Where wheel slip had occurred,establishment was reduced by 70%. Establishment was notaffected at the other times of ripping.
Ripping carried out (when soil moisture was ‘adequate’)from July/August of the preceding year, on summer rains,or pre- or post-seeding have produced similar wheat yieldresponses. Ripping in dry conditions was less effective andthe cost if the operation was prohibitive because of fuel use,reduced speed and point wear.
Speed of rippingAvailable tractor power and traction control the speed
of ripping. In the operating range of speeds there was littleeffect of speed on the amelioration of compaction and theresulting effect on yield. Speed was relatively unimportantcompared with depth or tine spacing in its effect on fueluse. Farmers rip at an average speed of 7.3 km/h (a rangeof 4.0 to 12.9).
Fuel usageFarmer’s estimates varied considerably because of
available power, size of implement, and the variation of soiltypes, compaction strengths and soil moisture conditionsand averaged 8.1 L/ha (4.6 to 13.0 range).
THE WHEAT BOOK CHAPTER 9 – TILLAGE
187
DEEP TILLAGE (continued)
Farmer adoption of deep rippingThe cost of a specialized machine, availability of labour,
the need for a spare powerful tractor and the variability ofgrain yield responses has inhibited the adoption of deepripping.
However, nearly all farmers who have bought a rippercontinue to rip when seasonal conditions allow. In mostcases, the aim is to rip every second wheat crop in awheat/lupin rotation, in other words, one quarter of theircropped area each year.
Further attention to responses to deep ripping in thesouth coastal cropping zones will be essential, in particular,within high yielding package strategies. The previoushistory of research on the south coast showed reducedproduction from crops established with zero tillage becauseof the lack of early vigour as well as increased rhizoctoniabare patch.
Some machines can now deep rip and seed in one passwhich reduces the requirement for an additional tractorbut can slow seeding.
Research results, and experience by farmers, indicate amuch larger potential for adoption of deep ripping as astandard farm practice in Western Australia.
Further readingJarvis, R.J. (1991).Farmer experience with deep ripping
in Western Australia. Western Australian Department ofAgriculture, Division of Plant Industries, Technical reportNo. 27.
Jarvis R.J. (1992). Amelioration of soil compactionwith deep ripping. Proceedings of the National Workshopon Subsoil Constraints to Root Growth and High SoilWater and Nutrient Use by Plants, Tanunda, SouthAustralia, August 30- September 2.
McFarlane, D.J. (1984). Soil conservation research inNSW and its significance to research on water erosion inWestern Australia. Western Australian Dept. Agriculture,Division of Resource Management Technical Report 29.
Jarvis, R.J. and Brennan, R.F. (1986). Timing andintensity of surface cultivation and depth of cultivationaffect rhizoctonia patch and wheat yield. Aust. J. Exp.Agric. 26:703-8.

not always active in dry soils. Surface applied herbicides(for example, simazine) can be washed into hollows anddamage crop plants, while weeds germinate on the rises.
Heavy rain in summer or autumn can result insignificant runoff and erosion on repellent soils on slopingsites. Rills and gullies have been observed on soils, whichwould have negligible runoff if they were not repellent.Water erosion can occur on both crop and pasturepaddocks.
Advantages of water repellencyNot all the consequences of water repellency are
necessarily unfavourable and some native plants mayinduce water repellence to give them a competitiveadvantage in a harsh environment. Water repellence canreduce moisture loss through evaporation by the ‘drymulch’ effect of the repellent surface layers. It can alsoincrease the amount of subsoil moisture by diversionflow from the surface through preferential pathwaysbeneath surface hollows and along plant roots. However,there are also possible disadvantages of diversion flow,due to the faster transport of nutrients and toxins intowater supplies.
Causes of water repellencyThere are two requirements for a soil to develop water
repellence; firstly, the accumulation of a sufficient quantityof hydrophobic organic matter and secondly, a susceptiblesoil.
Hydrophobic organic matterParticles of organic matter seem to act as a highly
hydrophobic soil component and as a carrier and reservoirof waxes. These waxes can diffuse out under heating andcooling cycles (for example, over summer) whichredistribute the hydrophobic materials. This makes theadjacent sand grains hydrophobic. A number of differentorganic compounds have been identified. The waxysubstances consist of long chain hydrocarbons, fatty acidsand alkanes (paraffin-like compounds).
There is some evidence from long-term experiments inthe West Midlands and on the south coast of WesternAustralia that continuous cereal cropping may reducerepellence, providing the soils are not severely repellent.However, there are many agronomic disadvantages ofcontinuous cereal cropping.
Blue lupins, Lupinus consentinii, definitely increase theseverity of water repellence. A sandplain paddock growingblue lupins continuously for about five years will developmoderate to severe repellence.
Sheep camps tend to be more water repellent becauseof the accumulation of organic matter. The waxysubstances in plants are not effectively broken down bytheir passage through the sheep.
In native vegetation there is a strong link between
Paul BlackwellUp to five million hectares of Western Australia is
affected or has the potential to be affected by waterrepellency or non-wetting. These are mainly sandy soilswith less than 5% clay content in the West Midlands, Swancoastal plain and the south coast sandplain. Large areas ofSouth Australia, on the Eyre Peninsula and in the southeast, are affected as well as parts of the Victorian mallee.
Water repellent behaviour in soil is caused by drycoatings of hydrophobic (that is, water hating) material onsoil particles or aggregates, as well as hydrophobic organicmatter, such as fungal strands and particles of decomposingplant material. Methods of assessing repellency areexplained in Farmnote No. 110/96 ‘Assessing waterrepellency’.
Symptoms of repellency problems inpastures
Patchy emergence early in the autumn typifies pastureson water repellent soils. Light rains accumulate in hollowsand hoof prints and wet the soil sufficiently for plants tosurvive for a few weeks. The pasture has patches of plantson wetted areas with dry, bare ground in between.
Subterranean clover is at a competitive disadvantage toaerial seeding plants. Its runners do not preferentially placethe seeds in the hollows, and seeds placed just below thesoil surface may or may not be wet by light rains. Whenthey do germinate, the roots may find only dry soilunderneath the seed, so the seedling dies. This can lead toa decline in the productivity of clover pastures.
The pasture contains younger and older plants, whichresults in difficulties with some herbicides, which are bestapplied at specific growth stages.
Insects (for example, redlegged earth mite) are able tomultiply quickly because of the early germination andsurvival of plants which are good hosts (for example,capeweed).
Symptoms of repellency problems incrops
Repellent soils require more rain at the break of theseason before seeding than non-repellent soils. This delayin seeding can significantly reduce the yield potential of thecrop.
Crops that are sown before the soil is evenly wet willresult in patchy germination. Controlling the depth ofcultivation and sowing equipment is difficult whenmoving alternately from wet to dry soil.
The wind erosion risk is increased by the forced delayin sowing as well as by dry soil patches and poor cover.
Fertiliser placed in the hollows could be subject toincreased leaching, while fertiliser in dry soil is lessavailable.
Incorporated herbicides (for example, trifluralin) are
CHAPTER 9 – TILLAGE THE WHEAT BOOK
188
MANAGING WATER REPELLENT SOILS

particular species [for example, Eucalyptus astringens(brown mallet), E. patens (blackbutt) and Banksia speciosa(showy banksia)] and the induction of water repellence.
Soil susceptibilityThe soil property which is closely linked to
susceptibility to water repellence is the surface area. Forinstance, coarse sands can be more repellent than fine sandswhen the same amount of organic matter is added. Coarsesand has a lower surface area than the same weight of finesand. Clay has a very much larger surface area than sand,because it consists of much finer particles. Thus soils withgreater than about 5% clay content rarely exhibitrepellency. Coarsely aggregated clays and soils with anabundant supply of hydrophobic material, such as beneathbrown mallet hilltops, can be exceptions to this generalrule.
Microbial activity breaks down dead plant material in away that contributes to the development of waterrepellence in susceptible soils. It seems there is selectivedegradation of less hydrophobic waxes resulting inconcentration of the more repellent polar waxes. Somemicro-organisms can degrade the more stable hydrophobicwaxes. Research continues for a biological solution to waterrepellence using similar principles to that of biologicalclean-up of crude oil spills.
Recent results encourage the use of moistureconservation, pH correction with ground limestone andthe addition of small amounts of clay.
SolutionsPossible management solutions depend on the
location, landscape and agricultural enterprise.
ClayingClaying is currently the best long-term solution to
correct the problem for better cropping and pastures.Suitable top-dressed or delved clay can cover the repellentsoil particle surfaces and improve soil water retention andnutrition, but is relatively expensive initially. See FarmnoteNo. 37/94 ‘Claying water repellent soils’ for more details.
Furrow sowing and zero-tillThe easiest solution for better cropping on these soils is
to employ furrows. The retention of thick surface mulch ina zero-till regime without grazing can also reduceopportunities for soil drying and minimise repellency.Further technical details on furrow sowing and zero till areprovided in Farmnote No. 111/96 ‘Furrow sowing forimproved crops and pastures on water repellent soils’ andBulletin 4333 ‘Furrow sowing on water repellent soils’.
Permanent pasturesPermanent pastures of blue lupins, serradella or lucerne
are possible options, if care is taken with the method of
THE WHEAT BOOK CHAPTER 9 – TILLAGE
189
MANAGING WATER REPELLENT SOILS (continued)
establishment. Fodder shrubs such as tagasaste oftenprosper on water repellent soils, as do trees such as pines.
Lime and gypsumLime and gypsum are often mentioned as possible
solutions, but have been very disappointing in mostexperiments in Western Australia.
DilutionRepellent soil layers can be diluted with deeper, non-
repellent soil to reduce the problem, but this can lead to alarge wind erosion risk and is not a long-term solution.
Further readingBulletin 4333 ‘Furrow sowing on water repellent soils’
(Agdex 510).Farmnote 37/94 ‘Claying water repellent soils’ (Agdex
514).Farmnote No. 110/96 ‘Assessing water repellence’
(Agdex 511).Farmnote No. 111/96 ‘Furrow sowing for improved
crops and pastures on water repellent soils’ (Agdex 511).

earlier planting dates, as less rain is needed to wet theseedbed. Adding clay to permanent pastures also increases
production and has a better plant composition. The effectsof the clay encourage clovers and serradella at the expenseof capeweed. Clay can also help to slow soil acidificationand prevent water and wind erosion. The clayed soil hasbeen very resistant to wind erosion, particularly in areaswithout ground cover.
Types of clays Kaolinite, or white pipe clay, is the best of the clays; it
is dominant in the subsoils in Western Australia,particularly in southern regions and can be yellow red orgreen depending on the other minerals present.
The most suitable clays are the ones that disperse inwater forming a cloud of clay – they do this naturally whenincorporated into the topsoil (see Farmnote No. 57/90‘Identifying gypsum responsive soils’ -Agdex 514).
The dispersion speeds up the process of coating thesand grains and non-wetting organic matter. Very littlemechanical incorporation is needed.
Non-dispersive clays have worked in laboratoryexperiments but they need far more mixing and may beuneconomic and slow to take effect. These clays suitcropping soils only, where cultivations mix the clay into thesurface.
About 3% clay is needed in the top 50 mm of soil.However, because most subsoil clays are mixtures of sandand clay particles, with between 20 and 50% actual clay,the application rate recommended is 100 t/ha. This hasbeen successful in trials.
Methods of clayingThere are two ways to get clay on to the soil surface –
spreading and clay lifting.
Spreading and mechanical incorporation Some farmers in South Australia dig dams using road
scrapers with elevators and “Carry Graders”. The clayspoils are then spread onto the paddock. These farmerstreat the problem areas such as sand dunes first. The clay isdumped in parallel rows and incorporated into the soil byscarifying or “smudging” with railway irons at angles to theoriginal rows. The farmers do about 50 ha to 100 ha at atime.
The “Claymate”, a machine developed in SouthAustralia, rips and scrapes up clay and spreads it evenly onthe paddock, without the need to cross scarify. Roadscrapers can be used to give a continuous blanket of clay at100 t/ha without cross scarifying. High driver skill isrequired to overlap the rows at the correct application rate.
Spreading is the only method possible if the clay iseither not available on site or is too deep for the nextmethod.
Dan Carter and Rob Hetherington, Natural Resource Management Services,Albany.
Summary How claying works; results of claying non-wetting soils;
types of clay; methods and costs of claying.Farmers in Australia are benefiting from adding clay to
water repellent soils, ‘claying’, by improving water entryand uniform soil moisture.
South Australian farmers have been adding clay at upto 200 t/ha to the topsoil of sand dunes, with remarkableproductive results from these soils. The claying has beeneffective even 20 years after the original applications.
Following the South Australian clay success story,Agriculture Western Australia has been developing the besttechniques for claying our water repellent soils.
Principles of claying soils Sand grains in susceptible soils are covered with organic
materials that are non-wetting. Clay can be added to coatthe sand grains and organic materials so a new wettingsurface is developed.
Clays that spontaneously slake and disperse are theones to use because rain breaks them down quickly andthey disperse on to the non-wetting surfaces.
This leads to the soil wetting up uniformly, improvingthe germination of both crops and pastures. Cropestablishment is easier, because competitive weeds are morecontrollable due to their uniform germination. Herbicidesand nutrients are also far more effective when the soil isevenly wet.
Results of claying non-wettingsoils
In Western Australia, the increases in productivity afteradding clay have been encouraging. In the south coastregion, barley yields on water repellent soils were increasedby an average of 70% each year after adding clay. Yields intrial plots improved from 1.7 t/ha on water repellent soil to3.4 t/ha on clay treated soil in the second year. Farmeryields have gone from 1.2 to 2.8 t/ha.
Benefits have been shown in the west Midlands andnorthern agricultural regions in the second year afterapplication. The yields of lupins and wheat improved fromabout 1 to 2 t/ha. This is twice the yield of these crops onuntreated soil in the west Midlands.
The improvement can be put down to several things: better weed control in the pre-sowing phase; a uniformgermination makes them easier to spray, more even water penetration of the soil surface, retention of soil water in the clayed layer, retention of plant nutrients in the root zone,particularly potassium, and
CHAPTER 9 – TILLAGE THE WHEAT BOOK
190
CLAYING WATER REPELLENT SOILS

Clay lifting or “delving” With duplex soils, suitable clay is often within 600 mm
of the water repellent topsoil. A clay lifting technique, claydelving, can pull up the required quantity of clay withoutinverting the whole soil profile.
It was first tried in Great Britain on acidic soils lyingover alkaline marl. The technique is to pull a flat-faceddelving tine through the top of the clay layer. The clay runsup the face of the tine and is deposited on the soil surface.The depth of penetration into the clay subsoil controls theamount of clay pulled up. Under Western Australianconditions, 100 to 130 t/ha have been well within itscapability.
The drawback at the moment is that with domed-claysoils the clods sizes are too big and need to be broken downwith rolling and cultivation. If a dispersible clay is lifted,the clods will disintegrate and disperse naturally when itrains during the winter months. Sheep trampling will alsohelp to break down and incorporate the clay.
The width of the test delving tine is tapered from 150mm at the bottom to 100 mm at the top where it emergesfrom the soil surface. In trials, this single tine was pulledthrough the soil at 2 m spacings to lift the clay. The tinewas on a three point linkage behind a 32 kW tractortravelling at 5 km/h. It pulled clay up from a depth ofbetween 200 and 300 mm.
Future thoughts are to halve the width of the delvingtine face, so that the clods pulled up are smaller, and tohave the tine rip lines 1 m apart. The tine would also belonger to reach clays 600 mm deep. Beyond this, tractordraw power may limit the ability of the technique. Longer,narrower tines have lifted clay from 600 mm at Esperance.
The method may cause problems in the subsoil becausethe soil in the rip line can disperse during rainfall, resultingin gross waterlogging. Gypsum may be needed to stabilisethe disturbed soil in the rip lines.
Costs of claying Costs vary on claying in Western Australia dependent on
the type of machines used. Quotes of about $150-200 perha have been obtained for digging, carting and spreadingclay. The delving tine method may be similar in cost to deepripping, which is currently between $30 and $45 per ha.
The yield increases obtained by overcoming the waterrepellency would pay for the treatments in two years.However, it may be possible to integrate the costs of clayinginto other farm activities. For example, there isconsiderable interest in preventing waterlogging on someshallow duplex soils by digging drains with road scrapers.The clay from these drains could be disposed of on thedeeper sandy rises where water repellency is a problem.
The benefits to both areas would pay very quickly,especially by creating more uniform land managementunits across the whole paddock. The benefits of claying lastabout 30 years.
THE WHEAT BOOK CHAPTER 9 – TILLAGE
191
CLAYING WATER REPELLENT SOILS (continued)
Further reading Farmnote no. 57/90 ‘Identifying gypsum responsive
soils’ (Agdex 514). Journal of Agriculture (1993). ‘Improving sustainable
production from water repellent sands’. Vol. 34, No. 4.

The level of stubble reduction of a seeder depends ona number of factors including the number of passes,machine type, stubble type and condition, and soil typeand moisture. The commonly used full-cut tine, offsetdisc or culti-trash seeders bury as much as 80% of thelupin stubble in the first pass. Such tillage can reducestubbles from a two tonne per hectare lupin crop with 30to 40% cover to less than 10%, even with direct drilling– well below levels required for adequate wind erosionprotection.
An extra tillage pass will not significantly affectthe percentage cover, because the stubbles have alreadybeen mixed with the top soil. Additional workings merelyturn the soil over, bringing some of the already-buriedstubble to the surface, and burying more. Rotary harrowshad little effect on maintaining ground cover, however ithas been observed on heavy soils that rotary harrowsare more effective at leaving wheat stubble on the surfacewhen the soil is dry or moist but not wet and the stubbleis dry.
Table 9.8 shows typical cereal stubble levels remainingafter seeding with a range of machines. The amount ofstubble remaining on the surface will vary with machineand stubble type and location. They contrast with those forlupin stubbles in the northern agricultural area of WesternAustralia; the percentage of stubble buried in the northernagricultural area is higher. In many cases the traditionalseeders, even with direct drilling, may not leave enoughcover for adequate protection against wind erosion. Eachgrower should make an independent judgement about theperformance of the particular seeders used, and ensuresufficient stubble is left on the surface to minimise the riskof erosion.
Paul A Findlater and Glen PRiethmuller
To control wind erosion about 50% of the surfaceshould be covered with prostrate stubbles. If plant residuesare detached or easily blown by the wind, for example, peastubbles, then much higher levels are required for winderosion control. If the stubbles are standing then as little as20 to 30% cover is required to reduce the risk of erosion,because the standing stalks greatly reduce the wind speed atthe soil surface.
No-till sowing, if used correctly, will minimise winderosion. It aims to maintain ground cover and reduce soildisturbance, so is well suited to controlling wind erosion.However, some no-till seeders may push the stubble flushwith the soil surface; this will reduce its effectiveness againstwind erosion.
Some no-till seeders bury as little as 10% of the stubbleand leave many of the stalks standing, providing evengreater protection against wind erosion. Under theconditions of a trial at Wellstead in 1993, no-till tine seederstended to bury more stubble than no-till disc seeders (Table9.7). However, some no-till disc seeders will bury significantproportions of dry lupin stubbles in sandy soils.
In relation to controlling wind erosion, little advantageis gained from using a no-till seeder if, either as a result ofover-grazing or burning, the pasture or stubble residue isalmost non existent. After seeding, the surface will stillremain loose and exposed – particularly some grey sandsand soils which do not form a crust after rain. The cost perdrill row of no-till disc seeders may be greater thanconventional seeders, but the advantages must be weighedagainst the cost of erosion.
CHAPTER 9 – TILLAGE THE WHEAT BOOK
192
MACHINERY FOR STUBBLE RETENTION AND WIND EROSIONCONTROL
Treatment Total stubble Standing stubble(% cover) (stalks/m2)
Before After Buried Before After % reductionTined seedersNo-till knife points 81 26 55 8 1 89180 mm row spacingNo-till Conserva-Pak® 76 30 46 14 5 64225 mm row spacingNarrow points 81 35 46 11 1 88360 mm row spacingDisced seedersCross-slot® 83 67 16 8 2 76Biomax® 80 76 4 6 5 23Germinator®Great Plains® 77 80 -3 9 5 46Great Plains® + wavy coulters 75 72 3 12 5 61Morris® double disc 83 79 4 9 5 45
Table 9.7 – Percentage reduction of ground cover in a cereal stubble for various no-till machines in one trial atWellstead in 1993

Table 9.8 – Surface reduction of cereal stubble byvarious tillage machines.
Implement Reduction of coverper working (%)
One-way plough 30 – 85Offset disc 50
Tine combine 50 – 60Culti-trash 75 – 80
Chisel plough (sweeps) 15No-till disc 0 – 20
Choice of a seederA decision for farmers considering adopting no-tillage
practices concerns the choice of machinery as stubblehandling at seeding is a major consideration.
Disc machines handle stubble fairly well and are ideallysuited to light soils that are prone to wind erosion.However, they are not as versatile as tined machines whichcan be easily reconfigured for a variety of soil and cropconditions. Chemicals that need to be incorporated alsopresent a difficult challenge with this type of machine.
Tine machines are less able to cope with stubble thandisc seeders. Successful use of these seeders in a stubbleretention system requires preparation of stubble at harvest,which may cost more in time and wear on the header.However, they have the ability to use points of differentshape and size to match a range of requirements for soildisturbance and fertiliser placement. Wider row spacingsimprove the stubble handling ability but wheat yields maybe reduced.
There is a range of new machinery or conversions forexisting machinery available for farmers contemplatingretaining their stubble. Farmers can choose the most costeffective machine for their particular environment, soiltype, cropping area and budget.
Seeding into poorly managed wheat stubble can be aproblem especially if heavy sheep grazing is not an option.Seeders have been developed that handle stubble but eventhese will not perform where the stubble has been managedpoorly. Good stubble management begins at harvest,which then avoids problems at seeding. Some options aredescribed below, as well as ways of handling stubble beforeor at seeding time.
Disc seedersThe first triple disc seeders consisted of a leading
coulter set in line with the direction of travel. This openedthe soil and a paired or double disc followed which cut agroove in which the seed was placed. These machines werenot particularly successful. One of the biggest problemswas that in soils with 10% or more clay (that is, loams andclay loams), the slot was left open and seed was eitherdroughted or flooded. Emergence and crop yields wereunreliable and often poor.
THE WHEAT BOOK CHAPTER 9 – TILLAGE
193
MACHINERY FOR STUBBLE RETENTION AND WIND EROSIONCONTROL (continued)
Later triple disc machines have a furrow-following presswheel, which controls the depth of the double disc andcloses the furrow by placing soil over the seed.
Some recent triple disc seeders used in WesternAustralia have replaced the plain leading coulter with awavy disc. This is self-sharpening and cuts through stubbleresidue as well as disturbing some soil in a narrow slot. Theslot of disturbed soil leads to better seed-to-soil contact andhas the potential to control or reduce the incidence ofRhizoctonia bare patch disease (Farmnote No. 68/96 Cropdisease and no-tillage farming).
However, in particularly loose sandy soils or soft wetsoil these coulters may be unable to cut stubble and insteadpush it into the soil in a folded form (“hair pinning”).Stubble pressed into the seed furrow may cause pooremergence from preventing adequate seed-to-soil contactand drying of the seed zone as well as toxins from thestubble reducing emergence.
Modern triple disc seeders are more solidly constructedthan the original triple disc machines and penetration onfirmer soils is improved. However, even though usingcoulters with deeper waves can increase the amount of soildisturbed, the amount of disturbed soil may still be lessthan adequate. For example, some soils may need moredisturbance than others or fertiliser may be better placedbelow the seed (Farmnote No. 71/96 ‘Banding fertilisers inno-tillage farming’).
One innovation to increase the amount of soildisturbance is an angled coulter. This has been usedsuccessfully to place the fertiliser below the seed and thusavoid or minimise adverse fertiliser toxicity effects,particularly in no-tillage seedbeds.
These machines are quite expensive per unit width butoffsetting this cost is the advantage they have in handlinghigh stubble levels.
Chaff spreaders on the headers are essential to reducethe depth of stubble and spread any weed seeds evenly.
Disc seeders may have a problem of clay soil sticking tothe discs but if the sowing time can be adjusted to avoidvery wet clay there should be few problems.
In stubble retention systems, discs generally providetimely untroubled seeding, which improves the chances ofobtaining higher yields and profits.
Tine SeedersFor tined seeding machines to operate effectively in
stubble, management of the stubble at harvest is essential.Six-bar combine seeders and modern multi-bar air
seeders have been designed to handle higher levels ofstubble. The tine spacing on each bar is greater; allowingappropriately managed stubble to flow between the tines.
Stubble length rule of thumbA rule of thumb to allow tined seeders to operate
efficiently in stubble is as follows:Reduce the length of all standing and cut stubble to

performed as close to seeding as possible to reduce erosionrisks. However, stubble management at harvest mayeffectively allow seeding to proceed earlier without theneed for burning.
Stubble management at harvestThe first option is to reduce the height of the standing
stubble. Mounting a second cutter bar just below andbehind the header front can do this. The straw that passesbelow the header front is cut in half by this second cutterbar. Reducing the straw length after harvest with a moweror slasher is not always successful due to the long stubblepushed over in the header wheel tracks not being cut.Slashing can also be a fire risk, particularly if stones arepresent.
A second cutter bar removes the need to take largequantities of straw through the header, making it ideal forheaders that do not have the capacity needed for the optionof cutting low, and chopping and spreading the straw andchaff. However, availability, reliability and header warrantyissues are a problem.
Harvesting at an angle to the seeding direction can alterthe distribution of straw that confronts the seeder thefollowing season. This means that a smaller amount ofuncut straw, compacted by the header wheels, enters theseeder at any one place and may allow a better chance ofgetting through the stubble.
Another way to leave short standing stubble is to cutlow and then chop and spread the straw and chaff with theheader. The ability of the header to do this depends on itspower and capacity. The extra bulk of material that mustpass through the header and the extra attachments neededlimit this option to larger headers with open fronts.However, if only those paddocks that are to be sown intostubble are treated this way it still may be the best option.Also weed seeds may be collected if a catcher bin isattached.
Headers use two types of threshing system, rotary andconventional. Rotary headers tend to break up the strawduring threshing. The straw passes around the threshingdrum more than conventional headers do before it isdischarged. An attachment to chop up the straw further ona rotary header may not be necessary in light crops. Strawand chaff spreaders are necessary to spread it evenly acrossthe width of the cut.
Headers with a conventional threshing system do notbreak up the straw during threshing so chopping andspreading attachments are necessary.
Another option is to leave the straw in the header trailand then baling the straw. This option may only be suitablewhere a market for the straw is available but it is a goodoption where very large amounts of stubble are present –particularly if canola is to be sown into the stubble.
Straw chopping attachmentsStraw choppers consist of a series of blades, mounted
half the smallest clearance distance in the seeder andall the cut stubble and chaff should be spread evenly.This distance is between the nearest tines in anydirection and can be much less if large seed boots orpress wheels are attached to the tines. This clearancedistance also includes between the underframe andthe soil surface with the seeder in the soil at workingdepth.The traditional tined seeders were for primary or
secondary tillage with seeding being done only after someform of tillage. As direct drilling and then no-tillage cropestablishment in retained stubble were adopted, the needfor a primary tillage machine was reduced and seeders hadto be more robust. The tine tension or tine break-outpressure generally increased to ensure the tines penetratedfirmer, undisturbed soil. Around 100 kilograms tine break-out force and higher is now generally required for one-passno-till sowing, particularly if some disturbance below theseed is required.
The next problem faced by tined seeding machines wasthe need to handle potentially large quantities of stubble.Some of the methods used to cope with stubble areoutlined below.
Increase the clearance between tines by using wider rowspacing, wider bar spacing or more bars on the seederand higher underframe clearance tines, such as chiselplough tines. Cut or move the stubble away from in front of the tine. Use a rotary harrow to spread out stubble lumps andlevel the seed bed.
Burning optionsThe use of ‘hot’ burns (a running fire in hot weather)
to manage stubble in the Western Australian wheatbelt isnot generally advisable. All the stubble is burnt, allowingfor trouble free seeding, but the soil is left very vulnerableto wind and water erosion. However, if herbicide resistantweeds are a problem it may be a part of a management planto reduce the weed numbers.
‘Cold’ burns (partial burning of the stubble in coolerweather) are commonly used to reduce the level of stubblein a paddock before seeding. Cold burns can take anumber of forms including fire harrowing strips in thepaddock or burning the header trail only in light stubblelevels. This is an effective way of reducing stubble levels,but it could easily get out of hand and become a ‘hot’ burn.Burning canola windrows left unspread by the header mayhelp reduce the number of herbicide resistant weeds, as thetrail burns very hot.
Raking with a stubble rake and burning the windows iseffective in reducing the level of stubble on the paddock,but if not carefully controlled, could also become a hotburn. It is generally best to burn the windows at night andhave all the fire put out before morning as winds generallypick up and could burn the whole paddock.
Burning operations to manage stubble must be
CHAPTER 9 – TILLAGE THE WHEAT BOOK
194
MACHINERY FOR STUBBLE RETENTION AND WIND EROSIONCONTROL (continued)

on a horizontal rotating shaft. The moving blades interactwith a static series of knives to chop the straw into 50 to100 mm lengths and spread it behind the machine.
Straw choppers are also mounted under the rear hoodof the header and may be swung out of the way for serviceaccess or to lay the straw in a window if desired. Most strawchoppers do not spread chaff; an extra chaff spreadingattachment is required for this.
Straw choppers have high power requirements – up to22 kW (30 hp). If it is attached to a header whose primemover lacks sufficient extra power to drive them,substantial reductions in capacity may be expected.Reductions of up to 14 per cent have been measured. Firehazard potential may be increased when using theseattachments due to the extra quantity of fines around theheader.
Chaff spreadersChaff spreaders usually consist of a pair of counter-
rotating discs with cleats mounted under the sieves tospread the chaff. Most header manufacturers have theseoptions for their machines. There are also a number offarmer-made spreaders that are easily constructed.
They use very little power and are necessary on all typesof headers to spread the chaff. If the chaff is left in theheader trail, it can concentrate the weed seeds and thedense chaff makes chemical weed control more difficult.
SummaryTo control wind erosion about 50 % of the surfaceshould be covered with prostrate stubbles.If the stubbles are standing then as little as 20 to 30%cover is required to reduce the risk of erosion.Some no-till seeders bury as little as 10% of the stubbleand leave many of the stalks standing, providing evengreater protection against wind erosion.There are a number of seeding machines available thatare capable of handling stubble. Disc machines handlestubble fairly well and are ideally suited to light soilsthat are prone to wind erosion. However, they are notas versatile as tined machines which can be easilyreconfigured for a variety of soil and crop conditions.These machines will only function effectively if thestubble has been well managed at harvest.Burning stubble options are not generallyrecommended. However, carefully controlled coldburns or raking and burning are accepted means ofreducing the stubble level. Burning header trails canalso reduce the weed seed bank especially with canolaheader trails. Stubble management at harvest is thepreferred option.Baling the straw is very useful if a market is available.Harvesting at an angle to the normal seeding directionmay increase the stubble handling capacity of theseeder.A second cutter bar mounted below the header front toshorten the stubble successfully reduces stubble length.
THE WHEAT BOOK CHAPTER 9 – TILLAGE
195
MACHINERY FOR STUBBLE RETENTION AND WIND EROSIONCONTROL (continued)
Cutting low and chopping and spreading the straw isgenerally restricted to headers with sufficient powerand capacity.Rotary headers may not require straw choppers in lightcrops, but straw and chaff spreaders are still necessary.Conventional headers need a straw chopper to chopand spread the straw.Chaff spreaders are necessary on all types of headers formost conditions.
Further reading“Managing for stubble retention” by Linda Leonard,
Department of Agriculture, Western Australia, bulletin4271, September 1993.
Riethmuller, G.P. and Amjad M. (1996). Farmnote70/96 Machinery for no-tillage sowing into wheat andlupin stubble.
Findlater, P.A. and Riethmuller, G.P. (1996). Farmnote61/90 No-till sowing machinery to control wind erosion.
Brown, A.G.P. (1996). Farmnote No. 68/96 Cropdisease and no-tillage farming.
Jarvis, R.J., Mason, M.G. and Bolland, M.D.A.(1996). Farmnote No. 71/96 ‘Banding fertilisers in no-tillage farming.
Kondinin Group “The Reapers Digest” revised edition1993.
Moore, G., Needham, P., Findlater, P., and Carter, D.(1993). Wind erosion: monitoring the paddock status.Farmnote No 45/93, Agriculture Western Australia.
Anon. (1994). ‘Farmers improve stubble management’.Farming Ahead, Kondinin Group No 25, January.
Carter, D. (1994). Stubble needs for reducing winderosion. Farmnote No 87/94, Agriculture WesternAustralia.

sandy soils (eg. Wongan loamy sands) may requireoccasional deep ripping, even in a no-till system. In sandysoils, no-till with stubble retention minimises wind erosionand where it leaves furrows, makes water harvesting easierin water repellent soils.
In clayey and loamy soils, no-till minimises run-off anderosion by water and improves soil structure. In dispersiveloamy or clayey soils, no-till with stubble retention reducessplash erosion as rain drop impact is minimised. No-till isexcellent for soils that slake and / or disperse and formsurface seals or crusts or set hard on drying, as well as forcracking clay soils. These “Sunday soils” have a narrow-moisture-cultivation range and no-till allows early sowingand better trafficability when soil moisture is optimal.
Some soils with clay contents greater than a loamy sandare prone to slaking and / or dispersion. Ideally, heavy soilsshould be no-tilled and grazing should be eliminated whenthe soil is wet. Biological soil improvements are still notwell understood, yet their impact is often obvious afterthree or more years. Retention of stubble has majorbenefits in increasing microbial activity, some of whichsuppresses rhizoctonia and ‘take-all’ when a new microbialspecies equilibrium is reached after a few years of no-tilling.Heavy stubble can also suppress crop growth particularly inthe initial years of no-tilling.
Pre-season preparationGood no-till starts years earlier with clean and diverse
crop rotations. A good crop sequence reduces yieldrestrictions from pests and diseases and lessens the relianceon pesticides. By controlling weeds, which are hosts todiseases, problems with both weeds and diseases arereduced. However, the year before seeding good stubblemanagement is also essential. The need to retain stubble,for soil and soil-life benefits, is shown by the results of along-term experiment (Table 9.10) conducted at Merredinon a heavy (sandy clay loam) soil.
Table 9.10 – The effect of row spacing and stubbleretention on soil properties and yield of wheat in 1995on a heavy soil (after 9 years of the experiment).
Stubble burnt Stubble keptOrganic carbon (%) 1.01 1.11
PH (CaCl2) 5.5 5.6
Water stable aggregates (%) 11 18
Bulk density (g/cc) 1.61 1.57
Protein (%) 1.61 1.57
Harvest yield (t/ha) 3.29 3.76
In order for tined machines to seed through stubble,the stubble will need managing. Many farmers have optedfor wider row spacings to overcome this problem. Cuttingthe straw short and spreading it evenly improves residue
No-till is sowing a crop without prior cultivation andwith very little soil disturbance at seeding. There are severalterms that have evolved in Western Australian agriculture.The main useful tillage terms from most to least cultivationare: • multiple tillage – replaces “conventional”, as the
convention has changed• reduced – one pass prior to seeding with a full cut-out• direct drilling – one pass seeding with a full-cut• no-till – narrow/knife point seeding with less than full
cut-out• zero-till – disc seeding.
The term ‘minimum tillage’ is confusing as it can meanall of the above except multiple tillage and therefore itshould be dropped.
AdvantagesNo-till with retained stubble has the potential to
improve soil properties and increase sustainability. It cando this by lifting and modifying soil biological activitywhich gives excellent improvements in all aspects of soilfertility, being, physical, chemical and biological. Theseimprovements lead to better farm management andsustainability. The main benefits of no-till, withappropriate agronomic management, include;
• almost no soil erosion through stubble retention andproper grazing management (especially in sandy soils)
• greater flexibility of farm operations through less timeused at seeding and improved soil structure leading tobetter trafficability, more manageable soils and moretimely seeding and other operations
• more precise seed placement with more even cropemergence, if seeded at correct moisture content
• more water harvested to grow the crop in dry areas• often less in-crop weed emergence and safer use of
trifluralin herbicide for weed control• less labour, fuel and machinery costs per hectare• consequently, better whole farm profitability and
sustainabilityNo-till with stubble retention increases soil organic
matter and biological activity.
PreparationProfitable no-till cropping requires excellent crop
agronomy. This is because “tillage covers a multitude ofsins”. Tillage has been used for thousands of years to killpests (particularly weeds), reduce diseases and soften thesoil for fast root growth and nutrient release. Whenadopting less tillage we need to manage these factors byother means. Rotation of crops is the principle tool thatmust be used for effective no-tilling.
SoilAll soils can be no-tilled however some compactible
CHAPTER 9 – TILLAGE THE WHEAT BOOK
196
NO-TILL

flow. On sandy south coast soils, discs may have to be putin front of tines to improve flow. For this reason manyfarmers have opted for disc only machines in theseenvironments. When the break to the season occurs, ifweeds become well established much higher rates ofknockdown herbicides are needed as no-till does notprovide a second knock effect on the weeds as tillage does.
Seeders
TinesA cheap and easy option for no-till beginners. Tine
break-out needs to be at least 90-150 kg per tine and it canthen be fitted with any of several knife or inverted T points.With combines, the boxes may need to be raised or ablower fitted to allow wide spaced tines (70cm betweenbars, 70cm under frame). Knife points with wider rowspacings (>220 mm) can be an effective tool to fightherbicide resistance because it allows more effective use oftrifluralin which is lightly covered by fine soil throw acrossthe inter-row, provided no soil is thrown into the adjacentfurrow. Wider rows also reduce residue handling problems,capital costs, cost of wearing parts, draft, tractor size andfuel use. However, cereal yields can sometimes be slightlyreduced with wider rows (see Table 9.11) but the abovebenefits may out-weigh the negatives.
DiscsDisc seeders have the advantage that they can seed
through a large amount of residue (with some pinning),give accurate seed placement (important in marginalmoisture conditions), disturb very little soil (reducing weedemergence and conserving moisture), require less draft(with savings in tractor size and life and fuel costs) and willnot rip rocks up. However, it will increase the risk offertiliser toxicity (unless the seed and fertiliser areseparated). A wavy or turbo disc placed before double discseeders is mostly beneficial as most soils require disturbancebelow seed placement depth. However, care must be takenwith discs to avoid smearing in wet clayey soils. Newresearch on improved disc seeder designs, which cancultivate like knife points, but handle stubble better,
THE WHEAT BOOK CHAPTER 9 – TILLAGE
197
NO-TILL
suggests there are no yield penalties for replacing a deepworking knife point with a deep working undercut disc.Capital and running costs of disc machines are no greaterthan ‘high-tech’ tine seeders.
Soil disturbance (3-10 cm) below the seed gives quickroot growth and early vigour in sandy soils and can beachieved with discs or tines. In clayey soils, shallowworking points reduce draft, give better depth control,fewer clods, more even establishment and improve theability of crops to compete with weeds. Under-seeddisturbance reduces rhizoctonia, which is a problem insome sandy soils. Point type does not seem to affect yields.Inverted-T points are not likely to increase yield over knifepoints in Western Australian soils and seeding conditions,as their action differs very little.
Rotary harrows improve soil cover over the seed andincorporate chemicals but also encourage more weeds togerminate. Press-wheels reduce seed depth variation, andon moist clayey soils, often assist slot closure. Press-wheelsare useful on very sandy soils and on drying soils, especiallywhere clods form, to assist with even seeding depth,improve seed-soil contact, and assist moisture flow throughthe soil to the seed, particularly on non-wetting soils.
Seeder Set-upCare should be taken in setting up the seeder to ensure
that seed depth is even across the width and between frontand rear rows, and that seeds are adequately covered. Thesetting up should be done at the proposed operating speed.Soil type and moisture content variations will vary the soilthrow, so performance should be checked in the paddockwhen conditions change.
Fertiliser management
NitrogenMuch of the N used by non-legume crops comes from
crop residues and soil organic matter as they break down inthe soil. No-till reduces the rate of this breakdown. In thefirst few years of no-till, the amount of N released will bereduced. However, as organic matter builds up, thebreakdown will come back into balance with the rate of
Table 9.11 – Wheat yield average for 1988, 89, 90, 91, 93, 95 (t/ha)
Row spacing (mm) Stubble burnt Stubble kept Average % of 180mm
90 2.29 2.33 2.31 101.3
180 2.23 2.33 2.28 100
270 2.21 2.20 2.20 96.5
360 2.10 2.17 2.14 93.7
Average 2.21 2.26
% of average 97.7 100
Source: Riethmuller GP, Agriculture Western Australia, Merredin.

The precision placement of the crop with no-tilling,while leaving weed seeds on the surface, also provides anexcellent window for Spray.Seed® use as cereal crops areemerging after most weeds. If Diuron has been applied, donot use this method if the cereal seedlings have emerged.Severe crop damage can occur.
Trifluralin with knife point sowing has increased theeffectiveness of this herbicide dramatically. Howeverrotation of this herbicide group is essential to avoidresistance. Weeds around the world have developedresistance to trifluralin. Take care with post plant/preemergent application of soil active herbicides such asdiuron. Sufficient soil (> 20 mm depth) needs to cover theseed to protect it from these herbicides.
Keeping the weeds “off balance” by not having a regularshort rotation of herbicide types and crops will reduce theirsuccess in farming systems. Increasing the variability of thefarming system can include green manure crops,opportunity summer crops, lucerne pasture and phasedpasture-crop rotations. Harvest weed seed managementwith narrow header trails that maybe either sprayed orburnt are tools which can be used. Likewise, croptoppingshould be considered in legumes. Yield reductions canoccur with croptopping if the application is compromisedby weather or timing or weed maturity.
Under a no-tillage farming system, if good rotationsand weed management strategies are in place, a reductionin total weed numbers will occur. However, a differentweed spectrum could emerge. Remember that the biggestinfluence on weed burdens is crop rotation, followed byherbicides and then tillage.
DiseasesNo-tilled crops can grow slowly and be susceptible to
seedling diseases as they are growing in firm soil where onlysmall amounts of N are released. Again, diverse croprotation is the key. Keeping a high legume component inthe rotation also ensures better N availability. Retainingstubble increases crop exposure to diseases later in theseason. This risk is minimised by crop diversity and usinga high proportion of legumes that increase soil organismsthat digest and recycle the stubble.
Rhizoctonia bare patch is one disease that is morecommon with no-tillage. However, experience in SouthAustralia, Esperance and Canada is that retaining stubblewithout stock grazing causes the disease to abate after 3-6years. Even with severe rhizoctonia in these first few years,which has occured on the south coast, the damage has beengreatly reduced with knife points working at 8 cm deep.
InsectsNo-tilled crops usually have slower early growth and
are therefore more susceptible to early insect damage.Lucerne flea and red legged earth mite will often damageno-tilled crops. Addition of insecticides with the
organic addition and the amount of N released will returnto that of the old system. The build up of organic matter islikely to be greater and may take longer in heavier than inlighter soils, so more N should be used in those soils in thefirst few years of no-till.
It is advisable to apply some N at seeding as Navailability is slow early in the season under no-till. Avoidtoo much urea (<15 kg N / ha & nil for Canola) orammonium fertiliser with the seed or under the seed inwarm, moist conditions, especially in alkaline soils, asvolatilised ammonia is toxic to germinating seedlings.
PhosphorusThere is no change to phosphorus fertiliser rates.
MicronutrientsLittle work has been done with the placement of
micronutrient fertilisers with no-till. We do not know howincreased soil biology might affect applied nutrients.Micronutrients are physically immobile in the soil andmove very little (2-3 cm) from where they are placed withthe P or NP fertilisers. Their plant availability may largelydepend on them being mixed through the soil volume.Therefore, with no-till, the aim is to have as manymicronutrient particles spread through the soil volume aspossible. This may mean applying them at a lower thanrecommended rate through several seasons.
Seed fertiliser dressings may also increase the number ofparticle sites but low rates need to be used as seedlinggermination may be affected. In years where the low ratesare used, tissue testing and foliar application may beneeded. Another possibility is to mix micronutrients withcompatible chemical sprays.
WeedsSuccessful weeds are adapted to survive in our farming
systems. Each new method of growing crops willencourage some weeds, while others that are unable toadapt to the change becoming less important. No-till issuch a major change. Benefits of these changes need to beexploited, but weeds that are well adapted to the newsystem must be watched out for and managed. Mallow isone such weed. Perennial weeds can be expected to becomemore of a problem. Weed seeds that do not self plant andso remain on the soil surface are exposed to a more hostileenvironment. Numbers may deplete steadily.
Weed control within no-till systems is highlydependent on herbicides and their timing. As such, care isneeded to manage the weeds so that total predictablecontrol is achieved of all growing weeds before planting.Robust rates of the knockdown herbicides are required andwhere necessary several applications may be needed. Utilisethe double knock effect of glyphosate followed bySpray.Seed®. Additives such as Goal® for mallows should beused where necessary.
CHAPTER 9 – TILLAGE THE WHEAT BOOK
198
NO-TILL

knockdown is sensible insurance against insects. Retainingstubble with no-till helps repel aphids but may attractother pests at seeding and in the swathed rows. Falsewireworm has become a problem with south coast canolacrops, which seems to be more severe with disc zero-tillseeding. Using Lorsban® at 750 mL/ha in southernVictoria, with a trifluralin application has given effectivecontrol.
THE WHEAT BOOK CHAPTER 9 – TILLAGE
199
NO-TILL

CHAPTER 9 – TILLAGE THE WHEAT BOOK
200
NO-TILL
Chapter Coordinator: R. LoughmanWheatbook 1 Authors: R. Loughman, G. MacNish and W. McLeodRevised by: R. Loughman, D. Wright, W. MacLeod, J. Bhathal, D. Thackray.
Leaf disease ....................................................................................................203Principles of management ..................................................................................203Introduction ...................................................................................................... 203Rotation ............................................................................................................203How disease originates ......................................................................................203Initial effects of early sowing on disease ............................................................203Crop development and re-infection ..................................................................203Varietal maturity ................................................................................................204Disease resistance ..............................................................................................204Seasonal influences ............................................................................................204Chemical control ..............................................................................................204Other agronomic factors ....................................................................................205
Occurrence, recognition and control ............................................................206Septoria nodorum blotch ..................................................................................206Septoria tritici blotch ........................................................................................207Yellow spot ........................................................................................................208Barley yellow dwarf ............................................................................................209Wheat rusts ........................................................................................................211Wheat stem rust ................................................................................................212Leaf rust ............................................................................................................213Wheat stripe rust ..............................................................................................214Wheat smuts ......................................................................................................215Bunt (covered smut) ..........................................................................................215Flag smut ..........................................................................................................215Loose smut ........................................................................................................215Other diseases of wheat ......................................................................................216Powdery mildew ................................................................................................216Ring spot ............................................................................................................216Downy mildew ..................................................................................................216Ergot ..................................................................................................................216Ear cockle or seed gall nematode ......................................................................216
THE WHEAT BOOK CHAPTER 10 – DISEASES
201
CHAPTER TEN
DISEASES

CHAPTER 10 – DISEASES THE WHEAT BOOK
202
Root disease ..................................................................................................217Principles and management ................................................................................217
Introduction ....................................................................................................217Rotation ..........................................................................................................217Tillage ..............................................................................................................217Seasonal influences ..........................................................................................218Soil type ..........................................................................................................219Nutrition ........................................................................................................219Host resistance ................................................................................................219Chemical control ............................................................................................219Take-all ............................................................................................................220Rhizoctonia bare patch ....................................................................................222Fusarium crown rot ........................................................................................223Root lesion nematode ......................................................................................224Cereal cyst nematode ......................................................................................226Common root rot ............................................................................................227Pythium root rot ..............................................................................................228

Principles of managementLeaf diseases are a universal phenomenon in Western
Australian wheat crops. Their occurrence, severity andimpact vary across regions in response to management andseasonal conditions. Rapid disease build-up and evenspread within crops are general features of the biology andlife cycle of most leaf diseases which undergo severalinfection cycles in a season and are readily dispersed in airor wind blown rain splash.
Management requirements vary with disease risk andpotential for damage. Cropping practices are undercontinual development and several of them, such as earlysowing, optimal nutritional management and increasedstubble retention, can result in increased disease pressures.
Most wheat leaf diseases only attack wheat. Thisnarrow host range assists in disease management optionsbut the capacity of many leaf diseases to develop quicklyunder favourable conditions means that combiningstrategies that reduce risk of losses is usually required foroptimal management. Integrating leaf disease managementoptions is the key to successfully minimising effects of leafdiseases of cereals.
RotationCommon leaf diseases such as septoria blotches and
yellow spot survive and spread from infected stubbleresidues. One of the many advantages of crop rotation isthat infected stubble residues are separated from thecurrent crop, thus reducing disease risk. Separation ofcrop from disease source occurs both in space and time.
Without rotation a second wheat crop is placed inclose proximity to the diseased stubble from the previouscrop. This guarantees that disease spread into the currentcrop is early and possibly severe unless stubble is removed(thoroughly burnt or ploughed in). For this reason croprotation is an important facet of stubble retentionsystems.
In a 1:1 rotation, the next wheat phase of the rotationis established 18 months or more after the harvest of theprevious wheat crop. This time period is important inallowing the breakdown of the infected stubble residues.
Even in 1:1 wheat-lupin rotations where stubble isretained only about 5% of wheat residue remains after thesowing of the return wheat crop. This remaining residueis less infective than fresh residues that have survived forjust one summer. The overall effect of reduced quantityand infectivity of residues after rotation is that theyinduce little, if any, disease in most situations.
How disease originatesThe fungi that cause leaf spot diseases such as septoria
and yellow spot survive in stubble and become active in theautumn, producing spores as the season opens. Most ofthese spores are dispersed short distances so double-cropped wheat can be infected severely.
Rotated crops avoid severe early disease but still becomeinfected because other spores, dispersed long distances, areable to infect crops far away. This type of infection isusually mild initially, but provides an infective base fromwhich the disease can increase as the season progresses ifconditions are suitable.
Rust fungi require green living hosts to survive. Sporesof wheat rust diseases produced on oversummering hostplants (mostly wheat) are also spread by wind to new wheatcrops.
The earlier disease originates in a crop and the intensityof this early infection are important determinants of howsevere the disease becomes as the crop grows.
Initial effects of early sowing on diseaseWhile all wheat crops are subject to airborne spores
from remote sources, early sown crops are exposed toinfection before later sown crops, giving disease a headstart.
In April and early May sown crops the initial infectionsdevelop in mild autumn conditions allowing the fungus tomature quicker than in later sown crops whose initialinfections develop in the colder winter months.
Early sown crops have greater initial disease becausethey have been exposed to more infections than later sowncrops and these infections have been able to advancefurther before the winter sets in.
Moderate to severe leaf disease in young wheat cropscan reduce early growth, but leaf disease of wheat in arotation, which included legumes or oilseeds, would notgenerally be severe enough to significantly affect earlygrowth.
The importance of disease in the early stage is as asource of infection later in the season.
Crop development and re-infectionUntil late stages of stem elongation each stem produces
new leaves continuously. Although disease spreads onto thenew leaves, low levels of disease do not have a significantdirect effect on yield. Disease progresses up the plantgradually as spores produced on lower leaves spread thefungi to newer leaves.
Plants may appear to outgrow the disease after winteras stems elongate and leaves develop rapidly. At this timethe rate of development of new tissue exceeds the rate ofdeath from new infections. However, this is a transitoryphase. Infection will continue to develop after the plant hasstopped producing new leaves and the disease will be ableto ‘catch up’. It is at this stage that most of the differencesin disease development between early and later sown cropsoccur.
The top two or three leaves on the wheat stem arecrucial for grain production. Once produced they mustremain green for as long as possible to ensure the plantcompletes grain filling.
From the moment the upper leaves are unfurled theyare exposed to infection. The third top leaf (the second
THE WHEAT BOOK CHAPTER 10 – DISEASES
203
LEAF DISEASE

resistant wheat will develop some disease but normally therate of disease development will be slowed to the extentthat disease effects on yield will be comparatively small.
Compared with susceptible varieties of similarmaturities, the use of resistant or partially resistant wheatswill significantly reduce the risk of yield losses from adisease. A variety may still be attacked by other leaf diseasesfor which resistance levels are low or absent.
Seasonal influencesDisease activity is greatest during the spring period.
This period most suits fungal diseases that grow best inwarm, highly humid or moist conditions. Sporeproduction is increased when leaves are moist and somespores, such as those of septoria diseases, require rain splashfor spread to new leaves.
Leaves must be wet for most fungal spores to germinateand infect (spores of powdery mildew require only highhumidity for infection). Moist conditions, particularlywarm moist weather, will favour disease development inthe spring period.
A year of particularly severe disease may result fromvery favourable seasonal conditions. This can result in veryhigh levels of inoculum carryover. Above average diseaserisk may occur in seasons following high disease years.
Cereal crop production has evolved around thecharacteristically dry summer conditions that are typical ofsouthern Western Australia. This period is critical to breakthe disease cycle of cereal rust diseases. Rust diseases rely onliving host plants and do not have a resting stage. Hostplants normally can not survive dry summer conditionsand hence rust carryover is normally very low with atraditional dry summer. Unusually wet summer conditionscan greatly increase risk of wheat rusts.
Chemical controlWhile disease is often present in younger crops, it is
only after the flag leaf emerges and the stem stopsproducing further leaf material that the disease has theopportunity to catch up and progress onto the critical
below the flag) is exposed and becomes infected before thesecond top leaf. The flag is the last to emerge and beexposed to infection.
In very early sown crops these leaves emerge in the latewinter / early spring when conditions are highly favourablefor infection. Showery weather encourages the productionand dispersal of spores from lower diseased leaves up on tothe healthy young leaves and mild humid conditions keepleaves wet for longer. Such conditions are ideal for allowingspores to infect.
The early infection of upper leaves of very early sownplants allows several cycles of sporulation and infection tobe completed on the upper leaves. Disease becomes moresevere with each cycle.
Crops sown later do not develop upper leaves until laterin spring. Diminishing showery conditions reduce the riskof significant spore dispersal to upper leaves and warmer,drier conditions reduce the extent of infections. Infectionis reduced to the extent that the flag and second leaf (theleaf below the flag) are only slightly affected.
These infections, occurring later, are not as able tocomplete as many cycles of sporulation and re-infectionbecause climatic conditions gradually become lessfavourable for disease spread.
Varietal maturityVariety influences disease development and impact
because of the different maturities and levels of diseaseresistance available. Early sowing has to be combined witha variety of appropriate maturity, and the degree to whichsowing time can be advanced will be partly determined bythe maturity of the variety chosen.
While early sowing will advance growth and increasedisease risk, choosing a later maturing variety can offset thedisease effects. The later maturing variety has a longervegetative period before head emergence which delaysflowering and grain filling to a time less favourable fordisease development (see Figure 10.1).
Disease resistanceDisease resistance reduces or eliminates the effect of
specific diseases, depending on the effectiveness of theresistance. Complete resistance, which is available for somediseases such as rusts, prevents disease occurrence. Partially
CHAPTER 10 – DISEASES THE WHEAT BOOK
204
LEAF DISEASE (continued)
M
S
S
H
H
A J J A S OMONTH
HIGH RISK LOW RISK
S: sowing
H: heading
High probability of disease losses
Disease losses less likely
Disease losses less likely
Early maturing / early sowing
Early maturing / late sowing
Late maturing / early sowing
S H
Figure 10.1
Sowing time and variety maturity affect disease risk.
1 2
20
0
40
60
80
100
3 4 5 6
Crop age (months)
Dis
ease
sev
erit
y
VS 30-59% loss
S 20-30% loss
MR 5-10% loss
R 0-5% loss✕
✕✕✕
✕✕
✕
Disease will develop earlier and more quickly on susceptiblecultivars compared to resistant cultivars (VS = very susceptible,S = susceptible, MR = moderately resistant, R = resistant) andyield losses can range from 0-30% or more.
Fig 10.2

THE WHEAT BOOK CHAPTER 10 – DISEASES
205
LEAF DISEASE (continued)
upper leaves. This can be early August in northern crops orlater in southern crops. Seasonal conditions determine howquickly this happens.
Seed dressings can control seed borne diseases and longacting seed dressings prevent very early build up of somediseases such as leaf rust. However seed dressings aregenerally ineffective in controlling disease increase at latercrop stages.
When disease levels increase in later crop stages themost profitable fungicide use is achieved by a single welltimed spray. The optimum timing is generally between flagleaf emergence and head emergence (Figure 10.3).Spraying will be most effective if done before the upper 2-3 leaves become diseased. Application to upper canopyleaves shortly after those leaves develop, protects the leavesfrom infection and slows the rate of disease developmenton those leaves.
Spray timing.
Figure 10.3
Depending on rates of application and disease severitythe protection delays disease development by 3-6 weeks.This maintains photosynthetic leaf area during grainfilling. Under conditions of severe disease development itmay be necessary to apply two sprays to slow diseasesufficiently. After head emergence (that is, flowering orlater) spraying is much less likely to be economic.
Other agronomic factorsSeeding rates and nitrogen nutrition are other factors
that can affect leaf disease in high yield situations.Increasing plant density through increased seed rates canchange the micro-climate within the crop which mayfavour leaf disease slightly.
Additional nitrogen, by favouring lush crop growth,generally favours leaf disease. However, reports on theeffects of nitrogen vary and prediction of disease behaviourin particular situations is not possible.
It is likely that the impact of these factors is smallerthan agronomic factors such as sowing date, varietalmaturity and resistance.
Headsseptoria nodorum blotchloose smutcommon buntear cocklecrazy top
Stemsflag smutstem rust
Crowntake-allfusarium crownrot
Leavesseptoria nodorum blotch,yellow spot, leaf rustseptoriatrilia blotch,barley yellow dwarf virus,powder mildewflag burnt, ring spot
Stem basefusarium crown rottake-all
Soil Level
Rootssecondaryprimary
Seedrhizoctonia,bare patch,take all, rootlesion nematodecereal cyst nematodepythium root rot
Sub crown internodecommon root rottake-all
Figure 10.4
Wheat plant parts and the diseases that develop and express onthem.
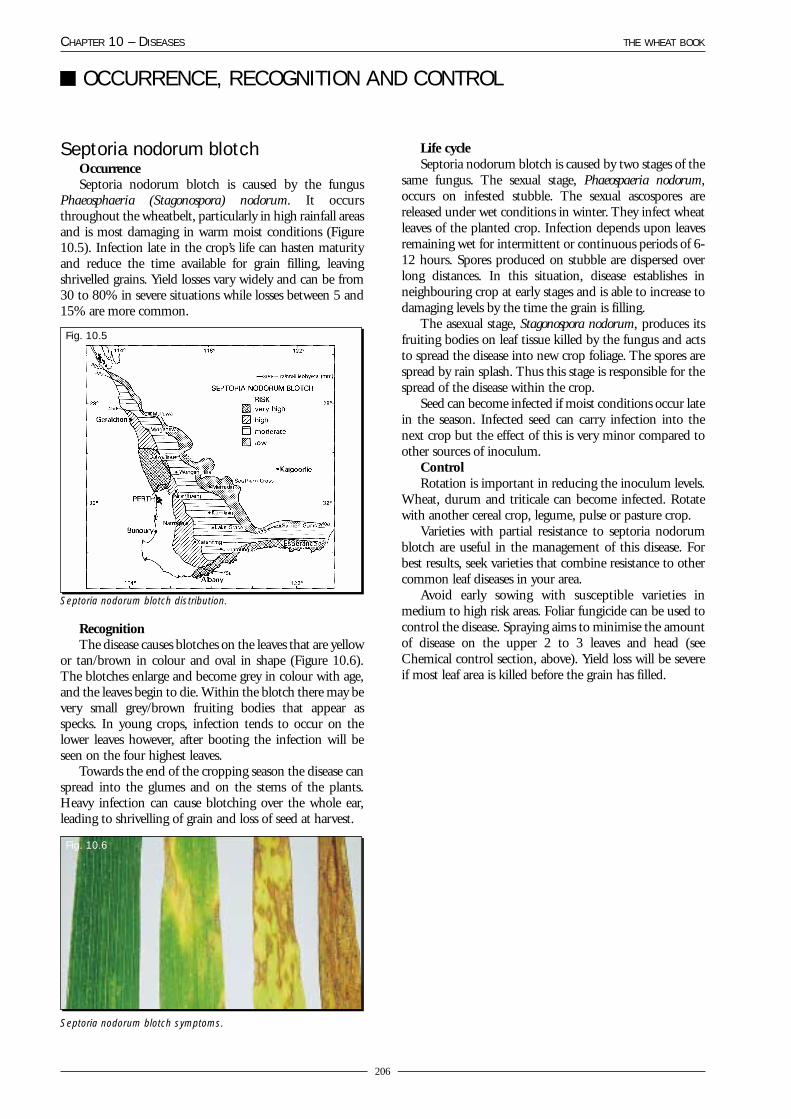
Septoria nodorum blotchOccurrenceSeptoria nodorum blotch is caused by the fungus
Phaeosphaeria (Stagonospora) nodorum. It occursthroughout the wheatbelt, particularly in high rainfall areasand is most damaging in warm moist conditions (Figure10.5). Infection late in the crop’s life can hasten maturityand reduce the time available for grain filling, leavingshrivelled grains. Yield losses vary widely and can be from30 to 80% in severe situations while losses between 5 and15% are more common.
RecognitionThe disease causes blotches on the leaves that are yellow
or tan/brown in colour and oval in shape (Figure 10.6).The blotches enlarge and become grey in colour with age,and the leaves begin to die. Within the blotch there may bevery small grey/brown fruiting bodies that appear asspecks. In young crops, infection tends to occur on thelower leaves however, after booting the infection will beseen on the four highest leaves.
Towards the end of the cropping season the disease canspread into the glumes and on the stems of the plants.Heavy infection can cause blotching over the whole ear,leading to shrivelling of grain and loss of seed at harvest.
CHAPTER 10 – DISEASES THE WHEAT BOOK
206
OCCURRENCE, RECOGNITION AND CONTROL
Fig. 10.5
Fig. 10.6
Septoria nodorum blotch distribution.
Septoria nodorum blotch symptoms.
Life cycleSeptoria nodorum blotch is caused by two stages of the
same fungus. The sexual stage, Phaeospaeria nodorum,occurs on infested stubble. The sexual ascospores arereleased under wet conditions in winter. They infect wheatleaves of the planted crop. Infection depends upon leavesremaining wet for intermittent or continuous periods of 6-12 hours. Spores produced on stubble are dispersed overlong distances. In this situation, disease establishes inneighbouring crop at early stages and is able to increase todamaging levels by the time the grain is filling.
The asexual stage, Stagonospora nodorum, produces itsfruiting bodies on leaf tissue killed by the fungus and actsto spread the disease into new crop foliage. The spores arespread by rain splash. Thus this stage is responsible for thespread of the disease within the crop.
Seed can become infected if moist conditions occur latein the season. Infected seed can carry infection into thenext crop but the effect of this is very minor compared toother sources of inoculum.
ControlRotation is important in reducing the inoculum levels.
Wheat, durum and triticale can become infected. Rotatewith another cereal crop, legume, pulse or pasture crop.
Varieties with partial resistance to septoria nodorumblotch are useful in the management of this disease. Forbest results, seek varieties that combine resistance to othercommon leaf diseases in your area.
Avoid early sowing with susceptible varieties inmedium to high risk areas. Foliar fungicide can be used tocontrol the disease. Spraying aims to minimise the amountof disease on the upper 2 to 3 leaves and head (seeChemical control section, above). Yield loss will be severeif most leaf area is killed before the grain has filled.

THE WHEAT BOOK CHAPTER 10 – DISEASES
207
OCCURRENCE, RECOGNITION AND CONTROL (continued)
Septoria tritici blotchOccurrenceSeptoria tritici blotch is caused by the fungus
Mycosphaerella (Septoria) graminicola. It occurs throughoutthe wheatbelt, but particularly south of Perth where thegrowing season is cooler (Figure 10.7). It is most serious inmild conditions and it becomes less active towards the endof the season except in cool areas. It rarely attacks headsand glumes. Yield losses vary widely and can be from 30 to50% in severe situations but losses between 5 and 15% aremore common.
Fig. 10.7
Septoria tritici blotch distribution.
Fig. 10.8
Septoria tritici blotch symptoms.
RecognitionThis disease causes irregular blotches that can be
elongated and not oval as in septoria nodorum blotch. Theblotches have a narrow yellow margin. Minute blackfruiting bodies can be seen in rows between the veins of theaffected leaf (Figure 10.8). In young crops, infection tendsto occur on the lower leaves, however, after booting theinfection will be seen on the four highest leaves.
Infection late in the crop’s life can hasten maturity andreduce the time available for grain filling, causing shrivelledgrains.
Life cycleSeptoria tritici blotch is caused by two stages of the
same fungus. The sexual stage, Mycosphaerella graminicola,occurs on infested stubble. The sexual ascospores arereleased under wet conditions in winter. They infect wheatleaves of the planted crop. Infection depends upon leavesremaining wet for intermittent or continuous periods of 6-12 hours. Spores produced on stubble are dispersed overlong distances. In this situation, disease establishes inneighbouring crop at early stages and is able to increase todamaging levels by the time the grain is filling.
The asexual stage, Septoria tritici, produces its minuteblack fruiting bodies on leaf tissue killed by the fungus andacts to spread the disease into new crop foliage. The sporesare spread by rain splash. Thus this stage is responsible forthe spread of the disease within the crop.
ControlThe use of rotations with other crops such as triticale
and barley, legumes, pulses and pastures will reduce thelevel of inoculum carried over in subsequent years.
Use resistant varieties as this reduces the inoculum levelwithin the crop and reduces the carryover on stubble fromone season to the next.
Avoid early sowing with susceptible varieties inmedium to high risk areas (this is dependent upon therainfall conditions for those areas).
Foliar fungicide can be used to control the disease.Fungicides are generally more effective at controlling thisdisease than septoria nodorum blotch. Spraying aims tominimise the amount of disease on the upper 2 to 3 leavesand head (see Chemical control section, above). Yield losswill be severe if most leaf area is killed before the grain hasfilled.

CHAPTER 10 – DISEASES THE WHEAT BOOK
208
OCCURRENCE, RECOGNITION AND CONTROL (continued)
Yellow spotOccurrenceYellow spot occurs throughout the wheatbelt but is
more serious north of Perth (Figure 10.9). Yield losses varywidely and can be from 30 to 50% in severe situations butlosses between 5 and 15% are more common.
Fig. 10.9
Yellow spot distribution.
Fig. 10.10
Yellow spot symptoms.
RecognitionThe disease starts as small areas of yellowing leaf tissue.
As the areas grow, the centre turns brown but the edgesremain yellow. Individual spots can vary in size or shape.When the lesions occur near the leaf tip or join the leafdries out and withers. In young crops, infection tends tooccur on the lower leaves. After booting the infection willbe seen on the four highest leaves (Figure 10.10). Thedisease can be severe at any stage of crop development.
Seed can become infected with the fungus in moistconditions late in the season. Severe yellow spot diseasecauses pink grain which affects crop marketability but doesnot carry disease into the next crop if used as seed.
Life cycleYellow spot is caused by two stages of the same fungus.
The sexual stage, Pyrenophora tritici-repentis, occurs oninfested stubble as indicated by the telltale appearance of itsfruiting bodies. These can be seen on infested stubble inautumn and early winter as black, raised, oval bodies aboutthe size of a pin head. In heavily infested stubble manyfruiting bodies are produced, making the straw feel likesandpaper. These release ascospores under wet conditions,which then infect wheat leaves of the planted crop.Infection depends upon leaves remaining wet for morethan 6 hours. Because spores produced on stubble aredispersed over short distances, severe disease usually onlyoccurs where wheat is double-cropped. In this situation,disease establishes in the crop at very early stages and is able
to increase to damaging levels by the time the grain isfilling.
The asexual stage, Drechslera tritici-repentis, producesits spores on leaf tissue killed by the fungus and acts tospread the disease into new crop foliage. They are spread bywind and rain splash. Thus this stage is responsible for thespread of the disease within the crop.
ControlRotation is important in reducing the inoculum levels.
Wheat, durum and triticale can become infected. Rotatewith another cereal crop or legume, pulse or pasture crop.
Varieties with partial resistance to yellow spot are usefulin the management of this disease. For best results, seekvarieties which combine resistance to other common leafdiseases in your area.
Avoid early sowing with susceptible varieties inmedium to high risk areas.
Foliar fungicide can be used to control the disease.Spraying aims to minimise the amount of disease on theupper 2 to 3 leaves and head (see Chemical control section,above). Yield loss will be severe if most leaf area is killedbefore the grain has filled.

THE WHEAT BOOK CHAPTER 10 – DISEASES
209
OCCURRENCE, RECOGNITION AND CONTROL (continued)
Barley yellow dwarfOccurrenceBarley yellow dwarf is caused by barley yellow dwarf
virus (BYDV). Yield losses may be 10-50% if infection andspread occurs early in the growing season. Then theproportion of shriveled grain increases, affecting quality.BYDV is spread to cereal crops from reservoirs of infectionin wild or pasture grasses or cereal volunteers by grass andcereal aphids. The oat (Rhopalosiphum padi) and corn (R.maidis) aphids are the most important vectors. (Aphiddescriptions can be found in the insect pests section.)BYDV affects wheat, oats, barley, triticale and pasturegrasses. The virus must survive the summer in living cerealsor grasses in places such as roadside ditches, creeks,soakaways and irrigated gardens. The extent of BYDV riskis largely dependent on the amount of rainfall before thegrowing season. With greater rainfall in late summer andearly autumn (Feb-April) the extent of grass and cropvolunteer survival increases. Early build-up of aphidsbefore the growing season on plant material infected withvirus leads to early arrival of virus-carrying aphids in crops.High annual rainfall zones (>500mm) are at most risk,especially when perennial grass hosts of BYDV, such asCouch, Veldt grass and Paspalum, are present (Figure10.11). However, other rainfall zones may become highrisk if they experience regular summer rainfall events. Inyears with dry conditions in February and March, the riskof infection is low and spraying may not be needed even inhigh-risk areas.
Fig. 10.11
Barley yellow.
Fig. 10.12
Barley yellow dwarf virus symptoms.
RecognitionThe symptoms of BYDV on wheat can be difficult to
recognise because they are similar to some nutrientdeficiency symptoms. In addition, there may be differences
in sensitivity between varieties. Virus symptoms take atleast three weeks to appear after infection, longer in coldweather. Wheat infected at the seedling stage usuallydevelops a slight to severe yellowing between veins(interveinal chlorosis), some tip necrosis and occasionalserration down one margin of the third and fourth leaf.When infection occurs before the end of tillering,symptoms include pronounced stunting, an increasednumber of poorly developed, often sterile tillers, reddeningof the flag leaf (Figure 10.12), delayed maturity, abortionof terminal spikelets, shriveled grain and decreased yield.
Distinct patches of infected plants may be seen in thecrop, expanding as the season progresses. These are formedwhen winged aphids bring BYDV into the crop (primaryspread) and aphids produced on the infected plants thenspread the virus to neighbouring plants (secondary spread).
Wheat infected after tillering may show no obvious leafsymptoms nor decrease in plant size, but maturity may bedelayed, the grain yield slightly diminished and the grainslightly shriveled.
ControlControl is achieved by preventing potential aphid
vectors from feeding in the crop. Once a plant is infectedwith BYDV there is nothing that can be done to removethe infection. Management strategies that help to decreaselosses include:
sowing BYDV-tolerant varieties if availableavoid very early sowing to avoid the autumn aphidflightdirect-drilling into stubbles to conceal bare earth:winged aphids are especially attracted to small plantswith bare earth around themstrategic application of insecticides to eradicate aphidswithin the crop and prevent migrating aphids fromsettling and feeding on crop plants.It is vital to prevent spread of barley yellow dwarf virus
(BYDV) during the first 8 – 10 weeks after cropemergence. Usually this means applying insecticides beforeaphids and/or BYDV symptoms can be easily seen. This is

CHAPTER 10 – DISEASES THE WHEAT BOOK
210
OCCURRENCE, RECOGNITION AND CONTROL (continued)
because considerable BYDV spread can occur with lowaphid numbers, and virus symptoms are difficult to see inwinter. Five years of insecticide experiments with a range ofcereals in WA, showed that foliar sprays of syntheticpyrethroids at 3 and 7 weeks after full crop emergencedecreased BYDV spread by up to 87% and increased grainyields by up to 41%. These pyrethroids (e.g. alpha-cypermethrin (Dominex or Fastac) or beta-cyfluthrin(Bulldock)) control BYDV better than pirimicarb ordimethoate because they not only kill aphids but also havean anti-feeding effect that deters new aphids from feedingfor a further 3-4 weeks. The cost of spraying can often bereduced, as pyrethroids may be tank-mixed with many ofthe autumn-applied herbicides. Controlling aphids withsynthetic pyrethroids early to stop BYDV spread can alsoprevent them building up sufficiently to cause feedingdamage in spring. However, in bad aphid yearsapplications of insecticides from other chemical groupsmay be required in spring if feeding damage becomes aproblem in cereal crops.

THE WHEAT BOOK CHAPTER 10 – DISEASES
211
OCCURRENCE, RECOGNITION AND CONTROL (continued)
Wheat rustsIn Western Australia, rust has been a sporadic problem
for wheat growers. Since the first recording of stem rust inWestern Australia in 1906, there have been less than 10epidemics. Small outbreaks of stem rust are more commonand can cause severe losses over a limited area. Since thefirst leaf rust epidemic in Western Australia in 1992significant outbreaks of this disease have recurred.
Rusts require living plants on which to grow andreproduce, so they must continually infect new hosts. Toinfect crops during the season they must survive oversummer by infecting volunteer cereals or grass hosts. Thisoccurs during seasons where summer rainfall is plentiful forvolunteer cereals or weed hosts to survive. Dry summerconditions usually preclude significant carryover of rust(Figure 10.13).
Fig. 10.13
Rust risk.
The three types of rusts that can occur on wheat arestem, leaf and stripe rust. In the field, the shape and colourof the pustules (Table 10.12) can distinguish the type ofrust. It is important to submit samples of rust toAGWEST. These are submitted to Sydney for typing. Thisthen informs us if the rusts are changing in terms ofresistance and helps the breeding program in developingvarieties resistant to rust.
So far, stripe rust (a serious disease in the Eastern States)has not crossed the Nullarbor. Its arrival in WesternAustralia may increase the importance of rust control here.
Pustule character Stem rust Leaf rust Stripe rust
Colour† Reddish brown Orange brown Yellow
Shape Oval to elongated with Circular to oval Small, circular, in yellow conspicuously tattered stripes edges
Location on plant On both sides of leaf, on Chiefly on upper surface of Chiefly on upper surface of leaf sheaths, stems and leaf leaf, on leaf sheaths, awnsoutside of head and inside of glumes
† Colour depends on the freshness of the pustule. Most spores are produced overnight so that pustules are best observedin the morning before spores are spread by wind.
Table 10.12. Distinguishing features of the wheat rusts

CHAPTER 10 – DISEASES THE WHEAT BOOK
212
OCCURRENCE, RECOGNITION AND CONTROL (continued)
Wheat stem rustOccurrenceWheat stem rust (Puccinia graminis f.sp. tritici) can
infect wheat, durum wheat, barley, triticale and somegrasses including barley grasses (Hordeum spp.) andcommon wheat grass (Agropyron scabrum). It is potentiallythe most damaging rust in Western Australia.
Epidemics will occur when summer and autumn rainsallow wheat or barley volunteer plants to survive throughthe summer. Crop infection occurs when the temperaturesrange from 15-30˚C and dews occur. The disease can causesevere crop loss in a short amount of time at the end of theseason.
RecognitionStem rust usually occurs on the stem, and can occur on
the leaves (both sides), leaf sheaths or in severe infectionson the head. (Figure 10.4) Plants will have large pustulesfull of reddish-brown powdery spores. The pustules will beoval or elongated in shape. Towards the end of the seasonwhen infections are old these will change to black incolour.
Fig. 10.14
Stem rust symptoms
ControlRemove volunteer cereal crops, the green bridge, to
prevent the carryover and buildup of inoculum during thesummer months. If inoculum levels are reduced during thenon-cropping phase, infection is unlikely to occur early inthe cropping season.
Use resistant varieties to reduce inoculum buildupduring the cropping season. A reduction of inoculumduring the cropping season reduces the carryover loadduring the summer months.
When stem rust is detected in susceptible cultivars – prior to flowering. Apply a high rate of fungicide assoon as possible.after flowering. Apply fungicide as soon as possible, usea low rate if the disease incidence is below 10% (up toone stem in 10 has any stem rust).For stem rust incidence above 10%, spray with a highrate of fungicide if the crop is before mid grain fill andwith a standard rate if the crop is at mid to late grainfillingIn Western Australia sporadic rust outbreaks may
require the combinations of the above strategies.

THE WHEAT BOOK CHAPTER 10 – DISEASES
213
OCCURRENCE, RECOGNITION AND CONTROL (continued)
Leaf rustOccurrenceWheat leaf rust (Puccinia recondita f.sp. tritici) is
specific to wheat and triticale. A single pathotype hasdominated in W.A. since 1990 and became epidemic in1992 and 1999. Wheat leaf rust regularly survives the non-cropping summer in varying quantities, usually sufficientto occur at least to a limited extent (particularly in southernregions) each year. The disease develops rapidly between 15and 22˚C when moisture (including dew) is non-limiting.The highest yield increase attributed directly to control ofleaf rust in Western Australia is 37%. However the diseaseis synergistically damaging in combination with septorialeaf blotches. In Esperance in 1992 early severe leaf rust incombination with very severe septoria nodorum blotchinduced 90% loss. Leaf rust does not affect other cerealsand is not hosted by other cereals.
RecognitionThere are small circular to oval pustules restricted to the
upper surfaces of leaves (Figure 10.15). Spores are lightbrown in colour. The pustules will darken as the infectionages and the spores will appear black in colour. Later in theseason, the infection can spread to the leaf sheaths.
Fig. 10.15
Leaf rust symptoms.
ControlControl measures that are the most effective are similar
to those mentioned in the above section on stem rust. Theuse of resistant varieties in areas that are prone to leaf rust(ie higher rainfall areas), combined with the control ofvolunteer wheat during the summer months, will reducethe inoculum levels and hence risk of early infection forsusceptible varieties.
during seedling stage. Monitor infection, if there is
evidence of increasing severity during winter (rustprogress exceeds plant growth and upper leaves becomeinfected) apply a fungicide spray at early stemelongation (Z31/32). Recommence monitoring after 4weeks and if necessary apply a further fungicide spray ifleaf rust is detected on flag-3 leaf at or soon after flagleaf emergence. The risk of other diseases at this stagecould influence choice of fungicide and rate.during stem elongation phase. At low severity, monitorand delay control until early flag leaf emergence unlessrapid build up is observed. At moderate to high severityon middle leaves, apply fungicide during stemelongation.at flag leaf emergence but prior to flowering. Apply as
soon as possible if leaf rust severity is moderate to highon lower leaves.after flowering a response to fungicide is unlikely.

CHAPTER 10 – DISEASES THE WHEAT BOOK
214
OCCURRENCE, RECOGNITION AND CONTROL (continued)
Wheat stripe rustOccurrenceStripe rust (Puccinia striiformis var. striiformis) mainly
infects wheat, but can occasionally be found on barley andtriticale and on a wide range of grasses such as barley grass(Hordeum leporinum), common wheat grass (Agropyronscabrum) and prairie grass (Bromus uniloides).
It was first reported in Australia in 1979 and has sincespread throughout the wheatbelt of eastern Australia,coming as far west as Ceduna, South Australia.
Stripe rust does not occur in Western Australia, butcould invade at any time. If you suspect that you have striperust, submit a sample to Agriculture Western Australia im-mediately.
RecognitionThere may be yellow patches within the paddock. These
are usually 1-10 metres across. On the leaves the pustulesare scattered on young plants while in older plants they willform in stripes along the leaf veins (Figure 10.16). Thespores are yellow to orange in colour. If you rub the leaf thespores will leave a yellow coloured smear on your finger.The infection can spread to the head preventing seed fromforming or becoming shrivelled.
Fig. 10.16
Stripe rust symptoms.
ControlThe use of resistant varieties in areas that are prone to
stripe rust (ie cooler higher rainfall areas), combined withthe control of volunteer wheat during the summer months,will reduce the inoculum levels and hence risk of earlyinfection. Optimum temperatures for stripe rust are lessthan leaf and stem rusts (most rapid development between10 and 15˚C) and earlier fungicide control of winterepidemics is more commonly required for this disease.

THE WHEAT BOOK CHAPTER 10 – DISEASES
215
OCCURRENCE, RECOGNITION AND CONTROL (continued)
Wheat smutsFungi which parasitise the host plant and produce
masses of soot-like spores in the leaves, grains or ears causesmut diseases.
Smuts have one of two distinct life cycles. It is importantto know the type of smut and its life cycle so that the bestmeans of control can be determined. Smut may be borneeither on the inside or outside of the seed.
The smuts that are borne externally on the seed are:Bunt of wheat (Tilletia laevis and T. tritici).Flag smut of wheat (Urocystis agropyri).And there is one smut of significance that is borne
internally. This is: Loose smut of wheat (Ustilago tritici).
Bunt (covered smut)OccurrenceAlthough very rare, bunt is potentially the most
important smut disease of wheat because there is a niltolerance level for bunt in wheat delivered to Co-OperativeBulk Handling Ltd. Bunt is extremely difficult to detect inthe field and could remain undetected in harvested grain ifpresent at very low levels. If it is seen or suspected it shouldbe reported to Agriculture Western Australia.
RecognitionBunt is difficult to observe except near crop maturity.
Wheat plants infected with bunt are usually slightlystunted. The glumes on heads of infected plants may bespread apart more than on healthy heads. Infected kernelsare greyish brown and when the fragile seed coat is crushedor broken, the soot-like spores have a characteristicstinking fishy odour.
During crop harvest, spores may also fall on the soiland remain dormant until the next crop is sown. As theseedlings germinate, the spores infect them. This soil-bornephase is an important source of infection.
ControlA regular fungicide seed dressing program is
recommended for prevention of bunt.
Flag smutOccurrenceFlag smut (Urocystis agropyri) occurs throughout the
wheat belt in Western Australia. RecognitionThis disease is difficult to detect early in the growing
season. Affected plants are often stunted and affected leavesmay be curled and distorted. The spore masses can be seen asdark streaks running along the leaves and leaf sheaths, usuallyfrom about booting. Initially the spore masses are under thesurface, but break through revealing distinct streaks of sootyspores on the leaves (Figure 10.17). Flag smut is the mostwidespread smut of wheat. Farmers growing susceptiblevarieties should be on the look-out for this smut. Flag smutmay also be detected after harvest on standing stubble.
During harvest, the smut spores contaminate healthyseed, but remain dormant on the outside of the seed during
storage. As the seed germinates, the spores also germinateand infect the seedling, growing inside it and eventuallyforming smutted heads or leaves (in the case of flag smut).Pickling seed with fungicide kills the spores and controlsexternally seed-borne smuts.
During crop harvest, spores may also fall on the soiland remain dormant until the next crop is sown. As theseedlings germinate, the spores infect them. This soil-bornephase is an important source of infection.
ControlResistant varieties should be used when possible. For
susceptible varieties a regular fungicide seed dressingprogram is recommended for prevention of flag smut. Anappropriate seed dressing must be used to control soil-borne phases of this disease. Crop rotation will reduce soil-borne carryover but a break of two years or more will benecessary to have a significant effect.
Loose smutOccurrenceLoose smut is generally confined to high-medium
rainfall areas of the wheat belt in Western Australia. RecognitionLoose smut of wheat (Ustilago tritici) is carried as a
small colony of fungus inside the seed rather than as a sporeon the seed coat. When infected seed germinates, thefungus becomes active and grows slowly in the growingpoint of the plant.
Diseased plants appear normal until heading, but maybe taller and mature earlier than surrounding healthyplants. The fungus now grows rapidly and forms a compactspore mass to replace the cereal head.
The black powdery spores blow away to leave a barestalk. The spores are released as the rest of the crop isflowering and they infect the developing grains of healthyheads, remaining dormant in the grain until the seed issown the next season.
ControlA regular fungicide seed dressing program is
recommended for prevention of loose smut.Where more than 5% of heads show loose smut
infection (infection is very high), new seed should bebought from a clean source and treated before use.
Fig. 10.17
Flag Smut symptoms.

CHAPTER 10 – DISEASES THE WHEAT BOOK
216
OCCURRENCE, RECOGNITION AND CONTROL (continued)
Other diseases of wheat
Powdery mildewThe fungus Blumeria graminis f.sp. tritici causes
powdery mildew. Powdery mildew had been economicallyunimportant but in recent years infections in wheat haveworsened. The fungus is evident as a whitish powderygrowth on the upper surface of leaves and leaf sheaths. Asthe infection ages there is a yellowing of the infected tissue,and the infected area turns a dull grey colour with smallblack specks present. Heads may become affected. Itprefers humid conditions or dense crops with highnitrogen levels. The fungus survives on crop residues.Increased severity of powdery mildew infections in wheatmay have resulted from increasingly productive crops,stubble retention or increasing varietal susceptibility.Control is achieved via less susceptible varieties while thepotential value of fungicide sprays and seed treatments iscurrently unclear. (Figure 10.18).
Fig. 10.18
Powdery mildew symptoms
Ring spot The fungus Pyrenophora semeniperda (Drechslera
campanulata) infects leaves producing small spots withdark brown rims, which typically have pale brown centres.It occurs throughout the wheatbelt but normally does notreach damaging levels. Infection in young crops iscommon. The fungus infects many grasses and carries overon residues and symptoms will frequently be seen in cropsafter pasture.
Downy mildewDowny mildew is caused by the fungus Sclerophthora
macrospora. The fungus is soil-borne and carries over inhost residues. In very wet to waterlogged conditionsspores infect young wheat plants. The disease isdamaging to individual plants producing thickenedleathery twisted leaves and the heads are twisted, similarto damage induced by hormone weed killers. Thefrequency of infection is very, very low, and confined toareas subject to waterlogging or flooding. Control is notwarranted.
ErgotThis disease is caused by the fungus Claviceps purpurea.
The fungus survives in the soil for up to one year,producing spores that infects plants during flowering.Infection is favoured by cool wet weather during flowering.Ergots are black in colour and replace the grain in the seedhead. This is toxic to animals and to humans. It isimportant to control grass weeds where the fungus cansurvive, around crops.
Ear cockle or seed gall nematodeThis disease is caused by the nematode Anguina tritici.
On plants, the heads appear normal but removal of glumeswill reveal seed galls instead of normal grains. A fungus(Dilophospora alopecuri), which is carried with thenematode, causes twisted and distorted leaves and ears.These are the best indicators that the nematode may bepresent. At heading, the plants are stunted and slow tomature.
The developing seed of plants with twisted leavesshould be examined for galls. In harvested seed, galls aredark and do not crush readily like bunt.
The nematode larvae hatch from the galls and climb upthe plant. The young larvae attack the growing point andembryo flower head causing grains to be replaced bynematode galls. At harvest, galls are mixed with seed or fallto the ground, providing effective means of spread andsurvival.
Control is achieved by not sowing infested seed and byeliminating soil-borne larvae by not cropping wheat fortwo years. The disease is very rare in Western Australia.

THE WHEAT BOOK CHAPTER 10 – DISEASES
217
ROOT DISEASE
Principles and managementDisease causing microorganisms that affect roots,
crowns and stem bases of cereals are widely distributed inagricultural soils in Western Australia. Their impact variesacross regions in response to management and seasonalconditions. Slow spread and disease build up and patchydistribution are features of the biology and life cycle of rootdiseases. Most are limited to one infection cycle in a seasonand are usually not dispersed in the same way as leafdiseases. For this reason they can be effectively managedwhen recognised and understood. However their insidiousdevelopment, often remaining inconspicuous during build-up, means that they can go unnoticed or appear to “comefrom nowhere”. Uneven inoculum dispersal, varying cropgrowth, weed infestation or soil environment can result inpatchiness or uneven crop growth that can be confused withother environmental effects.
A general feature of root diseases is that they are able toattack a wide range of plant species. Wide host rangerequires special consideration for disease management. Asystems approach that integrates root disease managementwith other agronomic factors will be the key to successfullyminimising the most common and important root diseasesof cereals.
RotationThis is the most important factor in root disease
management. The key to successful rotationalmanagement is to have cropping sequences that includenon-hosts or poor hosts for key diseases. As a generalrule, the greater the diversity of non-cereal crop-rotation-species, the greater the impact on root diseasecarryover. (Figure 10.19).
During a wheat phase root disease has the opportunityto increase. The amount of damage will depend on thelevel of disease and interactions with seasonal factors. Asthe crop matures, the pathogen becomes protected withinthe infected roots and crowns. A breakdown of root andcrown tissue would expose the pathogen to attack by othersoil microorganisms. For much of the non-croppingseason, however, soil conditions are dry and soilmicroorganism activity is low, hence most of thisbreakdown occurs in the following growing season, ratherthan between seasons. Infected plant residues, theinoculum for future disease initiation, gradually rots awayover a 12-18 month period in the absence of a host to re-infect.
The diseases, take-all and crown rot, are two fungaldiseases that have adapted to survival in soil by attacking arange of cereal and grass hosts. Both fungi readily attackwheat but also barley and numerous common grasses. Forthis reason effective management of these diseases requiresnon-cereals in the rotation. It is very important to controlgrass weeds in non-cereal rotation crops and pastures foreffective lead-in management for the next wheat (or barley)crop.
Diseases with broad host ranges require greater carewhen planning cropping sequences. Root lesionnematodes are able to attack both cereals and non-cerealsbut do have preferences for different hosts. Some alternatecrops, such as canola, can allow some root lesionnematodes to increase. Growing crops such as field pea,lupin and faba bean will generally discourage root lesionnematodes. The rhizoctonia bare patch fungus is able toinfect a wide range of hosts and hence can not be managedby rotation.
Appropriate crop rotations will ensure yield loss will beminimised by keeping disease levels low. In disease proneareas, it may be necessary to alternate with a non-host cropfor every susceptible crop grown while in some areasrelevant break crops may be required less frequently.
Figure 10.19 – Effective rotations permit long periods ofinoculum decline (long shallow saw-teeth figure b,c)compared to inoculum maintenance (a). d) Seasonalconditions influence disease build up and expression.
TillageIt is possible that multiple tillage practices in use before
the adoption of pre-plant herbicides and direct drillingresulted in some breakdown of infected plant debris anddestruction of root disease inoculum. However theseeffects were probably small, particularly in rotationcropping, hence would not outweigh the agronomicbenefits of current systems of crop establishment.
S S S SH H H H
crop damage threshold
Am
ount
of i
nocu
lum
in s
oil
0
1
Barley Wheat WheatGrassy Pasture
S S S SH H H H
crop damage threshold
Am
ount
of i
nocu
lum
in s
oil
0
1
Wheat Grassy Pasture WheatManipulated Pasture
S S S SH H H H
crop damage threshold
Am
ount
of i
nocu
lum
in s
oil
0
1
Wheat Lupin CanolaWheat
S S S SH H H H
Am
ount
of i
nocu
lum
in s
oil
0
1
Wheat Barley PeasWheat
Wet finish raises thresholdbut also increases disease.Crop appearsOK.
Dry finish exacerbatesloss of root function &lowers threshold.
a)
b)
c)
d)
Fig. 10.19
Factors affecting root disease development and expression.

CHAPTER 10 – DISEASES THE WHEAT BOOK
218
OCCURRENCE, RECOGNITION AND CONTROL (continued)
Tillage is an important means of managing rhizoctoniabare patch. This fungus becomes active with seasonal rainsand the fungal threads (mycelia) grow through soil. Tillagedisrupts these fungal threads, reducing their potential tocause infection. Tillage may also provide seedbedconditions that encourage more rapid root growth. Thisenables plants to better cope with some root damage frominfection.
Seasonal influencesSoil moisture affects root disease directly through
conditions for infection and also indirectly through thecapacity of the plant to tolerate root disease. Soil moisturealso affects the rate of breakdown of infected trash.
Soil moisture can directly influence the type andamount of root disease. Early in the season very wet towaterlogged conditions can favour Pythium fungi.
Pythiums are soil fungi that can damage the small feederroots. In the absence of waterlogging Pythium spores areless able to swim to developing roots and so normally donot affect plants significantly. With high but not excessivelevels of soil moisture the fungi that cause take-all andcrown rot are better able to infect and colonise plants.
When the root system is damaged by disease the plantis less able to take-up water and nutrients, or toleratestresses such as waterlogging and drought. Reduced uptakewill affect plant growth and these effects may be evident inearly crop stages (e.g. rhizoctonia bare patch) or later duringstem extension. Plants can frequently grow and tolerate apartial loss of function until there is a period of moisturestress, or until the critical grain filling time is reached. Thelater is often exacerbated because at this time the plant hasto meet increased demands for moisture as temperaturesrise. For this reason root diseases can often become more
Possible Break Crops
Disease Main Hosts Non – cereals Resistant cereals
Take-all wheat, barley pulse crops oats
Gaeumannomyces triticale pasture legumes
graminis var tritici barley grass oilseeds
brome & silver grass
Root Lesion Nematode wheat & barley lupins cereal rye
Pratylenchus neglectus canola peas triticale, durum
vetch faba beans oats
medic
chickpea
Rhizoctonia Bare patch All plants are hosts
Rhizoctonia solani AG-8 to some degree
Crown Rot wheat pulse crops
Fusarium graminearum barley pasture legumes
triticale oilseeds
grasses
weeds
Cereal Cyst Nematode wheat pulse crops cereal rye
Heterodera avenae barley pasture legumes selected wheat, barley, oat
oat oilseeds and triticale varieties
triticale
wild oats
Common Root Rot barley pulse crops cereal rye
Bipolaris sorokiniana wheat pasture legumes oats
oilseeds
Table 10.2 – Summarised rotation options for root disease control in wheat (adapted from Managing your rightrotation).

THE WHEAT BOOK CHAPTER 10 – DISEASES
219
OCCURRENCE, RECOGNITION AND CONTROL (continued)
evident and induce greater effects on production underdrier than normal crop finishing conditions.
Soil typeSoil chemical, physical and biological properties also
influence soil pathogens directly. The take-all fungus isbetter adapted to alkaline soil conditions and some soils(e.g. alkaline black wattle sands south of Geraldton) areprone to this disease. Rhizoctonia bare patch is usuallymore pronounced on very sandy soils. Soil propertiesresulting in increased biological activity are believed toantagonise root diseases such as take-all and rhizoctonia inlong-term no-till experiments. The basis for theseinfluences are not well understood.
Soil types can influence the frequency of wheatcropping and this in turn influences root diseaseoccurrence. Soil type also influences soil moistureavailability, particularly during periods of moisture stress.Wheat is grown at high frequently on high clay content(heavier textured) soils in the eastern wheat belt, favouringthe occurrence of fusarium crown rot, which can be moreevident with mild moisture stress at grain filling.
NutritionAnything that helps crop growth is likely to reduce the
impact of disease. Root damage will limit nutrient uptake,which may lead to deficiency and further impaired rootgrowth.
Some pathogens are influenced by soil pH. Activitiesthat influence soil pH, such as nitrogenous fertilisers(increasing pH) or liming (decreasing pH) may have minorinfluences on most root diseases. The exception is take-all,were excessive use of lime will lead to an increase in thisdisease. Liming to neutral pH will have no effect, butliming to pH 8 and above will increase take-all. Usuallythese effects are small compared to factors such as rotationand season rainfall.
Trace elements are also implicated in root diseaseinteractions and both macro and micronutrients areimportant. Providing adequate nutrition makes cropsbetter able to tolerate root disease.
Host resistanceThere is limited host resistance to root diseases. In
Western Australia crop rotation is more important inmanaging disease than host resistance. Highly effectiveresistance is available for cereal cyst nematode but thisdisease has limited distribution and importance under ourdiverse cropping systems. No resistance is available fortake-all, fusarium crown rot or rhizoctonia bare patchwhile some wheat cultivars exhibit partial (moderate)resistance to some root lesion nematodes.
Chemical controlFew chemical control options are available for root
diseases. Seed treatments are being sought for root diseasesbut conventional seed treatments used at concentrationsthat are required to control root disease are too toxic toyoung plants. To overcome this problem it is possible toapply fungicide in-furrow by mixing it with fertiliser andsowing or banding at seeding. This approach can be usedto control take-all when high disease levels are anticipated.Future developments with seed treatments are possible.

CHAPTER 10 – DISEASES THE WHEAT BOOK
220
OCCURRENCE, RECOGNITION AND CONTROL (continued)
Take-allOccurrenceTake-all, caused by the fungus Gaeumannomyces
graminis var. tritici, is a significant root disease of wheat andbarley, it also infects oats but to a lesser extent. It iswidespread throughout the wheatbelt but causes the mostdamage to crops in the high and medium rainfall areas(400 to 750 mm annual average rainfall) near the southernand western edges of the wheatbelt (Figure 10.20).
Along the south coast take-all may be so serious thatcropping to wheat or barley is not always economicallyfeasible.
In other parts of the wheatbelt the presence of take-allaffected cereal plants and the yield loss may go unnoticedunless the cereal plants are removed from the soil and theroots examined after washing them to remove all soil.
Fig. 10.20
Take-all distribution
RecognitionPaddock appearance: In young crops, look for stunting
or poor growth of individual plants or indistinct patches ofup to several metres diameter. At later stages when cropshave headed look for premature plant death and white-heads, particularly as soil moisture becomes limiting. Nearthe centre of the patches most plants are affected but theproportion decreases towards the edges. Take-all affectedplants are stunted and may hay-off early causing pinchedgrain. In a severe outbreak of take-all, patches may overlapso that large areas of the paddock will appear to be a mosaicof varying densities of affected plants.
Plant appearance: The most common symptom oftake-all is the presence of dark brown roots due to invasionby the fungus. The roots of plant suspected of beinginfected with take-all need to be washed thoroughly toenable symptoms to be seen. In washed roots from young
plants, it is possible to see the diseased dark brown centralcore running through the young white roots. The roots ofmature affected plants are brittle, break off short and areblack. By contrast, healthy roots are long and pale. Severelyaffected plants have a black crust around the stem base.Removing the leaf sheath at the base of the plant mayreveal this crust or just brown to black streaks or spots(Figure 10.21).
Fig. 10.21
Take-all symptoms (Green stem base is healthy).
Life cycleThe fungus colonises host plants in the winter/spring
period, killing roots and destroying root function. Afterinfected plants die the fungus remains inactive in diseasedtissues such as roots and crowns while the soil is dry oversummer. The following winter the fungus becomes activeand re-infects newly growing host plants.
ControlThe take-all fungus has a wide host range, infecting
wheat and barley and to a lesser extent, oats and it alsoinfects most volunteer and pasture grasses. Barley grass(Hordeum leporinum) is the most susceptible commongrass, followed closely by annual ryegrass (Lolium rigidum)and silver grass (Vulpia sp.), while brome grass (Bromusdiandrus) is least susceptible. The susceptibility of otherpasture grasses falls within the range of these commonpasture grasses. The fungus does not infect non-grasspasture plants such as clover, medic or capeweed, or non-cereal crops such as lupins, pulses or canola.
Results of two long-term rotation experiments atEsperance Downs Research Station showed that there is aclose relationship between the incidence of take-all in acrop and the amount of grass in the previous pasture. Inthese two experiments the pasture composition was alteredwith herbicides. Measurements taken over six years showedthat the incidence of take-all over the whole crop increasedby about 5% for each 100 kg/ha of grass dry matter in theprevious year’s pasture (measured in spring) (Figure 10.22).
Effective control can only be obtained by establishing aperiod of at least 12 months prior to susceptible cerealcrops in which grasses (which carry the disease) are not

THE WHEAT BOOK CHAPTER 10 – DISEASES
221
OCCURRENCE, RECOGNITION AND CONTROL (continued)
allowed to grow. Two years may be required where highgrass burdens have been carried over several years.Grass control can be obtained in alternative crops, forexample in lupins, pulses or canola or in pastures, byuse of herbicides.Use ammonium-containing sources of nitrogen inpreference to urea.Consider using phase pasture rotations in which thelast year of pasture is managed to minimise the diseasecarryover into the first year of cropping.
Pasture grass content influences on Take-all
Fig. 10.22
To bring a pasture paddock into cropping following anextended pasture phase, preparation of the paddock needsto start at least one year before sowing the crop. The objectis to ensure that the pasture is grass free from the start ofwinter in the year prior to sowing a cereal crop.
There are two options for manipulation of pasture(grass-legume mixtures) with herbicides to control take-all:
seed set control two years before cropping; andselective grass control by spraying in the year beforecroppingIn planning either (or both) of these grass control
strategies, farmers must consider the implications fordeveloping herbicide resistant grass weeds in the paddock.In both options, broad-spectrum herbicides can be used toachieve selective grass control.
Seed set control can be achieved with either a broadspectrum or a grass selective herbicide applied when mostgrass in the pasture is in the early stages of flowering. Thisensures that the minimum amount of viable seed is set forgermination in the following year. An additionalconsideration is that the legume component of the pasturemust set enough seed to be competitive with grasses thatgerminate, and to provide sufficient grazing in thefollowing year, that is, the year of pasture before cropping.
Selective grass control can be achieved by applyingeither broad spectrum or selective herbicides in earlywinter. These must be applied at about the 6-leaf stage ofthe clover or medic plants in a pasture during the yearbefore a cereal crop is sown.
After grass control, pasture production is reduced inlate autumn and early winter when grazing is already inshort supply. However, to complete the control of grass,grazing pressure must be maintained on the pasture toprevent tillers developing on sprayed plants and theestablishment of grasses that germinate late.
Before embarking on pasture manipulation in earlywinter, first ensure that there are enough clover or medicplants in the pasture (that is 1,000 to 2,000 plants persquare metre). This is to compensate for the loss of grass inthe pasture and to smother grass plants that survive oremerge after spraying.
Herbicide must be applied as early as possible in thegrowing season to allow the longest time for grass rootfragments harbouring the fungus to break down. Delayingherbicide application by as little as three weeks canconsiderably increase the amount of take-all fungus thatsurvives to the end of the growing season.
Liming and Take-all: The severity of take-all evident ina cereal crop is influenced by the pH of the soil around theroots of growing plants. Take-all will be less severe in acidsoils (ie. low pH). Liming soils to increase the pH will alsomake the conditions around plant roots more conducive totake-all.
A consequence of this may be that farmers suddenlynotice take-all in their cereals where crops have previouslyappeared to be uniform. Liming soils, therefore, increasesthe need for rotation of cereals with broadleaf crops orgrass-free pastures.

CHAPTER 10 – DISEASES THE WHEAT BOOK
222
OCCURRENCE, RECOGNITION AND CONTROL (continued)
Rhizoctonia bare patchOccurrenceRhizoctonia bare patch, caused by Rhizoctonia solani
AG-8, is a very important and common diseasethroughout the wheatbelt (Figure 10.23). The disease ismost common in soils of low fertility such as acid sandsand in minimum and no till situations.
Fig. 10.23
Rhizoctonia distribution.
RecognitionBare patches appear within a crop early in the season
and become more distinct as neighbouring crop continuesto grow. They can vary in size from very small to severalmetres across (Figure 10,24). There is a distinct differencebetween infected plants within the patch and healthyplants outside the patch.
Infected plants within the patch are pale or very darkgreen, and stunted. The root systems when washed showsmall, brown roots with spear tipped ends.
Fig. 10.24
Rhizoctonia symptoms.
Life CycleRhizoctonia survives in organic matter (mainly
colonised roots) during the summer months. Followingautumn rains the fungus grows out of this material toinfect young seedlings. In many cases individual patchesrepresent individual Rhizoctonia colonies that spreadthrough soil to adjacent plants.
ControlThere are no cereal varieties resistant to rhizoctonia
bare patch. Barley is most susceptible followed by wheatwhile oats are least susceptible. Rotations with other cropswill not reduce the level of disease as the AG-8 strain cangrow on legumes, canola and weed species, as well as all thecereals.
Cultivation after rain and at any time just prior or atsowing reduces the impact of the disease on a new crop. InWA cultivation to 10 cm is required and improved controloccurs with increasing depth and intensity of cultivation.Use of a modified combine with tynes that cultivate to 10cm but place the seed at normal seeding depth (2-3 cm) isan effective one-pass method of controlling or significantlyreducing rhizoctonia bare patch.
Increase soil fertility. This encourages better cropestablishment and enables the plants to offset the rootdamage caused by Rhizoctonia, by faster root growth anddevelopment of a larger root system. Trace elementdeficiency can increase the disease severity.
The use of sulfonylurea herbicides increases the impactof the disease. This is because under alkaline soils theherbicide reduces root growth, thus accentuating rootdamage due to Rhizoctonia.

THE WHEAT BOOK CHAPTER 10 – DISEASES
223
OCCURRENCE, RECOGNITION AND CONTROL (continued)
Fusarium crown rotOccurrenceCrown rot is caused by the fungus Fusarium
graminearum that persists in infected crop residues and canbe carried over on infected grass weeds for a period of twoyears. It is most prevalent on heavy soils in the easternwheatbelt.
RecognitionThe disease is noticeable after flowering when scattered
white-heads appear in the crop. The disease can occur aspatches of plants with whiteheads. Sometimes this can beconfused with Take-all, as this disease alsocauseswhiteheads after flowering. However, whiteheads onscattered plants is more likely to be crown rot while white-heads in patches are usually take-all.
Inspect the crown (where roots join the base of thestem) of the affected plants by peeling off the old leafsheaths to reveal the true stem. The lower stem and sub-crown internode of infected plants has a honey-browndiscoloration. Sometimes there is a pink discolorationaround the crown, or under the leaf sheaths.
Life cycleThe fungus colonises host plants in the winter/spring
period and disrupts the translocation of water from theroots. After infected plants die the fungus remains inactivein diseased tissues such as roots and crowns while the soilis dry over summer. The following winter the fungusbecomes active and re-infects newly growing host plants.
ControlCrown rot occurs when the fungus can build up in the
soil over two or more years when susceptible crops aregrown in close rotation. Wheat, barley, triticale and grassesare susceptible to the disease. Long rotations with pulses,canola and grass-reduced pasture will reduce thepopulation level. Oats can be used as a break crop becausethe fungus grows more slowly in oats and less inoculum iscarried over into the next season.
It is important to control grass-weeds to reduce thecarry over between seasons. Without rotation infectedstubble should be burnt. The cultivation of soil also speedsup the decomposition of crop residues and may assist inthe management in some situations.

CHAPTER 10 – DISEASES THE WHEAT BOOK
224
OCCURRENCE, RECOGNITION AND CONTROL (continued)
Root lesion nematodeOccurrenceRoot lesion nematodes (Pratylenchus species) are
microscopic roundworms that feed in living root tissue of awide range of host plant species. Several species occur inWestern Australia and different species can differ in hostrange. In Western Australia significant root lesion nematodeinfestations have been diagnosed where cereals have beengrown after cereal, canola, medic or subterranean clover-based pasture. Root lesion nematodes move in moist soil tolocate and invade roots in which they feed and reproduce.Where conditions such as host crop and seasonalenvironment are favourable Pratylenchus populations mayincrease to levels damaging to crop production. Pratylenchusare known to occur across a wide range of soil types in thesouthwest agricultural areas of Western Australia. High soilpopulations are more common in some areas than others.
RecognitionAbove ground symptoms are non-specific. Infested
plants show poor vigour and growth and may occur inlarge or small patches that are generally less well definedthan rhizoctonia bare patches. If roots are dug (not pulled)from the soil and washed brown lesions may be evident(Figure 10.25) and in heavily infested plants the roots maybe thin and poorly branched. It may be difficult todistinguish between damage due to root lesion nematodesand fungal root diseases including rhizoctonia bare patchor take-all. Suspected root lesion nematode infestations canbe confirmed by laboratory testing. Testing can help definethe problem and determine the species of nematode(s)present. This information is important in determining howto manage a root lesion nematode infestation.
ControlCrops grown under favourable conditions will be more
tolerant of nematode damage but may contribute to
Fig. 10.25
Root lesion nematode symptoms.
increased populations. Experiments in Western Australiahave shown significant yield losses in both wheat (5-10%)and barley (5-20%). Losses of 5-10% may gounrecognised. Where a root lesion nematode threat exists,a range of agronomic management options can be used.No chemical control options exist.
The most effective means of reducing soil infestationsof root lesion nematode (or preventing its build up) is togrow resistant crops or pasture in the rotation. Crops suchas field pea, faba bean, lupin, lentil, rye, triticale, durumwheat and oats have varying degrees of resistance and somake good break crops (Table 10.3.). Growing these cropsshould reduce nematode density in soil. Some crops may
Resistant (break) crops Susceptible (host) crops
Plant P. neglectus P. thornei Plant P. neglectus P. thornei
Faba Bean R MR Medic MS MR-R
Field Pea R R Barley MS-MR MR
Rye R Sub. clover MR S-MS
Lupin MR-R R Vetch MS-MR S-MS
Triticale MR-R MR-R Canola S MR
Lentil MS-MR R Wheat S-MR S-MR
Durum MS-MR MR Chickpea S S-MS
Oats MS-MR -
R = resistant, MR = moderately resistant, MS = moderately susceptible and S = susceptible
Table 10.3. Resistance/susceptibility of major crops and pastures and their general role as break crops or host crops withrespect to two nematode species (Data provided by S. Taylor SARDI, V. Vanstone University of Adelaide & G. HollawayAgVic)

THE WHEAT BOOK CHAPTER 10 – DISEASES
225
OCCURRENCE, RECOGNITION AND CONTROL (continued)
be resistant to one species but susceptible to another (e.g.canola is susceptible to P. neglectus but moderately resistantto P. thornei). Where mixed populations of Pratylenchusspecies occur crops resistant to only one species may allowthe other species to increase.
There are differences between varieties for resistanceand tolerance to Pratylenchus species. Where a root lesionnematode problem is recognised, the risk of build up andimpact will be reduced if a moderately resistant ormoderately susceptible variety is grown in preference tosusceptible varieties. In the absence of suitable varietieswith resistance, selection of a more tolerant variety willminimise the risk of yield loss, though nematodepopulations are likely to increase.
Control summer weeds well in advance of cropping.Maximising the pre-plant fallow period with early weedcontrol may be important to reduce potential nematodeactivity before cropping. Early weed control rather thandelayed sowing should be used to maximise the pre-plantfallow period.
There is little information on the effect of tillage onroot lesion nematodes. In dry soil, root lesion nematodesare brittle and highly vulnerable to soil disturbance whilein wet soil the nematodes are much less fragile. Reducednumbers of Pratylenchus thornei were found to beassociated with multiple tillage in Queensland. In mostcircumstances contemporary tillage operations are unlikelyto substantially influence nematode numbers..
Adequate nutrition will help to compensate for loss ofroot function caused by root lesion nematode. Loss of rootfunction through nematode damage may also induce traceelement deficiencies. In these situations application offoliar trace element sprays may alleviate a deficiency andhence improve crop yield. Where crops are known to beinfested with damaging levels of nematodes, plant tissuetests may be used to check whether nutrient deficienciesare present.

CHAPTER 10 – DISEASES THE WHEAT BOOK
226
OCCURRENCE, RECOGNITION AND CONTROL (continued)
Cereal cyst nematodeOccurrenceCereal cyst nematode (CCN), Heterodera avenae, is an
important disease in cereals in South Australia andVictoria. It is known to occur in the northern, central andoccasionally southern agricultural areas of WesternAustralia, but its impact is less than in eastern Australia asthe disease is comparatively uncommon.
RecognitionCCN appears as patches of poor growth similar to
those caused by nitrogen deficiency or water stress. Plantsare stunted and yellowish, due to the lack of nutrientscaused by the root damage. When examined closely theroots have small swellings (looks like knots), with manyside roots protruding from these swellings (Fig. 10.26).This gives the roots a brush-like appearance. The minutewhite cysts may be evident in spring, turning brown as theseason progresses. Soil tends to stick more closely toinfected roots, so they are harder to wash clean. Affectedplants are stunted, have fewer tillers and generally lack thevigour of unaffected plants. Patches can vary in size from 1to 100 metres within a paddock.
Fig. 10.26
Cereal cyst nematode symptoms.
Life cycleCereal cyst nematodes survive during the summer
months as cysts within the soil. During autumn, when thesoil temperatures drop and soil moisture levels haveincreased the cysts break their dormancy and the nematodejuveniles begin to hatch. Hatching occurs over an eight toten week period when the soil temperature has dropped to12˚C. After hatching the juveniles move towards the plantroots and penetrate through the growing tips. Feeding ofthe juveniles causes the roots to proliferate above thedamaged root. The females produce eggs within their ownbody and swell. These white females are visible to thenaked eye. These then encyst as the soil moisture decreasesto survive over the summer months.
ControlMost crop damage occurs when continuous wheat
cropping is practiced. The best control is achieved through
the use of crop rotation with a legume crop or with non-grass pasture. Most grasses are very good hosts to CCN, sothe reduction of volunteer grasses within a pasture and theuse of leguminous crops will help reduce the population ofCCN. Following a severe infestation a two year break isrecommended to reduce population numbers to a low leveland prevent crop damage. Resistant cultivars have beendeveloped in South Australia and Victoria and can assistmanagement in extreme cases in Western Australia.
Sow crops early to reduce root damage. Early sowncrops have a well established root system before infectionoccurs. Crops sown late after the break have a poorlydeveloped root system and when the larvae hatch andinfect, are less able to tolerate the disease.
Improve soil fertility. This encourages better cropestablishment and enables the plants to offset the rootdamage caused by nematodes, by faster root growth anddevelopment of a larger root system.

THE WHEAT BOOK CHAPTER 10 – DISEASES
227
OCCURRENCE, RECOGNITION AND CONTROL (continued)
Common root rotOccurrenceThe fungus Cochliobolus sativus (Bipolaris sorokiniana)
causes common root rot. This disease is a major problemin New South Wales and Queensland. Although thefungus is widespread in Western Australia, particularly inthe northern wheatbelt, it appears to cause only a minorreduction in yield.
RecognitionThis disease does not cause distinctive symptoms
within a crop. Infected plants are paler and stuntedcompared to healthy plants, and appear singularly or inirregular patches.
Roots of infected plants are brown, especially the sub-crown internode (section between the crown and the seed).This distinguishes the disease from take-all which causesblackening of the sub-crown internode and roots.
ControlBipolaris survives on roots of grasses and as spores in the
soil. Rotations with legumes, pulse or oilseed crops willreduce the build up of the fungus in the soil. A one yearrotation may not always prevent crop damage. Increasingthe soil fertility will reduce the impact of the disease on thecrop. Oats are less susceptible than wheat, barley ortriticale. It is more likely to occur when wheat and barleycrops have been grown in a close rotation. Little is knownabout responses of Western Australia varieties to commonroot rot.

CHAPTER 10 – DISEASES THE WHEAT BOOK
228
OCCURRENCE, RECOGNITION AND CONTROL (continued)
Pythium root rotOccurrencePythium root rot (Pythium spp.) is most common in
areas of high rainfall. Very little is known about the impactof the disease on crops in Western Australia. It is morelikely to occur during wet years especially if it is very wetafter the break of the season and the crops have just beensown.
RecognitionPlants are stunted, develop poorly and generally look
unthrifty and nitrogen deficient. These plants may havereduced tillering and may die within the field. Plants canoccur individually throughout the crop or may occur inpatches where the soil is waterlogged.
The root system is stunted (looks stubby) with very fewlateral roots present. The roots are soft and yellow to lightbrown in colour.
ControlThere are no resistant varieties to the disease. A short
rotation with a legume or pulse crop will not reduce thelevel of disease as the fungus survives as oospores in the soilfor over 5 years. Pythium exists mainly in the top 10-15cmof soil where fine wheat roots are abundant, and wherecrop residues are deposited. These residues providenutrients and moisture to the fungus.
Most crop damage occurs when rainfall is high aftersowing. The disease is more severe in direct drilled cropsand where stubble is retained. Avoid sowing into cold wetsoils, or sowing crops directly after applying herbicides tocontrol grass weeds.
Increase soil fertility. Plants may recover from earlyinfection where nutrition is adequate to promote rootgrowth. Studies in Canada have shown that the disease isworse in crops that have phosphorous deficiency.

Chapter Coordinator: R. EmeryWheatbook 1 Author: AnonRevised by: R. Emery
Determining the need for chemical treatment ............................................232
Major pests ..........................................................................................................233Redlegged earth mite ..........................................................................................233Webworm ..........................................................................................................234Lucerne flea ........................................................................................................235Cutworm ............................................................................................................236Desiantha weevil ................................................................................................237Cockchafers ........................................................................................................238False wireworm ..................................................................................................239Aphids ................................................................................................................240Armyworm ..........................................................................................................241Stored Grain Insects ............................................................................................242
THE WHEAT BOOK CHAPTER 11 – INSECT PESTS
229
CHAPTER ELEVEN
INSECT PESTS

CHAPTER 11 – INSECT PESTS THE WHEAT BOOK
230
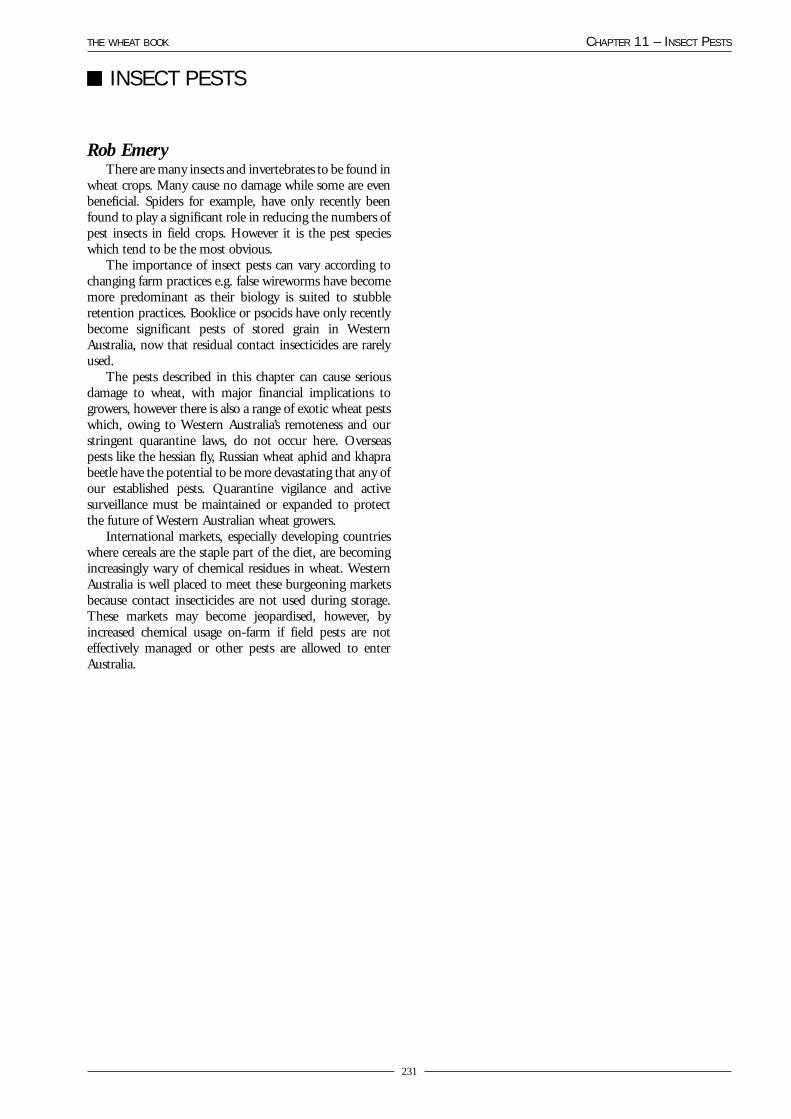
Rob EmeryThere are many insects and invertebrates to be found in
wheat crops. Many cause no damage while some are evenbeneficial. Spiders for example, have only recently beenfound to play a significant role in reducing the numbers ofpest insects in field crops. However it is the pest specieswhich tend to be the most obvious.
The importance of insect pests can vary according tochanging farm practices e.g. false wireworms have becomemore predominant as their biology is suited to stubbleretention practices. Booklice or psocids have only recentlybecome significant pests of stored grain in WesternAustralia, now that residual contact insecticides are rarelyused.
The pests described in this chapter can cause seriousdamage to wheat, with major financial implications togrowers, however there is also a range of exotic wheat pestswhich, owing to Western Australia’s remoteness and ourstringent quarantine laws, do not occur here. Overseaspests like the hessian fly, Russian wheat aphid and khaprabeetle have the potential to be more devastating that any ofour established pests. Quarantine vigilance and activesurveillance must be maintained or expanded to protectthe future of Western Australian wheat growers.
International markets, especially developing countrieswhere cereals are the staple part of the diet, are becomingincreasingly wary of chemical residues in wheat. WesternAustralia is well placed to meet these burgeoning marketsbecause contact insecticides are not used during storage.These markets may become jeopardised, however, byincreased chemical usage on-farm if field pests are noteffectively managed or other pests are allowed to enterAustralia.
THE WHEAT BOOK CHAPTER 11 – INSECT PESTS
231
INSECT PESTS

This chapter outlines the nine major insect pests ofwheat in Western Australia along with managementmethods that have proven practical under WesternAustralian conditions. Recommendations, especiallychemical, are current at the time of publication. Themention of some active ingredients does not implyapproval to the exclusion of others and the user bears theresponsibility for correct use and is legally bound to use thechemical in accordance with the label.
The appearance of damaging population from year toyear cannot usually be predicted with accuracy and in anycase management and weather will affect pest numbers. Itpays to become familiar with the major pests and theireffect and to examine crops before damage occurs. Weeklyscouting of crops is advisable bearing in mind that differentpests will attack the crop at different developmental stages.For example, cockchafers and desiantha weevils willcompletely devour developing seedlings, while grain insectswait until the wheat has been harvested before going towork.
A sweep net is a valuable aid in determining pestnumbers for aphids, lucerne flea and desiantha. The extentof cockchafer and false wireworm infestations can becalculated as number of grubs per shovelful of earth, whileother pests require visual inspection.
As well as working out the likely returns from the cropand the cost of treatment it is important to consider thefollowing:
Growth stageThe seedling stage is the most critical as relatively small
pest numbers may cause rapid and extensive damage.Where large numbers of webworm or cutworm are present,it may even appear that the crop has not germinated whenthe pest has eaten cotyledons as soon as they appear aboveground.
Crop healthA vigorously growing crop of adequate plant density
can withstand considerable insect attack with littleappreciable yield loss. Where sowing has been too deep orthe crop is stressed for moisture, the significance of pestattack will be greater.
ManagementPaddock management may have a great effect on pest
numbers especially those of webworm. Paddocks which arestill very grassy in April, when webworm eggs are laid, areat risk. Conventional weed control, giving a three weekfallow, will give complete control of this pest, whereasnumbers may increase significantly with minimum tillageplanting.
Some rotations can increase the likelihood of damageby some pests e.g. cockchafers can cause severe damage tocereals following pasture but are almost impossible to findfollowing lupins.
Biological control versus sprayingSome form of biological control invariably operates
against all pests. Aphids, for instance, have many predators,parasites and diseases which may be seen and should bepreserved where possible by using a selective chemical andspraying only when necessary.
When pests are at economically damaging numbers,reliance cannot be placed on biological control as there isusually a delay while predators and parasites build up theirnumbers. For example, when 25% or more of seedlings aredamaged by webworm, bare or very sparse patches in thecrop will result. The crop should then be sprayed quicklyas complete recovery is possible. An alternative, in grassypaddocks sown with reduced tillage where the risk is high,is to apply the insecticide with the knockdown herbicide.
Resowing after pests have progressed to a non-damaging stage is sometimes a viable option given an earlybreak to the season. For example, cockchafers are majorpests in the larval stage but insignificant once they haveturned into pupae.
Changes in the weather can sometimes effect pestoutbreaks e.g. warm-moist conditions can increase theincidence of a fungus that attacks aphids.
CHAPTER 11 – INSECT PESTS THE WHEAT BOOK
232
DETERMINING THE NEED FOR CHEMICAL TREATMENT

Some of the more important pests of wheat in WesternAustralia and they way they damage crops are describedbelow.
Redlegged earth miteDamage
Large numbers of redlegged earth mite (RLEM) arecommonly found but normally do not affect cerealsseverely. Mites rupture cells on the surface of leaves andfeed on exuding sap; affected leaves look silvered, but donot have holes or windows as with lucerne flea attack. Mitedamage to seedlings is more severe if plant growth is slowedby cold and/or waterlogging.
DescriptionAdult mites (Halotydeus destructor) are about the size of
a pinhead (up to 1mm). They have velvety black bodiesand eight bright orange-red legs. The mites are oftengregarious and are found clumped together in largenumbers. They disperse quickly when disturbed.
Life cycleMites hatch from over-summering eggs in autumn
when adequate moisture and low temperatures occur. Eggsproduced through the season are thin-walled and hatchimmediately, and several generations may develop overwinter and spring. As pastures begin to senesce, the mitesproduce thick-walled eggs which resist drying over summerand carry the mite through to the next season.
seedlings in autumn. Hard spring grazing will also reducedamage.
There are a number of organophosphorus-basedchemicals currently registered for control of redleggedearthmite. These include chlorpyrifos, dimethoate,endosulfan and maldison, methidathion, omethoatephosmet, as well as the synthetic pyrethroids alpha-cypermethrin and bifenthrin.
Biological control of RLEM is being promoted bycollecting a predatory mite, the anystis mite, from originalCSIRO establishment sites and spreading it throughoutthe agricultural region. Establishing this predator dependson careful handling during collection and transport, andon ensuring there are areas of adequate dry plant cover inpaddocks for shelter over summer.
THE WHEAT BOOK CHAPTER 11 – INSECT PESTS
233
MAJOR PESTS
Figure 11.1: Redlegged earth mite
ControlPasture paddocks being prepared for cropping should
have mites controlled the spring before the crop year.Treating seed with a systemic insecticide before sowingcrops will protect seedlings from RLEM. Systemicchemicals can also be used if more than 60% of plants haveemerged. If few plants have come up and cotyledons arebeing damaged as they emerge, it is more effective to use acontact insecticide. Mite control in dense spring pasturesmay require higher rates of insecticide than are effective on

WebwormDamage
Large areas of emerging wheat crops may be destroyedby the continual chewing damage of a heavy webworminfestation. The caterpillars sever leaves or whole plantswhich they scatter on the ground or pull into holes near theplants.
DescriptionWebworm caterpillars (Hednota spp.) are seldom seen
as they come above ground level only when conditions arecool and damp, and usually at night.
They may be located in their weblined tunnels fromwhich plant parts may be seen protruding.
The caterpillars are pale to deep brown with a tinge ofthe green gut contents showing through. The head appearsblack or dark brown. Fully grown caterpillars are about15mm long.
Life cycleCaterpillars hatch from eggs laid amongst grass in
autumn and feed throughout the winter.Spring and summer are passed in the tunnels as resting
stage caterpillars. After this, the insects proceed through
the pupal stage and emerge as adult moths, which areabout 10mm long and may be seen flying in large numberson autumn nights. By day they hide in dry grass, the colourof which they closely resemble.
ControlThe paddock condition and the weather in autumn are
very important in determining webworm numbers.Eggs will not be laid in great numbers and will not
survive well in a bare paddock or in stubble. Grassysituations favour survival.
Cultivations leading to a weed free paddock over athree week period destroy the young stages but reducedtillage cropping methods allow a greater survival. Hot anddry conditions during May and June, resulting in a lack offeed, could destroy most webworms.
If a quarter of the plants are being seriously damaged ator just after emergence, spraying should not be delayed asthe continued feeding will kill many plants and result inbare ground or thin areas.
The only organophosphorus-based chemical registeredfor webworm control in cereals is chlorpyrifos. There arethree synthetic pyrethroid chemicals; beta-cyfluthrin,alpha-cypermethrin and deltamethrin.
CHAPTER 11 – INSECT PESTS THE WHEAT BOOK
234
MAJOR PESTS (continued)
Figure 11.3: Webworm adults
Figure 11.2 Webworm larvae

Lucerne fleaDamage
Wheat crops may be seriously retarded by the lucerneflea and seedlings may be killed in heavy infestations.Green leaf tissues are often eaten, leaving a surface of theleaf as a whitish film. Severely affected areas appear, from adistance, to be bleached.
DescriptionLucerne fleas (Sminthurus viridis) usually spring from
the plants when approached, using a special organ situatedunderneath the body. The lucerne flea is a dumpy lookingand wingless creature of varied colour, but the largerspecimens of 2 to 4 mm are predominantly green or yellow.
Life cycleThe first soaking autumn rains cause the special over-
summering egg batches to hatch. Several generations maythen develop over the growing period depending upon theweather. Eggs are laid in the soil and usually hatch in a fewdays. With the onset of warm and dry conditions in spring,the resting stage eggs (which are able to withstand summerconditions) are laid.
ControlThe lucerne flea is favoured by heavy soils and cannot
live in very sandy situations. It also depends on plentifulmoisture.
Systemic or contact insecticides can be used asdiscussed for redlegged earth mite. Synthetic pyrethroidchemicals are unsuitable because they selectively killredlegged earth mite which compete with lucerne flea. Thiscan result in an increase in lucerne flea numbers after asynthetic pyrethroid treatment.
A predatory mite, the bdellodes mite, is present overmost of the area occupied by lucerne flea and exerts a usefullevel of control. Another predatory mite, the neomolgusmite, was introduced by the CSIRO and has been releasedat many places in the agricultural area. It will extend thearea and level of biological control.
Chlorpyrifos, dimethoate, maldison, methidathion andphosmet are the only chemicals registered for control oflucerne flea in cereals. These chemicals are allorganophosphorus-based.
THE WHEAT BOOK CHAPTER 11 – INSECT PESTS
235
MAJOR PESTS (continued)

CutwormDamage
The cutworm chews through plant parts, often fellingthe plant at ground level. Just two or three large caterpillarswould seriously damage a square metre of crop. This is nota regular pest but large areas may be affected.
DescriptionThere are several species in this State, including Agrotis
infusa and A. munda, which vary in appearance but thelarvae are all smooth and plump.
The larva of the most common species, the pinkcutworm, is grey-green with a pink tinge and is usuallyfound in sandy soils.
The larva of another common species, the bogongmoth, is dark grey.
The larvae usually hide by day but may be found underthe surface and often close to a damaged plant. They curlup when disturbed.
At times, brown cutworms (with a herringbone patternalong the back) damage crops. In south coastal areas theyare more likely to be found on the soil surface by day, thanare the pink or black cutworm.
The adult moths of herringbone cutworm are ofvarious species, and range from black, through grey tobrown.
Occasionally, autumn attack by armyworm in cerealsresembles cutworm damage (see armyworm). This issignificant, because armyworm are harder to kill withinsecticides than are cutworm.
Organophosphate, carbamate and pyrethroid chemicalare all registered for control of cutworm in cereals. Theseinclude chlorpyrifos, diazinon, trichlorfon (OP), carbaryl(C) and alpha-cypermethrin, deltamethrin, esfenvalerate,lambda-cyhalothrin, permethrin, beta-cyfluthrin (SP).
Life cycleEggs are laid on the soil or on plant material close to the
ground. The larva may grow 50mm long before becominga pupa and then the adult moth. The adults are stout-bodied, with a wing span of up to 40mm. The forewingsare patterned brown or dark grey. Several generations arepossible in one season.
ControlThe weather and food supply are the most important
factors in determining abundance. Paddocks with goodmanagement of grasses during the previous spring are lessat risk. Biological control, such as by fungal diseases, maybe spectacularly successful, while wasp and fly parasites arealso very active in preventing more frequent and seriousoutbreaks.
CHAPTER 11 – INSECT PESTS THE WHEAT BOOK
236
MAJOR PESTS (continued)
Figure 11.4:Lucerne Flea
Figure 11.5: Cutworm larvae
Figure 11.6: Cutworm adults

Desiantha weevilDamage
Desiantha weevil (Desiantha diversipes) is a sporadicpest of cereal seedlings in southern areas. It is the larvalstage which can completely destroy hundreds of hectaresby feeding on underground parts of the seedlings. Plantgrowth may be slowed or plants may wilt and die and areeasily pulled from the soil.
DescriptionThe larvae are white, legless creatures 6mm long and
with orange-brown heads. They remain under the soil andare difficult to locate although some painstaking diggingmay reveal the larvae close to plants.
Life cycleEggs are laid in autumn and hatch after opening rains
and the larvae commence feeding on young pastureseedlings. When cereal crops are planted into heavilyinfested paddocks, they are attacked by the larvae whichmay be well grown. In spring the larvae pupate andbecome adults, which are grey-black weevils,approximately 5mm long with the typical weevil snout.The adults are common in spring and summer hiding
under wood or stones or they may be found on cereal headsand can be harvested with the grain.
ControlChemical control after planting is not possible.
Problem infestations are most likely to occur where shallowsand occurs over gravel or clay. As larvae will be largerfollowing summer rain, crops should be planted early andshallow to minimise attack. Where the pest is confirmed,planting with treated seed at 90 kg/ha is recommended.Chlorpyrifos is the only chemical registered for control ofdesiantha in cereals.
THE WHEAT BOOK CHAPTER 11 – INSECT PESTS
237
MAJOR PESTS (continued)
Figure 11.8: Desiantha weevil adult
Figure 11.7: Desiantha weevil larvae

CockchafersDamage
Cockchafer larvae feed underground and some speciesare serious pests which may slow growth or kill large areasof cereals by eating plant roots. Young plants withoutextensive root systems are worst affected and more thanthree grubs per shovel full of soil will cause some damagewhile five or more may completely destroy the crop causingerosion problems in the subsequent summer. The adultbeetles are also destructive as they feed on tree foliage. Thecockchafer which has caused the most damage to wheatcrops in Western Australia is Heteronyx obesus.
DescriptionThere are several important pest species and adults
range in size from 5 to 20mm. Adults are usually brown orblackish beetles sometimes called “Christmas beetles”. Thebeetles fly readily and are attracted to lights. Cockchaferlarvae are characteristically “C” shaped creamy white grubsbetween 2 and 25mm long.
Life cycleThe complete life cycle may take one or two years.
Some species have a long larval stage which extends over 12to 18 months. In most species the larva is active during lateautumn and winter, then pupate in spring with adultsemerging in early summer. Feeding, mating and egglayingmay occur throughout summer.
ControlControl of cockchafer larvae is usually not economical.
The main pest species in this State cannot be controlledwith chemicals after planting as the larvae remainunderground. It is not possible for insecticides to penetratethe soil far enough to have any effect; even following heavyrainfall. Shallow planting and planting with treated seed ata high rate may help to overcome the problem byestablishing a strong root system early in the season. Theproblem is most serious when early growth is slow. Largepopulations of non-pest species may be present under
CHAPTER 11 – INSECT PESTS THE WHEAT BOOK
238
MAJOR PESTS (continued)
young crops and in pasture without causing visibledamage. The organophosphate chlorpyrifos is registered forcockchafer control in cereals.
Figure 11.9: Cockchafer larvae
Figure 11.10: Cockchafer adult

False wirewormDamage
False wireworm larvae may be present in the soil inhigh numbers with little or no damage to plant seedlingsbecause they are primarily feeding on dead organic matter.Occasionally, larvae do chew into the seedling stem androots, weakening the plant or ring barking the stem andcausing the plant to fall over. Strong winds, which buffetyoung fragile seedlings, increase the level of plant deaths. Inswathed crops adult beetles may cause a problem throughcontamination of grain samples, as adults shelter withinthe swath and are then caught up into the harvester.
DescriptionFalse wireworm is a general description given to several
species of soil dwelling beetle larvae belonging to the familyTenebrionidae. They are primarily scavengers, feeding onfungi and dead plant material. The larval or worm stage ofthe beetle’s life cycle has been responsible for attackingsome seedling crops. Two main species are known to causedamage in Western Australia: the Vegetable beetle(Gonocephalum elderi) and the bronze field beetle (Adeliumbrevicorne).
ControlIncreased stubble retention and use of minimum
tillage, allowing an abundance of plant material on thesurface, favours beetle survival and increase. Falsewireworms are not a regular pest of cereal crops and use ofchemical control is often uneconomical. As it is difficult toanticipate false wireworm damage, the best option may beto observe the crop carefully and replant the affected partsof the paddock if necessary.
The organophosphate Chlorpyrifos is the onlychemical registered for control of false wireworm in cereals.
THE WHEAT BOOK CHAPTER 11 – INSECT PESTS
239
MAJOR PESTS (continued)
Figure 11.11: Bronze field beetle

olive-green and dusky brown, to a blackish green, and arecharacterised by a reddish patch on the tip of the abdomen.Colonies develop on the outside of tillers from the baseupwards on stems, nodes and backs of mature leaves,starting any time between seedling stage and grain filling.Heavy infestations can blacken heads and flag leaves, andthese are the aphids most commonly reported by farmers.Wheat/oat aphids are more mobile than corn aphids, andcan drop to the soil and crawl to other plants. They causeyields losses probably by reducing grain weight and grainsper head. They can also be important in spreading BYDV.
Rice root aphids are like wheat/oat aphids, but can alsoinfest plant roots. They have a reddish patch in the middleof the back, and are most likely to be found in drieragricultural areas. S. miscanthi aphids are light green withyellow-green tinges, usually found in spring, withoutdeveloping large colonies.
Rose-grain aphids are potentially serious pests, but areyet to enter Western Australia from the eastern States wherethey are widespread. They are green spindle-shaped aphidsattacking wheat and barley during grain filling.
Life cycleWinged aphids fly into crops from pasture grasses or
other crops, and start colonies of wingless aphids. Allaphids in a cereal crop are females, able to give birth to liveyoung without the need to mate. Reproduction is rapidwhen weather conditions are favourable, leading topopulation outbreaks. Cold conditions slow the rate ofdevelopment. When plants become unsuitable orovercrowding occurs, winged young are produced whichmigrate to other plants or crops.
ControlFor BYDV control see the Leaf Diseases section.Crops should be checked from late tillering onwards
for corn aphids in the furled growing tips, and forwheat/oat aphids on stems, backs of leaves and ears.
Crops expected to yield 3 tonnes/ha or more are mostat risk.
Spraying is worthwhile if 50 per cent of tillers have atleast 10 to 20 aphids. Mixed infestations of both aphidspecies may cause more damage than either species on itsown.
Crops sprayed before Zadok’s stage 30 may needrespraying at Zadok’s stage 50 or later, if aphid numbersbuild up again.
Parasitic wasps, ladybirds, lacewing and hoverfly larvaecan provide useful biological control, mainly by preventingsecondary outbreaks. The use of ‘soft’ insecticides that onlykill aphids is advocated. When aphid densities are highweather warm and moist, certain fungi may kill a largeproportion of the population.
Carbamate pirimicarb and the chloronicotinylimidacloprid, are both registered for aphid control incereals in Western Australia as well as the organophosphatechlorpyrifos.
CHAPTER 11 – INSECT PESTS THE WHEAT BOOK
240
MAJOR PESTS (continued)
Figure 11.12: Wheat/Oat aphids
AphidsDamage
Aphids affect cereals by direct feeding on plants, and/orby transmitting barley yellow dwarf virus (BYDV).
Direct damage by aphids feeding can cause losses of upto 30% where crop yield potential is 3 t/ha and higher.Damaging populations may develop in three out of fiveyears. Direct damage occurs when colonies of 10 to 100aphids develop on stems, leaves and heads, from seedlingstage through to head filling. The degree of damage dependson the growth stage of the crop, percentage of tillers infested,aphids per tiller, and the duration of the infestation. Feedingdamage often has no obvious signs or symptoms, althoughheavily infested plants may be covered in black sooty mouldswhich live on the sugary honeydew excreted by aphids.
BYDV is introduced into cereal crops from infectedgrasses by flying cereal aphid vectors. The aphids carry thevirus in their mouthparts. Medium to high rainfall zones,where aphids can arrive early in the life of the crop, are atmost risk. Virus symptoms take at least three weeks toappear and can easily be confused with those of nutrientdeficiencies, e.g. leaf yellowing in barley and some wheatvarieties, reddening of older leaves in oats and the flag leafin other wheat varieties. Damage is greatest when spreadoccurs early in the growing season, before the end oftillering. Plants become stunted and yield losses can be upto 50%. Also grain quality can be affected as theproportion of shrivelled grain increases.
DescriptionCorn aphid (Rhopalosiphum maidis) and wheat/oat
aphid (R. padi) cause most yield loss. Rice root aphid (R.rufiabdominalis) and Sitobion miscanthi (no commonname) are also found in cereals but usually in lowernumbers. Wingless aphids are about 0.2 to 2.5mm long.
Corn aphids are dark blue-green to grey-green, oftenwith a white dusty appearance. Colonies are often difficultto detect because they usually develop within the furledleaves of tillers any time from seedling to head emergence.Barley is more likely to be affected than wheat.
Wheat/oat aphids are the most abundant species ofcereal aphids and vary from mottled yellow-green through

ArmywormDamage
Armyworms are regular pests of coarse grain crops onthe south coast of Western Australia and occasional pests ininland areas. Towards the end of spring, when crops areapproaching maturity, large armyworm caterpillars chewthrough the stems of barley just below the head, causingheads to fall to the ground. If in large numbers early in theseason, armyworms may eat leaves and be confused withcutworm.
DescriptionThere are four species of armyworm in Western
Australia – the common armyworm, the southernarmyworm, the inland armyworm and the sugarcanearmyworm (Mythimna convecta, Persectania ewingii,Persectania dyscrita and Mythimna loreyimima respectively).Of these, the common armyworm is the most damaging.Moths are stout bodied, grey to cream, with a wingspan ofabout 40mm. They fly at night and are strongly attractedto lights. Armyworm caterpillars vary in colour dependingon their numbers in a crop. If there are many caterpillars ina crop they become dark, while if the population is low, thecaterpillars are much paler. Armyworms are about 40mmlong when fully grown and can be distinguished fromcutworms and budworms by their large heads and threeprominent white stripes on the “collar” behind the head.Often the armyworms themselves will not be seen as theyfeed mainly at night, but their droppings (which look likesmall green “square” hay bales) will be obvious on theground below the crop canopy. Another indicator thatarmyworms are present is damage to ryegrass seed heads.
Life cycleArmyworms have three or four generations per year
and on the south coast they survive over summer on self-sown cereals and grasses that germinate with summer rains.Numbers can increase rapidly in years with heavy summerrain. In spring it takes about three weeks from when theeggs are laid for them to hatch and for the caterpillars to
THE WHEAT BOOK CHAPTER 11 – INSECT PESTS
241
Figure 11.13: Armyworm larvae
reach head-lopping size. Once damage begins many headscan be lopped in a short time. Inland armyworm breed upin pastoral areas during wet summers giving rise to largeflights of moths which can invade agricultural areas.
ControlHeatwaves may kill most of the caterpillars and native
parasites can exercise good control, meaning that sprayingis not normally required every year. Several introducedwasp parasites including Apanteles ruficrus have beenreleased to increase biological control.
The organophosphates chlorpyrifos, diazinon,maldison, methidathion, trichlorfon; the carbamatesmethomyl and carbaryl as well as the synthetic pyrethroidsalpha-cypermethrin, beta-cyfluthrin, cypermethrin anddeltamethrin are all registered for armyworm control.
Figure 11.14: Armyworm adult

(Rhyzopertha dominica, Sitophilus granarius and Sitophilusoryzae respectively). Secondary grain insects require grainwhich is cracked or has been damaged by primary insects.The rust-red and confused flour beetles (Triboliumcastaneum and Tribolium confusum), sawtoothed grainbeetle (Oryzaephilus surinamensis) and flat grain beetle(Cryptolestes spp) are secondary insects. All the grain mothswith the exception of the Angoumois grain moth (Sitotrogacerealella) are secondary insects. Heavy infestations cantaint grain and reduce germination of seed. It is, however,their contamination of export grain which is the majorproblem. No grain insects whatsoever are permitted ingrain shipments and this position is vigorously defended byinspection and fumigation. Grain and feed merchants in
Western Australia have agreed that they will no longeraccept infested grain.
DescriptionAll stored grain beetles are small, 2 – 5 mm long and
brown to black. True weevils can be identified by theirelongated snout used to bore into seeds for egg laying. Thelarvae of the grain moths are generally pinkish or creamand may produce webs across the surface of the grain.
Pests of quarantine significance include the warehousebeetle (recently found in Western Australia) and the khaprabeetle. The latter is the most serious pest of stored grain inthe world and is not found in Australia. The khapra beetleis almost impossible to distinguish from the warehousebeetle and a wide variety of native Trogoderma beetlesfound in Western Australia, hence the need for monitoringand surveillance.
Life cycleThe eggs of secondary beetles are laid free between
grains or in the cereal product. The larvae also liveexternally to the grains and pupate free in the commodity.The lesser grain borer lays its eggs free in the grain, but thelarva enters a grain shortly after hatching and completes itslife cycle inside the grain. The adult bores its way out of the
Stored Grain InsectsDamage
Once grain reaches storage its quality cannot go anyhigher, all the grower’s effort and expense is now held inone place and its value can only go down unless the grainis protected. Grain stored on farms will eventually becomeinfested by grain beetles or moths unless specific measuresare taken. Primary grain insects found in Australia are thosewhich can attack and reproduce in whole grain and includethe lesser grain borer, the granary weevil and the rice weevil
CHAPTER 11 – INSECT PESTS THE WHEAT BOOK
242
Figure 11.15: Lesser grain borer
Figure 11.16: Rice Weevil
Figure 11.17: Khapra beetle larva
hollowed out grain upon emerging from the pupa. Thewhole life cycle of stored grain pests is usually spent insidethe grain bulk. Under ideal conditions (around 28°C) thelife cycle may be completed in 30 to 40 days buttemperatures below 15°C may extend this to 300 days.The confused flour beetle and granary weevil are bothflightless while the others are strong fliers.
ControlGrain insects are declared under the Agriculture and
Related Resources Protection Act. Limited chemicalcontrols are available to Western Australian farmers due tothe State’s residue-free approach to grain storage andmarketing. Because no stored grain pests can exist in

THE WHEAT BOOK CHAPTER 11 – INSECT PESTS
243
MAJOR PESTS (continued)
standing crops, emphasis is placed on hygienic storage andrigorous cleaning of handling equipment.
Stored grain can be protected from subsequentinfestation with diatomaceous earth protectants likeDryacide®. Existing infestations are best treated with thefumigant phosphine used in sealed storages. These storagesshould be tested annually to ensure they remain gas-tightand failed rubber seals replaced. Ineffective use ofphosphine can lead to resistance and eventually controlfailures. In-transit fumigations are illegal and extremelydangerous.
Figure 11.18: Rust-red flour beetle
Phoscard® farm fumigation indicator cards have beendeveloped by Agriculture Western Australia to assistfarmers in assessing the success of their phosphinefumigations. Sample Phoscards are available fromAGWEST.

CHAPTER 11 – INSECT PESTS THE WHEAT BOOK
244

Chapter Coordinator: D. BowranWheatbook 1 Author: D. BowranRevised by: D. Bowran
Introduction ..................................................................................................247
Cost of Weeds in Wheat ................................................................................248
Weed control before seeding ........................................................................249
Herbicides for Weed Control in Wheat ........................................................250Pre-emergence weed control ..............................................................................250
Pre-emergent Herbicide Overview ..................................................................250Early post-emergence weed control ....................................................................252
Grass Weeds ....................................................................................................252Broad-leaved weeds ..........................................................................................253
Late post-emergence weed control ......................................................................254
Integrated Weed Management ......................................................................256
References: ....................................................................................................257
THE WHEAT BOOK CHAPTER 12 – WEED CONTROL IN WHEAT
245
CHAPTER TWELVE
WEED CONTROL IN WHEAT

CHAPTER 12 – WEED CONTROL IN WHEAT THE WHEAT BOOK
246

David BowranWeeds often impose the most significant costs to wheat
crops, either from the yield loss which comes fromcompetition between the crop and weeds, or else in thecosts of applying appropriate control measures. Whileherbicides provide effective tools to manage weeds in manycrops, the changes in weed spectrum that have occurredwith herbicide resistance and the development of newcropping systems should remind us that weeds will exploitany opportunities become available within the crop.
When developing a weed control program for use inwheat it is vital to plan ahead so that all managementtechniques which minimise the build up of weeds in phasesprior to the wheat crop can be considered or used. It is alsoimportant to know the weed species present, their density,area involved and distribution over the paddock. Differentweed species have different competitive abilities and theeconomic threshold for control varies between weedspecies.
The acceptable threshold of weed numbers is lower ina continuous cereal-lupin rotation than in a cereal-pasturerotation. In a continuously cropped paddock, control ofearly weed competition and prevention of seed set fromlate germinated weeds are both important. When a cerealcrop is followed by pasture, emphasis should be placed onreducing early weed competition rather than preventingseed set, as weeds which germinate later in the crop are lesscompetitive and their seed production may be necessaryfor pasture establishment.
THE WHEAT BOOK CHAPTER 12 – WEED CONTROL IN WHEAT
247
Introduction

In cereal crops, the potential yield is determined by thenumber of tillers per plant, the number of grains per headand the grain weight. Competition for nutrients is criticalin determining the first two factors (with nitrogen beingthe nutrient most in demand by the crop and weed) andusually occurs in the first two to five weeks after cropemergence, while grain weight is determined after anthesisand is mostly affected by competition for water duringgrain filling.
To gain the full yield response to weed control it istherefore critical that weed competition be eliminated asearly as possible in crop development. This loss is afunction of weed density, as lower weed densities willremove less nutrients and may even be out-competed bythe crop. At higher densities, or where transplanted weedsare present, delays may be costly. Trial evidence suggeststhat where grass weeds such as wild oats or brome grass arepresent at similar densities to the wheat crop, yield losses of15-25kg/ha/day may occur and that removal in the firstfive weeks after emergence (or before emergence if aresidual herbicide is used) is required. It may well pay tochange management practices to avoid loss, especially ifweather or other factors will cause significant delays incontrolling the weeds.
Just how much a weed will reduce crop yield is afunction of the species, the density of weeds, the density ofthe crop, when the weed emerges relative to crop, andwhen the weed is removed from the crop. Table 12.1 showsthe average yield loss from a number of different grassspecies in wheat crops when the weed emerges with thecrop (Poole and Gill, 1987).
It can be seen from Table 12.1 that weeds can producesevere reductions in yield even at quite low densities.Where a farmer establishes wheat at 125 – 150 plants/m2and a weed such as ryegrass emerges at the same density,then the potential yield foregone is about 25%. If this weedcannot be selectively removed with herbicides, then thisyield is unlikely to be recovered. Fertilizer applied to thecrop not only enhances crop yield but also promotes weedgrowth and seed production, and is often lost to that yearscrop. Increasing crop density has a major effect onreducing these competition factors. Where weed density islow, increasing crop density will be a major factor in
reducing competition from weeds and limiting weed seedproduction for a following crop.
Weeds may impose other costs in wheat production.Weed seed contamination which reduces grain quality canbe significant if a lower premium is obtained or the crophas to be cleaned after harvest. Weed seeds which have thepotential to be toxic pose particular problems as they maybe difficult to identify or to clean from the crop e.g., drake(Lolium temulentum).
CHAPTER 12 – WEED CONTROL IN WHEAT THE WHEAT BOOK
248
COST OF WEEDS IN WHEAT
Table 12.1 – Yield loss (%) with increasing density of grass weeds in wheat (normal seeding rate 50-60 kg/ha)
Weed density(plants/m2) Annual ryegrass Wild oats Brome grass Barley grass
25 6 11 9 7
50 11 20 17 13
100 20 34 31 24
150 28 43 42 33
200 34 50 50 42
300 44 58 62 53

Weed control for the wheat crop must start as soon aswinter active weeds germinate in summer or autumn. Inmost cases, herbicides if applied while the weeds are small,provide the most cost effective solution to this problem,while conserving the maximum soil moisture for cropestablishment. Glyphosate based herbicides provide a widespectrum of weed control, can be tank mixed with otherherbicides for enhanced knockdown of weeds that are hardto kill and are relatively low cost. The bipyridyl herbicidesparaquat and diquat also offer excellent knockdown weedcontrol especially where weeds are small. The double knocksystem of using glyphosate followed by bipyridyls 5-10days later provides faster burndown of weeds prior toseeding and provides improved control of weeds which arehard to kill with glyphosate.
Cultivation is a useful tool where weed germination isearly and drying conditions follow. Cultivation, to amaximum of 2.5cm, can stimulate weed seeds in theseedbank to germinate on subsequent rain (autumn tickle),and these can then be killed with knockdown herbicide orfurther cultivation. Cultivation is a useful tool for someweeds which are hard to kill with knockdown herbicidesuch as mallow and Vulpia (silvergrass).
Early grazing can be an extremely valuable tool forreducing weeds and minimising the amount of herbiciderequired to kill weeds prior to seeding. Animals alsoconsume weeds such as wireweed and melons and soreduce the blockages in seeding machinery.
Burning of stubble kills both weed seeds andgerminated weeds, and where wheat is sown after wheatwill assist in leaf disease control. Where weed seeds havebeen concentrated into header trails it may be possible tokill 80% of seeds prior to opening rains if the stubble isungrazed and a hot burn can be achieved.
THE WHEAT BOOK CHAPTER 12 – WEED CONTROL IN WHEAT
249
WEED CONTROL BEFORE SEEDING

Herbicides are now the tool of choice for selective weedcontrol in wheat and the range of options for most weedsis extensive. This section brings up to date the chapter onherbicides for weed control in wheat in the publication“The Management of Agricultural Weeds in WesternAustralia” (1993).
Pre-emergence weed controlBarley grass, brome grass and Vulpia spp(silvergrass)
Vulpia, brome grass and barley grass are often aproblem in emerging crops after early seeding or with cropsplanted hastily on the first or second rains. Options forcontrol include;
delayed seeding and use of knockdown,shallow cultivation – tickle.Of the pre-emergence herbicides sulfosulfuron can
provide good control of all species, while metribuzin +trifluralin can be used for brome grass control in Bladewheat. Most of the other pre-emergence herbicides do notgive satisfactory control of these grasses, though thetrifluralin + oryzalin combination does provide goodcontrol of Vulpia in many cases. Diuron appliedimmediately after seeding can give good control of Vulpia.
Barley and brome grass have been successfully removedfrom wheat as they emerge, using low rates of paraquat.Timing is critical, and wheat should not have more thanhalf the first leaf emerged. Spraying under sunnyconditions stops paraquat translocation to the rest of theemerging seedling and minimises damage. However, thecrop will need to be re-sown if the technique fails.
Annual ryegrass and wild oatsPre-emergence herbicide options for the control of
ryegrass include trifluralin, pendimethalin, trifluralin +oryzalin, chlorsulfuron and triasulfuron. Where ryegrassand wild oats occur together trifluralin + triallate may beused, but where wild oats occur alone, triallate is thepreferred option.
Efficacy with these herbicides can be variable due to therequirement for incorporation or, on sandy soils, the highleaching of chlorsulfuron and triasulfuron. Many farmershave switched to post-emergence herbicides such asdiclofop methyl and tralkoxydim for these reasons for thecontrol of ryegrass and wild oats. Many farmers whooriginally used trifluralin switched to chlorsulfuron ortriasulfuron because these herbicides control a wide rangeof broad-leaved weeds as well as ryegrass.
With the development of resistance to diclofop methyland the sulfonyl ureas in ryegrass populations, there hasbeen a large increase in trifluralin use for the control ofryegrass.
Broad leaf weedsChlorsulfuron and triasulfuron provide good control of
a wide range of broad leaf weeds such as capeweed,
doublegee, wireweed, dock, cape tulip, wild turnip, wildmustard and soursob. Triasulfuron may provide up to 70%control of wild radish with pre-emergence application.
Diuron applied immediately after seeding has goodactivity on capeweed, crassula and toadrush. Transplantcapeweed can be successfully treated with diuron +clopyralid and if used just prior to crop emergence yieldreductions from large transplants can be largely overcome.
Pre-emergent Herbicide OverviewThis section provides an overview of the herbicides that
are incorporated before or during seeding, or which may beapplied after seeding but before crop emergence.
Group D1.Trifluralin
The advantages of trifluralin are that it is a relativelycheap pre-emergence herbicide that can be tank-mixedwith knock down herbicides. Points to note:
Trifluralin is slightly volatile and co-distills with watervapour, and should be incorporated in the soil within 4hours if applied to wet soil. Losses due to volatilizationare greatest with moist soil and warm temperatures.Traditional ways of using trifluralin required paddocksto either be pre-worked or have stubble residues thatdid not cover more than 25% of the soil surface.Excessive amounts of stubble can make goodincorporation very difficult, if not impossible, unlessculti-trash seeders are used. Recent innovations withno-till seeding show that if trifluralin is applied prior toseeding then knife points can throw sufficient soil tocover the trifluralin and prevent volatilisation. Ifryegrass seed is on the soil surface sufficient trifluralinis applied to the soil and seed to prevent germination. Trifluralin must be incorporated evenly in the top 2.5cm of soil with wheat sown 1cm under the trifluralinlayer when using full cut points. Wheat sown in thetrifluralin layer will either fail to emerge or if it emergesit may have stunted root systems and poor subsequentgrowth. This factor makes it important to consider thetype of seeding equipment used and the coleoptilelength of the wheat variety. As a safety margin it is wiseto suggest a 10% increase in seeding rates if trifluralinis used. With no-till and knife points the thrown soilacts as the incorporation layer, but soil in the furrowwill be free of trifluralin and prone to weedgermination.As an alternative to incorporation by sowing, trifluralincan be applied immediately after sowing andincorporated by prickle harrows such as Phoenixharrows. This will leave a very uniform, shallow layer ofherbicide, but losses by volatilization will be greaterthan with a full incorporation.Trifluralin is registered for application and
incorporation one or two weeks before sowing. However,
CHAPTER 12 – WEED CONTROL IN WHEAT THE WHEAT BOOK
250
HERBICIDES FOR WEED CONTROL IN WHEAT

many farmers have successfully incorporated trifluralin bysowing, by maintaining good depth control and adequateseeding rates.
The level of control of ryegrass will vary but, generallyspeaking, 75% control should be expected. This makestrifluralin an option where ryegrass densities are likely to below to medium. Some farmers achieve better results withknife points but only if ryegrass seed is on the soil surface.
2. Trifluralin + oryzalin The two dinitroaniline herbicides, trifluralin and
oryzalin are combined together in one herbicide product.Unlike trifluralin, oryzalin is not volatile but because thetrifluralin is present the mixture must be treated in thesame way as other trifluralin based products.
3. Pendimethalin. Like oryzalin it has lower volatility and water solubility
than trifluralin. Consequently it is important to achieveuniform incorporation in the top 2.5cm of soil if goodweed control is to be achieved. Like trifluralin, cropdamage will occur if seed is sown into the treated band.
Group ETriallate
The development of diclofop resistance in wild oats hasresulted in renewed interest in triallate. In the past, farmershave been put off using triallate because of the soilincorporation requirements. According to the existinglabel, triallate must be harrowed into the soil immediatelyafter application. However, many farmers around Australiahave been getting good results with triallate without strictlyfollowing the incorporation instructions. The followingcharacteristics of tri-allate, may explain why this is so:
tri-allate does not volatilise readily and is not brokendown by sunlight;the response to incorporation is due to the need formoist soil to activate tri-allate;tri-allate is bound onto soil particles and is stable tovolatilization from dry soil for up to 28 days attemperatures of up to 50°C.On application to soil, tri-allate becomes bound to soil
colloids and vaporises in the presence of water. It is activein a soil moisture range from 5% above permanent wiltingpoint to 5% below field capacity. The only significantlosses are likely to occur from a moist soil surface.
Losses of triallate from a dry soil surface are expected tobe low and a delay in incorporation of up to 24 hours isunlikely to significantly reduce herbicide activity. This willenable more flexibility in the seeding operation. The onlysignificant losses are likely to occur from a moist soilsurface.
A maximum of 25% ground cover of crop residues canbe tolerated. Rain will wash triallate off stubble onto soil.
Triallate can also provide a moderate level of control ofannual ryegrass and where both ryegrass and wild oats are
present a mixture of trifluralin + triallate can provide goodcontrol of both weeds.
Group B1. Chlorsulfuron and triasulfuron
These are pre-emergence herbicides suitable for thecontrol of ryegrass and a wide range of broad-leaved weeds.After its introduction in 1982, chlorsulfuron was rapidlyadopted because of its ease of use and broad-spectrumweed control.
These herbicides should be applied as near to seedingas possible, application rates should not be cut if conditionsare warm and the herbicides should not be left in the tankbut should be sprayed out immediately. These herbicidesshould not be used on sensitive wheat cultivars, especiallyif temperatures are low.
Precautions which need to be taken when usingsulfonyl ureas are as follows.
They should not be used on paddocks wherewaterlogging, extreme alkalinity or extreme acidity arelikely because crop stress can reduce the ability of wheatplants to metabolize the herbicide, thus leading to cropdamage. Herbicide tolerance results show that recoveryis often faster from triasulfuron retardation, but finalyields for both herbicides are often similarChlorsulfuron and triasulfuron as root pruningherbicides, can induce trace element deficiencies incrops where the trace element levels in the soil aredeficient or marginal.Some varieties of wheat and barley have lower levels oftolerance to the sulfonyl ureas. Neither herbicideshould be used pre-emergence in oats.Sulfonyl urea residues in the soil after cereal crops candamage a subsequent legume crop if conditions remaindry in the year of application or if the soil is alkaline.
2. SulfosulfuronUnlike the previous two sulfonyl ureas, this recent
introduction has activity on wild oats, brome grass andbarley grass. This makes the herbicide a useful addition tothe tools available for brome and barley grass, and whilestrong suppression is seen in many cases, excellent yieldresponses can occur due to reduced weed growth. Theherbicide is useful for barley control in wheat.
Group C1. Metribuzin
When combined with trifluralin, metribuzin canprovide good control of brome grass and annual ryegrass inBlade wheat. Most wheat varieties show some sensitivity tothis combination with 20% yield losses recorded intolerance screens on sandy soils. Heavy rain can leachmetribuzin on sandy soils and seriously reduce efficacy.Metribuzin may provide control of broad leaf weeds insituations where rain is light after incorporation.
THE WHEAT BOOK CHAPTER 12 – WEED CONTROL IN WHEAT
251
HERBICIDES FOR WEED CONTROL IN WHEAT (continued)

2. DiuronVulpia control is often excellent when diuron is applied
to moist soil immediately after seeding. Heavy rain canwash diuron into furrows and kill wheat, so it has to beapplied to either a level seed bed with conventional sowing,or else applied before sowing in no-till systems. Heavy rainmay wash diuron into furrows in no-till seeding systems.
Early post-emergence weed control (crop emergence to pseudo-stem elongation)In considering early post-emergence treatments to any
crop it is important to bear in mind many of the pointssuch as those relating to timeliness of application, rate ofherbicide and crop effects. Herbicides are available for
most weeds for in-crop weed control unless herbicideresistance has developed.
Grass WeedsBarley, brome and silver grasses: Of the grasses found
growing in cereal crops, brome grass, barley grass and silvergrass have often been the hardest weeds to control, but thenew sulfonyl urea herbicide sulfosulfuron has allowedselective control in wheat. Like other sulfonyl ureas, plantsmay be strongly suppressed by the herbicide and thenoutcompeted by the crop. It is unclear yet as to whether ornot all Vulpia species are controlled by sulfosulfuron.
Annual ryegrass and wild oats: Both annual ryegrass andwild oats are two of the most competitive weeds of cereal
CHAPTER 12 – WEED CONTROL IN WHEAT THE WHEAT BOOK
252
HERBICIDES FOR WEED CONTROL IN WHEAT (continued)
Weed Herbicide Timing (no. leaves) Comments on Use
Annual ryegrass diclofop-methyl 1-4 Most active herbicide for thisweed in cereals
chlorsulfuron up to 3 Generally gives good controlof small weeds but sometimesonly provides suppression for2-4 weeks.
clodinafop 1-3 Generally weaker on ryegrassthan wild oats
tralkoxydim 1-3 Weakest herbicide availablefor annual ryegrass and is bestused where wild oats is majorweed.
Wild oats diclofop-methyl 1-4 Less active on wild oats thanon ryegrass. Tillered plants maybe poorly controlled.
fenoxaprop 2-7 Generally gives excellent wildoat control even on tilleredplants.
tralkoxydim 1-6 Excellent wild oat control onplants of most sizes.
flamprop-ethyl tillering Generally applied later thanother herbicides so yieldresponses may be smaller. Maycontrol wild oat resistant toother herbicides.
clodinafop 1-4 Excellent wild oat control
sulfosulfuron 1-4 Good control achievable,strong suppression common
Barley, brome grass sulfosulfuron 1-4 Good control and strongsuppression of these weeds.Severely stunted plants canremain.
Table 12.2 – Herbicides registered for the post-emergent control of grasses in wheat.

crops. The conditions of cereal cropping favour theirgermination and vigorous growth, which when combinedwith their high seed populations from preceding crops orpasture, can often lead to very large reductions in potentialyield. Both species exhibit staggered germination whichoften leads to very poor cultural control. Because of theirstrong competitive effect with the crop, it is desirable tocontrol these weeds in the first few weeks after cropemergence if maximum benefit is to be obtained from theuse of a post-emergence herbicide. The major herbicidesfor control of these two grasses are shown in Table 12.2.
Drake: Drake is a grass weed which looks very similarto annual ryegrass at the seedling stage, but can beidentified at maturity by its larger ears and bigger seeds(which makes separation from the cereal grain difficult).Drake is an unwanted contaminant of grain because of itspotential to carry ergot – a fungal structure – which canpoison products made from the contaminated grain. Drakealso tends to have a slower germination than ryegrass. Theherbicides registered for ryegrass have all been found towork in glasshouse experiments. These are diclofopmethyl, tralkoxydim and chlorsulfuron.
Canary grass: Canary grass is the only other grass weedwhich commonly infests wheat and is usually confined toheavier red clays and clay loams. While not common as aweed, in some situations it may be of sufficient density tojustify control. The herbicides fenoxaprop and tralkoxydimare registered and provide good control. Diclofop methylmay give suppression if applied at the one leaf stage.
Broad-leaved weedsThe number of broad-leaved weeds found in crops is
generally much larger than for grasses. However in generalthere are only a few which are sufficiently widespread orcompetitive to warrant a discussion. The more commonbroadleaf weeds will be discussed below. However someweeds are of significant local importance (soursob, sorrel,dock, fumitory, self sown legumes, wireweed, Paterson’sCurse) and for these and less common weeds referral to theCereal, Pea and Lupin Weed Spraying Charts will provideguidance to what herbicides can be used. Table 12.3 givesan indication of the herbicides used on the major broad-leaved weeds in W.A.
Capeweed: Capeweed is probably the most commonbroad leaf weed of cereal crops given its widespreadoccurrence in pastures and the relative ease with which itsseeds can be wind blown between paddocks. Seedlingcapeweed in crop is readily controlled by a wide range ofproducts with mixtures of diuron + MCPA and 2,4-Dproviding very cost effective control. Clopyralid is a veryeffective herbicide for capeweed for both seedlings andtransplants. It is however slower acting than bromoxynil ordiuron based mixtures but has advantages in excellent cropsafety and in being compatible with most other broad leafand grass weed herbicides. Terbutryne based herbicides aremost effective on seedling capeweed but have the effect of
causing crop yellowing in some situations. Transplantcapeweed is a major problem in some seasons and is then avery competitive weed. Ideally the herbicide to use in thesesituations is one which combines a rapid knockdown effectwith slower systemic activity. However, no herbicidecurrently does this although bromoxynil + MCPA andterbutryne +MCPA can come close. Maximum rates ofclopyralid are generally very effective, while the addition ofclopyralid to other herbicides can enhance their systemicactivity.
Doublegee: Doublegee infestation of cereals is generallyon a lesser scale than for capeweed, but its dormancy andstaggered germination can pose problems with regard tooptimum timing of application. Both metsulfuron anddiuron + MCPA have proven to be cost effective herbicidesfor small seedling doublegee, with metsulfuron theherbicide of choice where large or transplanted doublegeesoccur. Dicamba based herbicides are an excellentalternative especially if rotational options do not allow aGroup B herbicide in the cereal year. It is important toremember that seed production can begin at relatively earlygrowth stages (as few as 4 leaves) especially on stressed orlater emerging plants, and that if control aims to reduceseed production, delays in application to ensure adequateemergence may be counter-productive in some situations.
Wild Radish (and other wild crucifers): The wildcrucifers, and wild radish in particular, continue to be someof the most widespread weeds of cereal crops despite 45years of chemical control. Most weeds of this family exhibitstrong dormancy and staggered germination characteristicswhich make their control difficult. While the sulfonyl ureaherbicides (chlorsulfuron and triasulfuron) can providesome measure of pre-emergence control it is usual torequire follow up treatment where these herbicides havebeen used. The phenoxy herbicides 2,4-D and MCPA havebeen widely used for wild radish control since the late1940s, but because of the potential crop damage problemshave taken a lesser role in more recent years as saferproducts with earlier application timings have beendeveloped. Both sulfonyl ureas chlorsulfuron andtriasulfuron have proven to be effective wild radishherbicides with good capacities to kill quite large plantswhen used in a late post-emergent role. Combinations ofMCPA ester or amine with other herbicides (bromoxynil,diflufenican, diuron, terbutryne) are all generally effectiveif the wild crucifers are small but some consideration ofapplication timing is usually necessary. Bromoxynil +diflufenican combines two effective wild radish herbicideswhich provides for good crop safety and so allows forearlier application than with the MCPA mixtureherbicides. For best weed control with bromoxynil +diflufenican it is necessary to ensure that rates suit weedsize. The current guidelines for herbicide rotation shouldbe carefully considered when planning wild radish controlas resistance in wild radish to Groups B, C, F and I ispresent in either Australia or overseas. The rotation is
THE WHEAT BOOK CHAPTER 12 – WEED CONTROL IN WHEAT
253
HERBICIDES FOR WEED CONTROL IN WHEAT (continued)
especially important with diflufenican based products, asBrodal® remains the key herbicide for wild radish controlin lupins.
Late post-emergence weed control (pseudo stem elongation to grain maturity)To avoid crop yield losses from competition, weeds
must be controlled early in the season. However, weedsmay appear late in the crop because of;
late germination of weeds,failure of earlier herbicide treatments,lack of a control method.It is important that these weeds are prevented from
maturing and setting seeds within the crop. Harvested grain that is contaminated by weed seeds
and other plant fragments may be unmillable. Strict grainreceival standards for levels of weed seed contaminationand unmillable material have been defined by the grainmarketing authority.
Weed seed contamination in grain can be reduced byimproving the screening capacity of the header or bydelaying harvest until weed seeds have been shed. Thesetechniques allow large numbers of weed seeds to return to
the soil and will make weed control more difficult in futurecrops. There is also a chance that seeds of herbicideresistant weeds will be returned to the field. Trailing binsbehind the header have been designed to collect andremove weed seeds from the field.
The difference in price paid for Australian StandardWhite and General Purpose wheat may be sufficient tojustify commercial seed cleaning to remove weed seedcontaminants.
An integrated approach to weed control will ensurethat low numbers of seeds are carried over from year toyear. Thousands of seeds may be produced by a singleplant. While a small infestation of weeds late in the seasonmay not reduce grain yields, the weed seed bank may bedramatically increased. Weed seeds returned to the fieldmay create a problem for many years, particularly when theseeds have a high level of dormancy.
Late post-emergence chemical control will reduce weedseed contamination of the harvested grain sample andreduce weed seed carryover into the following season.
The phenoxy herbicides (2,4-D and MCPA) arecommonly applied as late post-emergence treatments andto reduce the seed set of wild radish, wild mustard, wild
CHAPTER 12 – WEED CONTROL IN WHEAT THE WHEAT BOOK
254
HERBICIDES FOR WEED CONTROL IN WHEAT (continued)
Herbicide Capeweed Doublegee Wild Radish
Bromoxynil � � �
Bromoxynil+diflufenican � � �
Bromoxynil+MCPAe � � �
Bromoxynil+MCPAe+dicamba � � �
Chlorsulfuron �
Clopyralid �
Dicamba �
dicamba+(MCPAa or 2,4-Da) � � �
Diflufenican+MCPAe � �
diuron+(MCPAa or 2,4-Da) � � �
Flumetsulam �
MCPA amine, ester � �
Metosulam �
Metsulfuron �
Sulfosulfuron �
Terbutryne+MCPAa � � �
Triasulfuron �
2,4-D amine, ester �
MCPAa = amine form of MCPA, MCPAe = ester form of MCPA,
2,4-Da = amine form of 2,4-D, 2,4-D e = ester form of 2,4-D
Table 12.3 – Herbicides registered for the post-emergent control of the major broad leaf weeds in wheat crops inWestern Australia.
turnip and lupins. These herbicides must be applied beforebooting and preferably no later than full flag leafemergence otherwise serious yield losses may occur (theseherbicides can stop pollen mother cells dividing andsignificantly reduce pollination of the crop). Sulfonyl ureaherbicides such as triasulfuron can be applied more safelyduring booting and grain filling but wild radish resistancemay limit the long term usefulness of such treatments. 2,4-D can be safely applied after soft dough, but radish controlwill be less effective. Combinations of 2,4-D ester andAlly® have caused large yield reductions and should not beused.
For wild oats a recent innovation is the application ofMataven® during stem elongation through to booting atlower rates than those necessary to kill wild oats. Suchtreatments act to prevent ear development and may beuseful in preventing weed seed return to the seedbank.
The benefits of late post-emergence weed control arereductions in;
weed seed contamination of the harvested grainsample,the need for seed cleaning,seed-set and seed carry-over,weed infestations in future crops.
THE WHEAT BOOK CHAPTER 12 – WEED CONTROL IN WHEAT
255
HERBICIDES FOR WEED CONTROL IN WHEAT (continued)

No one weed control method is normally sufficient byitself for an effective weed control program at reasonablecost. Instead, a combination of agronomic, biological andchemical methods will usually be found to be the mostefficient and cost-effective. In recent years there has been atrend towards over-reliance on the use of selectiveherbicides for weed control at the expense of traditionalcultural methods. The widespread onset of herbicideresistance has meant that selective control of annualryegrass, wild oats and wild radish in wheat is now difficultfor many farms and a whole farm integrated approach isnecessary. For the wheat crop a number of options areavailable which can be employed to minimise the effects ofweeds in the wheat crop.
burning stubble and header trials to reduce weed seedson the surface,light autumn cultivation to ensure even weedgermination,non selective herbicides such as paraquat applied afterseeding and just prior to crop emergence where theweeds have already germinated,Using knockdown rates of herbicides or cultivationtreatments which kill all weeds prior to seeding,delayed sowing to ensure more weeds emerge prior toseeding,increased seeding rate (yield losses from weeds areminimised with sowing rates above 100kg/ha),closer row spacing (e.g. 3”. 7cm, broadcast) to ensureless space for weeds and more competition,placement of fertiliser below the seed or between twinrows of crop so that weeds are further from thenutrient,choosing varieties with the best agronomic adaptationto the paddock so they are more vigorous (e.g. moredisease tolerant varieties) and competitive with weeds,ensuring insect management and plant nutrition isoptimal so as to maximise early growth andcompetition,selective herbicides, especially in combinations orsequences which allow for maximum control ofresistant weeds, andhand rogueing of plants, especially wild radish.
CHAPTER 12 – WEED CONTROL IN WHEAT THE WHEAT BOOK
256
INTEGRATED WEED MANAGEMENT

Dodd, J., Martin, R.J. and Howes, K.M. (1993):“Management of Agricultural Weeds in Western Australia”.(Bulletin 4243, Agriculture Western Australia).
THE WHEAT BOOK CHAPTER 12 – WEED CONTROL IN WHEAT
257
REFERENCES:

CHAPTER 12 – WEED CONTROL IN WHEAT THE WHEAT BOOK
258

Chapter Coordinator: I. WilkinsonAuthors: I. Wilkinson & J. Henderson
Industry Profile ............................................................................................261
Marketing of Australian Wheat ....................................................................262AWB Ltd ............................................................................................................262Domestic Marketing Arrangements ....................................................................263
Markets for Australian Wheat ......................................................................265Major Markets ....................................................................................................265The Domestic Market..........................................................................................265 Export Market ....................................................................................................265Major End-Uses for Australian Wheat and Quality Requirements ....................266
Bread ................................................................................................................267Noodles ............................................................................................................267Biscuits, Cakes and Pastries ............................................................................267Pasta ................................................................................................................268
References ......................................................................................................269
THE WHEAT BOOK CHAPTER 13 – MARKETS AND MARKETING
259
CHAPTER THIRTEEN
MARKETS AND MARKETING

CHAPTER 13 – MARKETS AND MARKETING THE WHEAT BOOK
260

Ian Wilkinson and Jamie HendersonWheat is the largest of Western Australia’s agricultural
industries with an average Gross Value of AgriculturalProduction (GVAP) over the five years to 1998/99 of $1.6billion. In 1998/99 the wheat GVAP was $1.7 billion.Over the same five years wheat represented 37% of thetotal GVAP and 44% of the State’s value of agriculturalexports.
Western Australia is the major producer of wheat inAustralia. In 1997 the State produced 7.6 million tonnes ofwheat (40% of Australia’s wheat production). Productionover the 10-year period to 1999 is shown in Figure 13.1.
The Western Australian wheat industry is exportfocused with around 95% of production shipped tooverseas markets. Currently approximately 300,000 tonnesof wheat is processed locally. The level of processing isincreasing and manufacturers are looking to export theirproducts, particularly to the Asian region.
The Western Australian cereal industry is advanced andinnovative compared with both the eastern States andinternational competitors. The 1998 Australian GrainIndustry Report prepared by ABARE showed that WesternAustralian grain farms had nearly double the farm businessprofit when compared to the Australian average. The sector
contributes significantly to the State, both financially andsocially, with the infrastructure of many country townsrevolving around the wheat industry.
There are around 6000 committed wheat growers inWestern Australia. The average age of the farm operator inWestern Australia is 52 years, with 18% being under 40years old. Growers are serviced by over 300 agribusinessconsultants and agronomists who extend the latesttechnology to growers. In 1998, ABARE reported that WAgrain farmers spend $2,763 on consultants (average perfarm), with 45% of grain farmers utilising a consultant. Thiscompares with the Australian average of $1,826 and 28%.
THE WHEAT BOOK CHAPTER 13 – MARKETS AND MARKETING
261
INDUSTRY PROFILE
Year
'000tonnes
19890
2000
4000
6000
8000
10000
1990 1991 1992 1993 1994 1995 1996 1997 1998
Figure 13.1
Wheat production in Western Australia

Options for the marketing of wheat have becomemore diverse as regulation in the industry is removed.The pricing mechanisms available for selling wheat havebecome increasingly more complex as the AWB Limited(AWB) give farmers more pricing options. Farmers willneed to develop a more detailed understanding ofmarketing and pricing mechanisms to ensure that theyachieve the best farm-gate return available for theirproduct. On top of this farmers are becomingincreasingly aware of the opportunities for better price-risk management than they have had in the past.
AWB LtdThe AWB is a national and international grain-
marketing organisation that markets wheat and othergrains on behalf of Australian grain growers and providesfinance to growers, to make payments in advance ofrevenue received on wheat sales. The AWB is Australia’sfifth largest exporter, with annual sales revenue in excessof $4 billion. It serves Australia’s 40,000 grain-growers inmarketing wheat to more than 50 countries and 100individual customers.
On 1 July 1999 Commonwealth legislation wasenacted to move the AWB from its role as a statutoryauthority to a grower-owned and controlled organisation.The AWB is now a stand alone corporation underAustralian Corporations Law, run by its own electedboard, owned and controlled by Australian wheatgrowers, and with an opening capital base of around$550 million.
The only remaining area of substantive Governmentinvolvement in the AWB’s current operations is in the so-called “single desk” export powers for wheat. Legislationhas been retained to give the AWB the sole right to exportwheat in bulk. This is contingent on the review of thelegislative arrangements that will be carried out under theauspices of the National Competition Policy.
AWB Limited will have two subsidiary companies –AWB (Australia) Limited and AWB (International)Limited:
AWB (Australia) Limited will be responsible fordomestic wheat and other grain trading and theexport of non-statutory grains, as well as othercommercial ventures undertaken.AWB (International) Limited will be the subsidiarycompany responsible for the wheat export pools andwill be focused on maximising pool returns.As a grower-owned private company, the focus of the
new AWB will be to maintain a commercial focus on thecreation and maximisation of returns for its shareholders.The parent company AWB Limited will be responsiblefor all funding and the provision of shared businesses andcorporate services. This company will act as borrower forthe AWB Group and will on-lend to the subsidiaries,
particularly the pools subsidiary to fund advancepayments to growers.
Being the sole exporter of Australia’s wheat, the AWBcarries the collective risk of international price andfinancial exposures on behalf of Australia’s wheat growers.
The AWB has a number of marketing mechanisms forfarmers to utilise. The most popular, and the mechanismfor the majority of wheat receivals, is the pool. The AWBhas established a series of pools based on variety, qualityand protein windows, some of which also containsegregations and payment scales based on the proteinlevel of the wheat. The wheat received is stored accordingto these grades and segregations. This allows the AWB tooffer more direct feedback on prices for different qualitywheats. It also enables the AWB to meet the needs of thecustomer more specifically, as they have a full range ofwheat qualities available to market.
The grades of wheat produced in Western Australiaare:
Australian Standard White (ASW) – a versatilemedium to low protein wheat suited to straightmilling or blending. Used to manufacture of steamedbuns, instant noodles and some types of flat bread.Australian Premium White (APW) – a blend ofharder grained varieties with a minimum protein of10%. Targeted at instant, fresh and Hokkien noodles,Middle Eastern and Indian style flat breads andChinese steamed bread.Australian Hard 1 (AH1) – contains specific hardgrained varieties of superior milling quality. It has aminimum protein of 11.5% and excellent millingextraction rates. It is aimed at European pan stylebreads, Middle Eastern style flat bread, some Chinesesteamed products and Chinese style alkaline noodles.Australian Hard 13 (AH13) – only nominatedAustralian Hard varieties can be delivered to thissegregation, at a minimum of 13% protein.Australian Noodle (ASWN) – contains very specificsoft-grained wheat varieties. Formed to supply thewhite salted noodle market in Japan and South Korea,which requires unique starch quality.Australian Soft (AS) – a unique blend of white soft-grained club wheat varieties with a maximum proteinlevel of 9.5%. Suited for end-users making sweetpastry, biscuits, cookies, pastries, cakes, steamed bunsand snack foods.Australian Durum (AD) – selected durum varietieswith vitreous, amber coloured kernels and aminimum protein content of 13%(AD1), 11.5%(AD2) or 10% (AD3). Milled to produce semolina,which is ideally suited to the production of highquality wet and dry pasta products.Pooling allows the AWB to sell the season’s wheat
harvest over a period of time, smooth out price variationsin the world markets, and return an average price togrowers. At harvest, farmers receive an advance payment
CHAPTER 13 – MARKETS AND MARKETING THE WHEAT BOOK
262
MARKETING OF AUSTRALIAN WHEAT

of 80% of the expected pool return. This gives farmerssome payment for their product even though the producthasn’t been sold. The AWB spreads the sales of the poolover time and in different markets and environments totry and maximise pool returns. The pool is usuallyfinalised in 2-3 years and the farmers receive a finalpayment on the pool. This covers the remaining 20% ofthe return. This system requires the AWB to borrow largeamounts of money to cover the harvest payment and thegovernment previously underwrote this borrowing. TheAWB will now finance the advance payments using thecapital accumulated through the Wheat Industry Fundlevy, which has been converted into shares allocated tothe growers who have made the contributions.
The AWB Ltd in 1999 has launched 4 new pricingmechanisms for pools. The first is the 80% up-frontharvest payment, which will operate, as has been the casein the past but will incur a $2/t underwriting fee and afinancing fee.
The second option is the quarterly payment, which isan Australian dollar payment in four quarters as the AWBLtd progressively sells the pool. The option will incurminimal borrowing costs but the farmer will not knowexactly what he/she will receive for their wheat in thepool.
The third option is the quarterly payment in USdollars. This is the same as the second alternative butpayments will be received in US dollars and the AWB Ltdwill not undertake any foreign exchange management ofthose funds. This puts the onus on the farmer toundertake a foreign exchange management strategy.
The fourth option is the quarterly payment in US$per tonne converted to AU$ at the spot rate at the timeof payment.
The AWB has several other mechanisms for sellingwheat, which include the cash payment for delivery to theport. This offers an immediate and known return forfarmers, however the price for port delivered wheat isoften lower than the final pool return, even afterdiscounting future pool payments.
Farmers have the ability to hedge their wheat sales, bybuying (or selling) Chicago Board of Trade (CBOT)and/or Sydney Futures Exchange (SFE) futures andoptions in order to hedge the price they receive for theirwheat. The international futures prices can be used as aprice setting mechanism for wheat, at planting or at anytime through to when the wheat is physically sold. TheChicago Board of Trade is the major grain trading futuresexchange in the world and the price of the wheat futureson the CBOT significantly influence the final pool priceof the AWB.
It is likely that an increasing number of marketingmechanisms will come on-line for use by farmers.Information on these mechanisms can be obtainedthrough AWB Ltd, agribusiness consultants andmarketing newsletters.
Domestic Marketing ArrangementsThe domestic (Australian) wheat market was
deregulated in 1989. Since then, producers have hadgreater options available in selling wheat and have hadgreater control over their financial outcome for theyear.
The domestic market is relatively small whencompared to the export volumes from Australia each year.For Western Australia around 200,000 – 250,000 tonneswould be utilised for milling to produce flour, most ofwhich is consumed domestically. In parts of the easternStates, however, the domestic market has become asignificant user of wheat, particularly in years where thereare production problems for wheat.
The domestic market is limited by the smallpopulation of Australia compared to our production ofwheat, but has been expanding in recent years as theconsumption of noodles and pasta has increased. Theinstant noodle market has grown strongly as consumersincreasingly seek convenience foods. This has seen theestablishment of a number of noodle manufacturers inAustralia.
As the domestic market for wheat is not regulated,there are a number of options for marketing wheat:1. Direct purchase by processors from farmers – usually
for a cash price, with the potential for on-farm storageand deferred delivery. There is a small but increasingamount of high quality wheat being purchased byforward contracts between growers and millers. Suchcontracts would specify such things as variety, protein,moisture, screenings, etc. By targeting good farmersin specific areas, it is possible to get reliable supplies ofwheat of very specific quality. Farmers benefit fromhaving very direct feedback as to the qualityrequirements of the processor.
2. Purchase by domestic traders/merchants – who willsource packages of wheat of the requiredspecifications for the processor. Again forwardcontracts can be utilised and specific qualities can bespecified. An advantage of processors using traders isin utilising existing expertise and local knowledge thatis available to source wheat of the required quality.Also, the logistics of storing, handling andtransporting the grain can be organised on behalf ofthe processor.
3. Sell direct to the AWB Ltd – to its trading division,which can provide similar service to other traders,including cash prices and premiums for specificquality traits.Prices are quoted at a number of levels; such as free on
board (FOB), delivered port, or delivered to processor.Because of this it is important for growers to convert allprices to a farm-gate return when comparing wheat priceson offer. The basis of pricing terminology is explained inthe following diagram:
THE WHEAT BOOK CHAPTER 13 – MARKETS AND MARKETING
263
MARKETING OF AUSTRALIAN WHEAT (continued)

CHAPTER 13 – MARKETS AND MARKETING THE WHEAT BOOK
264
MARKETING OF AUSTRALIAN WHEAT (continued)
WHEAT PRICING TERMINOLOGY
CIF – COST INSURANCE FREIGHTLanded price at export destination (includes shipping and insurance costs)
minus shipping and insurance costs
FOB – FREE ON BOARDPrice of wheat loaded onto vessel ready to sail
minus AWB finance (borrowing to support pool payments) andadministration costs (includes promotion, currency and commodity risk cover)
POOL RETURNAverage FOB return less AWB finance and administration costs
minus storage and handling charges +/- port allowance
DPB – DELIVERED PORT BASISValue of wheat delivered to port,ie, NPR – CBH charges (plus or minus port allowance for wheat)
minus freight to port
SILO RETURNValue of wheat on delivery to silo ie, DPB – Freight to Port
minuscartage to bin, CBH tollslevies
skeleton weed ($0.15)Industry levy* (1.03% ‘farm gate return’)
1% GRDC 0.03% residue testing
FARM GATE RETURN
*The Wheat Industry levies are calculated on an estimated farm gate price.

The domestic grain industry is able to increase valuethrough further processing of whole grain. Opportunitiesfor growers in terms of marketing domestic grains providessome potential benefits to the grains industry andalternatives to exporting, which is vulnerable to pricefluctuations due to an unstable world market. TotalAustralian wheat use for milling is around 2 million tonnesper annum and milling volume is only expected to increaseslowly in line with population increases and increasedexport opportunities for flour.
The more prominent areas of further processing are thebeef feedlot industry, the pig industry and the poultryindustry. In recent years these have been expanding theiruse of feed grain and are becoming more quality specific astheir operations increase in efficiency and intensiveness.This has seen the introduction of specialist high-yieldingfeed wheats in high rainfall parts of Australia.
Apart from the stockfeeders there are a large number ofother potential domestic niche markets for wheat. Some ofthese niches have already become significant to the wheatindustry, and include:
Starch and industrial wheats;Durum wheat for pasta;Novelty wheats (purple wheats);Wheats for ethanol production; andFodder wheats for hay, chaff and grazing.
Export MarketThe major competitors for Australian wheat exports are
the USA, Canada, the European Union and Argentina.Two products dominate world cereal trade – wheat andcorn – which account for around 85% of all cereals traded.World wheat trade (around 100 million tonnes) isdominated by the US, which supplies a third of all exports.Other major players are Canada at 20%, the EU at 19%,Australia at 10% and Argentina at 7%.
World wheat markets can be broadly categorised intothree main types – commodity (price driven, low loyalty),relationship (price enhancement, some qualityrequirements, technical assistance provided) and branded(quality driven, high loyalty, price premiums). This is adynamic situation. Over time, competition will develop aproduct and service similar to a branded market.
There is a trend towards reduced regulation ofpurchasing arrangements in the major wheat importingcountries (eg. COFCO in China, BULOG in Indonesia).This will open up opportunities for the Western Australianindustry to deal more directly with the users of cerealsenabling the development of relationship markets, andperhaps in the longer term more branded markets. Themajority of wheat sold around the world is sold as acommodity, but AWB Ltd is looking to increase theproportion sold into higher paying markets. Over timethese premiums will be passed back to growers as a strongsignal of market preferences, thus allowing growers to tailorproduction to market requirements.
THE WHEAT BOOK CHAPTER 13 – MARKETS AND MARKETING
265
MARKETS FOR AUSTRALIAN WHEAT (continued)
Major MarketsAustralia produced an average of 13.7 million tonnes
of wheat per annum over the last 5 years, making Australiathe 8th largest producer of wheat in the world. While thisdoes not make Australia a major player in terms ofproduction, we export a large proportion of ourproduction due to our small population base andconsequently our low domestic demand. Supply anddisposal of Australian wheat is shown in figure 13.2.
While prices received on the export market are largelydependent on world prices, the sale of grain domesticallyoffers producers a greater range of market opportunitiesand pricing mechanisms.
The Domestic MarketThe domestic market is relatively small but still
significant to the Australian industry and economy.Deregulation of the domestic market in 1989 has allowedAustralian grain growers to have some freedom in whereand how they sell their grain.
The domestic wheat market is dominated by severalgrain trading companies and many smaller traders andprocessors who purchase wheat to meet their processingneeds. These usually have a specific quality specificationdepending on the end use.
Use of wheat on the domestic market is in threecategories; human/industrial, feed, and seed use. Over thepast five years, human/industrial and seed use of Australiangrains has been increasing slightly. The use of wheat forfeed purposes has been increasing at a more rapid rate andshowing signs of continued expansion in the future.
A comparison of the production of flour for variousend-uses in Australia is shown in the table 13.1.
Table 13.1 Comparison of the production of flour forend-uses
Tonnes produced
End Use 1988 1998
Starch/Gluten 300,302 459,803
Other Industrial 5,876 3,816
Bread bakers 562,705 777,243
Pastry cooks 93,317 65,418
Biscuit 81,379 84,315
Pasta 44,210 76,315
Packet and Mixes 79,709 115,798
Food Manufacture 97,349 127,798
DOMESTIC TOTAL 1,264,847 1,710,506
Export 85,881 202,051
TOTAL FLOUR 1,350,728 1,912,557

As can be seen in figure 13.2, the vast majority ofAustralian wheat production is exported each year. Theproduction in Australia varies depending on the weatherconditions, but due to Australia’s diverse climates forgrowing wheat the production level is more consistent thanin most other wheat producing countries. The export levelof wheat depends on this variation in production withincreases in good production years and decreases followingpoor seasons. The domestic market is relatively stable in itsuse of wheat, as it is more dependent on the demand of theprocessors, which does not usually change a great deal fromyear to year.
The AWB Ltd has established a large number ofinternational customers that consistently buy Australianwheat.
The major international markets for Australian wheatare: Indonesia, Japan, Taiwan, Saudi Arabia, Egypt, India,Malaysia, United Arab Emirates, China, South Korea,Iran, Iraq and Yemen. The sales to these markets are veryvariable with the changing political, climatic and marketsituations in each country. A good season may reduceimports from Australia to almost nothing where-as a badseason increases imports dramatically. Australia hasdeveloped markets that see Australian wheat as high qualityand are in many cases willing to pay a small premium forthe wheat. Sales to these countries are negotiated andenhanced by the AWB international units, which arelocated in South East Asia, Hong Kong (North Asia),
Tokyo, and Middle East/Africa. In recent years the AWB has been very conscious of the
needs of the customer and has placed a lot of emphasis oncustomer service. It also researches market trends to matchthe wheat varieties grown and pool specifications withrequirements of the customers and processors. The aim ofthis marketing strategy is to develop customer loyalty,which will produce more consistent sales with customersthat value Australia’s product over our competitors.
Major End-Uses for Australian Wheatand Quality Requirements
Australian wheat has achieved a reputation forproducing clean, white wheat with low screenings, insectfree, sound and with low moisture content. The primaryquality differentiating Australian wheat in the internationalmarket place is that it is white grained (most wheat tradedis red wheat). Australia has a climate that is suited to theproduction of white wheats, which have high extractabilityin flour production and are therefore more cost effectivefor flour millers.
These qualities and the increasing efforts of wheatfarmers to tailor their varieties and protein content to meetend-user requirements, allow the Australian wheat industryto supply more specialised markets rather than solelyproviding a bulk undifferentiated product.
Australian wheat is used to produce a large number of
CHAPTER 13 – MARKETS AND MARKETING THE WHEAT BOOK
266
MARKETS FOR AUSTRALIAN WHEAT (continued)
X
XXX
XXXXXXXX
1988-89
Production Domestic Use Human & Industrial Feed Seed Export
f - ABARE Forecast
0
5,000
10,000
15,000
20,000
25,000
1989-90 1990-91 1991-92 1992-93 1993-94 1994-95 1995-96 1996-97 1997-98 1998-99f
XXXXXXXX XXX
X
Figure 13.2
Supply and disposal of Australian wheat

different products for a wide range of cultures throughoutthe world. These include traditional breads (flat breads,steamed breads and many others), noodles, biscuits, cakes,and pasta.
There is a great diversity of products that can be madefrom varieties of wheat grown in Australia. Variousinstitutions within Australia including state Departmentsof Agriculture, CSIRO, the Bread Research Institute, andthe Academy of Grain Technology, have been researchinghow to best meet the needs of the customers and Australiais now at the forefront of research into the qualityrequirements of different end-uses of wheat.
BreadThere is a range of different bread types that are made
throughout the different cultures. These breads havedifferent ingredients, preparation, processing and cookingmethods and even in many cases used different grades andtypes of flours. These breads include Loaf or Pan Bread,Flat Bread and Steamed Bread.
Loaf or Pan BreadLoaf or pan bread is the standard bread that is eaten in
most of the western world. Produced in a wide range ofshapes it is commonly white bread that is produced dailyand consumed over 1 or 2 days. Recent years have seensome diversification of pan breads produced with multi-grains, high fibre, and wholemeal, becoming moresignificant in the market place.
Flat BreadExports of wheat destined for flat bread production in
the Middle East form a significant proportion of Australia’swheat exports. Increased popularity of this product withinAustralia has lead to a growing domestic demand.
Flat breads may be single or double layer breads andinclude Baladi Bread, Naan, Tanoori, Lavash, Sangak andArabic bread. Flat breads are consumed as a staple food inmany countries and are traditionally made by hand athome or in small, localised bakeries. There has been a bigshift in the last ten years towards centralised production inmore fully automated bakeries.
Baladi bread is the major bread type consumed inEgypt. It is a two-layered flat bread that is made from highextraction flour, yeast, salt and water and is mainly made byhand. Tanoori (taftoon) bread is a single layered flat breadconsumed in the gulf countries of Iran, Iraq and Syria.
It is one of the Arabic breads also known as pocket,pita, or lebanese bread which is created by separating thetwo layers during baking.
The Australian industry and the consumption of flatbreads have expanded considerably in recent years withflour consumption for flat bread production increasingfrom 2,300 tonnes in 1986 to 5,600 tonnes in 1989. Theproduct was initially manufactured in small ethnic bakeriesand sold within the local community, but with acceptanceof the product, the size of these bakeries has increased. Flatbreads have now become widely available in the major
supermarket chains.Steamed BreadConsumption of Chinese steamed bread is predicted to
increase in both China and other Asian countries. Acontributing factor to this growth is that, as a traditionalproduct, steamed bread is also a convenience food. Withsteamed breads now marketed through supermarkets andfast food outlets, the technology requirements forproduction and shelf-life expectations are becoming moredemanding.
There are three types of steamed breads produced.These are:
Northern Style, made out of hard wheats that havestrong dough and are high in protein.Southern style, made out of hard wheats but with
lower dough strength and protein levels, andCantonese style buns, made from the softer grained
wheats. These are usually sweet and eaten as a snackfood.
NoodlesThere are a number of different noodle types, which
fall into the two categories; yellow alkaline or white, saltednoodles. The main yellow alkaline noodle types areCantonese, Hokkien, Ramen and instant noodles. Themain white types are Udon and Long Life noodles. Somewhite instant noodles are also produced. Yellow alkalinenoodles are made with various wheat qualities rangingfrom ASW to AH and APH. The ASW-N segregation isideally suited to the production of white, salted noodles.
About one third of Australia’s wheat production is usedin the manufacture of Asian noodles. This represents about$800 million worth of wheat. About 70% of this wheat isfrom Western Australia. Japan is one of our mostimportant noodle wheat markets and it imports about18% of its wheat from Australia.
In Asia 65-70% of wheat is consumed as noodles.Noodle consumption world wide is increasing with Asianconsumption expected to increase to 85 million tonnes andimports of noodles into Asia are expected to increase to 17million tonnes by the year 2000.
The Asian market is very quality conscious in terms ofnoodles and the consumers are seeking good brightness,colour and stability of colour as well as good firmness,chewiness and smoothness. Considerable work is beingcarried out in Australia to determine which qualitycharacteristics are appropriate to produce each noodle type.
Biscuits, Cakes and PastriesSweet biscuits, cakes and pastries are best made from
flour produced by milling low protein, soft grained wheat.Again, there is strong growth in consumption in the Asianregion for these products, but from a relatively low base.Currently there are export markets for 350-400,000tonnes, and further expansion will be reliant on enlargingour share of this market.
THE WHEAT BOOK CHAPTER 13 – MARKETS AND MARKETING
267
MARKETS FOR AUSTRALIAN WHEAT (continued)

PastaPasta consumption is another area that has seen great
expansion in the 1990’s. Australian consumers have begunto diversify their tastes and this has lead to increased pastaand noodle consumption. Strong growth in pastaconsumption is also occurring in the Asian region, butagain this is from a low base.
Pasta is traditionally made out of 100% Durum wheat,which is milled to make semolina that is then used toproduce the pasta. More detail about Durum wheat andthe industry in Australia and the establishment of anindustry in Western Australia can be found in the Chapteron Durum wheat.
CHAPTER 13 – MARKETS AND MARKETING THE WHEAT BOOK
268
MARKETS FOR AUSTRALIAN WHEAT (continued)

Australian Wheat Board – Annual Report 1997/98,1998
Australian Grains – A complete reference book on thegrains industry, 1994, Edited by Bob Coombs, MorescopePublishing Pty Ltd, Victoria.
AWB Ltd – Crop Report 1998/99ABARE, March 1998, Australian Grains Industry
1998, Report on the Australian agricultural and grazingindustries survey of grain producing farms, GRDC,Canberra.
Kondinin Group, 1997, The Profarmer MarketingManual, GRDC, Senior Editor – Dennis Wise, WesternAustralia.
Agriculture Western Australia, Wheat Quality CourseManual, 1999.
Profarmer Newsletter, Volume 7, Number 10, 16 April1999, Editor – Dennis Wise.
THE WHEAT BOOK CHAPTER 13 – MARKETS AND MARKETING
269
REFERENCES

CHAPTER 13 – MARKETS AND MARKETING THE WHEAT BOOK
270

Authors: A Impiglia, B. Mullan, R. McTaggart
Durum ..........................................................................................................273Origin ................................................................................................................273Genetics ..............................................................................................................274Distribution, production and consumption ......................................................275Grain quality and end-products ..........................................................................277Morphology ........................................................................................................279Development ......................................................................................................280Soils and climates suitable for durum ..................................................................281Varieties and varietal improvement ....................................................................282Pests and diseases..................................................................................................283Agronomy, rotation and nutrition ......................................................................285Herbicide tolerance in durum in WA ..................................................................287The Economics of growing durum......................................................................288Harvesting and admixtures ..................................................................................289Place of durum in the farming system ................................................................290Acknowledgements ..............................................................................................291Further reading ....................................................................................................292
Feed Wheats ..................................................................................................293Use of wheat in animal feeds ..............................................................................294Winter wheat ......................................................................................................295Quality of feed wheat ..........................................................................................296Future considerations ..........................................................................................297References ............................................................................................................298
Triticale ..........................................................................................................299History ................................................................................................................300Soil types and rainfall ..........................................................................................301Seeding rate table ................................................................................................302Varieties ................................................................................................................303Delivery Standards ..............................................................................................304Feed Quality ........................................................................................................305
THE WHEAT BOOK CHAPTER 14 – SPECIAL WHEATS
271
CHAPTER FOURTEEN
SPECIAL WHEATS

CHAPTER 14 – SPECIAL WHEATS THE WHEAT BOOK
272
Alfredo Impiglia
ORIGINWheat was probably domesticated around 12,000 –
15,000 B. C. in the Near East area known as the “FertileCrescent”, a mountainous hilly region in the upper reachesof the Tigris-Euphrates drainage basin. Great variabilitythrough thousands and thousands of generations has beenincreased in tetraploid (e.i. durum wheat) and hexaploid(e.i. bread wheat) by their ploidy level and by the survivalpossibility of mutations, which permit progress in humanutilization of these cereals.
Most certainly, wild tetraploid wheats were alreadywidely distributed in the Near East when humans startedharvesting them in nature. Their general size, andparticularly the size of the spike and the kernels, madethem much more worthwhile for domestication thandiploid wheats. Moreover, the spikelet was structured todifferentiate two or three flowers, and then each spike,consisting of 15-20 spikelets, could provide 30-50 kernels.Therefore, the potential of tetraploid wheats was quiteinteresting from the beginning. The two wild tetraploidtypes, T. araraticum and T. dicoccoides, were bothdomesticated. The first gave T. timopheevi and the lattergave T. dicoccum. T. dicoccum spread from the Near East tolarge areas of the Mediterranean and Middle East, toEgypt, and to Ethiopia. Later, the more advanced types,characterized by naked kernels and much wideradaptation, belonging to T. turgidum var. turgidum and T.turgidum var. durum (durum wheat) spread to all Europe,the Middle East and North Africa. During the RomanEmpire, most of the wheat carried to Rome from thecolonies belonged to the T. durum-turgidum-dicoccumgroup. The basic differences between the T. turgidum andT. durum types are in the kernel structure (starchy in T.turgidum and vitreous in T. durum) and in the betteradaptation of T. durum to semi-arid conditions and of T.turgidum to more continental and humid climates. Bothtypes were used for bread making and for a number ofother uses such as lasagna sheets, some of which are stillcommon today. Among all cultivated tetraploid wheats, T.durum is by far the most important, even though it isgrown in less than 10% of all the area cultivated to wheat,the remainder being represented by the bread wheat, T.aestivum.
THE WHEAT BOOK CHAPTER 14 – SPECIAL WHEATS
273
DURUM

All wheats, durum included, belong to the genusTriticum, a member of the grass family, Gramineae(Poaceae). Durum is a typical annual cereal. It is atetraploid wheat with genomes AABB [2n=4x=28]. Earlycytogenetic studies led to the conclusion that durum wheat(genome AB) is derived from a tetraploid hybrid of diploidT. boeoticum or T. baeoticum (donor of the genome A) xan unknown wild grass (donor of the genome B). Each ofwhich contributed a set of seven chromosomes (genome)(Sax, 1922; Kihara, 1924). However, Konarev et al.(1979), from studies conducted on seed storage proteins,found that the genome A in the T. turgidum lineage wascontributed by T. urartu. In 1988, Dvorak et al. concludedthat tetraploid wheats are closer to the genome A of T.urartu than to the genome A of T. boeoticum. As for Bgenome in durum, it seems to have originated from T.speltoides (Dvorak and Zhang, 1990, Dvorak et al., 1993),but the B genome origin is still not so clear. The durumkernel has the hardest texture of all wheats and it is alsolarger and more vitreous than bread wheat. The durumendosperm contains a higher concentration of xanthophyllor lutein pigments than bread wheat and the desirablemilling product is generally semolina, which is a coarserflour used for making pasta.
CHAPTER 14 – SPECIAL WHEATS THE WHEAT BOOK
274
GENETICS

Region Production Area Yield(‘000 t) (‘000 ha) (t/ha)
Europe 7829 3003 2.6
EU 7778 2981 2.6
North & 6712 3347 2.0CentralAmerica
South 164 87 1.9Americ
Asia 8119 5438 1.5
Middle East 6384 4323 1.5
Africa 3446 3140 1.1
World 28611 17260 1.7
Durum covers approximately 21 million hectaresworldwide, spread over many countries. More than 80% ofthe total land under durum cultivation is in theMediterranean basin (Srivastava et al., 1988), whererainfall and temperature show large and unpredictablefluctuations from year to year. Another major source ofdurum is North America and prediction in Australia isincreasing rapidly.
Due to its greater adaptability in harsh environmentsthan bread wheat, durum has been concentrated in thedriest areas of the West Asia and North Africa (WANA)region and South Europe.
Production of durum in the world is relatively stable atabout 30 million tonnes. In countries with a long historyof durum improvement such as Italy, France, Canada andthe United States, production is stable but quality isimproving. In countries with a long history of durumproduction, but where there has been a recent impetus fordurum improvement, such as Mexico, Turkey, Tunisia,Spain and Syria, yields and production are increasing (table14.1).
In Australia, durum production started in northernNew South Wales and southern Queensland and spreadmore recently to South Australia. Commercial productionbegan in Western Australia in 1998 and production of over100,000 tonnes is estimated in five years time. Productionin 1998/99 and estimated production in 1999/2000 areshown in table 14.2.
Production in Australia has been increasing with arecord crop in 1998 of over 400,000 tonnes. However,production has fluctuated in the last 10 years between50,000 and 400,000 tonnes taking Australia from animporting to an exporting situation, depending on season.
The major exporters of durum grain (includingsemolina) in the world are Canada, the USA and theEuropean Union (EU). Exports from the USA and the EUhave declined over the past 10 years but have increasedslightly from Canada. New exporting countries such asTurkey, Syria and Mexico have partially compensated forthe decline in exports from the more traditional countriesabove.
The major importers are the EU (Belgium, Italy), theAmericas (USA, Venezuela), Asia (Turkey, Bangladesh,Japan), the Far East (unspecified countries) and Africa(Algeria, Libya, Morocco, Tunisia); Figure 14.1 shows theworld durum trade where some countries are bothexporters and importers of grain and semolina.
In the past 10 years the price of durum wheat in NorthAmerica has risen from about $US120/tonne to about$US270/tonne (FOB). Price rises since 1990/91 has beenassociated with constant increases in demand rather thanwith decreases in availability.
In Australia there has been a premium for durumhigher than bread wheat at the same protein percentagethat varies from A$40 to about A$115/t depending on thegrade and the international market price (Figure 14.2). Forthe last 6 years the average differential in price was A$64/tbetween durum grade 1 at 13% protein (ADR1) andAustralian Hard at 13% protein (AH13) in WA. In1994/95 durum pool was not available.
THE WHEAT BOOK CHAPTER 14 – SPECIAL WHEATS
275
DISTRIBUTION, PRODUCTION AND CONSUMPTION
Table 14.1 – World production, area and yield ofdurum wheat (mean 1985 to 1995). [Source:International Grain Council]
1998/99 1999/2000*State Hectares Grain Yield Production Hectares Grain Yield Production
(‘000) (t/ha) (‘000 t) (‘000) (t/ha) (‘000 t)
NSW 133 2.3 300 150 2.7 500
SA 33 2.6 85 35 2.6 90
QLD NA NA 15 NA NA 20
WA 2 1.5 3 19 1.6 30
Australia 403 650
* Estimated
Table 14.2 – Durum production in Australia (1998/99 and 1999/2000 forecast)

Durum wheat production and productivity is notstable due in part to the climatic conditions under whichthe crop is grown and in part to biotic stresses.
Durum is mainly used for human consumption andthe major end-product is pasta.
Global consumption of durum has been divided intogroups according to broad regions in table 14.3. Thedominant use is for pasta except in the WANA regionwhere bread and other traditional end-products areimportant.
CHAPTER 14 – SPECIAL WHEATS THE WHEAT BOOK
276
DISTRIBUTION, PRODUCTION AND CONSUMPTION (continued)
Figure 14.1.
World durum trade by region.
Figure 14.2.
Price history comparison between ADR1and AH13.
Consumer use WANA Europe Americas Australia(%) (%) (%) (%)
Pastas 20 94 97 98
Bread 40 3 1 1
Couscous & Burghul 30 2 1 1
Others 10 1 1 0
Estimated by Varughese (1975) re-evaluated by Nachit (1994) and Impiglia (1998)
Table 14.3 – Major uses of durum in the world.
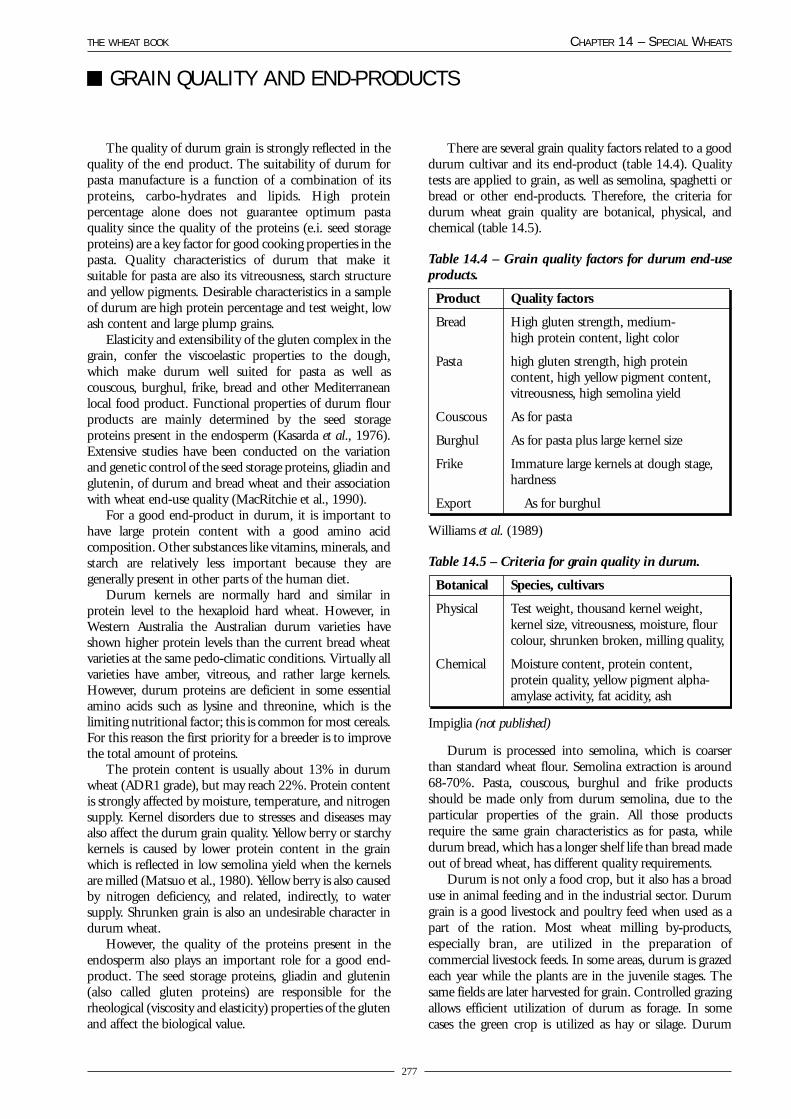
The quality of durum grain is strongly reflected in thequality of the end product. The suitability of durum forpasta manufacture is a function of a combination of itsproteins, carbo-hydrates and lipids. High proteinpercentage alone does not guarantee optimum pastaquality since the quality of the proteins (e.i. seed storageproteins) are a key factor for good cooking properties in thepasta. Quality characteristics of durum that make itsuitable for pasta are also its vitreousness, starch structureand yellow pigments. Desirable characteristics in a sampleof durum are high protein percentage and test weight, lowash content and large plump grains.
Elasticity and extensibility of the gluten complex in thegrain, confer the viscoelastic properties to the dough,which make durum well suited for pasta as well ascouscous, burghul, frike, bread and other Mediterraneanlocal food product. Functional properties of durum flourproducts are mainly determined by the seed storageproteins present in the endosperm (Kasarda et al., 1976).Extensive studies have been conducted on the variationand genetic control of the seed storage proteins, gliadin andglutenin, of durum and bread wheat and their associationwith wheat end-use quality (MacRitchie et al., 1990).
For a good end-product in durum, it is important tohave large protein content with a good amino acidcomposition. Other substances like vitamins, minerals, andstarch are relatively less important because they aregenerally present in other parts of the human diet.
Durum kernels are normally hard and similar inprotein level to the hexaploid hard wheat. However, inWestern Australia the Australian durum varieties haveshown higher protein levels than the current bread wheatvarieties at the same pedo-climatic conditions. Virtually allvarieties have amber, vitreous, and rather large kernels.However, durum proteins are deficient in some essentialamino acids such as lysine and threonine, which is thelimiting nutritional factor; this is common for most cereals.For this reason the first priority for a breeder is to improvethe total amount of proteins.
The protein content is usually about 13% in durumwheat (ADR1 grade), but may reach 22%. Protein contentis strongly affected by moisture, temperature, and nitrogensupply. Kernel disorders due to stresses and diseases mayalso affect the durum grain quality. Yellow berry or starchykernels is caused by lower protein content in the grainwhich is reflected in low semolina yield when the kernelsare milled (Matsuo et al., 1980). Yellow berry is also causedby nitrogen deficiency, and related, indirectly, to watersupply. Shrunken grain is also an undesirable character indurum wheat.
However, the quality of the proteins present in theendosperm also plays an important role for a good end-product. The seed storage proteins, gliadin and glutenin(also called gluten proteins) are responsible for therheological (viscosity and elasticity) properties of the glutenand affect the biological value.
THE WHEAT BOOK CHAPTER 14 – SPECIAL WHEATS
277
GRAIN QUALITY AND END-PRODUCTS
There are several grain quality factors related to a gooddurum cultivar and its end-product (table 14.4). Qualitytests are applied to grain, as well as semolina, spaghetti orbread or other end-products. Therefore, the criteria fordurum wheat grain quality are botanical, physical, andchemical (table 14.5).
Table 14.4 – Grain quality factors for durum end-useproducts.
Product Quality factors
Bread High gluten strength, medium-high protein content, light color
Pasta high gluten strength, high proteincontent, high yellow pigment content,vitreousness, high semolina yield
Couscous As for pasta
Burghul As for pasta plus large kernel size
Frike Immature large kernels at dough stage,hardness
Export As for burghul
Williams et al. (1989)
Table 14.5 – Criteria for grain quality in durum.
Botanical Species, cultivars
Physical Test weight, thousand kernel weight,kernel size, vitreousness, moisture, flourcolour, shrunken broken, milling quality,
Chemical Moisture content, protein content,protein quality, yellow pigment alpha-amylase activity, fat acidity, ash
Impiglia (not published)
Durum is processed into semolina, which is coarserthan standard wheat flour. Semolina extraction is around68-70%. Pasta, couscous, burghul and frike productsshould be made only from durum semolina, due to theparticular properties of the grain. All those productsrequire the same grain characteristics as for pasta, whiledurum bread, which has a longer shelf life than bread madeout of bread wheat, has different quality requirements.
Durum is not only a food crop, but it also has a broaduse in animal feeding and in the industrial sector. Durumgrain is a good livestock and poultry feed when used as apart of the ration. Most wheat milling by-products,especially bran, are utilized in the preparation ofcommercial livestock feeds. In some areas, durum is grazedeach year while the plants are in the juvenile stages. Thesame fields are later harvested for grain. Controlled grazingallows efficient utilization of durum as forage. In somecases the green crop is utilized as hay or silage. Durum

straw is often used as part of the roughage fed toruminants, and is used extensively for livestock bedding,for instance in Syrian dry-lands. Industry utilizes somedurum straw in making paper, wallboard, packingmaterial, various adhesives for paper boxes and plywood,paper, alcohol, and other products. A minor use of thestarch is in the textile industry.
Breeding efforts, conducted particularly during the lasttwo decades by national and international centres, havecontributed to a substantial and continuing trend ofimprovement of durum yield and grain quality.
CHAPTER 14 – SPECIAL WHEATS THE WHEAT BOOK
278
GRAIN QUALITY AND END-PRODUCTS (continued)

Durum has a rather strong root system, with a numberof fibrous and long roots growing to a depth of more than1 m in good conditions. The stem is cylindrical, erect, andsometimes solid (Australian durum varieties have solidstems), but more often hollow, subdivided into internodesby well-identified nodes, each one being the origin of a leaf.Leaves are distichous, composed by a basal portion, the leafsheath, and a terminal portion, the leaf. At the attachmentof the leaf, on the leaf sheat, there is a thin trasparentmembrane, the ligule, with two small lateral appendices,called auricles. Flowers are typically hermaphroditic,clustered in sessile or nearly sessile spikelets that are layeredupon each other to form a spike. Flowers vary from two tosix per spikelet in durum (but up to eight in bread wheat).In durum, the superior glume has an awn 3-20 cm long.At the base of each flower are two small bodies, lodicules,which become turgid at the blooming stage, inducing theopening of the glumes and then of the flower. The fruit isa large caryopsis, generally with a large flint endosperm anda flattened embryo located at the apex of the seed and closeto the base of the flower.
THE WHEAT BOOK CHAPTER 14 – SPECIAL WHEATS
279
MORPHOLOGY

The life cycle of durum can be subdivided into threemain phases: 1) the embryonal phase, which is from theflower fertilization to the ripening of the seed caryopsis; 2)the vegetative phase from seed germination to the firstdifferentiation of the apex; and 3) the reproductive phasefrom the first differentiation of the inflorescence, the spike,to blooming. Transition from one phase to the next iscontrolled both by environmental and genetic factors andtheir interaction.
The physiological processes connected with seedgermination can take place at 1-2ºC, but the optimaltemperature is 20-25ºC. During this first phase, wateruptake occurs and the kernel reaches about 150% of theinitial weight in 10-15hr. Imbibition triggers cellelongation and biochemical activity. The embryonal shootand roots start growing, emerging from the pericarp.Mitosis starts 12-24hr after the beginning of thegermination process, depending upon the temperature.After germination, at the emerging of the fourth leaf,adventitious buds appear at the insertion of leaves, startingthe tillering process. These lateral shoots are already presentin the embryo but are developed only if the minimumtemperature is less than 13-15˚C for at least 20-30 daysafter germination. Adventitious roots are formed at thebase of each tiller; which are largely physiologicallyindependent of each other up to the end of thedevelopment cycle. These clusters of roots grow rapidlyinto the soil functioning both to take up water andminerals and to anchor the plant. In normal cultivationconditions, each plant consists of one to three tillers, eachone developing into one head. In optimal growing andcultivation conditions a larger number of tillers and headsper square meter can be produced.
The vegetative phase ends with the differentiation ofthe apex into the spike primordia. These primordia thendevelop at the same time as the elongation of the stem andof the internodes and the connected development of leaves,which normally increase in size. This phase is responsiblefor the proper formation of the spike. Differentiation offlower organs ends with heading and flowering. Normallydurum wheats are self-fertile, even though out-crossing canreach 5%, depending upon the variety and environmentalconditions. Humid conditions are more favorable toselfing, whereas drier conditions favor out-crossing. Atanthesis, anther filaments elongate rapidly and anthersrelease yellow pollen grains, first at the base and then at theapex. Thus, normally a large amount of pollen dusts thefeathery stigmas of the same flower, and the remainingpollen is released outside the flower, into the air. Theblooming of each spike lasts three to six days, dependingupon the weather conditions. It begins in the lateral floretsat the center of the head and proceeds toward the apex andthe base of the spike and toward the central flowers of eachspikelet. Once fertilized, the ovary rapidly increases in size,and the caryopsis develops. Two to three weeks fromfertilization, the embryo is physiologically functional, able
to develop into a new seedling. At the third week, thecaryopsis is normally at the milky stage and still retains thechlorophyll synthesis. From this phase onward, theaccumulation of reserve substances (starch and protein)rapidly increases the dry weight of the seed. This phase(from fertilization to ripening) lasts 3-7 weeks, dependingon the genotype and the environmental conditions. In thisphase, the economic yield is accumulated. Completeripening is attained when the water content of the seed isbelow 15%. The ability to accumulate a high level ofreserves during the last three weeks, particularly inconditions of water stress, is a genetically controlled trait ofenormous importance in a large part of the area in whichdurum is cultivated.
CHAPTER 14 – SPECIAL WHEATS THE WHEAT BOOK
280
DEVELOPMENT

Durum evolved in the Mediterranean basin where thesoils are mainly alkaline clays and clay loams and the climatehas wet winters and dry summers. The main productionareas in the world have climates that range from moderaterainfall (more than 350 mm annually) with low wintertemperatures, to low rainfall (less than 350 mm annually)with mild winter temperatures and various combinations ofthese. Durum has not so far been widely adapted for wintersowing in summer dominant rainfall areas, or to acidic soils.The performance of durum relative to bread wheat on soilswith pH less than 6 is extremely poor (see Table 14.6); grainyield and protein percentage are very low and there is noadvantage for durum over bread wheat.
Table 14.6 – Yield of durum relative to bread wheat onacidic soils in Western Australia
Site and year Percentage of Average grain bread wheat yieldgrain yield (t/ha)
1993 Wongan Hills 71 2.69
1995 Nabawa 80 2.14
1996 Nabawa 65 1.04
Mean 72 1.96
On clay loam soils with neutral or alkaline pH (seeTable 14.7), conditions are more suitable for durum inWestern Australia. Durum yielded almost as much as breadwheat at yield levels ranging from less than 1t/ha to over3t/ha in the low and medium rainfall zones.
Table 14.7 – Yield of durum relative to bread wheat onclay loam soils with neutral to alkaline pH in WesternAustralia, 1992-1996.
Site and year Percentage of Average yield bread wheat of best 5 durum
yield1 (t/ha)
1992 Merredin 97 1.79
1992 Wilgoyne 98 1.62
1993 Merredin 75 1.89
1993 Wilgoyne2 82 0.6
1995 Merredin 100 2.45
1995 Wilgoyne 88 1.94
1995 York3 121 3.54
1996 Merredin 90 2.22
1996 Wilgoyne 88 1.76
1996 York 101 2.52
Mean 94 2.03
1 Best five durum as percentage of best five bread wheat2 Frosted3 Leaf rust
The clay and clay loam soils with neutral or alkaline pHand with the absence of boron or aluminum toxicity wereconsidered the most suitable soil characteristics. Accordingto our estimation there are over 3 million hectares that meetthe durum wheat requirements in the South WesternAustralia (Table 14.8). Given constraints of rotation,suitability of terrain and grower adoption, we anticipate thatat least 0.5 million tonnes of durum could be producedannually when the industry matures. Our recent testing oflocally available durum lines has shown that several areextremely tolerant of boron toxicity. This could open upanother 1 million hectares of land that is otherwise suitable.In addition, our circumstantial evidence points to thepossibility that durum is sensitive to aluminum toxicity, notto low pH per se, and this would also enlarge the availablearea. Our estimate of 0.5 million tonnes as a potentialproduction thus appears conservative.
THE WHEAT BOOK CHAPTER 14 – SPECIAL WHEATS
281
SOILS AND CLIMATES SUITABLE FOR DURUM
Figure 14.3.
Land suitability for durum in South-Western Australia.
1 Agricultural areaClass 1 (suitable) 3.2 million ha 12%Class 2 (marginally suitable 1.1 million ha 4%Class 3 (unsuitable) 22.6 million ha 84%2 Zone of Ancient DrainageClass 1 (suitable) 1.8 million ha 19%Class 2 (marginally suitable) 0 million ha 0%Class 3 (unsuitable) 7.6 million ha 81%
Table 14.8 – Hectares of soil per suitability class. • includes CALM land • climatic factors not considered

In most production areas in the world where durumimprovement has been active (e.g. Italy), durum cultivarsyield about the same as varieties of bread wheat. In WesternAustralia, where research is in its infancy, durum cultivarsso far yield less than bread wheat. This is not surprisingsince the varieties and breeding lines so far tested were bredfor conditions in eastern Australia where the soils areinherently more fertile and there is a summer incidence ofrainfall. Climatic conditions of South-Western Australiaare more similar to the drier, Mediterranean regions wheredurum has been grown at rainfall of less than 400 mm witha winter incidence and a dry grain filling period. Weassume that grain yield and quality advances are most likelyto come from germplasm well adapted to the drier,Mediterranean regions.
The four durum varieties currently available inAustralia are Kamilaroi, Wollaroi, Yallaroi and Tamaroi. Allhave suitable grain quality for both domestic and exportmarkets. They are mid to short season, semi-dwarf types(between Amery and Carnamah in maturity). In WesternAustralia none are suitable for sowing before mid-May orafter mid-June.
Wollaroi is a short-season variety, suitable for early Junesowing and probably better adapted to drier areas.Kamilaroi, Yallaroi and Tamaroi are slightly longer seasonvarieties suited to late May sowings.
Dr. Ray Hare of the National Durum WheatImprovement Programme (NDWIP) bred the Australiandurum varieties at Tamworth in New South Wales. Theyare all resistant to the three rusts and moderately resistantto Septoria tritici. They are all susceptible to crown rot.However, Wollaroi has shown a certain level of tolerance toBoron toxicity in laboratory tests. Yallaroi, Wollaroi andTamaroi are moderately resistant to cereal cyst nematodeand root lesion nematodes. Wollaroi and Tamaroi haveshown a good resistance to pre-harvest sprouting damageby current standards in Western Australia. The Australiandurum varieties have no vernalization response and arephotoperiod insensitive.
CHAPTER 14 – SPECIAL WHEATS THE WHEAT BOOK
282
VARIETIES AND VARIETAL IMPROVEMENT

Durum is susceptible to the same range of pests anddiseases as bread wheat. Of the several hundred describeddiseases of wheat, less than 50 are of probable economicimportance in durum. Diseases discussed in this chapterare only the diseases relevant for Australia and WesternAustralia in particular. In Western Australia the mosttroublesome diseases are expected to be crown and rootrots, black point and Barley Yellow Dwarf Virus (BYDV).Among the other pests that we anticipate could beimportant are aphids (especially in their role as transmittersof viruses) and nematodes.
Crown rotCrown rot (Fusarium graminearum) is a soil-borne
disease, which is limiting the growth of durum andexpansion of the durum industry in Australia. The level ofresistance to crown rot in durum is generally less than inbread wheat. Durum can be devastated by crown rot. Yieldlosses from crown rot are caused by sterility of the florets.The crop symptoms are usually observed after floweringwhen scattered white-heads develop in a crop. Death ofplants or tillers after heading is evident in infected fields.Stem bases are honey colour and soft; under moistconditions stem bases and lower leaf sheaths are covered bycottony pink mycelium. Heads of these plants may beempty or partially filled. Crown rot can be confused withtake-all, which also causes white-heads, but is caused bydifferent fungi. Crown rot can result in grain losses of 50%or higher in durum where the season and rotation haveallowed the disease to build up. Extremely high yield lossesfrom this disease have been recorded in recent years. In1990, a yield loss of 50% was recorded in Kamilaroi inMalu, Queensland (Wildermuth, pers. comm.). In 1997,yield losses up to 40% were detected in durum inMerredin, Western Australia.
Australian durum varieties are extremely susceptible tocrown rot, but improved disease resistances can be expectedin future durum varieties. However, crop rotation can bethe most important management tool to reduce losses fromcrown rot. Fusarium survives predominantly in infectedstubble residues where it may persist for more than a year.It is recommended that a durum variety should not beplanted in an area where crown rot was present in theprevious two years. Where crown rot has occurred, therotation should be lengthened and include non-host cropssuch as pulses, canola, or else a grass-free pasture or fallow.Oats will provide an effective break in most situations. Athree-year break from host crops may be required wheredisease levels are high or where susceptible bread wheat ordurum has to be sown. Control of grass weeds in non-hostcrops and fallow is essential. Cultivation of soils, wherepossible, also aids the decomposition of infected stubbleand will help reduce disease levels. Rotation to any non-cereal crop lessens the level of the fungus in the soil andthereby reduces the level of disease in succeeding durumcrops. Adequate nitrogen and potassium levels appear to
reduce the severity of the disease, probably because theplants are more vigorous and therefore less affected by thepathogen. On the other hand, excessive fertility, especiallyexcessive levels of nitrogen, increases the severity of thedisease. Ammonium nitrogen sources appear to reduce theseverity of Fusarium spp. relative to nitrate nitrogen. InItaly, the farmers having problems with crown rot useGuazatine seed dressing with very successful results.
Black pointThe cause of black point is uncertain. It has been
associated with the fungus Alternaria alternata and withenzymes produced by the seed (poly phenol oxidase, ppo)both of which are favor by humid conditions. Black pointis very undesirable in durum where it may alter the colorof the kernel, adding undesirable black specks in semolinaIt is a problem in durum deliveries particularly in wet areasand may cause considerable downgrading when conditionsfavor its development. Humidity and temperature have amajor influence on black point development and varietiesdiffer in their susceptibility. However, the Australiandurum varieties should provide sufficient protection toprevent significant downgrading of grain following wetperiods after flowering.
Yellow leaf spot Yellow leaf spot (Pyrenophora tritici-repentis) survives in
wheat residues. Resistant varieties are the best way tocontrol yellow leaf spot. Symptoms are typically small, darkspots containing small, dark sites of infection surroundedby a variable sized yellow border which may cover much ofthe leaf. The disease is promoted by minimum tillage andmono-culture, which increases inoculum produced inwheat stubble. Crop rotation with non-hosts is advised. Ina recent study, increasing soil nitrogen and using nitrapyrin(which keeps nitrogen in the ammonium form) reducedyellow spot. Fungicides such as mancozeb reduce spottingbut are economically questionable in many areas. Recently,it has been noticed that bacteria protected wheat foliagefrom yellow spot. Resistance to yellow spot has beendetected in several durum selections and incorporated intoAustralian durum varieties. Wollaroi and Tamaroi haveconsistently exhibited intermediate resistance to yellow leafspot.
Septoria nodorum blotchThis disease occurs throughout the wheat belt,
particularly in high rainfall areas, and is most damaging inwarm moist conditions. However, in Western Australiainformation about this disease is not available at thepresent time because durum is mainly concentrated inmedium to low rainfall areas where the incidence of thisdisease is limited. To control S. nodorum it is advisable torotate with host free crops or manipulated pasture. Avoid
THE WHEAT BOOK CHAPTER 14 – SPECIAL WHEATS
283
PESTS AND DISEASES

early sowing where the climatic conditions are favorable forthe pathogen. Fungicide spray, such as Tilt may beeconomical only with crops expected to yield above 3t/haand should be applied after the flag leaf has emerged.
Rhizoctonia bare patchRhizoctonia bare patch (Rhizoctonia solani)
information not available for durum.
Root lesion nematodeRoot lesion nematode (RLN) is caused by Pratylenchus
thornei to which durum has adequate resistance, and byPratylenchus neglectus to which the current durum cultivarshave little resistance.
RustsSeedling and adult plant tests have indicated that the
Australian durum varieties have adequate resistance to stemrust (Puccinia graminis), leaf rust (Puccinia recondita) andstripe rust (Puccinia striiformis). The level of resistance tothe three rusts is better than in the bread wheats in WA.The improved resistance of the durum varieties to leaf rustis exemplified by the results at York in 1995 in the presenceof a local epidemic of leaf rust, where the durum outyielded the bread wheats by 20%.
The Australian durum cultivars are immune to flagsmut (Urocystis agropyri) and stinking bunt (Tilletia tritici).
VirusesNot under satisfactory control.
CHAPTER 14 – SPECIAL WHEATS THE WHEAT BOOK
284
PESTS AND DISEASES (continued)

The durum varieties available to Western Australiangrowers are short and mid-season types that are best sownfrom mid-May to mid-June in most parts of the grain belt.
Research to date has shown that the optimum plantpopulation for durum is about the same as bread wheat.Seed rates can be 5 to 10 % higher than for the breadwheats as the kernel size is mostly larger and most durumshave lower tillering capacity than bread wheats. Typicalyield responses to plant density are shown in figure 14.4and 14.5.
Rotation is extremely important for diseasemanagement, control of weeds and for increasing soilnitrogen. If a good legume rotation is practised (at leasttwo years in the last five years of high quality (more than50%) legume pasture or three years in the last five of grainlegumes), then the crop seldom responds to nitrogenfertilizers (see Figure 14.6 and 14.7). Furthermore, itincreases grain protein substantially if compared to durumfollowing wheat. However, an application of nitrogen atseeding is advisable to ensure that grain proteins are high.
The rotation strategy should also include measures toreduce grass weeds in the years leading up to the durumcrop. Pasture manipulation, heavy grazing with sheep andspray topping can be used in the pasture phase anddifferent combinations of chemicals can be used in theprevious non-cereal crops. Plan to avoid inducingherbicide resistance in grasses.
Rotation with non-cereal crops is also beneficial incontrolling both root and leaf spot diseases of the durumcrop. Green manure cropping with legumes may be usedto boost grain proteins. It is also a valid tool to controlweeds and diseases in some situations.
Fertilizer rates should be determined based on yieldsand paddock histories. Apply phosphate and potassium
THE WHEAT BOOK CHAPTER 14 – SPECIAL WHEATS
285
AGRONOMY, ROTATION AND NUTRITION
Figure 14.4.
Tamaroi at Merredin.
Figure 14.5.
Wollaroi at Merredin.
Research now underway will clarify this situation. Seedshould be sown at about 2 to 3 cm depth because of theshort to medium coleoptile lengths of the available durumvarieties.
Ensure seed is free from contamination with breadwheat and other cereals. When buying seed check thesource for purity, plumpness and a high germinationpercentage.
Durum has lower seedling vigour than bread wheatresulting in weak weed competitiveness in the early stagesof growth. Effective weed control in the early stages isnecessary to avoid a yield penalty. Use recommendedherbicide rates and apply at the correct times to avoidchemical damage.
Figure 14.6.
Tamaroi at York.
Figure 14.7.
Wollaroi at York

according to the soil test. As a guideline, apply nitrogen atsowing and/or up to 4 weeks after sowing, at about 25kg/ha for each tonne of expected yield in nitrogen-responsive situations. Durums are known to be sensitive todeficiencies of zinc, manganese and iron. If these elementshave not been applied recently to deficient soils theyshould be re-applied before the durum crop. Tissue testingis often a good guide to deficiencies. Durum is sensitive totoxicity of boron (>5mg/kg in CaCl2). However, Wollaroihas shown a very good degree of tolerance to B toxicityusing a modified lab screening technique and should beused where soil tests indicate B toxicity is a problem.Durum is extremely intolerant of Aluminum toxicity.Avoid soils where the soil test indicates Aluminum levelhigher than 10mg/kg (in CaCl2).
CHAPTER 14 – SPECIAL WHEATS THE WHEAT BOOK
286
AGRONOMY, ROTATION AND NUTRITION (continued)

Good agronomy for durum demands a grass free site.A grass free pasture and a grass free legume crop are themost effective ways to achieve these conditions.
Limited data from testing at 3 sites in 1998 only havedemonstrated variable and sometimes confusing responsesin the 2 most common durum cultivars, Tamaroi andWollaroi. The safest options based on these limited dataare:
Tigrex and Jaguar appear safe at label ratesDiuron and MCPA Amine should be used with similarcautions as in bread wheatGroup B herbicides are suspect for use on durum2,4-D Amine and Barrel are probably acceptable foruse on durumAvoid unusual or multi-chemical tank mixes that may
contain oils and/or wetters as they may increase cropphytotoxicity.
If the season is too short with a sharp finish thechemical effect on Tamaroi maybe magnified since it is alonger season variety than Wollaroi and may not have timeto compensate for any retardation by a herbicide.
THE WHEAT BOOK CHAPTER 14 – SPECIAL WHEATS
287
HERBICIDE TOLERANCE

If durum is to find a place in the Western Australianfarming system, growers must be attracted to both thepotential financial returns and the feasibility of productionincluding its culture and marketing.
Samples collected from commercial durum crops in the1997/98 season were put through a simple economicanalysis (J. Henderson) to give some indication of theprofitability and viability of introducing durum intoWestern Australian farm rotations (Table 14.9).
Table 14.9. Grain yield, protein percentage and grossmargin of durum compared to bread wheat crops in WAin 1997/98.
Yield (t/ha) Protein (%) Gross Margin
($/ha)
ADR1 (13) 1.60 13.92% $207.00
ADR2 (8) 2.20 12.46% $295.57
ADR3 (16) 2.22 10.37% $246.10
ASW (9) 2.66 9.51% $232.65
APW (6) 2.51 10.55% $249.37
AH1 (6) 2.34 12.26% $239.88
ADR1 (5)* 2.07 13.51% $317.87
* Durum 1 after removing cases heavily affected by frostand crown rot
The economic analysis showed that out of the 13 casesmeeting the ADR1 (13% protein) segregation, 8 cases
suffered yield loss due to severe frost damage and crownrot. Therefore the average grain yield and consequently thegross margin for the ADR1 segregation fell below that ofADR2 (11.5% protein).
After removing the cases that suffered yield loss due tothese factors the average grain yield of the remaining casesin the ADR1 segregation was 2.1 t/ha at 13.5% grainprotein with a gross margin of $317.87.
Two key messages were identified from growersexperience in 1997/98:
Durum wheat can achieve high returns for growers inWestern Australia;Good agronomic management is essential for aprofitable crop.In the 1997/98 season in Western Australia, about 50
farmers harvested approximately 3,000 tonnes of durum,of which around 1,000 tonnes was delivered for sale whilethe rest was kept as seed by the farmers for the comingseason. In Western Australia, up to 20,000 hectares areexpected to be grown in 1999 with 100,000 tonnesproduced annually by 2002. Prices for durum are buoyantand the long-term prognosis for pasta consumptionworldwide is optimistic.
The Scattergram below (Figure 14.8) shows the trendof grain yield versus grain protein for the durum. While thegraph does show a clear downward trend in protein as theyield increases it also shows that it is possible to achievehigher yields and high protein (to meet ADR1 segregation)if conditions are correct for durum and there is an absenceof disease.
CHAPTER 14 – SPECIAL WHEATS THE WHEAT BOOK
288
THE ECONOMICS OF GROWING DURUM
Figure 14.8.
Scattergram of grain yield vs grain protein.

Because of its hard texture, durum may fracture if overthreshed. Adjust concaves to avoid excessive cracked grainor embryo damage.
Durum grain should not be mixed with other cerealsduring harvesting, storing, transport or sowing. A mixturewith other grains severely reduces the quality of durumsemolina for pasta. Durum grain must be strictlysegregated, on-farm storage is necessary if immediatedelivery cannot be arranged.
THE WHEAT BOOK CHAPTER 14 – SPECIAL WHEATS
289
HARVESTING AND ADMIXTURES

Durum is a specialty crop that needs higher levels ofmanagement than bread wheat. It will not fit into allfarming systems in the Western Australian grain growingareas.
A survey of the soil types thought to be suitable fordurum has shown that the best soils are not concentratedinto large, homogeneous areas but they are scattered fromnorth to south, mostly in the low to medium rainfall areasof the grain belt. We anticipate that there will be fewerproblems on average with black point and leaf diseases inthe lower rainfall areas. There are a few areas in the highrainfall zone that may prove suitable with appropriatemanagement (e.g. Avon and Chapman valleys). Onbalance we anticipate that the bulk of the durum wheatindustry will develop on the heavier soil types in the low tomedium rainfall areas of Western Australia.
Interest in durum from grain growers in this State hasbuilt up over the past few years and is now widespread.This interest is due to high prices relative to bread wheat,by the need for alternative crops for particular farmingsystems, and the need to reduce risks and increase profits.
CHAPTER 14 – SPECIAL WHEATS THE WHEAT BOOK
290
PLACE OF DURUM IN THE FARMING SYSTEM

We acknowledge Mr. Frank Boetel for his valuableassistance in management of most of the experimental datareported here; the collaboration of Dr. Wal Anderson, co-supervisor of the durum wheat project for the westernregion; Mr. Jamie Henderson, for the economic analysis;Mr. Terry Piper and Mr. Craig Pensini for theircontribution in the herbicides sensitivity trials. We alsoacknowledge the contribution of the GRDC and local,innovative growers towards the establishment of thedurum industry in Western Australia.
THE WHEAT BOOK CHAPTER 14 – SPECIAL WHEATS
291
ACKNOWLEDGMENTS

Anon (1994). Durum Wheat Improvement.Workshop Series 3, Grains Research and DevelopmentCorporation, Canberra, Australia.
Durum wheat: chemistry and technology. Edited by G.Fabiani and C.Lintas. Published by the AACC, Inc. St.Paul, Minnesota, USA.
CHAPTER 14 – SPECIAL WHEATS THE WHEAT BOOK
292
FURTHER READING

THE WHEAT BOOK CHAPTER 14 – SPECIAL WHEATS
293
Bruce MullanAnimal Research and Development, AgricultureWestern Australia
IntroductionWheat is an excellent feed grain for most livestock
species even though it has been primarily produced as agrain for human consumption. Traditionally we havereferred to feed wheat as that which either did not meet thequality standards for the human market or when its supplyexceeded the requirements for the same market. Whilethere will always be a proportion of wheat still marketed tothe animal feed industry in this way, the development ofspecific varieties of wheat for the animal feed industry hasbegun.
This chapter will outline the major requirements of thestockfeed industry, and attempt to predict the possiblemarket for wheat in regard to the Western Australiaindustry.
The stockfeed industryA considerable proportion of Australia’s cereal grain
and grain legumes are consumed by animal industries.Traditionally this has been the pig and poultry industry,but in recent years there has been a large increase indemand for feed grains for feeding beef cattle in feedlotsand for dairy cows. In less than 10 years, demand for wheatby the Australian feed industry has increased by 30%(Table 14.10). The 2.2 million tonnes of wheat required bythe Australian feed industry is still small however comparedto the 526 million tonnes of total feed manufactured onthe world market in 1993 (Feed Grains Study, 1995).
The Australian dairy and beef industries have shownthe fastest growth in production over recent years(averaging in excess of 10%), with more intensiveindustries experiencing steady but low growth (2-3%).
FEED WHEATS – A FUTURE MARKET FOR WESTERN AUSTRALIANGRAIN GROWERS
Sector 1992/93 1999/001 % of total feedgrain used by each sector
Poultry meat 532 646 37
Pigs 511 562 31
Layer hens and pullets 197 195 38
Beef cattle 233 333 12
Dairy 135 317 15
Miscellaneous 99 167 N.A.
TOTAL 1,707 2,220
1 predicted value based on previous use and projected change in animal numbers
Table 14.10 – Use of wheat (kt) in Australia by the feed industry for 1992/93, that predicted for 1999/2000 and theproportion of total feed grain that is wheat for each sector
Feed grain usage varies significantly between sectors.Wheat is the most widely used grain due to its widespreadavailability and relatively high content of energy. It is usedas a key ingredient in broiler, layer and pig diets. Sincethere is not expected to be any substantial leap inconsumption of meat in Australia, any substantial growthin the future will be driven by export markets for bothmeat products and feed grains.

CHAPTER 14 – SPECIAL WHEATS THE WHEAT BOOK
294
Any feedstuff will be used in diets for animals if itsupplies the required nutrients, it is cost competitive withother available ingredients, and the user is confident that itwill produce the desired result. While in the past, animalindustries may have used wheat considered unsuitable forother purposes, such as weather-damaged grains, this is nolonger the case. Far greater attention is being given to theeffect that poor quality grains will have on animalperformance and quality of the end product. The feedindustry is now very sophisticated, and since the cost offeeds commonly represents 60 to 70% of the total cost ofproduction for many enterprises, every effort is being madeto reduce the cost of the mixed diet whilst meeting dietaryspecifications.
USE OF WHEAT IN ANIMAL FEEDS

THE WHEAT BOOK CHAPTER 14 – SPECIAL WHEATS
295
40% of Australian agriculture is carried out in the highrainfall zones, where grazing enterprises predominate andthese are vulnerable to income fluctuations associated withvolatile meat and wool markets. The option of growingwheat in these areas has, consequently, the potential forsome producers to diversify via a high yielding grain crop.
A winter wheat (sometimes referred to as red wheats)are those that are sown around the time of the autumnbreak, remain vegetative through the cold wet winter andthen flower around the middle of November. Due to therelatively late flowering, the risk of damage from frosts islower than for conventional wheat varieties. They are welladapted to areas with good rains in April and reliablespring rains through until at least late November, such assouthern Victoria but also small areas in the south west ofWestern Australia. To approach the potential of over 5tonnes per hectare, the crop requires a well structured, welldrained paddock and a very high standard of management.
Lawson and Paterson are the two varieties releasedunder licence to the Australian Wheat Board. Declic andMore are two other varieties that have been grown inVictoria.
Based on the results of experiments conducted by DrRay King at the Victorian Institute of Animal Science, thedigestibility of red wheat was essentially the same asAustralian Standard White (ASW), with digestible energycontent estimated at about 14.3 MJ/kg. Average crudeprotein was about 11%, however crude protein can beexpected to vary in a similar manner to ASW, dependingon the season and agronomic variables such as fertiliser.
Provided there is sufficient soil moisture for thesevarieties to be sown early (e.g. before the end of March),they can respond well to grazing during winter and thenrecover to produce a high yielding wheat crop. If the cropis intended for grain only, April or May sowings are usuallyideal. Long season winter wheats flower several weeks laterthan any Australian spring wheat bred for the wheatbeltand they also require low winter temperatures beforeflowering. Hence they are only likely to be suited to a smallarea of the south west in Western Australia, but these areareas where few options for growing cereals currently exist.
WINTER WHEAT

CHAPTER 14 – SPECIAL WHEATS THE WHEAT BOOK
296
protein, but this is currently difficult due to not being ableto test for these rapidly and reliably at the point of receival.The critical quality factors sought are consistency, free ofweeds, mould, moisture and pests. Protein is emerging as aquality factor and in the future the feed industry will pay apremium for high protein grain. It is more difficult to payfor energy, because it currently cannot be measured onreceival. Effective marketing, infrastructure and qualitysystems will enhance demand for feed grains such as wheatand the prices paid to producers.
QUALITY OF FEED WHEAT
There appears to have been scant attention by the grainindustry in the past to the specific needs of the feedindustries. One reason may be that the feed industry hasbeen relatively indiscriminating in their requirements forfeed grain. They have been relatively undemanding butconstant customers.
The prime nutritional constraints in specific diets arethose parameters which have the greatest cost pressureagainst them. The magnitude of these pressures varies withthe specifications nominated, and the nutrientcomposition and cost of alternative materials available.This will be different for each animal species and with therange of diets used within a species, consequently theseconstraints tend to be a moving target.
Table 15.11 indicates the value of wheat in a pig growerdiet varying the level of crude protein. On average, thevalue of wheat changes by approximately $2.70% of crudeprotein. Given that the average energy content of wheat is14.4 MJ digestible energy / kg, the value of wheat wouldincrease by $24.88 per 10% shift ($17.27 per MJ),compared to $3.01% shift in crude protein. This reflectsthe relative importance of wheat as a source of energyrather than protein in the diet of most animals.
Table 14.11 – The value of wheat in pig grower dietswhen crude protein is changed
% crude protein $/tonne
7 148.43
8 151.95
9 153.94
10 156.98
11 160.00
12 162.54
13 164.53
14 168.05
15 170.13
Variability in nutrient values for wheat
Parameter Range
Crude protein (%) 7 – 17
Bushel weight (Kg/Hl) 45-85
Metabolisable energy
(MJ/kg) 11.03 – 14.57
Digestible energy (MJ/kg) 12.90 – 15.00
To date there has been little payment for quality inrelation to nutritional factors. Currently specificationsrelate to issues such as residues, weight and admixturealthough recently crude protein has been included. In thefuture, purchasers will move towards a basis of energy and

In general there has been a lack of communication andco-operation between the grain and the feed industries.The call by the feed industry in the Eastern States duringrecent droughts to permit the import of feed grains fromoverseas was counteracted by the grains industry thatargued that this could result in the introduction of newplant diseases and pests. This was a clear signal that bothgroups needed to have a better understanding of eachother’s needs and concerns.
For grain growers to be attracted to the production ofwheat specifically for animals, there must be rapid andaccurate procedures for establishing the nutritional value ofgrain for the different livestock enterprises, so that theprices paid will reflect the grain value in terms of animalperformance. Similarly, animal industries will benefit fromthe precise knowledge of the nutritional value of the grains,as well as the improvements that can be made throughprocessing and storage procedures. The rational marketingof feed grains could then be achieved, with the benefitsfrom more efficient animal production being sharedbetween the grain grower and animal producer.
THE WHEAT BOOK CHAPTER 14 – SPECIAL WHEATS
297
FUTURE CONSIDERATIONS

CHAPTER 14 – SPECIAL WHEATS THE WHEAT BOOK
298
REFERENCES
Feed Grains Study (1995). Produced by the MeyersStrategy Group in conjunction with ABARE and ACEConsulting
Winter Wheat. An occasional publication by theAustralian Wheat Board.

THE WHEAT BOOK CHAPTER 14 – SPECIAL WHEATS
299
TRITICALE
Ron McTaggartTriticale (x Triticosecale Wittmack) is a cereal derived
from wheat and cereal rye. It is a quality feed grain withincreasing use in Australia’s animal industries. The value oftriticale in human nutrition has been poorly exploreddespite the high level of dietary fibre compared to wheat.The yield and quality of triticale has risen and it isreplacing other cereals as a fodder and grain plant in NewSouth Wales on acid soils.
Early triticales were very tall and resembled cereal rye inform. Backcrossing to wheat has led to plumper grains andhigher yields. The plant is taller than most wheats and theflowering spike has awns. The inflorescence has a narroweroutline than wheat due to the grain shape of triticale. Thegrain is longer and narrower than wheat and its colour islight brown. The plant does not tiller as much as wheat andseeding rates should be higher than wheat to achieve thesame number of heads/metre2 at harvest.

CHAPTER 14 – SPECIAL WHEATS THE WHEAT BOOK
300
HISTORY
The first cross between wheat and rye was reported aslong ago as 1857. The cross was a sterile plant. A numberof successful wheat x hybrids appeared in Russia in 1918.The F1 plants produced seeds which bred true. The nametriticale appeared in Germany from wheat (Triticum) andrye (Secale) about 1935. Today’s triticale varieties are due toprogress made by scientists in Canada, Poland, UnitedStates and Mexico. During its short life history incommercial production the features of the crop havechanged. The International Centre for Maize and Wheat(CIMMYT) in Mexico began breeding work on triticale in1965. The triticale varieties of that time were tall, latematuring, sometimes sterile, and the grain was small andshrivelled. Australia has a coordinated TriticaleImprovement Program with three breeding centres –University of New England, University of Sydney, andUniversity of Adelaide. Triticale types are selected forfodder types or for quality grain production.

THE WHEAT BOOK CHAPTER 14 – SPECIAL WHEATS
301
SOIL TYPES AND RAINFALL
Triticale has been favoured on soils of low fertilityperceived to be unsuitable for wheat. The reliability oftriticale in marginal soils is due to its early vigour,aggressive root development and ability to yield whenextremes of pH and marginal trace element status exist.The early vigour of the crop makes it the best-adaptedcereal for soils that become too wet during the growingseason.
Triticale can be grown in rainfall zones from 200mm to1200mm.The new triticale varieties will out-yield wheat inthe high rainfall zones which provide a long grain fillingperiod. Like all cereal crops, paddock selection and rootdisease control are important for high yields.
AGRONOMIC TRAITSEarly problems with triticale included excessive height,
low head fertility, low hectolitre weight, shrivelled grainand late maturity. Breeding and selection have fixed manyof these problems.
The diagram below shows the changes which havetaken place in the last ten years in grain type triticale.
Figure 14.19 – Changes to grain type triticale.
Cereal Foods World, June 1996.American Association of CerealChemists
Triticale has a larger grain than wheat and seeding ratesshould be higher than wheat. The early vigour of triticale,when it is combined with high seeding rates provides goodcompetition against weeds. Seeding rates vary with rainfalland yield potential.
Veg. Growth Rate(kg/day)
GrainfillDuration
Days Maturity
Test Weight (g)
Plant Height (cm)
Grain/m2
Grains/Spike
Spikes/m2
Harvest Index(%)
Biomass(t/ha)
Grain Yield (t/ha)Grain Biomass/day
(kg/day)
8
18
40
300
50
130
1700070
130
50
140
170
130
60
120
15050 150 14000
40
200
30166
80s Triticale90s Triticale

Table 14.12 – Seeding Rate
Annual Rainfall Target Plant Seeding Ratemm Density kg/ha *
(plants /m2 )
250-300 160-180 95-110
300-450 180-200 110-120
450-500 200-220 120-130
>500 240 130-140
*(Based on 1000 grain weight of 48 grams and 80%establishment.)
Triticale should be sown at the same time as wheat. Itmay flower 10 days earlier than wheat but grain fillingtakes longer. Test weight and plump grain depend on coolspring conditions so early sowing is important.
Triticale has similar tolerance levels as wheat to thesame groups of herbicides. Modern varieties of triticalehave leaf disease tolerance especially to stem, stripe and leafrusts.
Long season triticales are used for grazing or fodderproduction. They are sown on the opening rains; grazedduring winter and then saved for hay or silage. Their grainis usually smaller and lighter than the spring types, whichare grown for grain only.
CHAPTER 14 – SPECIAL WHEATS THE WHEAT BOOK
302
SEEDING RATE

Fodder types (Tall, late maturing, high biomassproduction – Maiden, Madonna
Supeseded varieties – Satu, Coorong, Currency, Tyalla.
Long season Abacus – must be planted early for 7 months season to
fill grain.
Standard mid seasonTahara – the most widely grown variety in 1990s. It is
fully resistant to Cereal Cyst Nematode. It has weak strawand will lodge when yields are over 3 tonnes.
Medium Season Muir – has a good straw strength and hectolitre weight
and is well suited to high rainfall areas – >600mm Credit – resistant to stem, stripe, and leaf rust. It is not
Cereal Cyst Nematode resistant but is a high yieldingvariety with good hectolitre weight.
Everest – high hectolitre weight, high yielding. Expect10 per cent better than Tahara in 500mm rainfall.
Treat – a medium season variety maturing 6 daysearlier than Tahara with superior straw strength andhectolitre weight (5kg better than Tahara).Average yieldwill be 2-3% better than Tahara but 10-15% better in highyielding sites.
THE WHEAT BOOK CHAPTER 14 – SPECIAL WHEATS
303
VARIETIES

CHAPTER 14 – SPECIAL WHEATS THE WHEAT BOOK
304
DELIVERY STANDARDS
Variety selection, paddock selection, time of plantingand good finish all play a part in producing high yielding,good quality grain. Delivery standards for triticale mayvary but moisture is expected to be below 12.5%,screenings below 6% and test weight above65kg/hectolitre. Discounts may apply for triticale withscreenings to 15% and test weight down to 60kg/hectolitre
There is no segregation for varieties but other deliverystandards exist for staining, sprouting and weed seed, orinsects in the sample.

Test weight is used as the first measure of grain qualitybut this should be backed up by laboratory tests formetabolisable energy and protein. Changes made tovarieties in the last 10-15 years have produced smoothgrain and with high energy levels. Triticale has a superioramino acid balance for animal feed rations.
Triticale quality has changed and data from animaltrials done with the old varieties do not have relevance fortoday’s producers. There will always be variation in qualityfrom paddock to paddock and season to season. Thefollowing table is therefore only a guide to relativitybetween wheat, triticale and rye.
The high sugar level in modern triticales leads toincreased palatability for cattle and reduces the “shy feeder”problem in dairy cattle and beef cattle in feed lots.
ProcessingLow gluten content, inferior gluten strength and high
levels of alpha-amylase cause triticale flours to form weakdough making them unsuitable for bread making. There isvariability in the flour and triticale can be used as a partial
replacement of wheat flours. Triticale can be used to makebiscuits and cakes. Some work has been done in the USand Canada to compare malting quality of triticale withUS barley. It was found that triticale had higher maltextract, higher diastatic power, and higher alpha and beta-amylase activity than barley – all factors of high malt value.Beers made were darker than from barley but the taste wasacceptable. Advances in breeding have shown the currenttriticales to be suitable for many end-uses beyond justanimal feed. Breeding continues to target traits for bothhuman and animal consumption.
PricingGrowing production has meant much more reliance on
triticale by livestock producers. Its energy levels andimproved palatability place it above feed barley by $12 –$15/tonne and $20/tonne below ASW price. Pricingshould be based on laboratory analysis, and any growerselling triticale to livestock farmers would do well to sampleand test the grain, and base the asking price on the analysisresults.
THE WHEAT BOOK CHAPTER 14 – SPECIAL WHEATS
305
FEED QUALITY
Table 14.13 – International Triticale Screening Nursery –Proportion of varieties reaching high-test weight and flour yield.
Year of Testing Test weight > 77kg/hl Flour Yield > 70%
1977-78 2.0 1.6
1983-84 14.7 16
1988-89 46.2 35
1990-91 64.1 70.0
Ref – Cereal Foods World July 1996
Table 14.14 – Composition on a dry weight basis (%).
Cereal Protein Starch Crude Fibre Free Sugars Ash
Triticale 10.3-15.6 57-65 3.1-4.5 3.7-5.2 1.4-2.0
Wheat 9.3-16.8 61-66 2.8-3.9 2.6-3.0 1.3-2.0
Rye 13.0-14.3 54.5 2.6 5.0 2.1
Ref – Cereal Foods World July 1996

CHAPTER 14 – SPECIAL WHEATS THE WHEAT BOOK
306

THE WHEAT BOOK CHAPTER 15
307
Appendix 1 ....................................................................................................308
Appendix 2 ....................................................................................................314
CHAPTER FIFTEEN
APPENDIXES
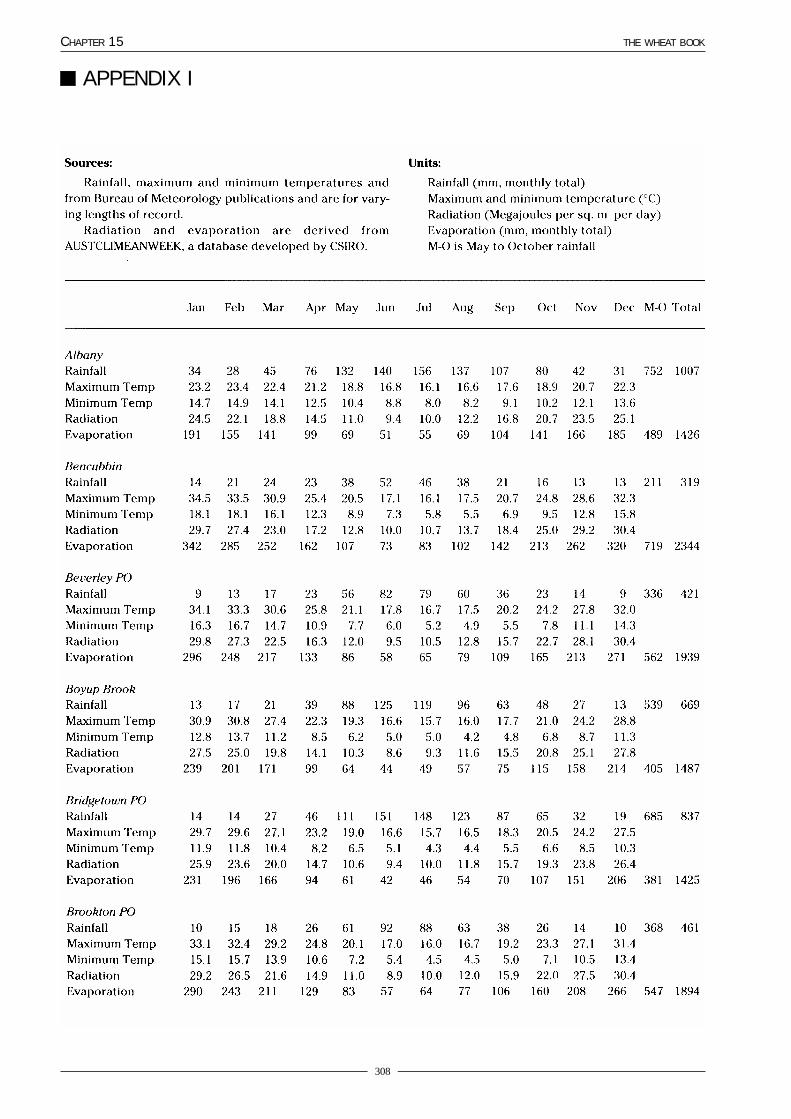
CHAPTER 15 THE WHEAT BOOK
308
APPENDIX I

THE WHEAT BOOK CHAPTER 15
309
APPENDIX I

CHAPTER 15 THE WHEAT BOOK
310
APPENDIX I

THE WHEAT BOOK CHAPTER 15
311
APPENDIX I

CHAPTER 15 THE WHEAT BOOK
312
APPENDIX I

THE WHEAT BOOK CHAPTER 15
313
APPENDIX I

CHAPTER 15 THE WHEAT BOOK
314
APPENDIX II
Mai
n so
il gr
oups
occ
urrin
g in
the
whe
at g
row
ing
area
s of
Wes
tern
Aus
tral
ian
Supe
r gr
oup
Soil
Gro
upD
escr
ipti
onC
omm
on s
oil p
rope
rtie
sA
ustr
alia
n D
istr
ibut
ion
wit
hin
the
Lan
d us
e co
nsid
erat
ions
nam
eSo
ilSo
uth-
wes
tfo
r w
heat
Cla
ssif
icat
ion
(Isb
ell,
1996
)
Roc
ky o
r st
ony
Bar
e ro
ckRo
ck o
utcr
opB
are
rock
exp
osed
on
surf
ace
Not
C
over
s ap
prox
imat
ely
2% o
f the
Uns
uita
ble
for
whe
at g
row
th.
soils
Min
imal
soi
l dev
elop
men
tap
plic
able
or
Whe
atbe
lt. O
ccur
s th
roug
hout
the
Shed
ding
of w
ater
may
M
ore
than
50%
Exc
lude
s du
ricru
st o
utcr
opR
udos
olar
ea, m
ost c
omm
on in
hill
y te
rrai
nco
ntrib
ute
to w
ater
ero
sion
of
coar
se fr
agm
ents
or d
eepl
y in
cise
d va
lleys
surr
ound
ing
soils
.(>
20 m
m)
thro
ugho
ut th
epr
ofile
.St
ony
soil
Ston
y th
roug
hout
Roc
ks o
r st
ones
dom
inan
tR
udos
ols
Cov
ers
appr
oxim
atel
y 1%
of t
heW
ater
-hol
ding
cap
acity
low
due
toth
roug
hout
the
prof
ileTe
noso
lsW
heat
belt.
Occ
urs
thro
ugho
ut th
esh
allo
w d
epth
and
hig
h st
one
Usu
ally
sha
llow
with
san
dy,
area
, mos
t com
mon
in h
illy
terr
ain
cont
ent.
Ston
e pr
esen
t obs
tacl
e to
loam
y, c
laye
y or
gra
velly
mat
rixor
dee
ply
inci
sed
valle
ys.
culti
vatio
n.
Iron
ston
e gr
avel
lySh
allo
w g
rave
lIr
onsto
ne g
rave
l soi
lYe
llow
/bro
wn
to g
rey
(som
etim
esK
ando
sols
Cov
ers
appr
oxim
atel
y 4%
of t
heG
ener
ally
has
insu
ffici
ent d
epth
soils
less t
han
80 c
mre
d) c
olou
rTe
noso
lsW
heat
belt.
Wid
espr
ead
on la
terit
icfo
r cr
oppi
ng.
Iron
ston
e gr
avel
deep
ove
r ce
men
ted
Neu
tral
to a
cid
pHpl
atea
u re
mna
nts.
(>20
% a
nd >
20 c
mgr
avels
(dur
icru
st)H
igh
grav
el c
onte
nth
ick)
, or
duric
rust
,Sa
ndy
or lo
amy
mat
rixw
ithin
the
top
15 c
m. I
rons
tone
grav
els
a do
min
ant
feat
ure
of th
e pr
ofile
.D
uple
x sa
ndy
Sand
y ir
onsto
neYe
llow
, bro
wn
or g
rey
colo
urK
ando
sols
Cov
ers
appr
oxim
atel
y 3%
of t
heU
sual
ly p
rodu
ctiv
e th
ough
hig
hgr
avel
grav
el so
il 30
-80
cmto
psoi
lTe
noso
lsW
heat
belt.
Fou
nd o
n la
terit
icgr
avel
con
tent
in th
e to
psoi
l may
deep
ove
r cla
y or
Neu
tral
to a
cid
pHC
hrom
osol
spl
atea
u re
mna
nts,
espe
cial
ly in
the
redu
ce w
ater
ava
ilabi
lity
retic
ulite
Hig
h gr
avel
con
tent
in to
psoi
lW
est M
idla
nds
and
betw
een
Cla
yey
subs
oil c
an fo
rm a
bar
rier
Ove
r cl
ay o
r re
ticul
ite a
t 30
toM
oora
and
Kat
anin
g. A
lsoto
wat
er m
ovem
ent a
nd r
esul
t in
80 c
mas
soci
ated
with
san
dpla
ins
in th
eth
e de
velo
pmen
t of p
erch
ed w
ater
nort
hern
and
cen
tral
Whe
atbe
ltta
bles
.an
d al
ong
the
Sout
h C
oast
.D
eep
sand
ySa
ndy
iron
stone
Yello
w, b
row
n or
gre
y co
lour
Kan
doso
lsC
over
s ap
prox
imat
ely
1% o
f the
Usu
ally
pro
duct
ive
thou
gh h
igh
grav
elgr
avel
soil
grea
ter
Neu
tral
to a
cid
pHTe
noso
lsW
heat
belt.
Fou
nd o
n la
terit
icgr
avel
con
tent
can
red
uce
wat
erth
an 8
0 cm
dee
pH
igh
grav
el c
onte
nt in
thro
ugho
utC
hrom
osol
spl
atea
u re
mna
nts,
espe
cial
ly in
the
avai
labi
lity
over
cla
y or
Usu
ally
ove
r lie
s cl
ayey
sub
soil
orW
est M
idla
nds
and
betw
een
cem
ente
d gr
avels
cem
ente
d gr
avel
s at
mor
e th
anM
oora
and
Kat
anin
g. A
lso80
cm
asso
ciat
ed w
ith s
andp
lain
s fr
omC
orrig
in s
outh
war
ds a
ndal
ong
the
Sout
h C
oast
.

THE WHEAT BOOK CHAPTER 15
315
APPENDIX IISu
per
grou
pSo
il G
roup
Des
crip
tion
Com
mon
soi
l pro
pert
ies
Aus
tral
ian
Dis
trib
utio
n w
ithi
n th
eL
and
use
cons
ider
atio
nsna
me
Soil
Sout
h-w
est
for
whe
atC
lass
ific
atio
n(I
sbel
l, 19
96)
Iron
ston
e gr
avel
lyL
oam
y gr
avel
Loam
y ir
onsto
neYe
llow
, red
or
brow
n co
lour
Kan
doso
lsC
over
s ap
prox
imat
ely
1% o
f the
Usu
ally
pro
duct
ive
soils
(co
ntin
ued)
grav
el so
il, o
ften
Neu
tral
to a
cid
pHTe
noso
lsW
heat
belt.
Fou
nd o
n la
terit
icgr
adin
g to
cla
y at
Hig
h gr
avel
con
tent
in to
psoi
lC
hrom
osol
spl
atea
u re
mna
nts,
espe
cial
ly in
the
mor
e th
an 3
0 cm
Usu
ally
gra
ding
to c
lay
byD
erm
osol
sW
est M
idla
nds
and
betw
een
30-8
0 cm
but
occ
asio
nally
dee
per
Moo
ra a
nd K
atan
ing.
Also
asso
ciat
ed w
ith s
andp
lain
s in
the
nort
hern
and
cen
tral
Whe
atbe
lt.
Shal
low
san
dsYe
llow
/bro
wn
Yello
w o
r br
own
Whi
te, g
rey
or p
ale
yello
w to
psoi
lR
udos
ols
Cov
ers
appr
oxim
atel
y 1%
of t
hePo
or w
ater
-hol
ding
capa
city
Sand
s le
ss th
ansh
allo
w s
and
sand
ove
r ro
ck,
Neu
tral
to a
cid
pHTe
nsos
ols
Whe
atbe
lt. F
ound
on
late
ritic
Oft
en in
suffi
cien
t roo
ting
dept
h80
cm
dee
p ov
erha
rdpa
n or
oth
erSo
met
imes
occ
urs
over
lim
esto
nepl
atea
u re
mna
nts,
espe
cial
ly in
the
rock
, har
dpan
or
cem
ente
d la
yer
atin
coa
stal
are
asW
est M
idla
nds.
Also
ass
ocia
ted
othe
r ce
men
ted
less t
han
80 c
m
with
san
dpla
ins
from
Cor
rigin
laye
r.so
uthw
ards
Dee
p sa
nds
Pale
dee
p W
hite
, gre
y or
pal
eW
hite
, gre
y or
pal
e ye
llow
Rud
osol
sC
over
s ap
prox
imat
ely
7% o
f the
Poor
nut
rient
and
wat
er r
eten
tion
Sand
s (s
ands
,sa
ndye
llow
sand
mor
eco
lour
ed to
psoi
lTe
noso
lsW
heat
belt.
Mos
t com
mon
lych
arac
teris
tics
loam
y sa
nds
and
than
80
cm d
eep
Neu
tral
to a
cid
pHPo
doso
lsas
soci
ated
with
san
dpla
ins
in th
ePr
one
to w
ind
eros
ion
and
clay
ey s
ands
) m
ore
Iron
ston
e gr
avel
may
be
pres
ent
Wes
t Mid
land
s an
d al
ong
the
non-
wet
ting
prob
lem
s.th
an 8
0 cm
dee
p.
in s
mal
l qua
ntiti
esSo
uth
Coa
st.
Hig
h re
char
ge r
iskW
eak
coffe
e ro
ck la
yer
may
be
pres
ent
Yello
w d
eep
Yello
w sa
nds g
reat
erYe
llow
or
yello
w-b
row
n to
psoi
lTe
noso
lsC
over
s ap
prox
imat
ely
5% o
f the
Mod
erat
e nu
trie
nt a
nd w
ater
sand
than
80
cm d
eep
Neu
tral
to a
cid
pHW
heat
belt.
Mos
t com
mon
lyre
tent
ion
char
acte
ristic
s.Ir
onst
one
grav
el m
ay b
e pr
esen
tas
soci
ated
with
san
dpla
ins
in th
eSu
scep
tible
to w
ind
eros
ion.
belo
w 1
5 cm
Wes
t Mid
land
s an
d in
land
of a
Mod
erat
e re
char
ge r
isk.
Iron
ston
e du
ricru
st o
r lim
esto
nelin
e be
twee
n G
eral
dton
and
may
be
pres
ent b
elow
80
cmC
orrig
in.
Gra
velly
pal
ePa
le sa
nd o
ver
Whi
te, g
rey
or p
ale
yello
w c
olou
rR
udos
ols
Cov
ers
appr
oxim
atel
y 1%
of t
hePo
or n
utrie
nt a
nd w
ater
ret
entio
nde
ep s
and
grav
elly
sand
at
Iron
ston
e gr
avel
laye
r (>
20%
Teno
sols
Whe
atbe
lt. M
ost c
omm
only
char
acte
ristic
s.15
-80
cmgr
avel
and
at l
east
20
cm th
ick)
as
soci
ated
with
san
dpla
ins
in th
ePr
one
to w
ind
eros
ion
and
com
men
ces
at 1
5-80
cm
.W
est M
idla
nds.
non-
wet
ting
prob
lem
s.N
eutr
al to
aci
d pH
Hig
h re
char
ge r
isk.
Cof
fee
rock
, cla
y or
dur
icru
st m
aybe
pre
sent
at m
ore
than
80
cm

CHAPTER 15 THE WHEAT BOOK
316
APPENDIX IISu
per
grou
pSo
il G
roup
Des
crip
tion
Com
mon
soi
l pro
pert
ies
Aus
tral
ian
Dis
trib
utio
n w
ithi
n th
eL
and
use
cons
ider
atio
nsna
me
Soil
Sout
h-w
est
for
whe
atC
lass
ific
atio
n(I
sbel
l, 19
96)
Dee
p sa
nds
Bro
wn
deep
Brow
n sa
nd m
ore
Bro
wn
with
in 3
0 cm
(so
met
imes
Teno
sols
Cov
ers
appr
oxim
atel
y 1%
of t
heU
sual
ly p
rodu
ctiv
e.
(con
tinu
ed)
sand
than
80
cm d
eep
has
a bl
ack
surf
ace)
Podo
sols
Whe
atbe
lt.
Sand
y th
roug
hout
Mos
tly li
mite
d to
riv
er fl
ats.
Neu
tral
to a
cid
pH
Oft
en o
ccur
s in
allu
vial
dep
osits
Sand
y ea
rths
Bro
wn
sand
yBr
own
sand
gra
ding
Bro
wn
tops
oil
Kan
doso
lsC
over
s ap
prox
imat
ely
1% o
f the
Hig
hly
prod
uctiv
e.
Soils
with
a s
andy
eart
hto
loam
by
80 c
mN
eutr
al to
aci
d pH
Whe
atbe
lt.
surf
ace
and
grad
ing
Usu
ally
allu
vial
Mos
tly li
mite
d to
riv
er fl
ats.
to lo
am b
y 80
cm
.M
ay g
rade
to c
lay
at d
epth
May
gra
de to
cla
y
at d
epth
.
Aci
d ye
llow
Stro
ngly
aci
d ye
llow
Yello
w th
roug
hout
(m
ay h
ave
Kan
doso
lsC
over
s ap
prox
imat
ely
1% o
f the
Low
pH
and
hig
h al
umin
um
sand
y ea
rth
sand
gra
ding
togr
ey s
urfa
ce)
Tens
osol
sW
heat
belt,
mos
tly o
n sa
ndpl
ains
conc
entr
atio
n se
vere
ly li
mit
root
loam
by
80 c
mSt
rong
ly a
cid
pH (
espe
cial
lybe
twee
n M
erre
din
and
Mor
owa.
grow
th a
nd y
ield
s.
subs
oil)
Iron
ston
e gr
avel
may
be
pres
ent
in s
ubso
il
Yello
w s
andy
Yello
w sa
nd g
radi
ngYe
llow
tops
oil
Kan
doso
lsC
over
s ap
prox
imat
ely
5% o
f the
Hig
hly
prod
uctiv
e.
eart
hto
loam
by
80 c
mN
eutr
al to
aci
d pH
Whe
atbe
lt. M
ost c
omm
only
May
be
pron
e to
sub
soil
Iron
ston
e gr
avel
may
be
pres
ent
asso
ciat
ed w
ith s
andp
lain
s in
the
acid
ifica
tion.
in s
ubso
ilW
est M
idla
nds
and
inla
nd o
f a
Usu
ally
por
ous
and
mas
sive
orlin
e be
twee
n G
eral
dton
and
poor
ly s
truc
ture
dC
orrig
in.
May
gra
de to
cla
y at
dep
th
Sand
y du
plex
esA
lkal
ine
grey
Gre
y sa
nd le
ss th
anG
rey
surf
ace,
ble
ache
d su
b-su
rfac
eSo
doso
lsC
over
s ap
prox
imat
ely
9% o
f the
Wat
erlo
ggin
g of
ten
occu
rs in
Soils
with
a s
andy
shal
low
30 c
m d
eep
over
Var
ious
col
ours
in s
ubso
il,
Whe
atbe
lt. C
omm
on o
n slo
pes
tops
oil d
ue to
sod
ic s
ubso
il.
surf
ace
and
a te
xtur
esa
ndy
dupl
exal
kalin
e cla
ym
ottli
ng is
com
mon
and
valle
y flo
ors
on tr
unca
ted
Con
ditio
ns in
sod
ic s
ubso
il m
ay
or p
erm
eabi
lity
Subs
oil h
as a
lkal
ine
pH (
ofte
nla
terit
e to
the
sout
h of
Kat
anni
ng,
rest
rict r
oot g
row
th.
cont
rast
at 3
-80
cm.
calc
areo
us)
Lake
Gra
ce a
nd th
e So
uth
Cos
at.
Surf
ace
seal
ing
may
occ
ur
Usu
ally
sod
icun
der
culti
vatio
n
May
incl
ude
sand
y lo
ams
Usu
ally
not
har
dset
ting

THE WHEAT BOOK CHAPTER 15
317
APPENDIX IISu
per
grou
pSo
il G
roup
Des
crip
tion
Com
mon
soi
l pro
pert
ies
Aus
tral
ian
Dis
trib
utio
n w
ithi
n th
eL
and
use
cons
ider
atio
nsna
me
Soil
Sout
h-w
est
for
whe
atC
lass
ific
atio
n(I
sbel
l, 19
96)
Sand
y du
plex
esA
lkal
ine
grey
G
rey
sand
30-
80 c
mG
rey
surf
ace
Chr
omos
ols
Cov
ers
appr
oxim
atel
y 3%
of t
heW
ater
logg
ing
ofte
n oc
curs
in(c
onti
nued
)sh
allo
w d
eep
deep
ove
r al
kalin
eV
ario
us c
olou
rs in
sub
soil
Sodo
sols
Whe
atbe
lt. C
omm
on o
n slo
pes
tops
oil d
ue to
sod
ic s
ubso
il.
dupl
excla
ySu
bsoi
l has
alk
alin
e pH
(of
ten
and
valle
y flo
ors
on tr
unca
ted
Con
ditio
ns in
sod
ic s
ubso
il m
ayca
lcar
eous
)la
terit
e be
twee
n M
oora
and
the
rest
rict r
oot g
row
th.
Subs
oil o
ften
sod
icSo
uth
Coa
st.
Sand
y to
psoi
l may
be
pron
e to
win
d er
osio
n.G
rey
deep
Gre
y sa
nd 3
0-80
cm
Gre
y, b
leac
hed
sub-
surf
ace
Chr
omos
ols
Cov
ers
appr
oxim
atel
y 10
% o
f the
Sand
y to
psoi
l may
bec
ome
sand
y du
plex
deep
ove
rV
ario
us c
olou
rs in
sub
soil,
So
doso
lsW
heat
belt.
seas
onal
ly w
ater
logg
ed.
non-
alka
line
clay
mot
tling
is c
omm
onW
ides
prea
d an
d co
mm
on o
n slo
pes
Con
ditio
ns in
sod
ic s
ubso
ils m
ayN
eutr
al to
aci
d pH
and
valle
y flo
ors
on tr
unca
ted
rest
rict r
oot g
row
th.
Non
-sod
ic a
nd s
odic
sub
soils
late
rite
betw
een
Moo
ra a
nd th
eSa
ndy
tops
oil m
ay b
e pr
one
toIr
onst
one
grav
el la
yer
ofte
n pr
esen
tSo
uth
Coa
st, a
lso a
ssoc
aite
d w
ithw
ind
eros
ion.
abov
e th
e cl
aysa
ndpl
ains
in th
e w
est M
idla
nds.
Gre
y sh
allo
wG
rey
sand
less
than
Gre
y, b
leac
hed
sub-
surf
ace
Chr
omos
ols
Cov
ers
appr
oxim
atel
y 6%
of t
heSa
ndy
tops
oil m
ay b
ecom
esa
ndy
dupl
ex30
cm
dee
p ov
erV
ario
us c
olou
rs in
sub
soil,
So
doso
lsW
heat
belt.
seas
onal
ly w
ater
logg
ed.
non-
alka
line
clay
mot
tling
is c
omm
onW
ides
prea
d an
d co
mm
on o
n slo
pes
Con
ditio
ns in
sod
ic s
ubso
ils m
ayN
eutr
al to
aci
d pH
and
valle
y flo
ors
on tr
unca
ted
rest
rict r
oot g
row
th.
Non
-sod
ic a
nd s
odic
sub
soils
late
rite
betw
een
Moo
ra a
nd th
eSa
ndy
tops
oil m
ay b
e pr
one
toIr
onst
one
grav
el la
yer
ofte
nSo
uth
Coa
st, a
lso a
ssoc
aite
d w
ithw
ind
eros
ion.
pres
ent a
bove
the
clay
sand
plai
ns in
the
wes
t Mid
land
s.R
etic
ulit
eG
rey
to y
ellow
or
Gre
y to
yel
low
or
brow
n to
psoi
lTe
noso
lsC
over
s ap
prox
imat
ely
1% o
f the
Sand
y to
psoi
l may
be
pron
e to
deep
san
dybr
own
sand
Neu
tral
to a
cid
pHK
ando
sols
Whe
atbe
lt. S
outh
ern
and
cent
ral
win
d er
osio
n.du
plex
30-8
0 cm
dee
p ov
erR
etic
ulite
pre
sent
at 3
0-80
cm
Chr
omos
ols
part
s of
the
Whe
atbe
lt an
d up
per
retic
ulite
(mot
tled
Iron
ston
e gr
avel
laye
r of
ten
pres
ent
Gre
at S
outh
ern
loam
y sa
nd to
sand
yab
ove
the
clay
clay
loam
)
Loa
my
eart
hsC
alca
reou
sC
alca
reou
s loa
m
Usu
ally
cal
care
ous
thro
ugho
utC
alca
roso
lsC
over
s ap
prox
imat
ely
5% o
f the
Hig
h lim
e co
nten
t may
inhi
bit
Soils
with
a lo
amy
loam
y(m
ay g
rade
to
(som
etim
e to
psoi
l is
non-
calc
areo
us)
Der
mos
ols
Whe
atbe
lt. C
omm
on o
n va
lley
root
gro
wth
.su
rfac
e (s
andy
loam
eart
hca
lcare
ous c
lay
Usu
ally
red
or
brow
n to
psoi
lflo
ors
in th
e to
the
nort
h an
d so
uth
Subs
alin
ity le
vels
can
be h
igh.
to c
lay
loam
) an
dat
dep
th)
(may
be
grey
)of
Mer
redi
n an
d in
the
mal
lee
Som
etim
es n
on-w
ettin
g.
eith
er lo
amy
Eith
er lo
am th
roug
hout
or
grad
ing
coun
try
nort
h of
Esp
eran
ce.
thro
ugho
ut o
rto
cla
y w
ith d
epth
grad
ing
to c
lay
byM
ay h
ave
limes
tone
or
calc
rete
at
80 c
m.
dept
hH
ards
ettin
g or
fluf
fy s
urfa
ceSo
met
imes
sal
ty

CHAPTER 15 THE WHEAT BOOK
318
APPENDIX IAPPENDIX IISu
per
grou
pSo
il G
roup
Des
crip
tion
Com
mon
soi
l pro
pert
ies
Aus
tral
ian
Dis
trib
utio
n w
ithi
n th
eL
and
use
cons
ider
atio
nsna
me
Soil
Sout
h-w
est
for
whe
atC
lass
ific
atio
n(I
sbel
l, 19
96)
Red
loam
yRe
d lo
am (m
ayR
ed to
psoi
lK
ando
sols
Cov
ers
appr
oxim
atel
y 2%
of t
heC
an b
e hi
ghly
pro
duct
ive.
eart
hgr
ade
to c
lay
at d
epth
)N
eutr
al to
aci
d pH
, som
etim
esW
heat
belt.
Mos
t com
mon
to th
eH
ards
ettin
g to
psoi
l can
be
aca
lcar
eous
and
alk
alin
e at
dep
thno
rth
and
east
of G
eral
dton
, but
prob
lem
.
Har
dset
ting
or c
rust
ing
surf
ace
scat
tere
d th
roug
hout
the
Usu
ally
mas
sive
or p
oorly
str
uctu
red
agric
ultu
ral a
rea
Iron
ston
e gr
avel
may
be
pres
ent
Loa
my
dupl
exes
Aci
d sh
allo
wLo
am o
r sa
nd le
ssSh
allo
w lo
am o
r oc
casio
nally
loam
yK
uros
ols
Cov
ers
appr
oxim
atel
y 1%
of t
hePo
or c
rop
perf
orm
ance
.
Soils
with
a lo
amy
dupl
exth
an 3
0 cm
dee
p ov
ersa
nd to
psoi
lW
heat
belt.
Fou
nd b
elow
Aci
dity
(an
d of
ten
sodi
city
and
surf
ace
and
a te
xtur
estr
ongl
y ac
id c
lay
Pink
, gre
y or
bro
wn
clay
sub
soil
brea
kaw
ays
betw
een
Mor
owa
and
salin
ity)
adve
rsel
y af
fect
roo
t
or p
erm
eabi
lity
Stro
ngly
aci
d pH
in s
ubso
ilJe
rram
ungu
p.gr
owth
.
cont
rast
at 3
-80
cm.
Subs
oil o
ften
sod
icN
on-w
ettin
g an
d su
rfac
e se
alin
g
prob
lem
s ar
e co
mm
on.
Pron
e to
wat
er e
rosio
n.
Alk
alin
e gr
eyG
rey
loam
less
Gre
y, s
omet
imes
bro
wn
tops
oil
Sodo
sols
Cov
ers
appr
oxim
atel
y 2%
of t
heW
ater
logg
ing
ofte
n oc
curs
in
shal
low
loam
yth
an 3
0 cm
Subs
oil h
as a
lkal
ine
pHC
hrom
osol
sW
heat
belt.
Com
mon
on
slope
s an
dto
psoi
l due
to s
odic
sub
soil.
dupl
exde
ep o
ver
(oft
en c
alca
reou
s)va
lley
floor
s on
trun
cate
d ,e
spec
ially
Con
ditio
ns in
sod
ic s
ubso
il m
ay
alka
line
clay
Surf
ace
com
mon
ly h
ards
ettin
gbe
twee
n K
atan
ning
, Lak
e G
race
rest
rict r
oot g
row
th.
Subs
oil o
ften
sod
ican
d R
aven
stho
rpe
and
to th
e no
rth
Surf
ace
seal
ing
may
occ
ur u
nder
of E
sper
ance
.cu
ltiva
tion.
Alk
alin
e re
dRe
d lo
am le
ss th
anR
ed to
psoi
lC
hrom
osol
sC
over
s ap
prox
imat
ely
2% o
f the
Surf
ace
pron
e to
har
dset
ting.
shal
low
30 c
m d
eep
over
Subs
oil h
as a
lkal
ine
pH
Sodo
sols
Whe
atbe
lt. M
ost c
omm
on b
etw
een
loam
y du
plex
alka
line
clay
(usu
ally
cal
care
ous)
Kan
doso
lsM
orow
a an
d C
orrig
in.
Surf
ace
com
mon
ly h
ards
ettin
g
Subs
oil s
omet
imes
sod
ic G
rey,
som
etim
es b
row
n C
alca
reou
s
subs
oil (
alka
line
pH)∑
Har
dset
ting
surf
ace
Gre
y sh
allo
w
Gre
y to
bro
wn
loam
G
rey
or b
row
n to
psoi
lC
hrom
osol
sC
over
s ap
prox
imat
ely
1% o
f the
Seas
onal
wat
erlo
ggin
g m
ay o
ccur
loam
y du
plex
less t
han
30 c
m d
eep
Neu
tral
sub
soil
pH (
non-
calc
areo
us)
Kan
doso
lsW
heat
belt.
Mos
t com
mon
on
abov
e cl
ayey
sub
soil.
over
non
-alk
alin
e cla
yFi
rm to
har
dset
ting
surf
ace
trun
cate
d la
terit
e be
twee
nSu
rfac
e se
alin
g m
ay o
ccur
und
er
Kat
anni
ng, L
ake
Gra
ce a
ndcu
ltiva
tion.
Rav
enst
horp
e.

THE WHEAT BOOK CHAPTER 15
319
APPENDIX IAPPENDIX IISu
per
grou
pSo
il G
roup
Des
crip
tion
Com
mon
soi
l pro
pert
ies
Aus
tral
ian
Dis
trib
utio
n w
ithi
n th
eL
and
use
cons
ider
atio
nsna
me
Soil
Sout
h-w
est
for
whe
atC
lass
ific
atio
n(I
sbel
l, 19
96)
Loa
my
dupl
exes
Yello
w/b
row
nYe
llow
/bro
wn
loam
Yello
w o
r br
own
tops
oil
Sodo
sols
Cov
ers
appr
oxim
atel
y 1%
of t
hePr
oduc
tive
soil.
(con
tinu
ed)
shal
low
loam
yles
s tha
n 30
cm
Usu
ally
neu
tral
sub
soil
pHC
hrom
osol
sW
heat
belt.
Seas
onal
wat
erlo
ggin
g m
ay o
ccur
dupl
exde
ep o
ver
clay
Firm
to h
ards
ettin
g su
rfac
eM
inor
soi
l sca
tter
ed th
roug
hout
abov
e cl
ayey
sub
soil.
agric
ultu
ral r
egio
n, m
ainl
y on
allu
vial
dep
osits
or
fres
h ro
ck.
Red
sha
llow
Red
loam
less
than
Red
or
red-
brow
n to
psoi
lC
hrom
osol
sC
over
s ap
prox
imat
ely
1% o
f the
Prod
uctiv
e so
il.lo
amy
dupl
ex30
cm
dee
p ov
erN
eutr
al to
alk
alin
e su
bsoi
l pH
Kan
doso
lsW
heat
belt.
Seas
onal
wat
erlo
ggin
g m
ay o
ccur
non-
alka
line
clay
Firm
to h
ards
ettin
g su
rfac
eab
ove
clay
ey s
ubso
il.O
ften
pro
ne to
wat
er e
rosio
n.R
ed d
eep
Red
to b
row
n lo
am
Red
or
red-
brow
n to
psoi
lC
hrom
osol
sC
over
s ap
prox
imat
ely
1% o
f the
Prod
uctiv
e so
il.lo
amy
dupl
ex30
-80
cm d
eep
clay
Neu
tral
to a
lkal
ine
subs
oil p
H
Sodo
slsW
heat
belt.
Mos
t com
mon
lySe
ason
al w
ater
logg
ing
may
occ
urSu
bsoi
l may
be
calc
areo
usK
ando
sols
asso
ciat
ed w
ith fr
esh
rock
bet
wee
nab
ove
clay
ey s
ubso
il.Fi
rm to
har
dset
ting
surf
ace
Nar
rogi
n an
d M
oora
.
Shal
low
loam
sR
ed s
hallo
wRe
d lo
am le
ss th
anR
ed c
olou
red
loam
Kan
doso
lC
over
s ap
prox
imat
ely
1% o
f the
Shal
low
dep
th li
mits
roo
ting
dept
hLo
ams
less
than
80
loam
80 c
m d
eep
over
Roc
k, h
ardp
an o
r ot
her
cem
ente
dW
heat
belt.
Mos
t com
mon
toan
d w
ater
-hol
ding
cap
acity
.cm
dee
p ov
er r
ock,
rock
or
hard
pan
laye
r by
80
cm (
typi
cally
by
30 c
m)
betw
een
Mer
redi
na a
nd M
orow
a.ha
rdpa
n or
oth
erU
sual
ly n
uetr
al to
aci
d pH
cem
ente
d la
yer.
Red
-bro
wn
Red
loam
less
than
Red
col
oure
d lo
amK
ando
sol
Cov
ers
appr
oxim
atel
y 2%
of t
heSh
allo
w d
epth
lim
its r
ootin
gha
rdpa
n50
cm
dee
p ov
erR
ed-b
row
n ha
rdpa
n by
50
cmW
heat
belt.
Mos
t com
mon
to th
ede
pth
and
wat
er-h
oldi
ng c
apac
ity.
shal
low
loam
red-
brow
n ha
rdpa
n U
sual
ly n
uetr
al to
aci
d pH
nort
h of
Ger
aldt
on a
nd M
orow
a.C
rack
ing
clay
sH
ard
crac
king
Cra
ckin
g cla
yR
ed, b
row
n, y
ello
w o
r gr
ey to
psoi
lV
erto
sols
Cov
ers
appr
oxim
atel
y 1%
of t
hePl
ant w
ater
ava
ilabi
lity
may
be
low
Soils
that
hav
e a
clay
with
out a
self-
Cla
y te
xtur
e th
roug
hout
Whe
atbe
lt. L
ocal
ly c
omm
on o
nin
dry
sea
sons
due
to h
igh
wat
er
clay
ey s
urfa
ce
mul
chin
g su
rfac
eD
eep
crac
ks w
hen
dry
valle
y flo
ors
betw
een
Jerr
amun
gup
rete
ntio
n by
hea
vy c
lays
.(li
ght t
o he
avy
clay
Var
iabl
e pH
and
Mor
owa
.or
san
dy c
lay)
at
Mas
sive
or p
edal
leas
t 30
cm th
ick
May
hav
e a
crus
ting
surf
ace
and
crac
k st
rong
lyw
hen
dry.
Non
-cra
ckin
g cl
ays
Red
/bro
wn
Red
or b
row
n no
n-R
ed o
r br
own
tops
oil
Der
mos
ols
Cov
ers
appr
oxim
atel
y 1%
of t
heSu
bjec
t to
soil
stru
ctur
e de
clin
e.So
ils th
at h
ave
a no
n-cr
acki
ng
crac
king
cla
y, us
ually
Cla
y te
xtur
e th
roug
hout
Kan
doso
lsW
heat
belt.
Wid
espr
ead
but r
arel
ycl
ayey
sur
face
(lig
ht
clay
with
goo
d str
uctu
reSu
bsoi
l som
etim
es c
alca
reou
sFe
rros
ols
com
mon
, usu
ally
ass
ocia
ted
with
to h
eavy
cla
y or
san
dyD
oes
not s
easo
nally
cra
ckdo
lerit
e dy
kes.
clay
) at
leas
t 30
cm
Usu
ally
str
uctu
red
and
fria
ble
thic
k an
d do
not
O
ften
has
har
dset
ting
surf
ace
crac
k st
rong
ly w
hen
dry.

CHAPTER 15 THE WHEAT BOOK
320
APPENDIX IAPPENDIX IISu
per
grou
pSo
il G
roup
Des
crip
tion
Com
mon
soi
l pro
pert
ies
Aus
tral
ian
Dis
trib
utio
n w
ithi
n th
eL
and
use
cons
ider
atio
nsna
me
Soil
Sout
h-w
est
for
whe
atC
lass
ific
atio
n(I
sbel
l, 19
96)
Gre
y no
n-G
rey
non-
crac
king
Oft
en g
rey
tops
oil,
som
etim
esK
ando
sols
Cov
ers
appr
oxim
atel
y 1%
of t
hePl
ant w
ater
ava
ilabi
lity
may
be
low
cr
acki
ng c
lay
clay
yello
w o
r br
own
Der
mos
ols
Whe
atbe
lt. L
ocal
y co
mm
on
in d
ry s
easo
ns d
ue to
hig
h w
ater
C
lay
text
ure
thro
ugho
utbe
twee
n K
atan
ning
, Lak
e G
race
rete
ntio
n by
hea
vy c
lays
.Su
bsoi
l oft
en c
alca
reou
san
d R
aven
stho
rpe.
Can
be
bogg
y an
d di
fficu
lt to
D
oes
not s
easo
nally
cra
ckcu
ltiva
te w
hen
wet
.O
ften
has
har
dset
ting
surf
ace
Wet
or
wat
er-
Salt
lake
soil
Var
iabl
e, s
easo
nally
Soils
affe
cted
by
high
to e
xtre
me
Hyd
roso
lsC
over
s ap
prox
imat
ely
3% o
f the
Wat
erlo
ggin
g an
d hi
gh s
alin
ity
logg
ed s
oils
wet
, sal
t lak
e so
ilsa
linity
Whe
atbe
lt. M
ainl
y on
val
ley
floor
sse
vere
ly li
mit
grow
th.
Soils
sea
sona
lly w
etSe
ason
ally
wet
to w
ithin
80
cmbe
twee
n Je
rram
ungu
p an
d M
orow
a.of
the
surf
ace
for
a m
ajor
par
t of
the
year
Incl
udes
san
ds, l
oam
s an
d cl
ays
Oft
en g
ypsif
erou
sO
ften
cal
care
ous
to w
ithin
80
cm o
fSa
line
wet
soi
lSe
ason
ally
wet
soil
Soils
affe
cted
by
mod
erat
e to
H
ydro
sols
Cov
ers
appr
oxim
atel
y 3%
of t
heW
ater
logg
ing
and
high
sal
inity
th
e su
rfac
e fo
r a
subj
ect t
o se
cond
ary
extr
eme
seco
ndar
y sa
linity
Whe
atbe
lt. C
omm
on o
n va
lley
seve
rely
lim
it gr
owth
.m
ajor
par
t of t
hesa
linity
Seas
onal
ly w
et to
with
in 8
0 cm
of
floor
s in
the
Whe
atbe
lt an
dye
ar.
the
surf
ace
for
a m
ajor
par
t of t
heW
oolb
elt.
year
Incl
udes
san
ds, l
oam
s an
d cl
ays
Sem
i-wet
soi
lN
on-sa
line
soils
Lo
wer
par
t of t
he p
rofil
e sa
tura
ted
Hyd
roso
ls,C
over
s ap
prox
imat
ely
1% o
f the
Wat
erlo
ggin
g m
oder
atel
y lim
its
wat
erlo
gged
at 3
0-fo
r a
maj
or p
art o
f the
yea
r C
hrom
osol
s, W
heat
belt.
Mos
t com
mon
on
the
grow
th, a
rtifi
cial
dra
inge
may
be
80 c
m fo
r a
maj
orIn
clud
es s
ands
, loa
ms
and
clay
sK
ando
sols,
So
uth
Coa
st a
nd h
inte
rland
.an
opt
ion.
part
of t
he y
ear.
Aci
d to
neu
tral
pH
Podo
sols,
D
oes n
ot in
clude
V
aria
ble
subs
oil,
may
con
tain
R
udos
ols,
soils
with
a
bog-
iron
Teno
sols
and
tem
pora
ry p
erch
edSo
doso
lsw
ater
tabl
e.

NOTES
321

322
NOTES

Photo: Simon Eyres. Wheat crop near Wongan Hills