the valuation of bonds timothy r. mayes, ph.d. fin 4600: chapter 12
TRANSCRIPT

The Valuation of Bonds
Timothy R. Mayes, Ph.D.
FIN 4600: Chapter 12

Information Required
To value a bond, we need to understand the cash flows that it promises to provide. Therefore we need: Face (or Par) Value Callability – could be continuously callable, on a schedule, make-whole (face value + PV of
remaining interest payments discounted at a specified Treasury yield + some spread), or not callable.
Maturity Date Settlement Date Coupon Rate Required Rate
Except for the required rate, this information and all other information about the bond can be found in the indenture, or by asking a broker or dealer.
The indenture is the contract that specifies all of the details of the issue. This can be found for a specific company by searching the SEC’s Edgar database for Form 424B2. To find a specific bond, restrict your search to dates around the date of the issue. If the bond is callable, this form will also list the call terms including the spread over Treasuries if it is a make-whole call.
For an example, see: PPG Bond Issue (that is a hyperlink to Edgar).

Bond Values
Bond values are discussed in one of two ways: The dollar price The yield to maturity
These two methods are equivalent since a price implies a yield, and vice-versa

Bond Yields
There are several ways that we can describe the rate of return on a bond: Coupon rate Current yield Yield to maturity Modified yield to maturity Yield to call Realized Yield
The Coupon Rate
The coupon rate of a bond is the stated rate of interest that the bond will pay.
The coupon rate does not normally change during the life of the bond, instead the price of the bond changes as the coupon rate becomes more or less attractive relative to other interest rates.
The coupon rate determines the dollar amount of the annual interest payment:
Annual Pmt Coupon Rate Face Value

The Current Yield
The current yield is a measure of the current income from owning the bond
It is calculated as:
Note that the current yield considers only the income portion of the bond return, so it is most useful to investors needing current income.
𝐶𝑌=𝐴𝑛𝑛𝑢𝑎𝑙 𝑃𝑚𝑡𝐶𝑢𝑟𝑟𝑒𝑛𝑡 𝑃𝑟𝑖𝑐𝑒

The Yield to Maturity
The yield to maturity is the average annual rate of return that a bondholder will earn under the following assumptions: The bond is held to maturity The interest payments are reinvested at the YTM
The yield to maturity is the same as the bond’s internal rate of return (IRR).

The Modified Yield to Maturity
The assumptions behind the calculation of the YTM are often not met in practice.
This is particularly true of the reinvestment assumption. To more accurately calculate the yield, we can change
the assumed reinvestment rate to the actual rate at which we expect to reinvest.
The resulting yield measure is referred to as the modified YTM, and is the same as the MIRR for the bond.
The Yield to Call
Many corporate bonds, and many older government bonds, have provisions that allow them to be called if interest rates should drop during the life of the bond.
Normally, if a bond is called, the bondholder is paid a premium over the face value (known as the call premium).
The YTC is calculated exactly the same as YTM, except: The call premium is added to the face value, and The first call date is used instead of the maturity date

The Realized Yield
The realized yield is an ex-post measure of the bond’s returns.
The realized yield is simply the average annual rate of return that was actually earned on the investment.
If you know the future selling price, reinvestment rate, and the holding period, you can calculate an ex-ante realized yield which can be used in place of the YTM (this might be called the expected yield).

Calculating Bond Yield Measures
As an example of the calculation of the bond return measures, consider the following: You are considering the purchase of a 2-year bond
(semiannual interest payments) with a coupon rate of 8% and a current price of $964.54. The bond is callable in one year at a premium of 3% over the face value. Assume that interest payments will be reinvested at 9% per year, and that the most recent interest payment occurred immediately before you purchase the bond. Calculate the various return measures.
Now, assume that the bond has matured (it was not called). You purchased the bond for $964.54 and reinvested your interest payments at 9%. What was your realized yield?

Calculating Bond Yield Measures (cont.)
0 1 2 3 4
401,000
40 40 40-964.54
0 1 2
401,030
40-964.54Timeline if called
Timeline if not called

Calculating Bond Yield Measures (cont.)
The yields for the example bond are: Current yield = 8.294% YTM = 5% per period, or 10% per year Modified YTM = 4.971% per period, or 9.943% per
year YTC = 7.42% per period, or 14.84% per year Realized Yield:
if called = 7.363% per period, or 14.725% per year if not called = 4.971% per period, or 9.943% per year

Bond Valuation in Practice
The preceding examples ignore a couple of important details that are important in the real world: Those equations only work on a payment date. In
reality, most bonds are purchased in between coupon payment dates. Therefore, the purchaser must pay the seller the accrued interest on the bond in addition to the quoted price.
Various types of bonds use different assumptions regarding the number of days in a month and year.

Valuing Bonds Between Coupon Dates (cont.)
Imagine that we are halfway between coupon dates. We know how to value the bond as of the previous (or next) coupon date, but what about accrued interest?
Accrued interest is assumed to be earned equally throughout the period (there is no compounding between payment dates), so that if we bought the bond today, we’d have to pay the seller one-half of the period’s interest.
Bonds are generally quoted “flat,” that is, without the accrued interest. So, the total price you’ll pay is the quoted price plus the accrued interest (unless the bond is in default, in which case you do not pay accrued interest, but you will receive the interest if it is ever paid).
Valuing Bonds Between Coupon Dates (cont.)
The procedure for determining the quoted price of the bonds is: Value the bond as of the last payment date. Take that value forward to the current point in time.
This is the total price that you will actually pay. To get the quoted price, subtract the accrued interest.
We can also start by valuing the bond as of the next coupon date, and then discount that value for the fraction of the period remaining.

Valuing Bonds Between Coupon Dates (cont.)
Let’s return to our original example (3 years, semiannual payments of $50, and a required return of 7% per year).
As of period 0 (today), the bond is worth $1,079.93. As of next period (with only 5 remaining payments) the bond will be worth $1,067.73. Note that:
So, if we take the period zero value forward one period, you will get the value of the bond at the next period including the interest earned over the period.
50035.193.107973.1067 1
P1 P0 Interest earned

Valuing Bonds Between Coupon Dates (cont.)
Now, suppose that only half of the period has gone by. If we use the same logic, the total price of the bond (including accrued interest) is:
Now, to get the quoted price we merely subtract the accrued interest:
If you bought the bond, you’d get quoted $1,073.66 but you’d also have to pay $25 in accrued interest for a total of $1,098.66.
66.1098035.193.1079 5.0
66.10732566.1098 QP

Day Count Conventions
Historically, there are several different assumptions that have been made regarding the number of days in a month and year. Not all fixed-income markets use the same convention: 30/360 – 30 days in a month, 360 days in a year. This is used in the
corporate, agency, and municipal markets. Actual/Actual – Uses the actual number of days in a month and year.
This convention is used in the U.S. Treasury markets. Two other possible day count conventions are:
Actual/360 Actual/365
Obviously, when valuing bonds between coupon dates the day count convention will affect the amount of accrued interest.

The Term Structure of Interest Rates
Interest rates for bonds vary by term to maturity, among other factors.
The yield curve describes the yield differential among treasury issues of differing maturities.
Thus, the yield curve can be useful in determining the required rates of return for loans of varying maturity.

Types of Yield CurvesRising Declining
Flat Humped

Today’s Actual Yield Curve
Data Source: Yahoo! Finance
US Treasury Bonds RatesMaturity Yield Yesterday Last Week Last Month3 Month 0.03 0.03 0.04 0.066 Month 0.10 0.09 0.10 0.162 Year 0.65 0.60 0.66 0.753 Year 1.08 1.06 1.16 1.255 Year 2.02 2.01 2.11 2.1710 Year 3.36 3.30 3.41 3.4430 Year 4.45 4.39 4.46 4.49
0.00%
1.00%
2.00%
3.00%
4.00%
5.00%
0 5 10 15 20 25 30
Yiel
d to
Mat
urit
y
Term to Maturity (Years)
U.S. Treasury Yield Curve Apr. 27, 2011
Today Last Month

Explanations of the Term Structure
There are three popular explanations of the term structure of interest rates (i.e., why the yield curve is shaped the way it is): The expectations hypothesis The liquidity preference hypothesis The market segmentation hypothesis (preferred
habitats) Note that there is probably some truth in each of
these hypotheses, but the expectations hypothesis is probably the most accepted.

The Expectations Hypothesis
The expectations hypothesis says that long-term interest rates are geometric means of the shorter-term interest rates.
For example, a ten-year rate can be considered to be the average of two consecutive five-year rates (the current five-year rate, and the five-year rate five years hence).
Therefore, the current ten-year rate must be:
10 555
5510 111 RRR t

The Expectations Hypothesis (cont.)
For example, if the current five-year rate is 8% and the expected five-year rate five years from now is 10%, then the current ten-year rate must be:
In an efficient market, if the ten-year rate is anything other than 8.995%, then arbitrage will bring it back into line
If the ten-year rate was 9.5%, then people would buy ten-year bonds and sell five-year bonds until the rates came back into line
10 5510 10.108.11 Rt

The Expectations Hypothesis (cont.)
The ten-year rate can also be thought of a series of five two-year rates, ten one-year rates, etc.
Note that since the ten-year rate is observable, and t+5R5 is not, we normally would solve for an expected future rate.
In the previous example, we would usually solve for the expected five-year rate five years from now:
55
5t
1010t
55tR1
R1R1
55
10
08.1
08995.110.1

The Liquidity Preference Hypothesis
The liquidity preference hypothesis contends that investors require a premium for the increased volatility of long-term investments.
Thus, it suggests that, all other things being equal, long-term rates should be higher than short-term rates.
Note that long-term rates may contain a premium, even if they are lower than short-term rates.
There is good evidence that such premiums exist.

The Market Segmentation Hypothesis
This theory is also known as the preferred habitat hypothesis because it contends that interest rates are determined by supply and demand and that different investors have preferred maturities from which they do no stray.
There is not much support for this hypothesis.
D
SD
S
Banks
InsuranceCompanies
Bond Price Volatility
Bond prices change as any of the variables change (Malkiel’s Theorems): Prices vary inversely with yields. The longer the term to maturity, the larger the change in
price for a given change in yield. The lower the coupon, the larger the percentage change in
price for a given change in yield. Price sensitivity to yield changes increases with maturity
(theorem 2), but at a decreasing rate. Price changes are greater (in absolute value) when rates
fall than when rates rise.
Measures of Price Volatility
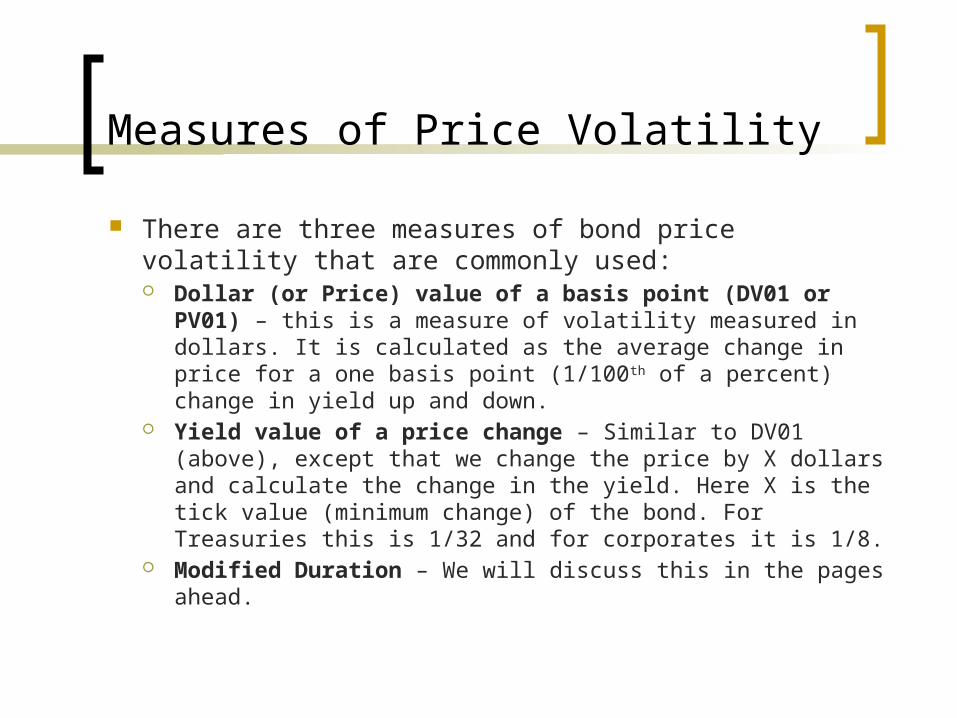
There are three measures of bond price volatility that are commonly used: Dollar (or Price) value of a basis point (DV01 or PV01) –
this is a measure of volatility measured in dollars. It is calculated as the average change in price for a one basis point (1/100th of a percent) change in yield up and down.
Yield value of a price change – Similar to DV01 (above), except that we change the price by X dollars and calculate the change in the yield. Here X is the tick value (minimum change) of the bond. For Treasuries this is 1/32 and for corporates it is 1/8.
Modified Duration – We will discuss this in the pages ahead.

Measuring Term to Maturity
It is difficult to compare bonds with different maturities and different coupons, since bond price changes are related in opposite ways to these variables.
Macaulay developed a way to measure the average term to maturity that also takes the coupon rate into account.
This measure is known as duration, and is a better indicator of volatility than term to maturity alone.

Duration
Duration is calculated as:
So, Macaulay’s duration is a weighted average of the time to receive the present value of the cash flows.
The weights are the present values of the bond’s cash flows as a proportion of the bond price.
D
Pmt t
i
Bond ice
tt
t
N
1
1
Pr

Calculating Duration
Recall our earlier example bond with a YTM of 5% per six-months:
Note that this is 3.77 six-month periods, which is about 1.89 years.
0 1 2 3 4
401,000
40 40 40-964.54
D
40105
140
1052
40
1053
1040
1054
964 54
3636 76
964 54377
2 3 4. . . .
.
.
..

Notes About Duration
Duration is less than term to maturity, except for zero coupon bonds where duration and maturity are equal.
Higher coupons lead to lower durations. Longer terms to maturity usually lead to longer
durations. Higher yields lead to lower durations. As a practical matter, duration is generally no
longer than about 20 years even for perpetuities.

Modified Duration
A measure of the volatility of bond prices is the modified duration (higher DMod = higher volatility).
Modified duration is equal to Macaulay’s duration divided by 1 + per period YTM.
Note that this is the first partial derivative of the bond valuation equation wrt the yield.
D
D
iMod 1

Why is Duration Better than Term?
Earlier, it was noted that duration is a better measure than term to maturity. To see why, look at the following example:
Suppose that you are comparing two five-year bonds (annual payments), and are expecting a drop in yields of 1% almost immediately. Bond 1 has a 6% coupon and bond 2 has a 14% coupon. Which would provide you with the highest potential gain if your outlook for rates actually occurs? Assume that both bonds are currently yielding 8%.

Why is Duration Better than Term? (cont.)
Both bonds have equal maturity, so a superficial investigation would suggest that they will both have the same gain. However, as we’ll see bond 2 would actually gain more.
81.308.111.4
11.471.1159
508.1
1000
08.1
120
11.408.144.4
44.415.920
508.1
1000
08.1
60
2,
5
5
12
1,
5
5
11
Mod
tt
Mod
tt
D
tD
D
tD
Why is Duration Better than Term? (cont.)
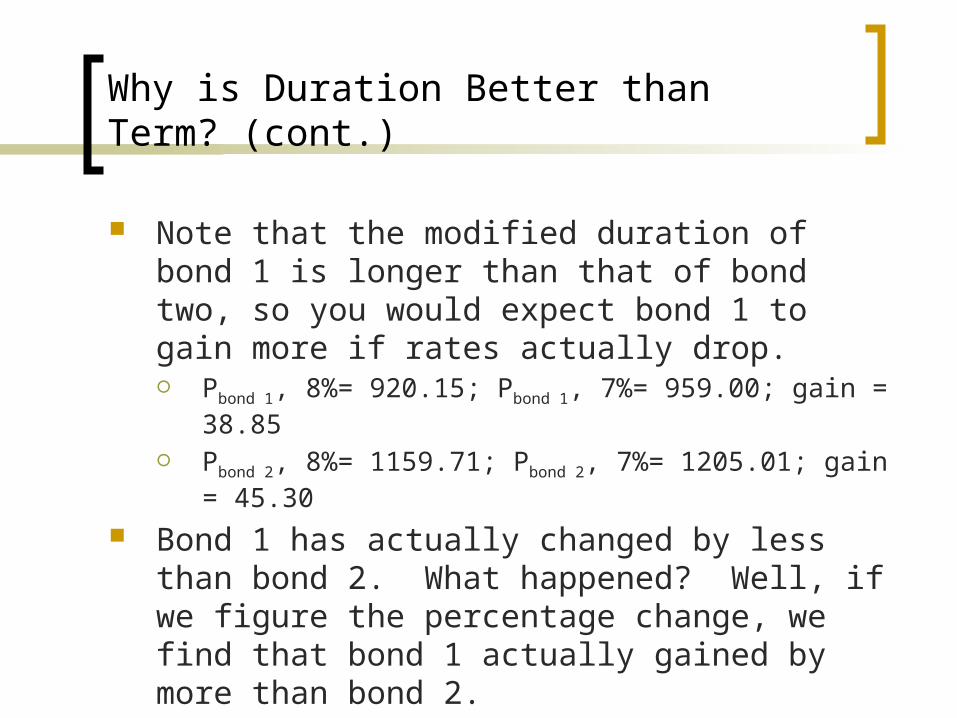
Note that the modified duration of bond 1 is longer than that of bond two, so you would expect bond 1 to gain more if rates actually drop. Pbond 1, 8%= 920.15; Pbond 1, 7%= 959.00; gain = 38.85
Pbond 2, 8%= 1159.71; Pbond 2, 7%= 1205.01; gain = 45.30
Bond 1 has actually changed by less than bond 2. What happened? Well, if we figure the percentage change, we find that bond 1 actually gained by more than bond 2.
%Dbond 1 = 4.22%; %Dbond 2 = 3.91% so your gain is actually 31 basis points higher with bond 1.

Why is Duration Better than Term? (cont.)
Bond price volatility is proportionally related to the modified duration, as shown previously. Another way to look at this is by looking at how many of each bond you can purchase.
For example, if we assume that you have $100,000 to invest, you could buy about 108.68 units of bond 1 and only 86.23 units of bond 2.
Therefore, your dollar gain on bond 1 is $4,222.14 vs. $3,906.15 on bond 2. The net advantage to buying bond 1 is $315.99. Obviously, bond 1 is the way to go.
Convexity
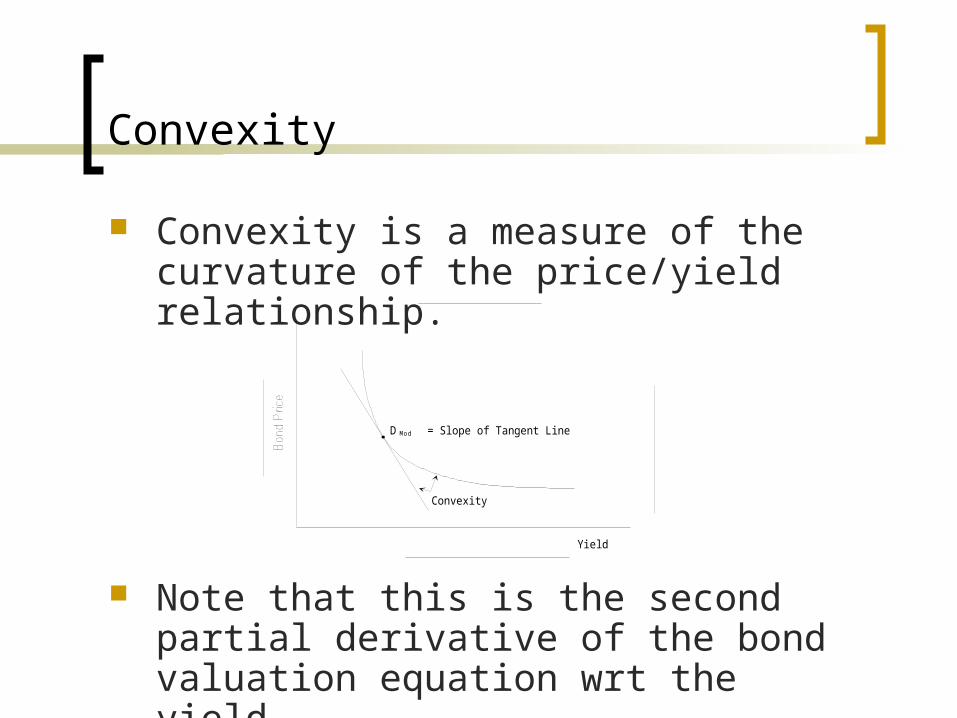
Convexity is a measure of the curvature of the price/yield relationship.
Note that this is the second partial derivative of the bond valuation equation wrt the yield.
Yield
D = Slope of Tangent LineMod
Convexity

Calculating Convexity
Convexity can be calculated with the following formula:
For the example bond, the convexity (per period) is:
C
i
CF
it t
V
tt
t
N
B
1
1 12
2
1
C
40 1 1
105
40 2 2
105
40 3 3
105
1040 4 4
105
105
964 54
17 820 73
11025964 54
16 163 93
964 5416 758
2
1
2
2
2
3
2
4
2
. . . .
.
.
, .
..
, .
..
Calculating Convexity (cont.)
To make the convexity of a semi-annual bond comparable to that of an annual bond, we divide the convexity by 4 (= 22).
In general, to convert convexity to an annual figure, divide by m2, where m is the number of payments per year.

Taylor Series Approximation of Change in Price
We can use a Taylor Series expansion of the price/yield function to approximate the change in bond price for a change in the yield:
We can safely ignore the third and higher order terms.
Dividing both sides by the bond price gives us the approximate percentage change in price.
22
2
2
1dy
dy
Pddy
dy
dPdP
22
2 1
2
11dy
Pdy
Pddy
Pdy
dP
P
dP

Calculating Bond Price Changes
We can approximate the change in a bond’s price for a given change in yield by using duration and convexity:
If yields rise by 1% per period, then the price of the example bond will fall by 33.84, but the approximation is:
V D i V C V iB Mod B B 0 52
.
VB 359 0 01 964 54 0 5 16 75 964 54 0 01 34 63 0 81 33822
. . . . . . . . . .
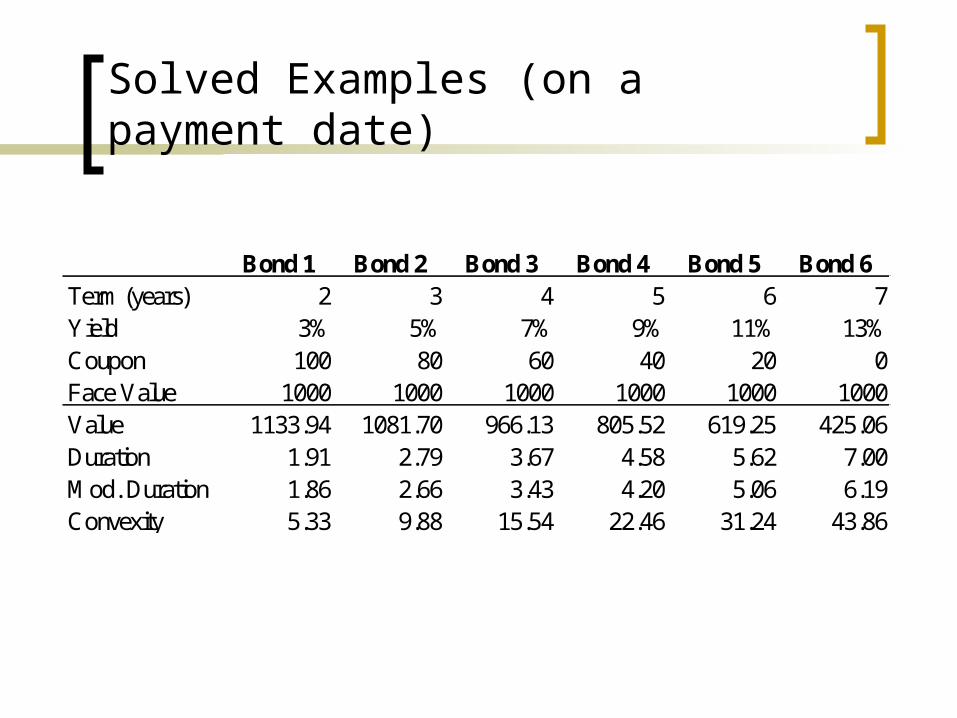
Solved Examples (on a payment date)
Bond 1 Bond 2 Bond 3 Bond 4 Bond 5 Bond 6Term (years) 2 3 4 5 6 7Yield 3% 5% 7% 9% 11% 13%Coupon 100 80 60 40 20 0Face Value 1000 1000 1000 1000 1000 1000Value 1133.94 1081.70 966.13 805.52 619.25 425.06Duration 1.91 2.79 3.67 4.58 5.62 7.00Mod. Duration 1.86 2.66 3.43 4.20 5.06 6.19Convexity 5.33 9.88 15.54 22.46 31.24 43.86