the syntheses of hydrotalcite-like compounds … 23/23-5-369.pdfhydrotalcite-like compounds and...
TRANSCRIPT
Clays and Clay Minerals, Vol. 23, pp. 369-375. Pergamon Press 1975. Printed in Great Britain
THE SYNTHESES OF HYDROTALCITE-LIKE C O M P O U N D S A N D THEIR STRUCTURES A N D
PHYSICO-CHEMICAL PROPERTIES I: THE SYSTEMS MgZ+-A13+-NO3, MgZ+-A13+-C1 -,
Mg 2 +-A13 +-ClOg, Ni 2 +-A13 +-C1- AND Zn 2 +-A13 +-C1-
SHIGEO MIYATA
Kyowa Chemical Industry Co. Ltd., Yashimanishi-machi, Takamatsu-shi, Japan
(First received 24 September 1974; and in final form 24 May 1975)
Abstract The basic salts of this system were prepared and their structures and physico--chemical properties were studies by electron microscopy, chemical analysis, X-ray powder diffraction, thermal analysis, i.r. absorption spectra, BET absorption, and acidity-basicity measurements. The salts were found to be new compounds analogous to hydrotalcite. They can be expressed by the formula; [M 2§ M3+(OH)2(x+y)] r+ [A~-A2~ "mH20] -C~t+2~/ where M 2+ and M 3+ denote di- and trivalent cations, A- and A 2- denote mono- and divalent anions, respectively, and y = zl + 2z2 ; zl ~> z2.
The structures consist of positively charged Cd(OH)2-1ike basic layers and intermediate layers formed from anions and water molecules with the solid solution of divalent cation ( M 2+) and trivalent cation (M 3+) being formed in the range of 0.6<x/(x + y) < 0.9. The anions of CI-, NO3 and ClOg are easily substituted by CO 2-. A large part of the NO~ makes a monodentate-type bond and the ClOg a bridge-type bond.
I N T R O D U C T I O N
A series of hydrotalcite-like compounds, which are expressed by the following general formula, was re- ported previously (Brown and Gastuche, 1967, All- mann, 1970, Miyata and Kumura, 1973): M2+M 3 +(OH)gx+ 3r_ nz(A"-)z'mHgO, where M 2+ and M 3+ are divalent and trivalent cations, respectively, and A"- are n valent anions.
Since the synthesized hydrotalcites are utilized as acid adsorbents and catalyst carriers in industry, the hydrotalcite-like compounds also are expected to be similarly utilized. This detailed study may promise new application of the compounds as a gas adsorbent or as a catalyst.
In the present paper, the syntheses of the com- pounds containing various monovalent inorganic anions and their structrues and physico-chemical properties are reported.
ture being kept at about 10. The precipitate obtained was filtered, washed with water and dried at 70~ for 15 hr. In the preparation of sample F, ammonia gas was used instead of sodium hydroxide, the other procedure being the same as above.
Samples of G,H,I,J and K were prepared by a dif- ferent procedure. About 500 ml of water was put into a 2.5 liter stainless steel reaction vessel and kept at 25~ by operating a chemi-stirrer. Then, the mixture (A1 a+ = 0.25 mol/1, Mg 2+ = 0.75 mol/1) of aluminum chloride (I,J,K), nitrate (H) or perchlorate (G), magne- sium chloride (I,J,K), nitrate (H) or perchlorate (G) and aqueous solution (2 mol/1) of sodium hydrocide were added continuously at the total supply rate of about 80 ml/min by using a feeder, the pH of the reaction mixture being maintained at 10.0-10.2 during the reaction. The precipitate treatment was the same as above. All water was decarbonated and deionized before use.
EXPERIMENTAL
Preparation of compounds
Samples A,B,C,D and E were prepared as follows. About 200 ml of decarbonated and deionized water was put into a 1 liter four neck round flask filled by nitrogen gas and stirred at about 25~ with a mag- netic stirrer. The mixture (A13 + = 0.25 mol/1, Mg 2 + = 0.75 mol/1) of decarbonated aluminum chlor- ide (B,C,D,E,F) or nitrate (A,H), magnesium chloride (B,C,D,E,F) or nitrate (A,H) solution and aqueous solution (2 mol/1) of sodium hydroxide were added dropwise from a burette, the pH of the reaction mix-
C.C.M. 23/5 c
Electron microscopy
Electron micrographs of the samples suspended m ethanol and dispersed supersonically for 5 min were taken by the transmission method with a Nihon Den- shi JEM-T7S type electron microscope. Accelerating voltage was 60 kV and magnification 20000 x.
Chemical analysis
The amount of A1, Mg Ni, and Zn were determined by the chelate titrations of the samples dissolved in dilute hydrochloric acid. The C1- and ClOg was de- termined by back-titrating the sample solution with
369

370 SHIGEO MIYATA
Table 1. Chemical analysis and atomic ratio
Sample No. A120 3
Wt ~o Ig Water
M2+O CO 2 A- loss content*
Atomic ratio
* ++
A;Mg A1-NO 3 15A B ;Mg-A~C1 30.7 C;Mg-A~CI 20.3 D;Mg~A1-CI t7.2 E ;Mg-A~C1 13.7 F;Mg-A~C1 16.5 G ;Mg-A1-C10 4 13.9 H ;Mg~AI-NO 3 15.9 I ;M~A1-C1 17.3 J ;Ni-A~C1 12.2 K ;Zn-A~C1 11.3
34.9 0.87 15.5 48.9 7,99 2.87 0,830 0.960 26.8 2.05 8.12 41.5 8.54 1.11 0.380 0.535 32.8 1.30 11.3 46.3 10.3 2.05 0.805 0,955 37.6 0.46 11.4 43,9 7.00 2.78 0.954 0,964 41.8 0.73 9.20 44.3 6.92 3.86 0.965 1.09 39.7 1.07 10.4 43.8 6.27 3.00 0.905 1.06 33.5 0.89 19.8 51.4 6.12 3.06 0.730 0.880 37.6 1.26 16.4 45.6 6.09 2.99 0.848 1.03 39.2 1.95 9.23 44.1 5.93 2.86 0.765 1.03 51.2 1.20 7.30 36.0 8.04 2.88 0.865 1.10 54.9 0.92 9.40 34.1 6.14 3.04 1.20 1.39
* Weight loss during heating at 105~ for 3 hr M2+/M 3+
~A-/M 3+ w + 2CO~-)/M 3+ (total anion).
a 0.1 mol/l solution of ammonium thiocyanate with ammonium ferric sulfate as an indicator. The sample solution was made by dissolving the sample into nitrous acid, adding an excess of silver nitrate and diluted nitric acid while warming the solution. The amount of NO3 was measured by reducing NO;- of the sample with a mixture of a sodium hydroxide solution and Debalda alloy to form NHa and back-ti- trating the excess of sulfuric acid, which absorbed NH3, with an aqueous sodium hydroxide. The amount of CO 2- was determined by a AGK car- bonate salt measurement method.
X-ray powder diffraction, i.r. absorption and thermal analysis
The powder pattern of each sample was obtained with a Phillips X-ray diffractometer using filtered Cu- K~ radiation. The i.r. absorption spectra of the sample in the form of a KBr tablet were recorded for 400-4000 cm-1 with an Hitachi EPI-G3 i.r. spec- trophotometer. The DTA and TGA diagrams were recorded for 200-350 mg samples with a Rigaku Denki DG-CIH unit at a heating-rate of 5~
Surface area and surface acidity-basicity
Surface area were measured by the BET method with nitrogen gas. The samples dried at 70~ were evacuated at room temperature for l hr. Other samples were calcined in air at 200~ for 1 hr and then evacuated at 150~ for 1 hr before measurement.
Acidity and basicity were measured by titration with n-butylamine and benzoic acid using a series of
Table 2. Relation between atomic ratio ( M 3 + / I M z+ - M 3 + ) I and total anion ((A- 7- 2CO2-)/(M 2~ 7- M3+/}
Sample No. B C D E
IC1- - 2CO~ )/ IM 2+ M s+) 0.213 0.314 0.278 0.216
M 3 +/(M 2 + - M 3 "I 0.474 0.340 0.265 0.205
Hammett and nitroaniline indicators as previously re- ported (Miyata et al., 1971).
RESULTS AND DISCUSSION
Electron micrographs
The samples are poorly dispersed, thin leaf-like ag- gregates analogous to synthesized hydrotalcite.
Chemical analysis
The results of chemical analysis are shown in Table 1. The ratio, (A- + 2CO~-)/M 3+, of the total anions to aluminum ions at M2+/M 3+ --- 3, is almost unity except for samples J and K. The value is in agreement with that of synthesized hydrotalcite (Miyata et al., 1971). The larger values of samples J and K are considered to be due to the mixing of a small amount of carbonate because the logarithmic values of the solubility products of NiCO3 and ZnCO3 are less than half that of MgCO3. The per- centage of monovalent anion for total anions was about 90~ under the flow of nitrogen gas and about 70% when exposed to air. Therefore, the monovalent anion is considered to be the main anion and to oc- cupy the same lattice point as that of carbonate ion. It is also thought that the reactivity of the carbonate ion is stronger than that of the monovalent anion.
In the Mge+-A13+ CI- system the anion content increases with the increase of the aluminum ion con- tent except for sample B. The ratio of (A- + 2CO32-)/ M a+ should be unity if one assumes that the posi- tively charged compound, [Mg 1 _,Alx(OH2] x+, is formed by substituting the aluminum ion for the mag- nesium 1on of the brucite-like layer. The anion exist- ing between the layers has the charge of x in order to maintain electrical neutrality. As shown in Table 2, the observed values verify the validity of this assump- tion. The deviation observed for sample B is probably due to the fact that the ratio of Mg/+/A13+ exceeds the limit of substitution of Mg 2+ by A13 § (the limit

Fig. 1. X-ray powder diffraction for sample F.
Fig. 7. Structural model of new hydrotalcite-like compounds.
CCM--f,p. 370

Hydrotalcite-like compounds and their structures 371
Table 3. Indexing of powder paltern of the compound in Table 4. The cell dimensions (ao, Co) for samples A, G, the sample F with ao = 3.07, co = 23.90 or 15.93 A J and K
1 2 3 4 Cell dimensions (A) d obs. d calc. hkl hkl
20.5 A 23.9 A 001 11.5 11.9 002 7.97 7.97 003 002 3.976 3.983 006 004 2.650 2.656 100, 009 100, 006
2.619 101 2.609 2.592 102 2.292 2.321 105 2.021 1.991 00, 12 008 1.988 1.985 108 1.533 1..533 110 It0
1.530 111 1.505 1.505 113 112 1.431 1.431 116 114 1.317 1.319 202 1.277 1.279 205
1 Observed reflections. 2~Calculated spacings for hexagonal cells with
a = 3.07, c = 23.90 and 15.93 A. 3 and 4--Indices for reflections from cells with a = 3.07
and c = 23.90 and 15,93 A. respectively.
is Mg2+/A13+ = 1.5 for synthesized hydrotalcite). This is explained by the fact that bayerite forms as a byproduct according to X-ray diffraction analysis.
X - r a y powder diffraction
According to observations with X-ray diffraction and optical microscopy every sample consists of spherical aggregates labout 10-50#m) which are formed by strong coagulation of microcrystallites (order of magnitude: 100 AI. The powder pattern ob- served for sample F (Mg2+-A13+-CI-I is shown in Fig. 1. The other s ample s showed the analogous patterns to that shown in Fig. 1. The pattern for every sample, which consis.ts of sharp and symmetrical peaks and some asymmetrical peaks at high angle of 30~ is characteristic of clay minerals having a layer structure and very similar to the pattern of hyd- rOtalcite. In order to verify this. the indexing was done as follows, Because the highest peak of d - 8 A corresponds to the pile of three oxygen sheets and is considered to be a unit layer, the cell dimension C O was assumed to be an intergral multiple of the layer thickness. The cell dimension a o should be almost the same as that of brucite, d = 1.55 A was assumed to be 1110). The indexing was done by assum- ing a hexagonal cell of the cell dimensions ao • 3.10 A and Co ~ n x 8 A In ~ integer). The result is shown in Tables 3 and 4. When n is 2. all the reflections can be fairly well interpreted, but the reflection corre- sponding to (001) is not observed and the indexing of the weak reflections of d = 11.5 A and 20.5 A can- not be made. If one assumes n = 3, the indexing can be made almost satisfactorily for all the observed re- flections.
Natural minerals are known which show a similar X-ray diffraction pattern, manasseite (a0 = 3.06 h.
C O C o
(Rhombohedral) (Hexagonal) Sample No. a o n = 3 n = 2
A 3.06 A 25.02 A 16.68 A G 3.06 27.45 t8.30 J 3.04 23.73 15.82 K 3.09 23.50 15.67
Co = 2 x 7.67 ]~) and hydrotalcite (ao = 3.06 A, co = 3 x 7.67 A), whose compositions are Mg6A12(OH)I 6 �9 CO3-4H~O, resp. The difference between their struc- tures is caused only by the difference in the stacking of the unit layers. The structures of samples A - K are considered to be a repeated pile of the ABCABC type (rhombohedral system), in which a repeated pile of the ABAB type (hexagonal system) is partly included. A structral analysis of pyroaurite, Mg6Fez(OH)16CO 3 �9 4H20, of the hydrotalcite type, was made by All- mann e~ al. 11968/,
The relation of the Miller index to the reflection intensity and the symmetry for all samples, [003k (006), (ll01, and (1131 is shar p and symmetric while (1021, (105), and (108) is broad and asymmetric.
The integral breadth of the [006) plane is given in Table 5. Because the integral breadth of synthesized hydrotalcite is 0.67 ~ at the atomic ratio of Mg2 + :A13+ = 3 and the crystallite size is estimated to be 146 A according to Sherrer's equation, the crys- tallite size should decrease in the order of Zn-A1-C1
Mg-A1C1 Mg-A1-CIO 4 M g - A 1 N O 3 Ni-A1-CI. A comparison of sample D with F of the same
composition reveals that the use of ammonia in the preparation of the compounds gives a better result. For the samples B-E with the same anion and differ- ent ratios of Mg a+/AP +. a linear relation was ob- tained between the doo3 and the ratios of Mg2+/ (Mg z + - A13 + I in the range of 0.6 < Mg 2 +/(Mg 2 + • A13 +1 < 0.9. namely, Vergard's law holds. This indi- cates the substitution of Mg z+ in brucite layer by A13 +.
Table 5. X-ray diffraction line broadening of (006) plane
The integral breadth of [006) Sample No. reflection (degreel
A 2.17~ B 1,20 C 0.76 D 0.86 E 0.58 F 0.37 G 1.24 H 1.40 I 0.85 J 1.86 K 0.37
372 SHIGEO MIYATA
The lattice constant c o increases in the order of sample D > A > G and the anion size C I - > NO3 > ClOg. In order to survey the relation in more detail, the thickness of the intermediate layer was calculated by subtracting the thickness (4.769 A) of the brucite layer (Nihonkagakukai, 1966) from the thickness (dooa) of the unit layer. The calculated values, which are 3.36, 3.57 and 4.38 A for D, A, and
1
C3
I O0 200 400
Temperoture, *C
600
I I I I C
- - - ~ A , f OJ , j / /
1 0 % / 1 t ~ . . . . . . J
/
i iii
t - ~ - - - ~ - " I I I I00 200 4OO 60O
Ternperot ure, ~
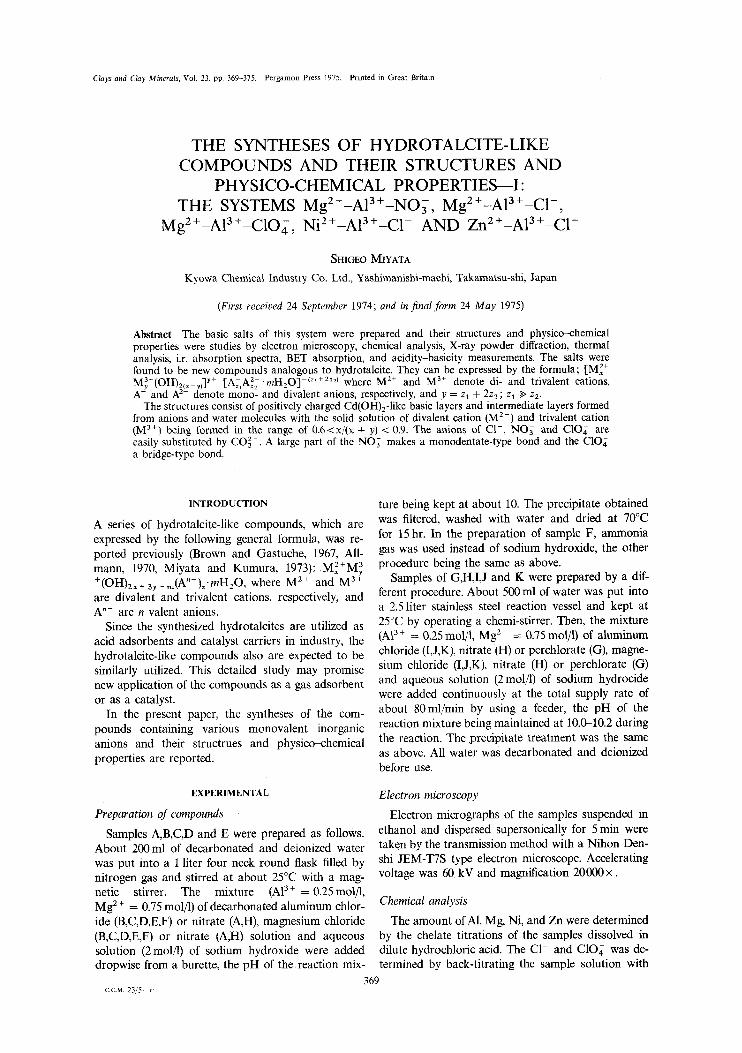
Fig. 2. (a) D.T.A. and T.G.A. curves for samples A, G, J and K. (b) D.T.A. and T.G.A. curves for samples C, F
and E.
G, respectively, agree with the respective anion dia- meters, 3.62, 3.78 and 4.72 A (Wyckoff, 1963).
Thermal analysis
The DTA and TGA diagrams are shown in Fig. 2. Two peaks of heat absorption were observed around 200 and 300-500~ for every sample, the correspond- ing two stages of weight decrease being also observed (Rouxhet and Taylor, 1959). In order to examine the first peak of heat absorption, sample 1 was heat- treated in air at 200, 300 and 400~ for i hr and coated with polystyrene to protect moisture from entering (Miyata et al., 1971) and then its X-ray dif- fraction pattern was observed. The similar pattern to that of the untreated sample, the pattern whose dif- fraction intensity was weakened with a little change of d, and the almost amorphous pattern were ob- served for the samples heat-treated at 200, 300 and 400~ respectively. The samples heat-treated at 200 and 300~ which were allowed to stand in air for 48 hr without coating with polystyrene showed the same pattern as that of the untreated samples. These results indicate that the first heat absorption is due to the loss of interlayer water molecules as in the case of hydrotalcite and the second is due to the dehydroxylation and the elimination of anions giving rise to the destruction of the layer structurs.
The amount of interlayer water was determined by subtracting the weight loss of the sample when dried at 105~ for 3 hr, which is regarded as the amount of adsorbed water, from the first weight decrease on the TGA curve. The amount of OH- was obtained by subtracting the first weight decrease and the amount of the ignition weight loss. The contents of NO3, CI-, and ClO2 were calculated from the for- mulae of 2NO3-O, 2C1-O, and 2C104-O, respectively, which correspond to the amount of each anion loss when the compounds were decomposed. Table 6 shows the chemical composition and charge. The rea- son why carbonate ions are contained in the samples is partly due to the insufficient decarbonation of aqueous solution of sodium hydroxide. The reason that the total number of cations ranges from 6 to 10 is dueto the fact that hydrotalcite-l!ke compounds, in which Mg 2+ is substituted by AI 3 +, with the ratio of Mg2+/Ala+ ~ 2-10 are formed (Miyata et al., 1971). The ratio of the positive charge of the basic layer to that of the aluminimum ion is almost unity for all samples except sample K. Thus, the positive charge of the basic layer is determined by the amount of substituted aluminum ion. Because the negative charge of the intermediate layer is almost equal to the positive charge of the basic layer, the anions act to neutralize the positive charge. The existence of the interlayer water is due to the positive charge of the basic layer and, therefore, ammonia, etc. other than water are also able to enter the interlayer.
For the compounds of Zn e+, besides Zn(OH)2 of coordination number--4, these are /~-Zn(OH)C1 (Wyckoff, 1973) and Zn~ (OH)8 C12 (A.S.T.M., 1967) of

Hydrotalcite-like compounds and their structures
Table 6. Chemical composition and charge
373
Sample Basic layer Interlayer
A composition fMgs.74A12(OH)15.4o] [(NO3)1.66(CO3)o.13 2.15 H20 ] charge + 2.08 - 1.92
C composition [Mg4.09A12(OH)12.21] [C11.61(CO3)0.15 1.17 H20 ] charge + 1.97 - 1.91
E composition [MgT.72A12(OH)lg.39] [Cll.93(CO3)0.1z 2.73 HzO ] charge + 2.05 - 2.17
F composition [Mg6.00A12(OH)15.75] [Cl1.s1(CO3)o.1s 2.10 H20 ] charge + 2.25 - 2.11
G composition [Mg6.12Alz(OH)16.23] [(C104)1.46(CO3)0.15 3.72 HzO ] charge + 2.01 - 1.76
J composition [ N i s . v s A l z ( O H ) l s . 4 o ] [Cll.73(CO3)o.23 1.99 H20 ] charge + 2.10 - 2.19
K composition [Zn6:osAlz(OH)ls.~o] [Clz.39(CO3)0.19 2.18 H20 ] charge + 2.65 - 2.77
K' composition [Zn6.08Alz(OH)ls.50Clo.71 ] [Cll.68(CO3)o.19 2.18 H20 ] charge + 1.94 - 1.94
coordination number = 6, From this fact and the re- sult of DTA described below, it seems more valid to rewrite the composition of sample K to K' in Table 6.
Because there is a space corresponding to the oxygen ions whose number is the same as the sum of M 2+ and M 3+, the amount of interlayer water can be determined by subtracting the space occupied by an anion of the intermediate layer from the space of the oxygen ion (Allmann, 1970). Assuming that the size of NO3, CO~- or C1- corresponds to that of 3 oxygen ions, the amount of the interlayer water is calculated to be 6.00 + 2.00 - (0.15 x 3 + 1.81 x 3) = 2.12 for sample F of a comparatively large crys- tal. The calculated values for other samples are shown in Table 7. For sample A, if the size of NO3 is approx, that of three oxygens, the result supports the validity of the assumption. The calculated values for samples E, F, and J containing C1- are almost equal to the observed values. However, it is noted that the ratio of the observed value to the calculated one becomes large with an increase of substituted A13+. In particular, the observed value is apparently larger than the calculated one for sample C. This is probably caused by the increase in positive charge on the basic layer with increasing substituted A13 +. In sample G, the observed value was about two times as large as the calculated one. This is probably due to the exist- ence of water of a bimolecular layer, since d003 is about 1.8 A larger compared to sample F and the
Table 7. Calculation of interlayer water content
Sample Interlayer water content (H20/AI2Oa)
A 2.37 (molar ratio) C 0.81 E 3.11 F 2.16 G 1.87 J 1.87 K 0.34 K' 2.47
first heat absorption in the DTA curve is divided into two peaks at 190 and 225~ In sample K, the ob- served value was about 6 times larger than the calcu- lated one. However, the result is valid for the compo- sition of sample K'. From the above argument, it can be said that the calculated values are in fairly good agreement with the observed ones.
The DTA curve observed for sample A was similar to that for hydrotalcite, since the structure of NO~ is the same as that of CO~-. For the samples other than G, the first peak areas were smaller than that of hydrotalcite. Two peaks at 190 and 225~ observed for sample G indicate the existence of two kinds of interlayer water as mentioned before. The decomposi- tion temperature of Ni(OH)2 is 230~ (Kagakudai- ziten, 1967), but that of sample J is 300~ as shown in Fig. 2(a), indicating that the latter is the more stable. The desorption temperature of interlayer water in sample J as well as sample K was lower than that of other samples. In the case of sample K, the peak at 170~ is thought to be due to the desorption of the interlayer water. On the analogy of the results for samples C, E and F as described below, the peaks at 208, 280 and 583~ are considered to be due to the eliminations of OH- and Cl- in the basic layer and C1- in the intermediate layer, respectively. The fact that the decomposition temperature of Zn(OH)a is 125~ (Kagakudaiziten, 1967) and O H - in the ba- sic layer of sample K is more stabilized supports the above view.
In the case of samples C,E,F which have different ratios of Mg 2+ :A13+, the second heat absorption peak is split into three or four peaks. The first peak of the second heat absorption shifts gradually to higher temperature (400430~ with a decrease of the ratio of Mg 2* :A13+ and the ratio of the area of the other peaks (470-480~ to the area of the-first peak decreases in the order of sample C > F > E. This corresponds to a tendency of the increase in the ratio of C1- : OH- . The amount of C1- was found to de- crease rapidly when sample F was heat-treated in air above 450~ for 1 hr. Hence, the first and the other
374 SHIGEO M1YATA
peaks of the second heat absorption are considered to be caused by the elimination of OH- in the basic layer and CI-, respectively.
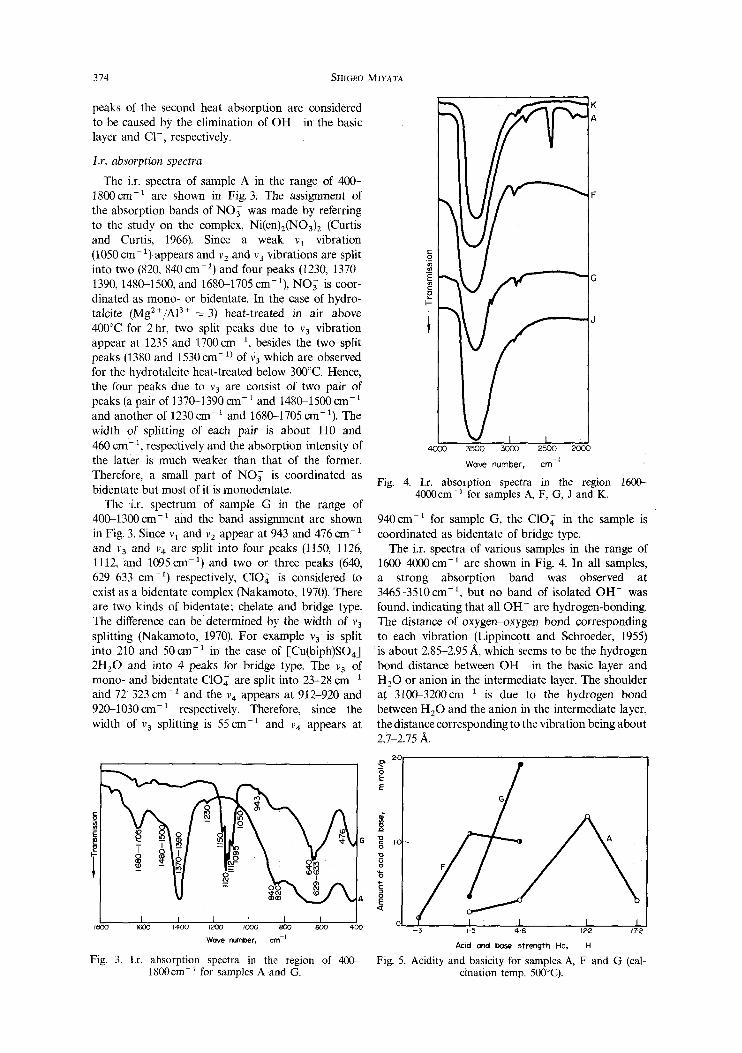
1.r. absorption spectra
The i.r. spectra of sample A in the range of 400- 1800cm -1 are shown in Fig. 3. The assignment of the absorption bands of NO3 was made by referring to the study on the complex, Ni(en)z(NO3)2 (Curtis and Curtis, 1966). Since a weak vl vibration (1050 cm- 1) appears and v2 and v3 vibrations are split into two (820, 840 cm -1) and four peaks (1230, 1370- 1390, 1480-1500, and 1680-1705 cm- 1), NO~- is coor- dinated as mono- or bidentate. In the case of hydro- talcite (MgZ+/A13+ = 3) heat-treated in air above 400~ for 2hr, two split peaks due to v 3 vibration appear at 1235 and 1700 cm-1, besides the two split peaks (1380 and 1530 cm- 1) of V a which are observed for the hydrotalcite heat-treated below 300~ Hence, the four peaks due to v3 are consist of two pair of peaks (a pair of 1370-1390 cm- 1 and 1480-1500 era- 1 and another of 1230 cm- I and 1680-1705 cm- 1). The width of splitting of each pair is about 110 and 460 cm- 1, respectively and the absorption intensity of the latter is much weaker than that of the former. Therefore, a small part of NO3 is coordinated as bidentate but most of it is monodentate.
The i.r. spectrum of sample G in the range of 400-1300 cm-1 and the band assignment are shown in Fig. 3. Since Va and v2 appear at 943 and 476 crn- 1 and v 3 and v4 are split into four peaks (1150, 1126, 1112, and 1095cm -1) and two or three peaks (640, 629-633 cm -1) respectively, CIOg is considered to exist as a bidentate complex (Nakamoto, 1970). There are two kinds of bidentate; chelate and bridge type. The difference can be determined by the width of v3 splitting (Nakamoto, 1970). For example v 3 is split into 210 and 50 cm -1 in the case of [Cu(biph)SO4] 2H20 and into 4 peaks for bridge type. The v3 of mono- and bidentate ClOg are split into 23-28 cm- 1 and 7~323 cm -1 and the v4 appears at 912-920 and 920-1030cm -1 respectively. Therefore, since the width of v 3 splitting is 55 cm 1 and v4 appears at
T i _ G
I I I I I I 1800 ((~00 1400 ILK)O I000 8 0 0 G00
Wove number, cm -I
Fig. 3. I.r. absorption spectra in the region of 400- 1800cm i for samples A and O.
g
E
4030 3500 5000 2500 2000
Wave number, cm - I
Fig. 4. I.r. absorption spectra in the region 1600- 4000 cm-~ for samples A, F, G, J and K.
940 cm-1 for sample G, the C104 in the sample is coordinated as bidentate of bridge type.
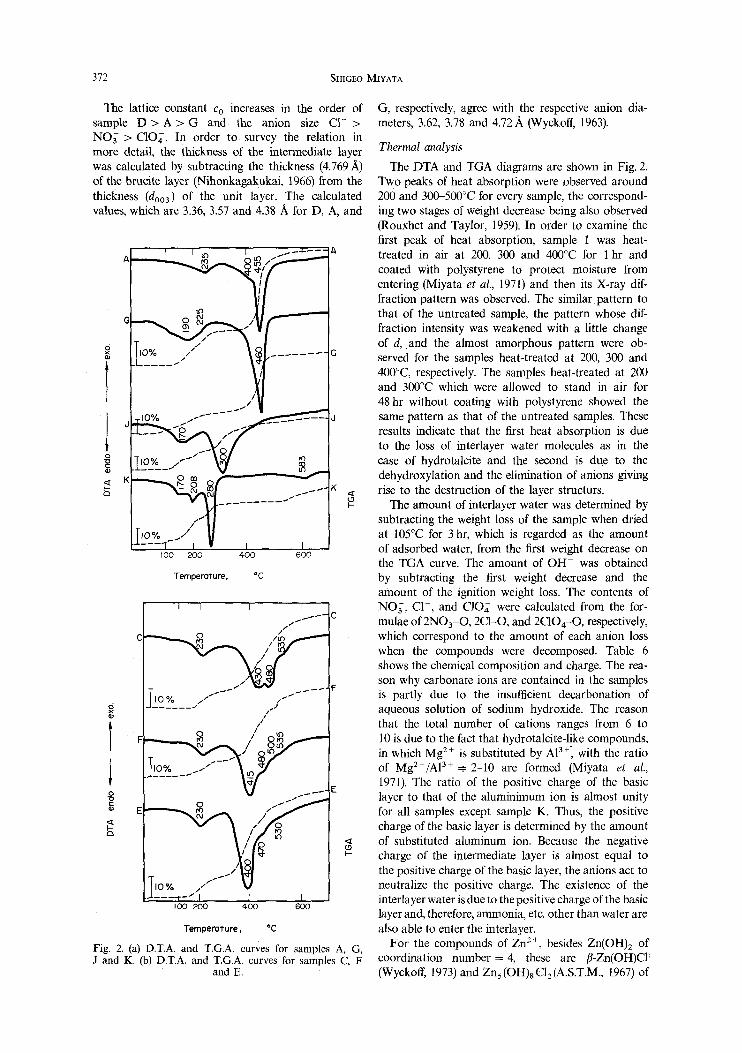
The i.r. spectra of various samples in the range of 16(g)-4000cm -1 are shown in Fig. 4. In all samples, a strong absorption band was observed at 3465-3510 crn-1, but no band of isolated O H - was found, indicating that all OH- are hydrogen-bonding. The distance of oxygen-oxygen bond corresponding to each vibration (Lippincott and Schroeder, 1955)
'is about 2.85-2.95 A, which seems to be the hydrogen bond distance between O H - in the basic layer and H20 or anion in the intermediate layer. The shoulder at 3100-3200cm -1 is due to the hydrogen bond between H20 and the anion in the intermediate layer, the distance corresponding to the vibration being about 2.7-2.75 A.
G
~ I
~ o I I -3 (-5 4.B r2.2 I?-2
Acid and base strength Ho, H
Fig. 5. Acidity and basicity for samples A, F and G (cal- cination temp. 500~

Hydrotalcite-like compounds and their structures 375
2(30
15C
toc
F- W m
5(
0 500 600 700
Calcination temp., ~
Fig. 6. BET surface area at different calcination tempera- ture for samples A, F and G.
Acidic and basic property
Figure 5 shows the acidic and basic property of samples A, F, and G calcined in air at 500~ for 1 hr. Sample A showed this property to be similar to hydrotalcite. The fact that samples F or G contain- ing CI- or C102 did not show any basic property is probably caused by the poisoning of the basic sites with C1- or C102 which is more acidic than NO3 or CO 2-.
Specific surface area
Figure 6 shows the specific surface area of samples A, F and G calcined in air at 400-700~ for 1 hr. The surface area of sample A and its change with calcination temperature were almost the same as those of synthesized hydrotalcite. The maximum value was observed at the temperature of structure destruction without much sintering at 400-600~ The crystal phase in the temperature range is only MgO, and MgA120 4 is newly formed at about 900~ ac-
cording to X-ray diffraction. Therefore, the substi- tuted A13 + is considered to control the growth of the MgO crystal.
Structural model of new hydrotalcite-like compounds
On the basis of these results and discussion, the structure is considered to consist of a positively charged basic layer 2 + 3 + y+ [Mx My (OH)2(x + y)] and an intermediate layer of anions and water molecules, shown schematically in Fig. 7. The hydroxyl group of the basic layer is hydrogen-bonded with water or anion of the intermediate layer and the interlayer water is hydrogen-bonded with the interlayer anion.
REFERENCES
Allmann, R. (1968) The crystal structure of pyroaurite: Ac- ta Cryst. 24, 972.
Allmann, K, (1970) Doppelschichtstrukturen mit bru- cit~ihnlichen schichtionen: Chemia 24, 99.
A.S.T.M. (1967) Powder diffraction file, Inorg., A.S.T.M., Philadelphia, U.S.A., 226, 530.
Brown, G. and Gastuche, M. C. (1967) Structure and struc- tural chemistry of synthetic hydroxycarbonates and re- lated minerals and compounds--II: Clay Minerals 7, 193.
Curtis N. F. and Curtis Y. M. (1966) Some nitrate-amine nickel(II) compounds with monodentate and bidentate nitrate ions: Inorg. Chem. 5, 383.
Kagakudaiziten Editorial Committee (1967) Kagakudai- ziten 5, Kyoritsu, Tokyo, Japan, 18 33.
Kobo, B., Miyata, S., Kumura, T., and Shimada, T. (1969) Physical and chemical characteristics and antacid activi- ties of synthetic hydrotalcite: Yakuzaigaku 29, 215.
Lippincott, E. R. and Schroeder, R. (1955) One-dimen- sional model of the hydrogen bond: J. Chem. Phys. 23, 1099.
Miyata, S. and Kumura, T. (1973) Syntheses of new hydro- talcite-like compounds and their physico-chemical properties: Chem. Lett. p. 843.
Miyata, S., Kumura, T., Hattori, H. and Tanabe, K. (1971) Physico-chemical properties and structure of magnesia- alumina: Nippon Kagaku Zasshi 92, 514.
Nakamoto, K. (1970) I.r. Spectra Inorganic and Coordina- tion Compounds. Wiley, New York, pp. 171, 175, 176.
Nipponkagakukai (1966) Kagakubinran, Kisohen, 2, Mar- uzen, Tokyo, Japan 1265.
Rouxhet, P. C. and Taylor, H. F. W. (1959) Thermal de- composition of sj6grenite and pyroaurite: Chemia 23, 480.
Wyckoff, R. W. G. (1963) Crystal Structure, Vol. 1. Wiley, New York, p. 282.