the structure of retail in canada · the structure of retail in canada statistical appendix . 2...
TRANSCRIPT
1
THE STRUCTURE OF RETAIL IN CANADA
STATISTICAL APPENDIX

2
Table 1 Annual Retail Summary for Canada ........................................................................................... 1
Table 2 Regional Retail Trade ................................................................................................................. 2
Table 3 Retail Industry GDP ................................................................................................................... 3
Table 4 Key Retail Concepts for Canada - 20111 .................................................................................... 4
Table 5 Gross Margin Rates for Canada .................................................................................................. 5
Table 6 Profit Rates for Canada .............................................................................................................. 6
Table 7 Cost of Goods Sold - Canada ...................................................................................................... 7
Table 8 Operating Expenses - Canada ..................................................................................................... 8
Table 9 Opening Inventory For Canada .................................................................................................. 9
Table 10 Closing Inventory - Canada ..................................................................................................... 10
Table 11 Operating Revenue - Canada ................................................................................................. 11
Table 12 Merchandise Turnover - Canada ............................................................................................ 12
Table 13 Stock on Hand - Canada ......................................................................................................... 13
Table 14 Retail Prices and Volumes ...................................................................................................... 13
Table 15 Revenue and Stores by Province ............................................................................................ 14
Table 16 Per Capita Revenue and Store by Province ............................................................................ 14
Table 17 Retail Payroll Summary ......................................................................................................... 15
Table 18 Payroll Employment by Enterprise Size ................................................................................. 15
Table 19 Retail Payroll Employment by Type ....................................................................................... 15
Table 20 Detailed Payroll Employment ................................................................................................. 16
Table 21 Retail Employment by Class of Worker .................................................................................. 17
Table 22 Retail Employment for Canada .............................................................................................. 17
Table 23 Full-Time Retail Employment by Occupation ......................................................................... 17
Table 24 Retail Average Hourly Wages ................................................................................................. 18
Table 25 Real Weekly Wage Distribution over Time ............................................................................ 18
Table 26 Employment by Real Wage Categories .................................................................................. 18
Table 27 Full-Time Retail Employees .................................................................................................... 19
Table 28 Full-time Retail Weekly Wages............................................................................................... 19
Table 29 Full-time Retail Hourly Wages ................................................................................................ 20
Table 30 Part-time Retail Employment ................................................................................................. 20
Table 31 Part-time Retail Weekly Wages .............................................................................................. 21
Table 32 Part-time Retail Hourly Wages ............................................................................................... 21
Table 33 LFS Retail Wage Data for Canada ........................................................................................... 21
Table 34 Tenure of Retail Employees in Months .................................................................................. 22
Table 35 Retail Capital Expenditure ...................................................................................................... 23
Table 36 Retail Capital Expenditure by Type ........................................................................................ 23
Table 37 Provincial Retail Capital Expenditure ..................................................................................... 24
Table 38 Construction of Shopping Centres, Stores ............................................................................. 24
Table 39 Retail Store-Based Location Counts ....................................................................................... 25
Table 40 Retail Locations with Employees by Province ........................................................................ 26
Table 41 Commodity Analysis - Part 1 .................................................................................................. 27
Table 42 Commodity Analysis - Part 2 .................................................................................................. 28
Table 43 Key Retailers of Commodity Groups ...................................................................................... 29
Table 44 Non-store Retail Commodity Sales ........................................................................................ 30
Table 45 Alternative Population Projections ........................................................................................ 31

3
Table 46 Average Income of Households............................................................................................. 31
Table 47 Median Income of Households .............................................................................................. 32
Table 48 Summary After-tax Family Income Measures ........................................................................ 32
Table 49 Average Household Expenditure by Quintile ......................................................................... 33
Table 50 Consumption Relationships 2011........................................................................................... 34
Table 51 Household Consumption Shares ............................................................................................ 34
Table 52 Shares of Consumption 2011 ................................................................................................. 34
Table 53 Average Household Expenditure by Household Type ............................................................ 35
Table 54 Household Consumption Shares by Type .............................................................................. 37
Table 55 Consumption Relationships by Household Type .................................................................... 38
Table 56 Consumption Relationships by Age ........................................................................................ 38
Table 57 Household Consumption Shares by Age ................................................................................ 39
Table 58 Shares of Consumption by Age ............................................................................................. 39
Table 59 Household Structure by Age.................................................................................................. 40
Table 60 Household Characteristics by Income .................................................................................... 41
Table 61 Household Characteristics by Type ....................................................................................... 42
Table 62 Economic Impacts of Retail - Summary .................................................................................. 43
Table 63 GDP and Job Implications of Retail Expenditure ................................................................... 44
1
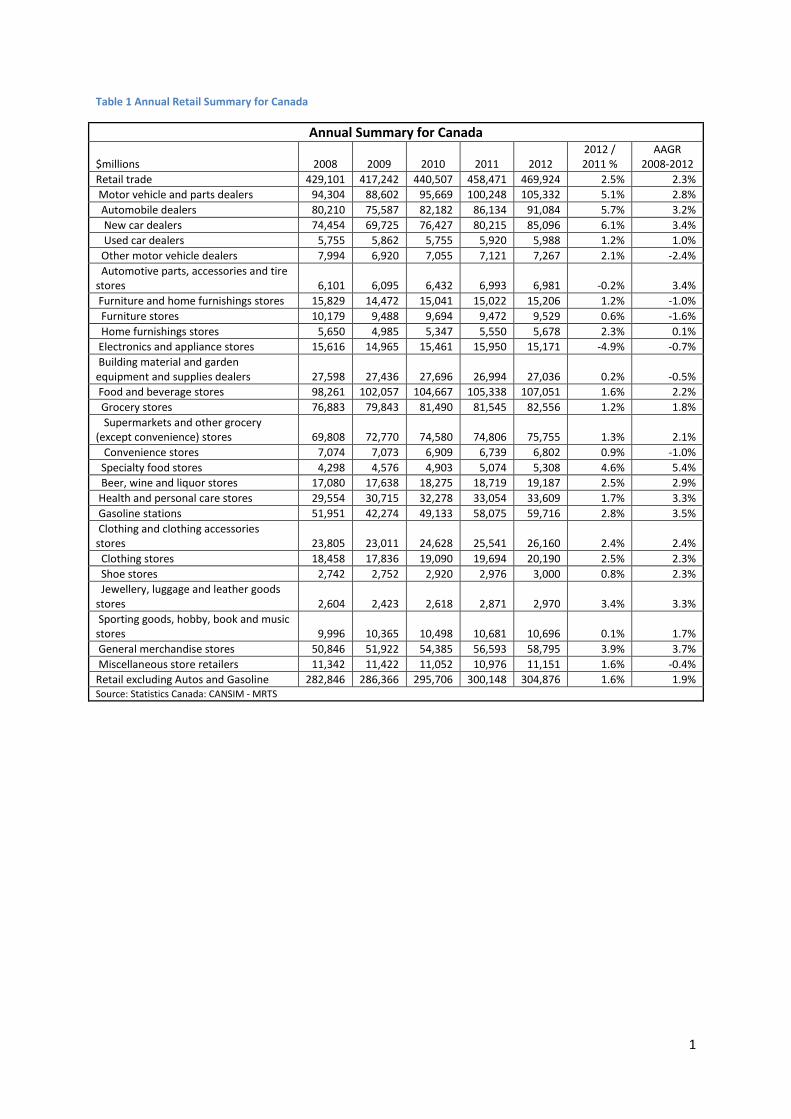
Table 1 Annual Retail Summary for Canada
Annual Summary for Canada
$millions 2008 2009 2010 2011 2012 2012 / 2011 %
AAGR 2008-2012
Retail trade 429,101 417,242 440,507 458,471 469,924 2.5% 2.3%
Motor vehicle and parts dealers 94,304 88,602 95,669 100,248 105,332 5.1% 2.8%
Automobile dealers 80,210 75,587 82,182 86,134 91,084 5.7% 3.2%
New car dealers 74,454 69,725 76,427 80,215 85,096 6.1% 3.4%
Used car dealers 5,755 5,862 5,755 5,920 5,988 1.2% 1.0%
Other motor vehicle dealers 7,994 6,920 7,055 7,121 7,267 2.1% -2.4%
Automotive parts, accessories and tire stores 6,101 6,095 6,432 6,993 6,981 -0.2% 3.4%
Furniture and home furnishings stores 15,829 14,472 15,041 15,022 15,206 1.2% -1.0%
Furniture stores 10,179 9,488 9,694 9,472 9,529 0.6% -1.6%
Home furnishings stores 5,650 4,985 5,347 5,550 5,678 2.3% 0.1%
Electronics and appliance stores 15,616 14,965 15,461 15,950 15,171 -4.9% -0.7%
Building material and garden equipment and supplies dealers 27,598 27,436 27,696 26,994 27,036 0.2% -0.5%
Food and beverage stores 98,261 102,057 104,667 105,338 107,051 1.6% 2.2%
Grocery stores 76,883 79,843 81,490 81,545 82,556 1.2% 1.8%
Supermarkets and other grocery (except convenience) stores 69,808 72,770 74,580 74,806 75,755 1.3% 2.1%
Convenience stores 7,074 7,073 6,909 6,739 6,802 0.9% -1.0%
Specialty food stores 4,298 4,576 4,903 5,074 5,308 4.6% 5.4%
Beer, wine and liquor stores 17,080 17,638 18,275 18,719 19,187 2.5% 2.9%
Health and personal care stores 29,554 30,715 32,278 33,054 33,609 1.7% 3.3%
Gasoline stations 51,951 42,274 49,133 58,075 59,716 2.8% 3.5%
Clothing and clothing accessories stores 23,805 23,011 24,628 25,541 26,160 2.4% 2.4%
Clothing stores 18,458 17,836 19,090 19,694 20,190 2.5% 2.3%
Shoe stores 2,742 2,752 2,920 2,976 3,000 0.8% 2.3%
Jewellery, luggage and leather goods stores 2,604 2,423 2,618 2,871 2,970 3.4% 3.3%
Sporting goods, hobby, book and music stores 9,996 10,365 10,498 10,681 10,696 0.1% 1.7%
General merchandise stores 50,846 51,922 54,385 56,593 58,795 3.9% 3.7%
Miscellaneous store retailers 11,342 11,422 11,052 10,976 11,151 1.6% -0.4%
Retail excluding Autos and Gasoline 282,846 286,366 295,706 300,148 304,876 1.6% 1.9% Source: Statistics Canada: CANSIM - MRTS

2
Table 2 Regional Retail Trade
Regional Retail Trade
$millions 2008 2009 2010 2011 2012 2012 / 2011 %
AAGR 2008-2012
Canada 429,101 417,242 440,507 458,471 469,924 2.5% 2.3%
Newfoundland and Labrador 7,019 7,124 7,446 7,841 8,200 4.6% 4.0%
Prince Edward Island 1,707 1,687 1,777 1,873 1,934 3.2% 3.2%
Nova Scotia 12,121 12,141 12,692 13,146 13,274 1.0% 2.3%
New Brunswick 10,028 10,105 10,608 11,118 11,041 -0.7% 2.4%
Quebec 94,809 93,736 99,551 102,505 103,648 1.1% 2.3%
Montréal, Quebec 41,780 41,843 44,309 45,258 45,993 1.6% 2.4%
Ontario 152,160 148,797 156,904 162,530 165,177 1.6% 2.1%
Toronto, Ontario 61,035 59,627 63,493 67,078 67,574 0.7% 2.6%
Manitoba 15,143 15,127 16,029 16,758 17,018 1.6% 3.0%
Saskatchewan 14,848 14,804 15,336 16,489 17,749 7.6% 4.6%
Alberta 61,668 56,546 59,910 64,005 68,452 6.9% 2.6%
British Columbia 58,010 55,585 58,549 60,405 61,565 1.9% 1.5%
Vancouver, British Columbia 26,167 25,712 26,823 27,691 28,606 3.3% 2.3%
Yukon 536 528 601 654 672 2.8% 5.8%
Northwest Territories 744 737 763 788 826 4.7% 2.6%
Nunavut 309 324 342 360 369 2.5% 4.5% Source: Statistics Canada - CANSIM - MRTS

3
Table 3 Retail Industry GDP
Annual Summary of Retail Industry GDP
$2007 Million 2008 2009 2010 2011 2012 2012 / 2011
AAGR 2008 - 2012
Retail trade 80,434 78,037 80,798 82,361 83,622 1.5% 1.0%
Motor vehicle and parts dealers 13,365 12,451 12,996 13,620 14,160 4.0% 1.5%
Furniture and home furnishings stores 3,949 3,530 3,786 3,864 3,949 2.2% 0.0%
Electronics and appliance stores 3,297 3,563 3,805 4,153 4,110 -1.0% 5.7%
Building material and garden equipment and supplies dealers 5,872 5,305 5,361 5,185 5,073 -2.2% -3.6%
Food and beverage stores 15,984 15,810 16,127 15,978 16,046 0.4% 0.1%
Health and personal care stores 7,579 7,640 7,998 8,037 8,294 3.2% 2.3%
Gasoline stations 4,628 4,361 4,662 4,785 4,776 -0.2% 0.8%
Clothing and clothing accessories stores 7,532 7,361 7,707 8,129 8,390 3.2% 2.7%
Sporting goods, hobby, book and music stores 2,865 2,855 2,955 2,971 3,002 1.1% 1.2%
General merchandise stores 10,348 10,139 10,608 10,871 11,137 2.4% 1.9%
Miscellaneous store retailers 3,192 3,190 3,042 3,054 3,138 2.8% -0.4%
Non-store retailers 1,866 1,931 1,900 1,944 1,791 -7.9% -1.0%
Statistics Canada, CANSIM, 379-0031

4
Table 4 Key Retail Concepts for Canada - 20111
Key Concepts for Canada for 2011
Total operating revenue
Total labour remuneration
Number of stores
Remuneration Per Store
Gross margin
Operating profit
Sales by square
foot
($million) units ($000) % %
Store-Based Retail trade 472,557 51,109 190,100 269 26.9 5.0 432.0
Motor vehicle and parts dealers 104,557 8,599 18,832 457 17.4 2.4 x
Automobile dealers 89,699 6,449 10,044 642 15.3 2.2 x
New car dealers 82,811 6,026 3,965 1,520 15.3 2.2 x
Used car dealers 6,888 423 6,079 70 16.0 2.0 x
Other motor vehicle dealers 7,410 852 3,198 266 23.8 3.1 x
Automotive parts, accessories and tire stores 7,448 1,298 5,590 232 35.6 5.1 377.0
Furniture and home furnishings stores 15,425 2,618 10,579 247 42.4 4.4 245.0
Furniture stores 9,574 1,571 4,183 376 40.2 3.8 238.0
Home furnishings stores 5,851 1,047 6,396 164 45.9 5.4 258.0
Electronics and appliance stores 16,556 2,222 12,270 181 30.3 4.6 767.0
Building material and garden equipment and supplies dealers 28,521 4,453 10,687 417 33.8 5.1 278.0
Food and beverage stores 107,322 11,243 32,150 350 28.0 7.2 672.0
Grocery stores 83,127 8,749 20,771 421 23.6 2.1 617.0
Supermarkets and other grocery (except convenience) stores 75,608 8,210 9,099 902 23.8 1.8 623.0
Convenience stores 7,520 539 11,672 46 21.4 4.3 564.0
Specialty food stores 5,792 1,019 7,383 138 36.9 3.7 599.0
Beer, wine and liquor stores 18,403 1,475 3,996 369 45.2 31.4 1,171.0
Health and personal care stores 35,392 5,216 17,458 299 31.9 3.1 740.0
Gasoline stations 58,067 1,769 15,969 111 13.4 5.0 x
Clothing and clothing accessories stores 26,612 4,911 29,826 165 51.2 7.6 363.0
Clothing stores 20,326 3,774 20,564 184 51.5 7.6 332.0
Shoe stores 3,053 563 3,666 154 50.4 5.4 372.0
Jewellery, luggage and leather goods stores 3,233 574 5,596 103 49.9 9.5 870.0
Sporting goods, hobby, book and music stores 11,179 1,740 11,962 145 38.3 3.7 298.0
General merchandise stores 56,888 6,221 8,626 721 27.5 5.7 363.0
Miscellaneous store retailers 12,039 2,116 21,741 97 43.9 5.9 226.0
Source: Statistics Canada - CANSIM

5
Table 5 Gross Margin Rates for Canada
Gross Margin Rates for Canada
(%) 2001 2005 2009 2010 2011 Store-Based Retail trade 26.2% 25.7% 27.4% 27.3% 26.9%
Motor vehicle and parts dealers 13.6% 14.9% 18.1% 17.1% 17.4%
New car dealers 12.1% 13.1% 15.8% 14.9% 15.3%
Used and recreational motor vehicle and parts dealers 21.5% 23.2% 26.3% 25.2% 25.4%
Used car dealers 16.2% 15.9% 16.0%
Other motor vehicle dealers 25.4% 23.6% 23.8%
Automotive parts, accessories and tire stores 36.6% 35.9% 35.6%
Furniture and home furnishings stores 38.0% 39.3% 41.7% 42.2% 42.4%
Furniture stores 36.7% 39.6% 39.6% 40.5% 40.2%
Home furnishings stores 40.2% 38.9% 45.4% 45.1% 45.9%
Electronics and appliance stores 29.9% 27.8% 29.1% 29.8% 30.3%
Building material and garden equipment and supplies dealers 29.1% 29.4% 32.7% 33.5% 33.8%
Food and beverage stores 27.6% 27.0% 27.5% 28.0% 28.0%
Supermarkets and other grocery (except convenience) stores 25.1% 23.6% 23.9% 24.1% 23.8%
Convenience and specialty food stores 26.8% 24.9% 27.7% 27.4% 28.2%
Convenience stores 22.2% 21.0% 21.4%
Specialty food stores 35.7% 36.0% 36.9%
Beer, wine and liquor stores 40.0% 44.2% 43.5% 45.1% 45.2%
Health and personal care stores 33.4% 29.7% 32.5% 31.7% 31.9%
Gasoline stations 23.8% 18.9% 15.6% 15.0% 13.4%
Clothing and clothing accessories stores 44.8% 48.6% 50.8% 51.6% 51.2%
Clothing stores 51.2% 52.1% 51.5%
Shoe stores 50.0% 50.5% 50.4%
Jewellery, luggage and leather goods stores 49.0% 49.1% 49.9%
Sporting goods, hobby, book and music stores 36.7% 36.8% 37.8% 38.5% 38.3%
General merchandise stores 27.7% 25.8% 26.7% 27.0% 27.5%
Miscellaneous store retailers 42.2% 39.6% 42.6% 44.0% 43.9% Statistics Canada, CANSIM, ARTS

6
Table 6 Profit Rates for Canada
Profit Rates for Canada
(%) 2001 2005 2009 2010 2011 Store-Based Retail trade 6.2% 4.9% 4.9% 5.0% 5.6%
Motor vehicle and parts dealers 2.1% 1.9% 2.3% 2.0% 3.1%
New car dealers 1.9% 1.6% 2.1% 1.7% 2.7%
Used and recreational motor vehicle and parts dealers 3.3% 3.2% 3.2% 3.0% 4.4%
Used car dealers 1.4% 2.0% 2.9%
Other motor vehicle dealers 3.2% 3.1% 3.2%
Automotive parts, accessories and tire stores 4.9% 3.8% 6.8%
Furniture and home furnishings stores 7.7% 6.0% 4.8% 5.6% 5.4%
Furniture stores 7.2% 7.1% 4.4% 5.4% 4.8%
Home furnishings stores 8.5% 4.3% 5.4% 5.9% 6.5%
Electronics and appliance stores 6.9% 4.7% 4.1% 4.1% 5.7%
Building material and garden equipment and supplies dealers 5.1% 5.7% 4.3% 5.5% 5.9%
Food and beverage stores 8.0% 6.8% 6.7% 7.1% 7.3%
Supermarkets and other grocery (except convenience) stores 4.6% 2.7% 2.2% 2.1% 1.9%
Convenience and specialty food stores 5.5% 3.1% 3.6% 3.7% 4.4%
Convenience stores 4.0% 3.6% 3.7%
Specialty food stores 3.1% 3.8% 5.2%
Beer, wine and liquor stores 25.9% 28.3% 28.7% 31.2% 32.0%
Health and personal care stores 8.0% 3.7% 4.1% 3.6% 4.5%
Gasoline stations 10.3% 7.2% 5.3% 5.3% 5.1%
Clothing and clothing accessories stores 5.7% 7.5% 7.9% 8.5% 9.6%
Clothing stores 8.1% 8.8% 9.7%
Shoe stores 5.8% 7.2% 7.6%
Jewellery, luggage and leather goods stores 8.8% 8.2% 10.7%
Sporting goods, hobby, book and music stores 7.0% 5.3% 3.9% 4.0% 3.5%
General merchandise stores 8.3% 4.3% 5.2% 5.3% 6.7%
Miscellaneous store retailers 4.5% 4.3% 4.9% 6.1% 6.3% Statistics Canada, CANSIM, ARTS

7
Table 7 Cost of Goods Sold - Canada
Cost of Goods Sold for Canada
$million 2001 2005 2009 2010 2011 Store-Based Retail trade 238,594 290,360 316,859 329,579 345,227
Motor vehicle and parts dealers 74,446 81,986 76,743 82,365 86,375
New car dealers 63,541 68,515 61,554 66,925 70,147
Used and recreational motor vehicle and parts dealers 10,906 13,471 15,189 15,440 16,228
Used car dealers 5,334 5,483 5,784
Other motor vehicle dealers 5,507 5,672 5,647
Automotive parts, accessories and tire stores 4,348 4,285 4,797
Furniture and home furnishings stores 7,003 9,039 8,715 8,994 8,887
Furniture stores 4,609 5,640 5,705 5,756 5,724
Home furnishings stores 2,394 3,398 3,010 3,238 3,162
Electronics and appliance stores 7,098 9,053 10,668 11,109 11,538
Building material and garden equipment and supplies dealers 11,252 16,729 18,986 18,922 18,878
Food and beverage stores 53,741 65,921 76,629 76,605 77,272
Supermarkets and other grocery (except convenience) stores 38,447 47,625 57,061 57,302 57,621
Convenience and specialty food stores 8,527 10,352 9,941 9,669 9,561
Convenience stores 6,332 6,025 5,907
Specialty food stores 3,609 3,644 3,654
Beer, wine and liquor stores 6,767 7,944 9,627 9,634 10,090
Health and personal care stores 13,568 18,227 22,251 23,532 24,100
Gasoline stations 22,116 32,001 37,695 42,007 50,270
Clothing and clothing accessories stores 10,876 11,378 12,142 12,446 12,995
Clothing stores 9,243 9,371 9,861
Shoe stores 1,421 1,495 1,516
Jewellery, luggage and leather goods stores 1,478 1,579 1,618
Sporting goods, hobby, book and music stores 5,620 6,428 7,306 6,956 6,898
General merchandise stores 26,957 32,731 38,921 39,949 41,264
Miscellaneous store retailers 5,915 6,867 6,803 6,694 6,751 Statistics Canada, CANSIM, ARTS

8
Table 8 Operating Expenses - Canada
Operating Expenses for Canada
$million 2001 2005 2009 2010 2011 Store-Based Retail trade 64,554 81,440 98,476 100,730 100,730
Motor vehicle and parts dealers 9,914 12,577 14,770 14,968 14,968
New car dealers 7,393 9,082 10,013 10,398 10,398
Used and recreational motor vehicle and parts dealers 2,521 3,495 4,757 4,570 4,570
Used car dealers 942 906 906
Other motor vehicle dealers 1,640 1,523 1,523
Automotive parts, accessories and tire stores 2,175 2,142 2,142
Furniture and home furnishings stores 3,422 4,958 5,529 5,703 5,703
Furniture stores 2,152 3,036 3,328 3,393 3,393
Home furnishings stores 1,271 1,922 2,202 2,310 2,310
Electronics and appliance stores 2,337 2,890 3,765 4,080 4,080
Building material and garden equipment and supplies dealers 3,799 5,617 7,997 7,964 7,964
Food and beverage stores 14,561 18,277 22,077 22,167 22,167
Supermarkets and other grocery (except convenience) stores 10,501 13,006 16,245 16,571 16,571
Convenience and specialty food stores 2,481 3,014 3,313 3,165 3,165
Convenience stores 1,483 1,331 1,331
Specialty food stores 1,830 1,834 1,834
Beer, wine and liquor stores 1,579 2,257 2,519 2,431 2,431
Health and personal care stores 5,163 6,740 9,342 9,696 9,696
Gasoline stations 3,937 4,587 4,602 4,834 4,834
Clothing and clothing accessories stores 7,703 9,088 10,588 11,061 11,061
Clothing stores 8,164 8,485 8,485
Shoe stores 1,256 1,306 1,306
Jewellery, luggage and leather goods stores 1,168 1,269 1,269
Sporting goods, hobby, book and music stores 2,641 3,200 3,981 3,895 3,895
General merchandise stores 7,224 9,493 11,363 11,839 11,839
Miscellaneous store retailers 3,854 4,013 4,461 4,524 4,524 Statistics Canada, CANSIM, ARTS

9
Table 9 Opening Inventory For Canada
Opening Inventory for Canada
$million 2001 2005 2009 2010 2011 Store-Based Retail trade 43,513 51,951 57,904 55,213 58,928
Motor vehicle and parts dealers 15,413 18,955 20,420 17,693 19,846
New car dealers 12,568 14,792 14,676 12,402 14,675
Used and recreational motor vehicle and parts dealers 2,845 4,162 5,744 5,291 5,171
Used car dealers 1,122 1,059 1,137
Other motor vehicle dealers 3,146 2,787 2,658
Automotive parts, accessories and tire stores 1,476 1,445 1,375
Furniture and home furnishings stores 1,764 2,394 2,424 2,314 2,515
Furniture stores 1,158 1,465 1,502 1,397 1,496
Home furnishings stores 606 929 922 917 1,020
Electronics and appliance stores 1,582 2,081 1,769 2,237 2,397
Building material and garden equipment and supplies dealers 3,014 3,915 5,166 4,873 5,440
Food and beverage stores 4,664 5,234 6,110 6,328 5,907
Supermarkets and other grocery (except convenience) stores 2,973 3,260 3,858 4,048 3,607
Convenience and specialty food stores 1,113 821 851 750 760
Convenience stores 514 474 465
Specialty food stores 337 276 295
Beer, wine and liquor stores 578 1,153 1,402 1,530 1,540
Health and personal care stores 2,625 3,312 3,940 4,341 4,336
Gasoline stations 1,385 928 993 982 1,286
Clothing and clothing accessories stores 3,476 4,208 4,814 4,814 4,975
Clothing stores 3,091 3,069 3,160
Shoe stores 604 642 708
Jewellery, luggage and leather goods stores 1,119 1,103 1,107
Sporting goods, hobby, book and music stores 2,041 2,527 2,692 2,639 2,787
General merchandise stores 5,622 6,439 7,484 7,345 7,721
Miscellaneous store retailers 1,926 1,958 2,092 1,646 1,717 Statistics Canada, CANSIM, ARTS

10
Table 10 Closing Inventory - Canada
Closing Inventory for Canada
$million 2001 2005 2009 2010 2011 Store-Based Retail trade 43,402 52,703 55,838 57,927 59,944
Motor vehicle and parts dealers 14,524 18,625 18,254 19,458 19,858
New car dealers 11,437 14,300 12,590 14,253 14,627
Used and recreational motor vehicle and parts dealers 3,086 4,326 5,665 5,206 5,231
Used car dealers 1,095 1,079 1,164
Other motor vehicle dealers 2,945 2,773 2,725
Automotive parts, accessories and tire stores 1,626 1,353 1,343
Furniture and home furnishings stores 1,867 2,557 2,324 2,357 2,524
Furniture stores 1,224 1,593 1,432 1,387 1,480
Home furnishings stores 643 964 892 970 1,044
Electronics and appliance stores 1,532 2,096 1,767 2,273 2,212
Building material and garden equipment and supplies dealers 3,160 4,140 5,044 5,270 5,507
Food and beverage stores 4,397 5,345 6,260 6,264 6,000
Supermarkets and other grocery (except convenience) stores 2,834 3,373 3,931 4,057 3,689
Convenience and specialty food stores 931 774 847 745 743
Convenience stores 507 447 458
Specialty food stores 340 298 286
Beer, wine and liquor stores 632 1,197 1,482 1,462 1,567
Health and personal care stores 2,675 3,322 4,274 4,248 4,554
Gasoline stations 1,068 934 992 1,043 1,381
Clothing and clothing accessories stores 3,950 4,391 4,694 4,991 5,318
Clothing stores 2,967 3,115 3,284
Shoe stores 630 663 751
Jewellery, luggage and leather goods stores 1,097 1,212 1,283
Sporting goods, hobby, book and music stores 2,289 2,593 2,861 2,759 2,886
General merchandise stores 5,852 6,796 7,386 7,573 7,954
Miscellaneous store retailers 2,087 1,904 1,981 1,690 1,750 Statistics Canada, CANSIM, ARTS
11
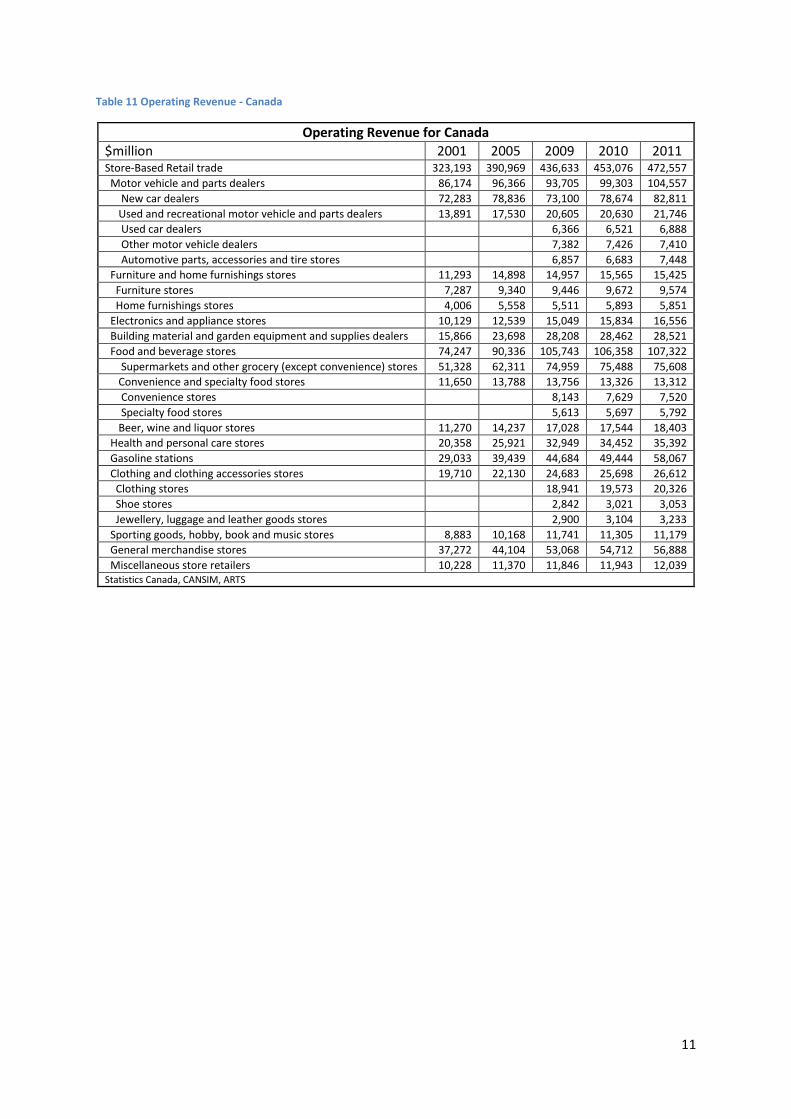
Table 11 Operating Revenue - Canada
Operating Revenue for Canada
$million 2001 2005 2009 2010 2011 Store-Based Retail trade 323,193 390,969 436,633 453,076 472,557
Motor vehicle and parts dealers 86,174 96,366 93,705 99,303 104,557
New car dealers 72,283 78,836 73,100 78,674 82,811
Used and recreational motor vehicle and parts dealers 13,891 17,530 20,605 20,630 21,746
Used car dealers 6,366 6,521 6,888
Other motor vehicle dealers 7,382 7,426 7,410
Automotive parts, accessories and tire stores 6,857 6,683 7,448
Furniture and home furnishings stores 11,293 14,898 14,957 15,565 15,425
Furniture stores 7,287 9,340 9,446 9,672 9,574
Home furnishings stores 4,006 5,558 5,511 5,893 5,851
Electronics and appliance stores 10,129 12,539 15,049 15,834 16,556
Building material and garden equipment and supplies dealers 15,866 23,698 28,208 28,462 28,521
Food and beverage stores 74,247 90,336 105,743 106,358 107,322
Supermarkets and other grocery (except convenience) stores 51,328 62,311 74,959 75,488 75,608
Convenience and specialty food stores 11,650 13,788 13,756 13,326 13,312
Convenience stores 8,143 7,629 7,520
Specialty food stores 5,613 5,697 5,792
Beer, wine and liquor stores 11,270 14,237 17,028 17,544 18,403
Health and personal care stores 20,358 25,921 32,949 34,452 35,392
Gasoline stations 29,033 39,439 44,684 49,444 58,067
Clothing and clothing accessories stores 19,710 22,130 24,683 25,698 26,612
Clothing stores 18,941 19,573 20,326
Shoe stores 2,842 3,021 3,053
Jewellery, luggage and leather goods stores 2,900 3,104 3,233
Sporting goods, hobby, book and music stores 8,883 10,168 11,741 11,305 11,179
General merchandise stores 37,272 44,104 53,068 54,712 56,888
Miscellaneous store retailers 10,228 11,370 11,846 11,943 12,039 Statistics Canada, CANSIM, ARTS
12
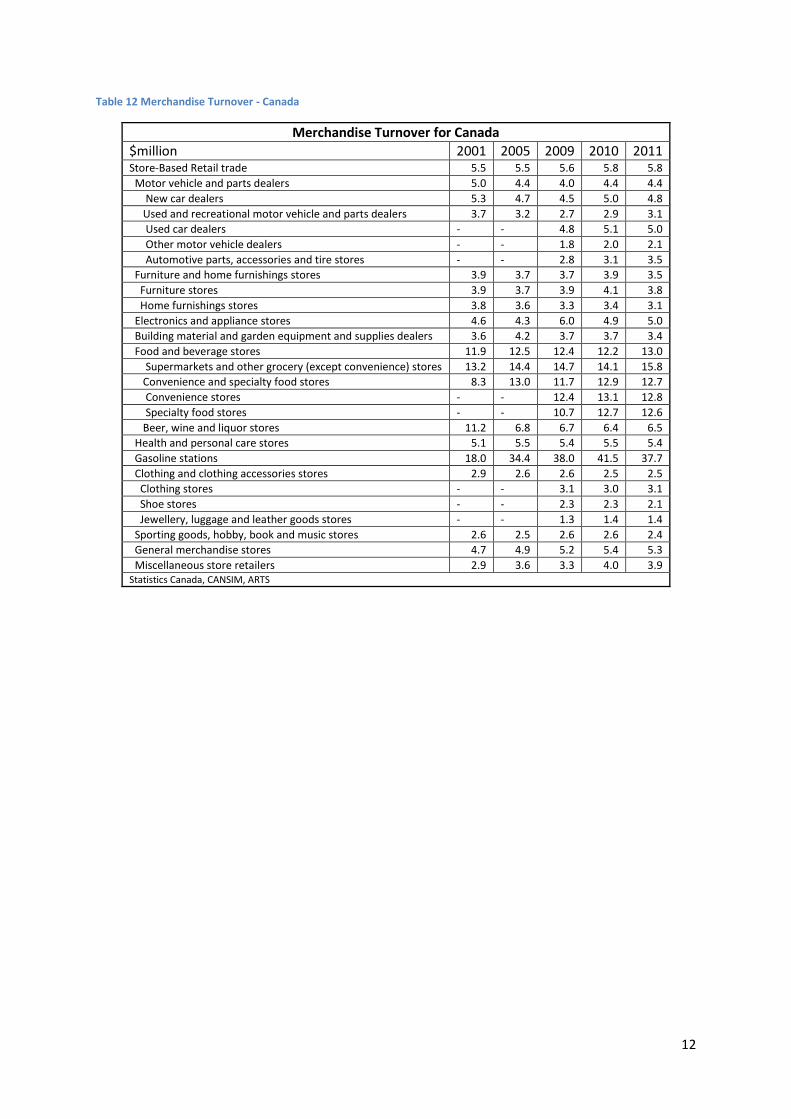
Table 12 Merchandise Turnover - Canada
Merchandise Turnover for Canada
$million 2001 2005 2009 2010 2011 Store-Based Retail trade 5.5 5.5 5.6 5.8 5.8
Motor vehicle and parts dealers 5.0 4.4 4.0 4.4 4.4
New car dealers 5.3 4.7 4.5 5.0 4.8
Used and recreational motor vehicle and parts dealers 3.7 3.2 2.7 2.9 3.1
Used car dealers - - 4.8 5.1 5.0
Other motor vehicle dealers - - 1.8 2.0 2.1
Automotive parts, accessories and tire stores - - 2.8 3.1 3.5
Furniture and home furnishings stores 3.9 3.7 3.7 3.9 3.5
Furniture stores 3.9 3.7 3.9 4.1 3.8
Home furnishings stores 3.8 3.6 3.3 3.4 3.1
Electronics and appliance stores 4.6 4.3 6.0 4.9 5.0
Building material and garden equipment and supplies dealers 3.6 4.2 3.7 3.7 3.4
Food and beverage stores 11.9 12.5 12.4 12.2 13.0
Supermarkets and other grocery (except convenience) stores 13.2 14.4 14.7 14.1 15.8
Convenience and specialty food stores 8.3 13.0 11.7 12.9 12.7
Convenience stores - - 12.4 13.1 12.8
Specialty food stores - - 10.7 12.7 12.6
Beer, wine and liquor stores 11.2 6.8 6.7 6.4 6.5
Health and personal care stores 5.1 5.5 5.4 5.5 5.4
Gasoline stations 18.0 34.4 38.0 41.5 37.7
Clothing and clothing accessories stores 2.9 2.6 2.6 2.5 2.5
Clothing stores - - 3.1 3.0 3.1
Shoe stores - - 2.3 2.3 2.1
Jewellery, luggage and leather goods stores - - 1.3 1.4 1.4
Sporting goods, hobby, book and music stores 2.6 2.5 2.6 2.6 2.4
General merchandise stores 4.7 4.9 5.2 5.4 5.3
Miscellaneous store retailers 2.9 3.6 3.3 4.0 3.9 Statistics Canada, CANSIM, ARTS

13
Table 13 Stock on Hand - Canada
Stock on Hand for Canada
$million 2001 2005 2009 2010 2011 Store-Based Retail trade 66.4 66.3 64.3 64.2 63.4
Motor vehicle and parts dealers 71.2 82.9 86.8 86.2 83.9
New car dealers 65.7 76.2 74.7 77.7 76.1
Used and recreational motor vehicle and parts dealers 103.3 117.2 136.1 123.1 117.7
Used car dealers - - 74.9 71.8 73.4
Other motor vehicle dealers - - 195.2 178.5 176.1
Automotive parts, accessories and tire stores - - 136.5 115.3 102.2
Furniture and home furnishings stores 97.3 103.3 97.3 95.7 103.7
Furniture stores 96.9 103.1 91.6 88.0 94.4
Home furnishings stores 98.1 103.6 108.2 109.3 120.5
Electronics and appliance stores 78.8 84.5 60.4 74.7 70.0
Building material and garden equipment and supplies dealers 102.5 90.3 97.0 101.7 106.5
Food and beverage stores 29.9 29.6 29.8 29.8 28.3
Supermarkets and other grocery (except convenience) stores 26.9 25.9 25.1 25.8 23.4
Convenience and specialty food stores 39.8 27.3 31.1 28.1 28.4
Convenience stores - - 29.2 27.1 28.3
Specialty food stores - - 34.4 29.9 28.5
Beer, wine and liquor stores 34.1 55.0 56.2 55.4 56.7
Health and personal care stores 72.0 66.5 70.1 65.9 69.0
Gasoline stations 17.6 10.6 9.6 9.1 10.0
Clothing and clothing accessories stores 132.6 140.8 141.1 146.4 149.4
Clothing stores - - 117.2 121.3 121.6
Shoe stores - - 161.8 161.9 180.8
Jewellery, luggage and leather goods stores - - 271.0 280.2 289.4
Sporting goods, hobby, book and music stores 148.7 147.2 142.9 144.8 152.7
General merchandise stores 79.2 75.8 69.3 69.2 70.4
Miscellaneous store retailers 128.8 101.2 106.3 92.2 94.6 Statistics Canada, CANSIM, ARTS
Table 14 Retail Prices and Volumes
Annual Summary Table
2005 2006 2007 2008 2009 2010 2011 2012
Retail Price Indexes
Total 98.1 99.1 100 100.5 99.2 100.4 102.5 103.3
Excl Gasoline 99.1 99.5 100 99 99.7 100.2 100.6 101.2
Percentage Change in Retail Price Indexes
Total 1.76 1.02 0.91 0.5 -1.29 1.21 2.09 0.78
Excl Gasoline 0.71 0.4 0.5 -1 0.71 0.5 0.4 0.6
Retail Sales $2007 Billions
Total 373.6 393.8 413.4 426.8 420.4 438.9 447.3 454.8
Excl Gasoline 331.5 350.5 367.9 380.8 376.1 390.5 397.9 405.2
Retail Sales $C Billions
Total 366.3 390.0 413.4 429.1 417.2 440.5 458.5 469.9
Excl Gasoline 328.4 348.9 367.9 377.1 375.0 391.4 400.4 410.2
Source; Statistics Canada, Unpublished data provided to JCI

14
Table 15 Revenue and Stores by Province
Operating Revenue and Stores - Retail trade
Operating Revenue Stores Revenue Per Store
Geography 2000 2011 2000 2011 2000 2011
($millions) units $1000/Store
Canada 310,196 472,557 191,856 190,100 1,617 2,486
Newfoundland and Labrador 4,835 8,353 3,986 3,378 1,213 2,473
Prince Edward Island 1,263 1,903 1,060 851 1,191 2,236
Nova Scotia 9,162 13,170 6,177 5,539 1,483 2,378
New Brunswick 7,483 11,205 5,018 4,457 1,491 2,514
Quebec 71,326 105,374 48,720 44,134 1,464 2,388
Ontario 118,091 169,414 69,140 71,403 1,708 2,373
Manitoba 10,987 16,861 6,661 6,141 1,649 2,746
Saskatchewan 9,347 16,965 6,169 6,092 1,515 2,785
Alberta 35,701 66,535 19,061 20,935 1,873 3,178
British Columbia 41,021 60,947 25,330 26,644 1,619 2,287
Yukon 374 689 235 238 1,592 2,897
Northwest Territories 413 765 230 212 1,797 3,608
Nunavut 195 376 69 76 2,830 4,950
Source: Statistics Canada - CANSIM
Table 16 Per Capita Revenue and Store by Province
Per Capita Operating Revenue and Stores - Retail trade
Operating Revenue Stores
Geography 2000 2011 AA GR 2000 2011 AA GR
$1000/capita % units/1000 people %
Canada 10.1 13.7 2.8% 6.3 5.5 -1.1%
Newfoundland and Labrador 9.2 16.3 5.4% 7.5 6.6 -1.2%
Prince Edward Island 9.3 13.1 3.2% 7.8 5.8 -2.6%
Nova Scotia 9.8 13.9 3.2% 6.6 5.8 -1.1%
New Brunswick 10.0 14.8 3.7% 6.7 5.9 -1.1%
Quebec 9.7 13.2 2.9% 6.6 5.5 -1.6%
Ontario 10.1 12.7 2.1% 5.9 5.3 -0.9%
Manitoba 9.6 13.5 3.2% 5.8 4.9 -1.5%
Saskatchewan 9.3 16.0 5.1% 6.1 5.8 -0.6%
Alberta 11.9 17.6 3.6% 6.3 5.5 -1.2%
British Columbia 10.2 13.3 2.5% 6.3 5.8 -0.7%
Yukon 12.3 19.5 4.3% 7.7 6.7 -1.3%
Northwest Territories 10.2 17.3 4.9% 5.7 4.8 -1.5%
Nunavut 7.1 11.2 4.2% 2.5 2.3 -0.9%
Source: Statistics Canada - CANSIM
15
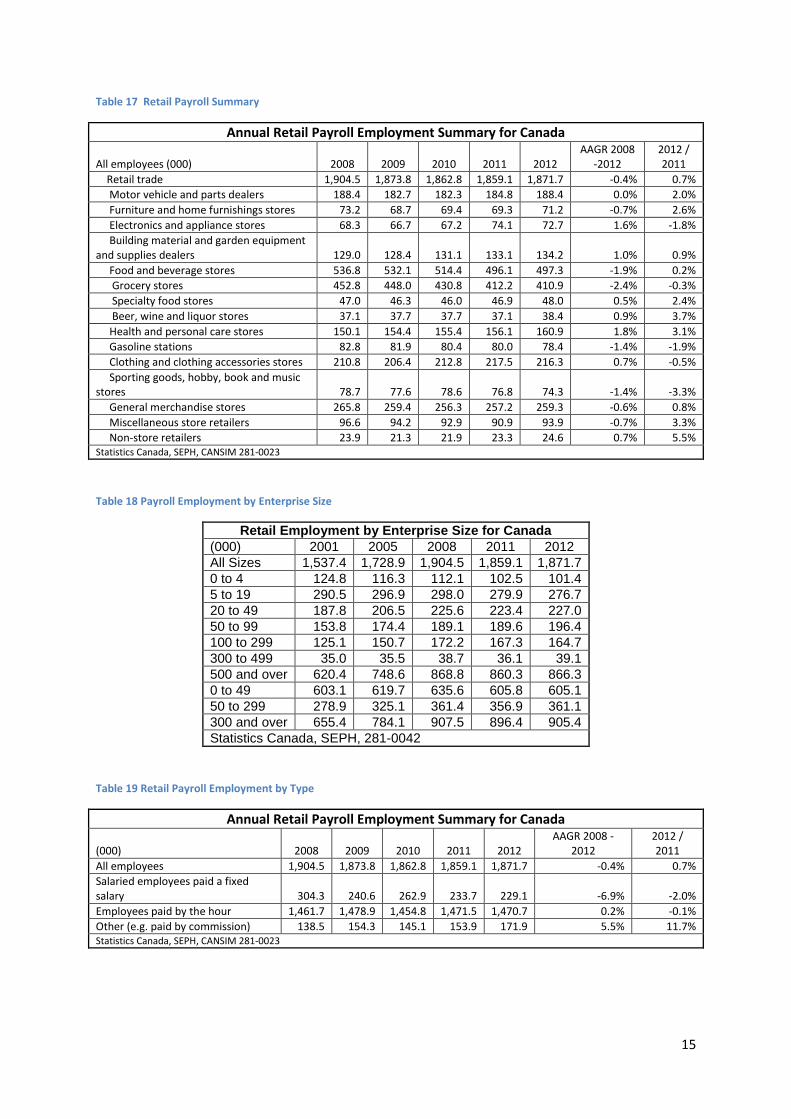
Table 17 Retail Payroll Summary
Annual Retail Payroll Employment Summary for Canada
All employees (000) 2008 2009 2010 2011 2012 AAGR 2008
-2012 2012 / 2011
Retail trade 1,904.5 1,873.8 1,862.8 1,859.1 1,871.7 -0.4% 0.7%
Motor vehicle and parts dealers 188.4 182.7 182.3 184.8 188.4 0.0% 2.0%
Furniture and home furnishings stores 73.2 68.7 69.4 69.3 71.2 -0.7% 2.6%
Electronics and appliance stores 68.3 66.7 67.2 74.1 72.7 1.6% -1.8%
Building material and garden equipment and supplies dealers 129.0 128.4 131.1 133.1 134.2 1.0% 0.9%
Food and beverage stores 536.8 532.1 514.4 496.1 497.3 -1.9% 0.2%
Grocery stores 452.8 448.0 430.8 412.2 410.9 -2.4% -0.3%
Specialty food stores 47.0 46.3 46.0 46.9 48.0 0.5% 2.4%
Beer, wine and liquor stores 37.1 37.7 37.7 37.1 38.4 0.9% 3.7%
Health and personal care stores 150.1 154.4 155.4 156.1 160.9 1.8% 3.1%
Gasoline stations 82.8 81.9 80.4 80.0 78.4 -1.4% -1.9%
Clothing and clothing accessories stores 210.8 206.4 212.8 217.5 216.3 0.7% -0.5%
Sporting goods, hobby, book and music stores 78.7 77.6 78.6 76.8 74.3 -1.4% -3.3%
General merchandise stores 265.8 259.4 256.3 257.2 259.3 -0.6% 0.8%
Miscellaneous store retailers 96.6 94.2 92.9 90.9 93.9 -0.7% 3.3%
Non-store retailers 23.9 21.3 21.9 23.3 24.6 0.7% 5.5% Statistics Canada, SEPH, CANSIM 281-0023
Table 18 Payroll Employment by Enterprise Size
Retail Employment by Enterprise Size for Canada
(000) 2001 2005 2008 2011 2012
All Sizes 1,537.4 1,728.9 1,904.5 1,859.1 1,871.7
0 to 4 124.8 116.3 112.1 102.5 101.4
5 to 19 290.5 296.9 298.0 279.9 276.7
20 to 49 187.8 206.5 225.6 223.4 227.0
50 to 99 153.8 174.4 189.1 189.6 196.4
100 to 299 125.1 150.7 172.2 167.3 164.7
300 to 499 35.0 35.5 38.7 36.1 39.1
500 and over 620.4 748.6 868.8 860.3 866.3
0 to 49 603.1 619.7 635.6 605.8 605.1
50 to 299 278.9 325.1 361.4 356.9 361.1
300 and over 655.4 784.1 907.5 896.4 905.4
Statistics Canada, SEPH, 281-0042
Table 19 Retail Payroll Employment by Type
Annual Retail Payroll Employment Summary for Canada
(000) 2008 2009 2010 2011 2012 AAGR 2008 -
2012 2012 / 2011
All employees 1,904.5 1,873.8 1,862.8 1,859.1 1,871.7 -0.4% 0.7%
Salaried employees paid a fixed salary 304.3 240.6 262.9 233.7 229.1 -6.9% -2.0%
Employees paid by the hour 1,461.7 1,478.9 1,454.8 1,471.5 1,470.7 0.2% -0.1%
Other (e.g. paid by commission) 138.5 154.3 145.1 153.9 171.9 5.5% 11.7% Statistics Canada, SEPH, CANSIM 281-0023

16
Table 20 Detailed Payroll Employment
Annual Retail Payroll Employment Summary for Canada
All employees (000) 2008 2009 2010 2011 2012 2012 / 2011
Retail trade 1,904.5 1,873.8 1,862.8 1,859.1 1,871.7 0.7%
Motor vehicle and parts dealers 188.4 182.7 182.3 184.8 188.4 2.0%
Automobile dealers 137.4 132.7 132.2 133.4 135.6 1.6%
Other motor vehicle dealers 20.4 19.5 19.4 19.6 20.1 2.3%
Automotive parts, accessories and tire stores 30.6 30.5 30.8 31.7 32.8 3.3%
Furniture and home furnishings stores 73.2 68.7 69.4 69.3 71.2 2.6%
Furniture stores 42.7 39.6 39.4 38.9 40.2 3.3%
Home furnishings stores 30.5 29.1 30.0 30.4 31.0 1.8%
Electronics and appliance stores 68.3 66.7 67.2 74.1 72.7 -1.8%
Building material and garden equipment and supplies dealers 129.0 128.4 131.1 133.1 134.2 0.9%
Building material and supplies dealers 119.3 118.6 121.1 123.3 124.5 0.9%
Lawn and garden equipment and supplies stores 9.7 9.8 10.0 9.8 9.8 0.1%
Food and beverage stores 536.8 532.1 514.4 496.1 497.3 0.2%
Grocery stores 452.8 448.0 430.8 412.2 410.9 -0.3%
Specialty food stores 47.0 46.3 46.0 46.9 48.0 2.4%
Beer, wine and liquor stores 37.1 37.7 37.7 37.1 38.4 3.7%
Health and personal care stores 150.1 154.4 155.4 156.1 160.9 3.1%
Gasoline stations 82.8 81.9 80.4 80.0 78.4 -1.9%
Clothing and clothing accessories stores 210.8 206.4 212.8 217.5 216.3 -0.5%
Clothing stores 163.7 160.0 165.6 168.9 167.7 -0.7%
Shoe stores 25.0 25.4 26.3 26.8 26.5 -1.4%
Jewellery, luggage and leather goods stores 22.1 20.9 20.9 21.7 22.2 2.4%
Sporting goods, hobby, book and music stores 78.7 77.6 78.6 76.8 74.3 -3.3%
Sporting goods, hobby and musical instrument stores 65.0 63.7 64.9 63.3 60.9 -3.9%
Book, periodical and music stores 18.6 18.8 18.2 17.3 17.2 -0.5%
General merchandise stores 265.8 259.4 256.3 257.2 259.3 0.8%
Department stores 151.2 149.4 148.5 147.8 144.4 -2.3%
Other general merchandise stores 114.5 110.0 107.8 109.4 114.9 5.0%
Miscellaneous store retailers 96.6 94.2 92.9 90.9 93.9 3.3%
Florists 8.0 7.3 6.9 6.7 6.6 -1.5%
Office supplies, stationery and gift stores 38.4 36.6 35.8 34.2 33.1 -3.3%
Used merchandise stores 15.3 15.6 15.5 15.9 18.6 17.5%
Other miscellaneous store retailers 34.9 34.7 34.6 34.2 35.6 4.2%
Non-store retailers 23.9 21.3 21.9 23.3 24.6 5.5%
Electronic shopping and mail-order houses 7.9 6.9 7.1 7.4 7.7 3.8%
Vending machine operators 3.6 3.1 3.3 3.8 3.9 2.6%
Direct selling establishments 12.4 11.3 11.6 12.1 13.0 7.5% Statistics Canada, SEPH, CANSIM 281-0023

17
Table 21 Retail Employment by Class of Worker
Retail Employment by Class of Worker
(000) 2008 2009 2010 2011 2012
Total 2,052.9 2,020.5 2,049.1 2,037.2 2,032.3
Employees 1,864.0 1,819.1 1,856.0 1,850.3 1,843.2
Public 22.2 18.4 20.7 19.0 17.6
Private 1,841.8 1,800.7 1,835.3 1,831.3 1,825.6
Self-Employed 188.9 201.4 193.1 186.9 189.1
With Employees 100.7 109.2 102.9 97.1 97.6
With No Employees 85.9 90.4 88.9 86.8 89.9
Unpaid Family Workers 2.3 1.8 1.4 3.1 1.7
Statistics Canada, LFS, PUMF, JCI
Table 22 Retail Employment for Canada
Retail Employment for Canada
Annual Average in Thousands
(000) 2007 2008 2009 2010 2011 2012
Retail 2,050.9 2,052.9 2,020.4 2,048.9 2,037.1 2,031.9
Retail - Full-Time 1,370.1 1,361.3 1,316.5 1,338.1 1,319.2 1,317.5
Retail - Part-Time 680.7 691.6 703.9 710.8 717.9 714.4
Manufacturing 2,030.9 1,962.7 1,781.8 1,744.3 1,760.2 1,785.5
Manufacturing - Full-Time 1,950.1 1,882.8 1,695.9 1,670.5 1,684.5 1,707.7
Manufacturing -Part Time 80.7 80.0 86.0 73.8 75.6 77.8
Source; Statistics Canada - LFS Special Tabulation
Table 23 Full-Time Retail Employment by Occupation
Occupational Composition for Full-Time Employees in Retail
1997 2002 2007 2012
Total(000) 926.4 1,051.9 1,194.6 1,166.1
01 -Senior and Specialist Managers 2.4% 1.1% 1.3% 1.4%
02 -Other Managers 17.0% 11.4% 10.8% 9.5%
03 -Prof. Business Occ. 1.4% 1.1% 1.1% 1.3%
04 -Prof. Scientific and Health Occ. 1.6% 1.8% 1.6% 1.8%
05 -Other Prof. Occ. 0.4% 0.2% 0.3% 0.5%
06 -Other Management, Business, Clerical and Technical 14.5% 15.0% 15.5% 16.8%
07 -Distribution and Service 47.5% 57.2% 57.4% 57.6%
08 -Supervisors and Contractors 0.4% 0.5% 0.4% 0.3%
09 -Stationary Eng. & Power Station Ops 0.1% 0.1% 0.0% 0.0%
10 -Equipment Operators 2.7% 2.4% 2.1% 2.1%
11 -Machinists and Mechanics 6.4% 4.8% 4.9% 4.5%
12 -Other Trades and Labourers 5.6% 4.6% 4.7% 4.2%
Source: LFS - PUMF
18
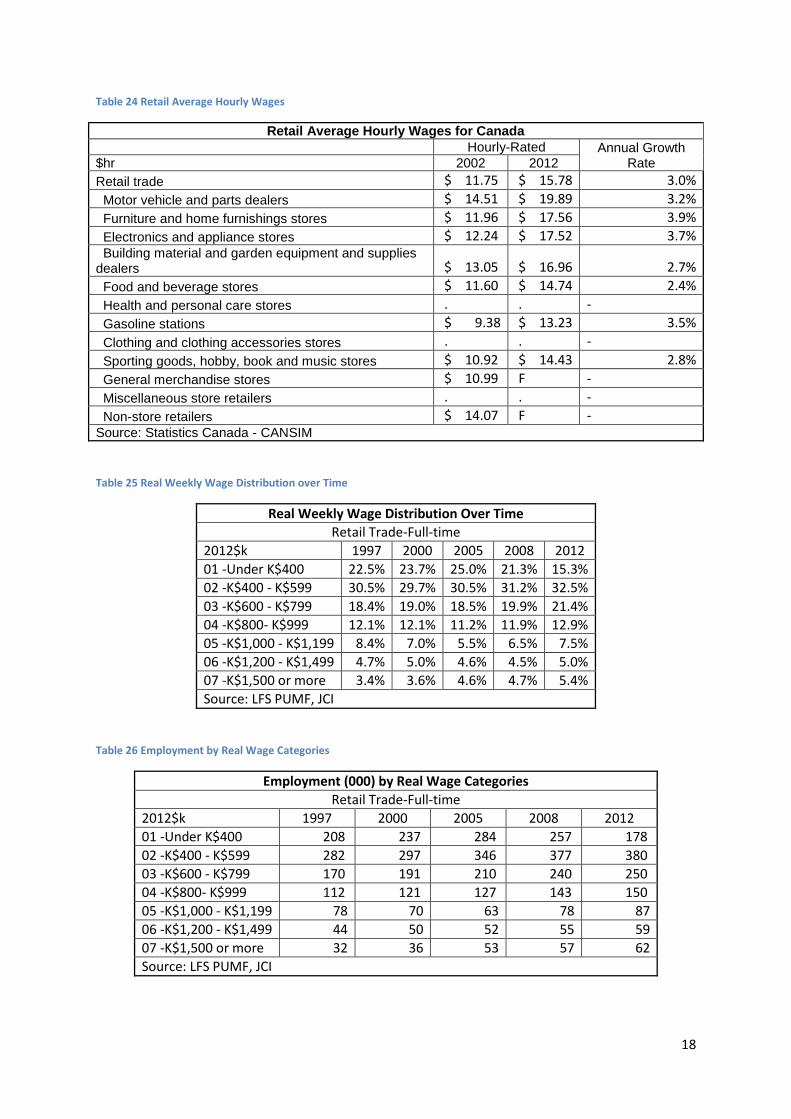
Table 24 Retail Average Hourly Wages
Retail Average Hourly Wages for Canada
Hourly-Rated Annual Growth Rate $hr 2002 2012
Retail trade $ 11.75 $ 15.78 3.0%
Motor vehicle and parts dealers $ 14.51 $ 19.89 3.2%
Furniture and home furnishings stores $ 11.96 $ 17.56 3.9%
Electronics and appliance stores $ 12.24 $ 17.52 3.7% Building material and garden equipment and supplies dealers $ 13.05 $ 16.96 2.7%
Food and beverage stores $ 11.60 $ 14.74 2.4%
Health and personal care stores . . -
Gasoline stations $ 9.38 $ 13.23 3.5%
Clothing and clothing accessories stores . . -
Sporting goods, hobby, book and music stores $ 10.92 $ 14.43 2.8%
General merchandise stores $ 10.99 F -
Miscellaneous store retailers . . -
Non-store retailers $ 14.07 F - Source: Statistics Canada - CANSIM
Table 25 Real Weekly Wage Distribution over Time
Real Weekly Wage Distribution Over Time
Retail Trade-Full-time
2012$k 1997 2000 2005 2008 2012
01 -Under K$400 22.5% 23.7% 25.0% 21.3% 15.3%
02 -K$400 - K$599 30.5% 29.7% 30.5% 31.2% 32.5%
03 -K$600 - K$799 18.4% 19.0% 18.5% 19.9% 21.4%
04 -K$800- K$999 12.1% 12.1% 11.2% 11.9% 12.9%
05 -K$1,000 - K$1,199 8.4% 7.0% 5.5% 6.5% 7.5%
06 -K$1,200 - K$1,499 4.7% 5.0% 4.6% 4.5% 5.0%
07 -K$1,500 or more 3.4% 3.6% 4.6% 4.7% 5.4%
Source: LFS PUMF, JCI
Table 26 Employment by Real Wage Categories
Employment (000) by Real Wage Categories
Retail Trade-Full-time
2012$k 1997 2000 2005 2008 2012
01 -Under K$400 208 237 284 257 178
02 -K$400 - K$599 282 297 346 377 380
03 -K$600 - K$799 170 191 210 240 250
04 -K$800- K$999 112 121 127 143 150
05 -K$1,000 - K$1,199 78 70 63 78 87
06 -K$1,200 - K$1,499 44 50 52 55 59
07 -K$1,500 or more 32 36 53 57 62
Source: LFS PUMF, JCI

19
Table 27 Full-Time Retail Employees
Full-time Retail Employees
2008 2009 2010 2011 2012
(000)
10 -Newfoundland 20.1 19.8 20.8 21.4 19.8
11 -Prince Edward Island 5.9 5.2 5.3 5.5 5.1
12 -Nova Scotia 41.5 38.0 38.9 37.1 35.1
13 -New Brunswick 28.2 27.1 29.3 25.6 28.2
24 -Québec 296.3 289.2 290.3 280.9 281.2
35 -Ontario 426.0 394.4 413.1 409.4 410.2
46 -Manitoba 40.3 40.4 40.5 44.5 43.5
47 -Saskatchewan 38.9 36.7 34.5 38.0 36.4
48 -Alberta 151.0 143.1 141.5 146.0 150.3
59 -British Columbia 158.7 159.0 164.5 163.4 156.2
00 -Canada 1206.8 1152.9 1178.7 1171.6 1166.1
Source: LFS - PUMF
Table 28 Full-time Retail Weekly Wages
Full-time Retail Weekly Wages
2008 2009 2010 2011 2012
10 -Newfoundland $ 534.46 $ 572.18 $ 553.73 $ 587.24 $ 641.96
11 -Prince Edward Island $ 528.12 $ 542.48 $ 597.59 $ 577.85 $ 624.82
12 -Nova Scotia $ 574.06 $ 577.47 $ 638.67 $ 630.85 $ 652.83
13 -New Brunswick $ 559.81 $ 592.80 $ 596.46 $ 575.50 $ 614.19
24 -Québec $ 593.44 $ 622.40 $ 636.85 $ 636.57 $ 663.36
35 -Ontario $ 673.71 $ 712.86 $ 719.61 $ 727.62 $ 750.57
46 -Manitoba $ 610.16 $ 641.79 $ 655.76 $ 680.73 $ 709.67
47 -Saskatchewan $ 633.29 $ 664.14 $ 681.18 $ 722.93 $ 734.96
48 -Alberta $ 725.11 $ 746.03 $ 753.56 $ 752.67 $ 781.49
59 -British Columbia $ 674.54 $ 705.94 $ 724.82 $ 734.02 $ 752.58
00 -Canada $ 648.00 $ 678.81 $ 691.50 $ 698.23 $ 723.14
Source: LFS - PUMF

20
Table 29 Full-time Retail Hourly Wages
Full-time Retail Hourly Wages
2008 2009 2010 2011 2012
10 -Newfoundland $ 13.45 $ 14.48 $ 14.17 $ 15.04 $ 16.37
11 -Prince Edward Island $ 13.48 $ 13.71 $ 15.16 $ 14.80 $ 15.83
12 -Nova Scotia $ 14.52 $ 14.64 $ 16.15 $ 16.04 $ 16.54
13 -New Brunswick $ 14.08 $ 14.92 $ 15.11 $ 14.63 $ 15.59
24 -Québec $ 15.39 $ 16.17 $ 16.55 $ 16.65 $ 17.35
35 -Ontario $ 17.08 $ 18.08 $ 18.28 $ 18.49 $ 19.03
46 -Manitoba $ 15.48 $ 16.31 $ 16.73 $ 17.31 $ 17.98
47 -Saskatchewan $ 16.02 $ 16.80 $ 17.26 $ 18.34 $ 18.69
48 -Alberta $ 18.07 $ 18.79 $ 18.81 $ 18.80 $ 19.50
59 -British Columbia $ 17.26 $ 18.14 $ 18.56 $ 18.73 $ 19.20
00 -Canada $ 16.49 $ 17.33 $ 17.64 $ 17.83 $ 18.44
Source: LFS - PUMF
Table 30 Part-time Retail Employment
Part-time Retail Employees
2008 2009 2010 2011 2012
(000)
10 -Newfoundland 7.8 7.2 8.0 9.1 8.3
11 -Prince Edward Island 2.3 2.6 2.7 2.6 2.5
12 -Nova Scotia 20.0 20.1 20.1 20.1 19.0
13 -New Brunswick 13.3 12.3 12.2 13.4 12.1
24 -Québec 143.1 147.4 157.3 162.8 154.8
35 -Ontario 287.9 278.8 275.5 275.9 281.3
46 -Manitoba 22.3 22.0 23.4 21.9 22.1
47 -Saskatchewan 18.7 18.5 18.9 17.1 18.7
48 -Alberta 65.1 69.0 66.5 69.0 69.4
59 -British Columbia 76.6 88.2 92.6 86.8 89.0
00 -Canada 657.2 666.2 677.3 678.7 677.1
Source: LFS - PUMF

21
Table 31 Part-time Retail Weekly Wages
Part-time Retail Weekly Wages
2008 2009 2010 2011 2012
10 -Newfoundland $ 166.20 $ 175.86 $ 175.00 $ 200.60 $ 200.46
11 -Prince Edward Island $ 157.21 $ 164.09 $ 163.06 $ 171.49 $ 184.88
12 -Nova Scotia $ 166.38 $ 179.25 $ 180.59 $ 192.21 $ 193.61
13 -New Brunswick $ 149.94 $ 156.73 $ 173.18 $ 191.71 $ 184.61
24 -Québec $ 179.40 $ 186.72 $ 190.06 $ 200.73 $ 206.82
35 -Ontario $ 181.20 $ 189.57 $ 196.57 $ 205.07 $ 212.73
46 -Manitoba $ 182.44 $ 189.22 $ 189.58 $ 212.35 $ 218.33
47 -Saskatchewan $ 180.52 $ 189.47 $ 202.41 $ 204.89 $ 207.35
48 -Alberta $ 204.00 $ 205.32 $ 211.78 $ 215.34 $ 225.75
59 -British Columbia $ 184.13 $ 193.32 $ 206.50 $ 208.61 $ 217.50
00 -Canada $ 182.08 $ 189.89 $ 196.55 $ 204.92 $ 212.08
Source: LFS - PUMF
Table 32 Part-time Retail Hourly Wages
Part-time Retail Hourly Wages
2008 2009 2010 2011 2012
10 -Newfoundland $ 9.30 $ 9.90 $ 10.45 $ 11.06 $ 11.19
11 -Prince Edward Island $ 9.55 $ 9.83 $ 9.77 $ 10.42 $ 11.07
12 -Nova Scotia $ 9.29 $ 9.90 $ 10.28 $ 10.98 $ 11.23
13 -New Brunswick $ 8.66 $ 9.16 $ 9.80 $ 10.71 $ 11.16
24 -Québec $ 10.07 $ 10.36 $ 10.95 $ 11.22 $ 11.54
35 -Ontario $ 10.16 $ 10.85 $ 11.27 $ 11.51 $ 11.94
46 -Manitoba $ 10.05 $ 10.57 $ 10.79 $ 11.68 $ 12.00
47 -Saskatchewan $ 10.21 $ 10.98 $ 11.33 $ 11.57 $ 11.62
48 -Alberta $ 11.76 $ 11.87 $ 11.96 $ 12.35 $ 12.94
59 -British Columbia $ 10.83 $ 11.23 $ 11.55 $ 11.83 $ 12.30
00 -Canada $ 10.30 $ 10.82 $ 11.22 $ 11.53 $ 11.95
Source: LFS - PUMF
Table 33 LFS Retail Wage Data for Canada
Retail Wage Data for Canada
Full-Time and Part-Time Wages of Employees
2008 2009 2010 2011 2012
FT Employees (000) 1206.8 1152.9 1178.7 1171.6 1166.1
FT Hourly Wage $ 16.49 $ 17.33 $ 17.64 $ 17.83 $ 18.44
FT Weekly Wage $ 648.00 $ 678.81 $ 691.50 $ 698.23 $ 723.14
PT Employees (000) 657.2 666.2 677.3 678.7 677.1
PT Hourly Wage $ 10.30 $ 10.82 $ 11.22 $ 11.53 $ 11.95
PT Weekly Wage $ 182.08 $ 189.89 $ 196.55 $ 204.92 $ 212.08
Source: LFS- PUMF
22
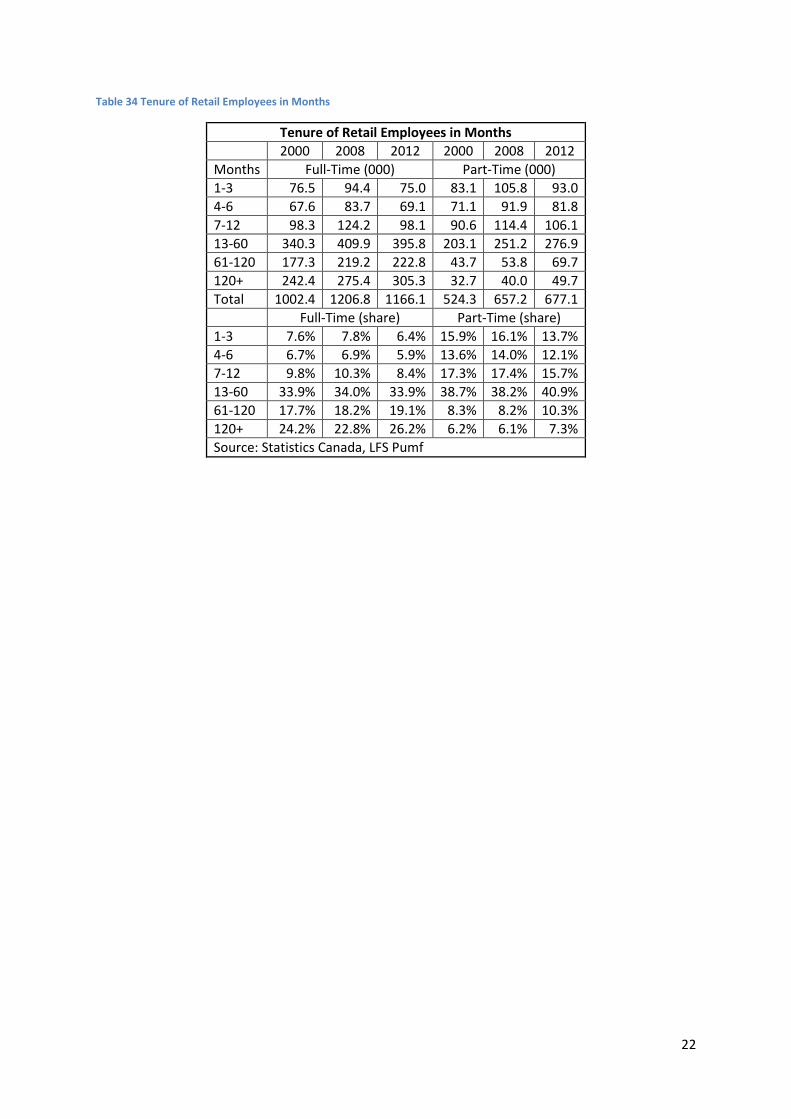
Table 34 Tenure of Retail Employees in Months
Tenure of Retail Employees in Months
2000 2008 2012 2000 2008 2012
Months Full-Time (000) Part-Time (000)
1-3 76.5 94.4 75.0 83.1 105.8 93.0
4-6 67.6 83.7 69.1 71.1 91.9 81.8
7-12 98.3 124.2 98.1 90.6 114.4 106.1
13-60 340.3 409.9 395.8 203.1 251.2 276.9
61-120 177.3 219.2 222.8 43.7 53.8 69.7
120+ 242.4 275.4 305.3 32.7 40.0 49.7
Total 1002.4 1206.8 1166.1 524.3 657.2 677.1
Full-Time (share) Part-Time (share)
1-3 7.6% 7.8% 6.4% 15.9% 16.1% 13.7%
4-6 6.7% 6.9% 5.9% 13.6% 14.0% 12.1%
7-12 9.8% 10.3% 8.4% 17.3% 17.4% 15.7%
13-60 33.9% 34.0% 33.9% 38.7% 38.2% 40.9%
61-120 17.7% 18.2% 19.1% 8.3% 8.2% 10.3%
120+ 24.2% 22.8% 26.2% 6.2% 6.1% 7.3%
Source: Statistics Canada, LFS Pumf
23
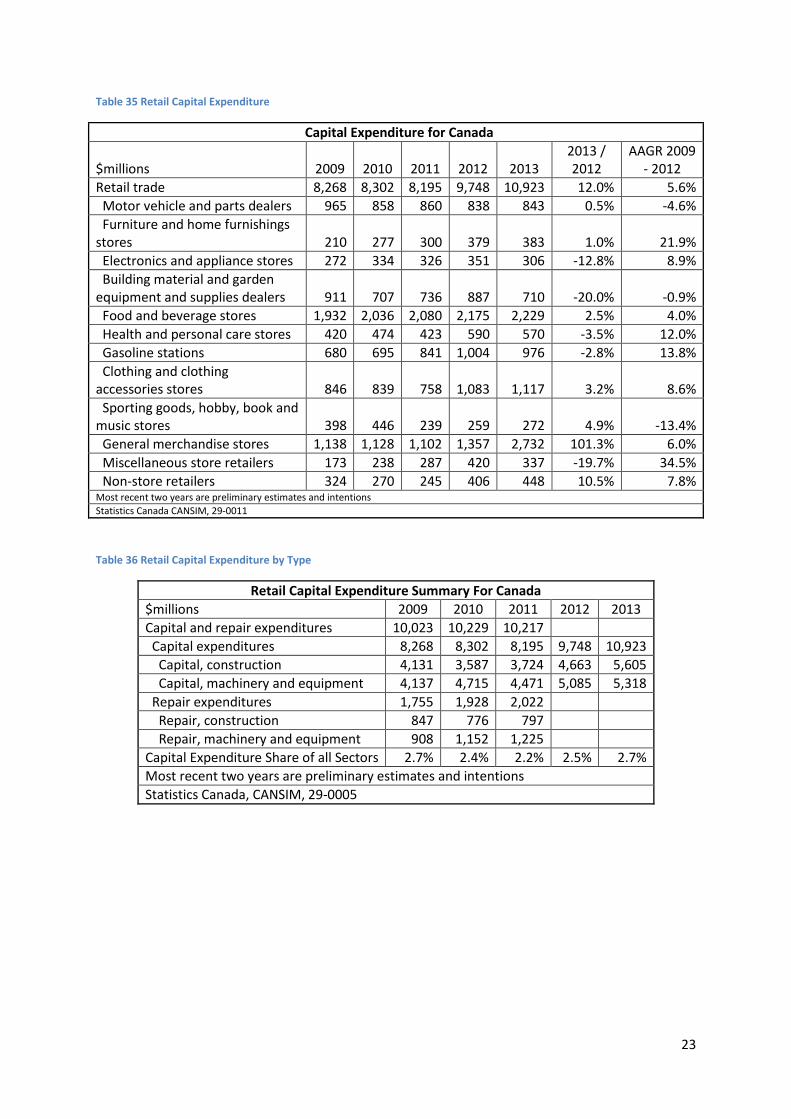
Table 35 Retail Capital Expenditure
Capital Expenditure for Canada
$millions 2009 2010 2011 2012 2013 2013 / 2012
AAGR 2009 - 2012
Retail trade 8,268 8,302 8,195 9,748 10,923 12.0% 5.6%
Motor vehicle and parts dealers 965 858 860 838 843 0.5% -4.6%
Furniture and home furnishings stores 210 277 300 379 383 1.0% 21.9%
Electronics and appliance stores 272 334 326 351 306 -12.8% 8.9%
Building material and garden equipment and supplies dealers 911 707 736 887 710 -20.0% -0.9%
Food and beverage stores 1,932 2,036 2,080 2,175 2,229 2.5% 4.0%
Health and personal care stores 420 474 423 590 570 -3.5% 12.0%
Gasoline stations 680 695 841 1,004 976 -2.8% 13.8%
Clothing and clothing accessories stores 846 839 758 1,083 1,117 3.2% 8.6%
Sporting goods, hobby, book and music stores 398 446 239 259 272 4.9% -13.4%
General merchandise stores 1,138 1,128 1,102 1,357 2,732 101.3% 6.0%
Miscellaneous store retailers 173 238 287 420 337 -19.7% 34.5%
Non-store retailers 324 270 245 406 448 10.5% 7.8% Most recent two years are preliminary estimates and intentions
Statistics Canada CANSIM, 29-0011
Table 36 Retail Capital Expenditure by Type
Retail Capital Expenditure Summary For Canada
$millions 2009 2010 2011 2012 2013
Capital and repair expenditures 10,023 10,229 10,217
Capital expenditures 8,268 8,302 8,195 9,748 10,923
Capital, construction 4,131 3,587 3,724 4,663 5,605
Capital, machinery and equipment 4,137 4,715 4,471 5,085 5,318
Repair expenditures 1,755 1,928 2,022
Repair, construction 847 776 797
Repair, machinery and equipment 908 1,152 1,225
Capital Expenditure Share of all Sectors 2.7% 2.4% 2.2% 2.5% 2.7%
Most recent two years are preliminary estimates and intentions
Statistics Canada, CANSIM, 29-0005

24
Table 37 Provincial Retail Capital Expenditure
Provincial Retail Capital Expenditures
2009 2010 2011 2012 2013 2013 / 2012
AAGR 2009 - 2012
Canada 8,268 8,302 8,195 9,748 10,923 12.0% 5.6%
Newfoundland and Labrador 94 122 159 183 165 -9.8% 24.8%
Prince Edward Island 44 46 45 49 72 47.8% 3.5%
Nova Scotia 297 260 260 267 319 19.8% -3.5%
New Brunswick 242 223 231 291 322 10.7% 6.4%
Quebec 1,492 1,610 1,456 1,865 2,161 15.9% 7.7%
Ontario 3,116 3,064 3,058 3,587 3,994 11.3% 4.8%
Manitoba 285 264 276 350 373 6.6% 7.0%
Saskatchewan 277 269 316 349 388 11.2% 8.0%
Alberta 1,088 1,217 1,122 1,410 1,542 9.3% 9.0%
British Columbia 1,298 1,199 1,244 1,368 1,559 14.0% 1.8%
Yukon 9 8 11 x 10 - -
Northwest Territories 19 11 13 17 15 -10.1% -3.3%
Nunavut 8 8 4 x 4 - -
Most recent two years are preliminary estimates and intentions
Statistics Canada, CANSIM, 29-0005
Table 38 Construction of Shopping Centres, Stores
Construction of Shopping centres, Plazas, Malls, Stores
2006 2007 2008 2009 2010
All industries 5,861 6,744 7,745 5,369 4,597
Wholesale trade 280 573 638 382 346
Retail trade 3,258 4,018 4,049 2,958 2,585
Real estate and rental and leasing 2,317 2,147 2,991 1,921 1,519
Other Industries 6 6 66 107 147
Source: Statistics Canada, CANSIM
25
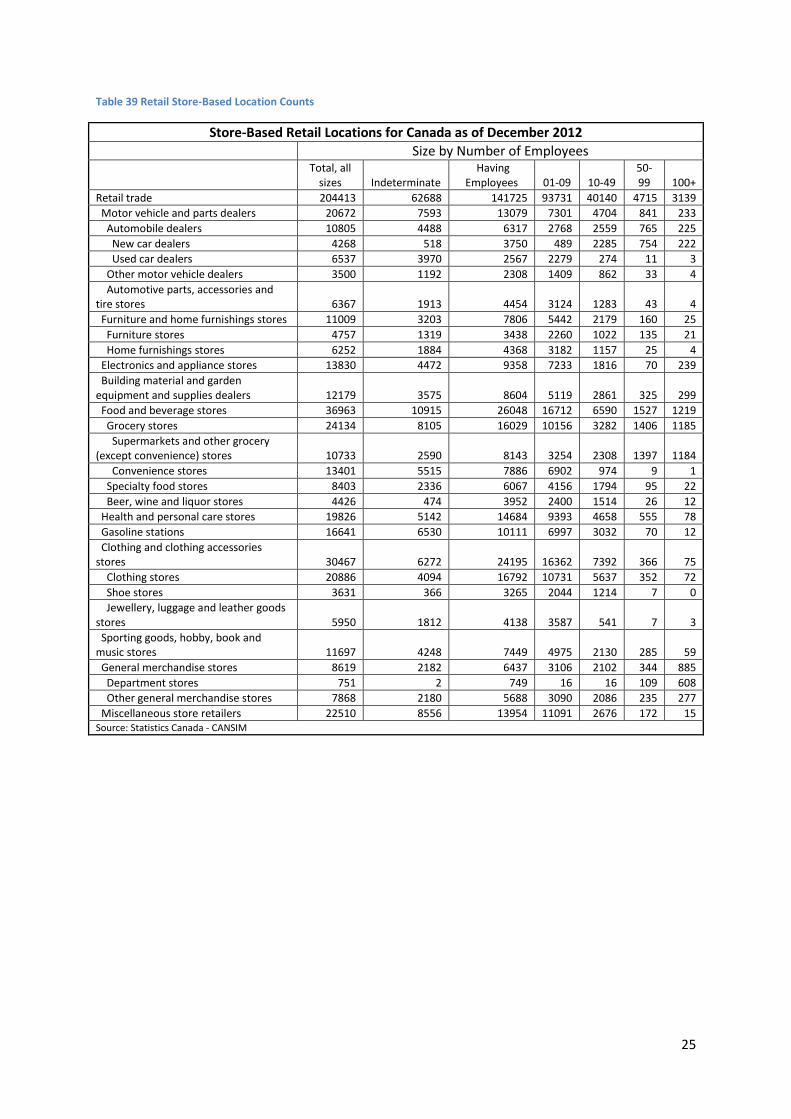
Table 39 Retail Store-Based Location Counts
Store-Based Retail Locations for Canada as of December 2012
Size by Number of Employees
Total, all
sizes
Indeterminate Having
Employees 01-09 10-49 50-99 100+
Retail trade 204413 62688 141725 93731 40140 4715 3139
Motor vehicle and parts dealers 20672 7593 13079 7301 4704 841 233
Automobile dealers 10805 4488 6317 2768 2559 765 225
New car dealers 4268 518 3750 489 2285 754 222
Used car dealers 6537 3970 2567 2279 274 11 3
Other motor vehicle dealers 3500 1192 2308 1409 862 33 4
Automotive parts, accessories and tire stores 6367 1913 4454 3124 1283 43 4
Furniture and home furnishings stores 11009 3203 7806 5442 2179 160 25
Furniture stores 4757 1319 3438 2260 1022 135 21
Home furnishings stores 6252 1884 4368 3182 1157 25 4
Electronics and appliance stores 13830 4472 9358 7233 1816 70 239
Building material and garden equipment and supplies dealers 12179 3575 8604 5119 2861 325 299
Food and beverage stores 36963 10915 26048 16712 6590 1527 1219
Grocery stores 24134 8105 16029 10156 3282 1406 1185
Supermarkets and other grocery (except convenience) stores 10733 2590 8143 3254 2308 1397 1184
Convenience stores 13401 5515 7886 6902 974 9 1
Specialty food stores 8403 2336 6067 4156 1794 95 22
Beer, wine and liquor stores 4426 474 3952 2400 1514 26 12
Health and personal care stores 19826 5142 14684 9393 4658 555 78
Gasoline stations 16641 6530 10111 6997 3032 70 12
Clothing and clothing accessories stores 30467 6272 24195 16362 7392 366 75
Clothing stores 20886 4094 16792 10731 5637 352 72
Shoe stores 3631 366 3265 2044 1214 7 0
Jewellery, luggage and leather goods stores 5950 1812 4138 3587 541 7 3
Sporting goods, hobby, book and music stores 11697 4248 7449 4975 2130 285 59
General merchandise stores 8619 2182 6437 3106 2102 344 885
Department stores 751 2 749 16 16 109 608
Other general merchandise stores 7868 2180 5688 3090 2086 235 277
Miscellaneous store retailers 22510 8556 13954 11091 2676 172 15 Source: Statistics Canada - CANSIM

26
Table 40 Retail Locations with Employees by Province
Provincial Locations with Employees CA NF PE NS NB QU ON MB SK AB BC YK NT NU 4411 - Automobile Dealers 6317 126 38 243 210 1744 2220 238 244 583 657 10 4 0
4412 - Other Motor Vehicle Dealers 2308 82 8 81 80 549 652 85 104 283 371 6 6 1
4413 - Automotive Parts, Accessories and Tire Stores 4454 82 36 128 161 1026 1242 167 217 668 711 9 6 1
4421 - Furniture Stores 3438 74 12 99 67 702 1361 116 111 362 528 4 2 0
4422 - Home Furnishings Stores 4368 35 22 118 82 962 1699 110 113 490 727 5 5 0
4431 - Electronics and Appliance Stores 9358 133 35 253 210 1946 3547 272 325 1156 1460 13 7 1
4441 - Building Material and Supplies Dealers 7021 177 32 242 206 1677 2322 293 302 763 982 12 11 2
4442 - Lawn and Garden Equipment and Supplies Stores 1583 15 10 46 51 273 588 76 54 124 344 1 1 0
4451 - Grocery Stores 16029 625 70 554 400 4520 5312 559 572 1588 1722 19 50 38
4452 - Specialty Food Stores 6067 64 30 128 135 1667 2158 161 134 554 1030 4 2 0
4453 - Beer, Wine and Liquor Stores 3952 33 22 111 57 427 1438 75 115 1129 528 7 8 2
4461 - Health and Personal Care Stores 14684 251 57 377 283 3023 6158 464 430 1538 2081 10 8 4
4471 - Gasoline Stations 10111 311 75 354 372 2532 2985 420 518 1314 1188 24 16 2
4481 - Clothing Stores 16792 217 77 414 352 4723 5809 439 477 1915 2348 9 12 0
4482 - Shoe Stores 3265 27 12 74 47 890 1247 90 68 365 443 1 1 0
4483 - Jewellery, Luggage and Leather Goods Stores 4138 58 18 111 102 1038 1547 120 110 482 542 4 6 0
4511 - Sporting Goods, Hobby and Musical Instrument Stores 6113 82 31 170 119 1297 2102 200 191 760 1141 12 7 1
4512 - Book, Periodical and Music Stores 0 0 0 0 0 0 0 0 0 0 0 0 0 0
4521 - Department Stores 749 15 5 32 26 148 290 28 25 88 90 1 1 0
4529 - Other General Merchandise Stores 5688 163 30 207 184 1032 2262 205 260 563 752 7 12 11
4531 - Florists 1989 40 12 53 49 463 714 74 71 254 254 2 2 1
4532 - Office Supplies, Stationery and Gift Stores 4156 104 43 173 98 790 1482 142 122 486 687 10 11 8
4533 - Used Merchandise Stores 1569 31 10 82 53 255 600 56 45 166 267 3 1 0
4539 - Other Miscellaneous Store Retailers 6240 69 24 161 137 1497 2309 182 169 704 967 13 7 1
4541 - Electronic Shopping and Mail-Order Houses 977 5 3 12 12 149 451 43 18 83 198 1 1 1
4542 - Vending Machine Operators 456 11 2 13 26 113 140 15 16 69 51 0 0 0
4543 - Direct Selling Establishments 2708 69 26 162 95 489 810 104 196 397 336 10 12 2 Source: Statistics Canada: CANSIM & JCI

27
Table 41 Commodity Analysis - Part 1
Commodity Analysis for 2012
Part1 Total
commodities Food and beverages
Health and personal care
products
Clothing, footwear and accessories
Furniture, home furnishings and
electronics
Retail trade 468,431.7 110,219.4 42,081.7 37,538.6 38,305.0
Motor vehicle and parts dealers 22.5% 0.0% 0.0% 0.0% 0.0%
Furniture and home furnishings stores 3.3% 0.0% 0.0% 0.0% 33.6%
Electronics and appliance stores 3.0% 0.0% 0.0% 0.0% 32.0%
Building material and garden equipment and supplies dealers 5.8% 0.0% 0.0% 0.0% 6.1%
Food and beverage stores 22.5% 80.7% 13.9% 0.0% 0.0%
Health and personal care stores 7.1% 1.6% 69.8% 0.0% 1.5%
Gasoline stations 12.6% 0.0% 0.0% 0.0% 0.0%
Clothing and clothing accessories stores 5.7% 0.0% 0.7% 68.2% 0.6%
Sporting goods, hobby, book and music stores 2.4% 0.0% 0.1% 6.7% 1.0%
General merchandise stores 12.8% 14.3% 14.9% 21.8% 19.1%
Miscellaneous store retailers 2.3% 0.1% 0.2% 0.0% 5.4%
Source: Statistics Canada - CANSIM

28
Table 42 Commodity Analysis - Part 2
Commodity Analysis for 2012
Part2
Motor vehicle
s, parts,
service and
rental
Automotive fuels, oils and
additives (for
automotive and
recreational vehicles and farm equipmen
t)
Housewares (non-electric)
and household
supplies
Hardware, lawn
and garden
products
Sporting and
leisure goods
All other goods
and service
s
Retail trade 98,413.
1 54,066.8 8,617.0 30,564.5 13,482.
2 35,143.
3
Motor vehicle and parts dealers 97.3% 0.6% 0.0% 0.0% 0.0% 26.1%
Furniture and home furnishings stores 0.0% 0.0% 10.1% 0.3% 0.7% 2.2%
Electronics and appliance stores 0.1% 0.0% 0.1% 0.0% 0.0% 2.7%
Building material and garden equipment and supplies dealers 0.0% 0.0% 5.1% 75.7% 0.0% 2.9%
Food and beverage stores 0.0% 0.0% 25.8% 2.4% 0.0% 16.0%
Health and personal care stores 0.0% 0.0% 5.5% 0.0% 1.8% 2.3%
Gasoline stations 0.3% 94.4% 0.0% 0.0% 0.8% 11.4%
Clothing and clothing accessories stores 0.0% 0.0% 1.1% 0.0% 0.0% 1.3%
Sporting goods, hobby, book and music stores 0.0% 0.0% 0.0% 0.0% 49.1% 3.9%
General merchandise stores 2.1% 3.6% 49.8% 14.1% 33.1% 14.7%
Miscellaneous store retailers 0.0% 0.0% 0.0% 4.1% 4.0% 16.4%
Source: Statistics Canada - CANSIM

29
Table 43 Key Retailers of Commodity Groups
Key Retailers of Commodity Groups in 2012 Top Second Third
Name Share Name Share Name Share
Total commodities
Motor vehicle and parts dealers 22.5%
Food and beverage stores 22.5%
General merchandise stores 12.8%
Food and beverages
Food and beverage stores 80.7%
General merchandise stores 14.3%
Health and personal care stores 1.6%
Health and personal care products
Health and personal care stores 69.8%
General merchandise stores 14.9%
Food and beverage stores 13.9%
Clothing, footwear and accessories
Clothing and clothing accessories stores 68.2%
General merchandise stores 21.8%
Sporting goods, hobby, book and music stores 6.7%
Furniture, home furnishings and electronics
Furniture and home furnishings stores 33.6%
Electronics and appliance stores 32.0%
General merchandise stores 19.1%
Motor vehicles, parts, service and rental
Motor vehicle and parts dealers 97.3%
General merchandise stores 2.1% Gasoline stations 0.3%
Automotive fuels, oils etc. Gasoline stations 94.4%
General merchandise stores 3.6%
Motor vehicle and parts dealers 0.6%
Housewares and household supplies
General merchandise stores 49.8%
Food and beverage stores 25.8%
Furniture and home furnishings stores 10.1%
Hardware, lawn and garden products
Building material and garden equipment and supplies dealers 75.7%
General merchandise stores 14.1%
Miscellaneous store retailers 4.1%
Sporting and leisure goods
Sporting goods, hobby, book and music stores 49.1%
General merchandise stores 33.1%
Miscellaneous store retailers 4.0%
All other goods and services
Motor vehicle and parts dealers 26.1%
Miscellaneous store retailers 16.4%
Food and beverage stores 16.0%
Source: Statistics Canada - CANSIM
30
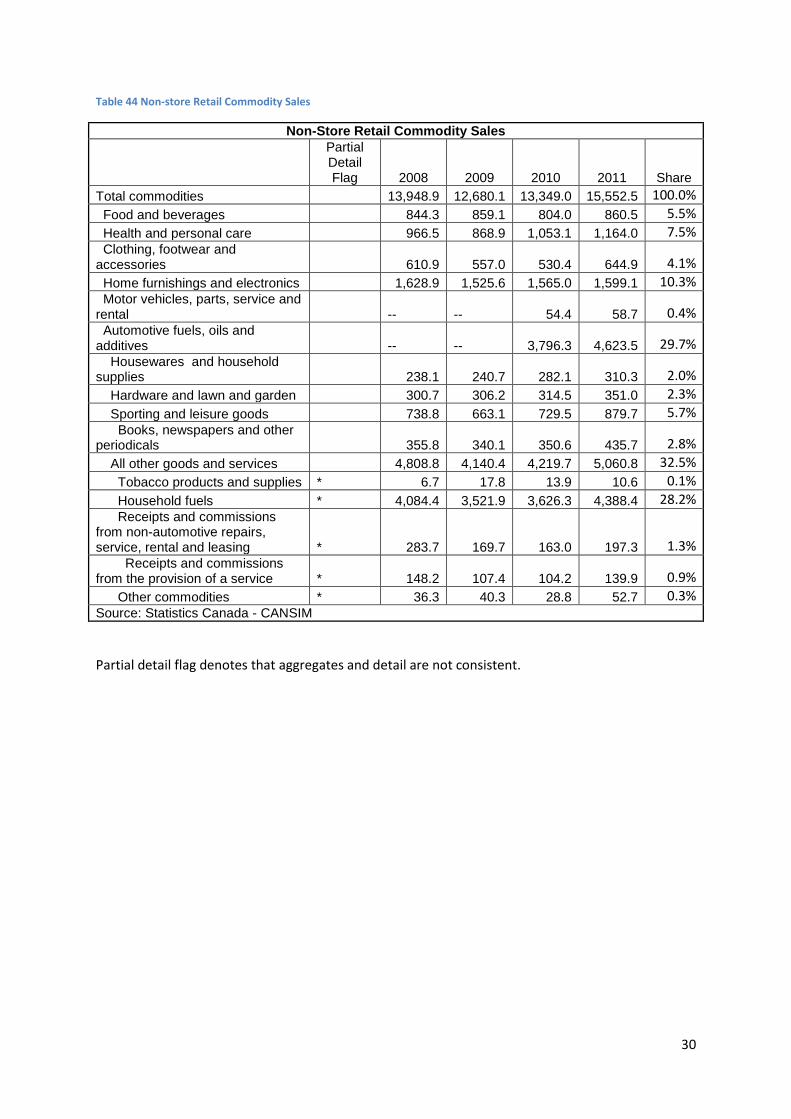
Table 44 Non-store Retail Commodity Sales
Non-Store Retail Commodity Sales
Partial Detail Flag 2008 2009 2010 2011 Share
Total commodities 13,948.9 12,680.1 13,349.0 15,552.5 100.0%
Food and beverages 844.3 859.1 804.0 860.5 5.5%
Health and personal care 966.5 868.9 1,053.1 1,164.0 7.5% Clothing, footwear and accessories 610.9 557.0 530.4 644.9 4.1%
Home furnishings and electronics 1,628.9 1,525.6 1,565.0 1,599.1 10.3% Motor vehicles, parts, service and rental -- -- 54.4 58.7 0.4% Automotive fuels, oils and additives -- -- 3,796.3 4,623.5 29.7% Housewares and household supplies 238.1 240.7 282.1 310.3 2.0%
Hardware and lawn and garden 300.7 306.2 314.5 351.0 2.3%
Sporting and leisure goods 738.8 663.1 729.5 879.7 5.7% Books, newspapers and other periodicals 355.8 340.1 350.6 435.7 2.8%
All other goods and services 4,808.8 4,140.4 4,219.7 5,060.8 32.5%
Tobacco products and supplies * 6.7 17.8 13.9 10.6 0.1%
Household fuels * 4,084.4 3,521.9 3,626.3 4,388.4 28.2% Receipts and commissions from non-automotive repairs, service, rental and leasing * 283.7 169.7 163.0 197.3 1.3% Receipts and commissions from the provision of a service * 148.2 107.4 104.2 139.9 0.9%
Other commodities * 36.3 40.3 28.8 52.7 0.3% Source: Statistics Canada - CANSIM
Partial detail flag denotes that aggregates and detail are not consistent.

31
Table 45 Alternative Population Projections
Alternative Population Projections
2010 2020 2030 2040
Total Population (000)
L 34,103 36,928 39,130 40,709
M3 34,138 38,021 41,731 45,163
H 34,164 39,118 44,431 49,940
65+(000)
L 4,820 6,754 9,106 10,201
M3 4,823 6,849 9,413 10,834
H 4,826 6,941 9,710 11,449
Share 65+
L 14.1% 18.3% 23.3% 25.1%
M3 14.1% 18.0% 22.6% 24.0%
H 14.1% 17.7% 21.9% 22.9% Source: Statistics Canada, 91-520, CANSIM
Table 46 Average Income of Households
Average income (dollars) of Households (K$2010)
1990 1995 2000 2005 2010 AAGR 2000-2010
Canada 50,200 47,700 53,000 56,600 61,200 1.4%
Atlantic provinces 44,800 41,700 45,500 47,800 52,700 1.5%
Newfoundland and Labrador 44,900 41,300 44,600 47,000 55,800 2.3%
Prince Edward Island 43,900 42,400 44,700 48,000 52,100 1.5%
Nova Scotia 45,700 41,500 45,900 49,000 51,600 1.2%
New Brunswick 43,800 42,100 45,700 46,800 52,000 1.3%
Quebec 44,300 41,800 45,700 48,400 52,300 1.4%
Ontario 56,200 53,200 61,200 63,000 66,000 0.8%
Prairie provinces 48,500 46,900 52,300 59,000 67,600 2.6%
Manitoba 45,900 44,600 47,600 51,100 56,700 1.8%
Saskatchewan 43,800 42,800 45,600 50,800 60,600 2.9%
Alberta 51,400 49,300 56,200 64,000 72,900 2.6%
British Columbia 50,000 48,200 49,400 55,800 60,600 2.1% Source: Statistics Canada - CANSIM - 202-601

32
Table 47 Median Income of Households
Median income (dollars) of Households (K$2010)
1990 1995 2000 2005 2010 AAGR 2000-2010
Canada 43,800 41,100 43,400 46,500 49,300 1.3%
Atlantic provinces 39,600 37,100 38,300 40,400 44,000 1.4%
Newfoundland and Labrador 39,900 37,200 37,100 39,000 44,800 1.9%
Prince Edward Island 38,700 39,100 37,200 41,700 44,700 1.9%
Nova Scotia 39,800 36,600 38,400 40,900 43,800 1.3%
New Brunswick 39,200 37,100 39,200 40,400 43,600 1.1%
Quebec 39,000 36,700 38,000 40,400 43,200 1.3%
Ontario 49,300 45,400 50,000 52,400 53,700 0.7%
Prairie provinces 42,400 40,600 43,800 48,800 55,400 2.4%
Manitoba 41,200 38,700 40,500 43,600 47,600 1.6%
Saskatchewan 37,900 36,600 38,700 41,400 50,200 2.6%
Alberta 45,000 42,800 47,500 53,800 59,800 2.3%
British Columbia 43,600 41,600 41,300 46,000 48,300 1.6% Source: Statistics Canada - CANSIM - 202-601
Table 48 Summary After-tax Family Income Measures
Summary After-tax Family Income Measures ($2010)
All Family Units 1990 1995 2000 2005 2010
Average Income 50,200 47,700 53,000 56,600 61,200
Median Income 43,800 41,100 43,400 46,500 49,300
Average/Median 1.15 1.16 1.22 1.22 1.24
Share (%) of All Family Units for After-tax Income ($2010)
Over 100K 7.6 6.5 9.8 12.4 15.1
Over 150K 1.4 1.2 2.6 3.3 4.3
Under 20K 18.2 20.0 18.7 17.3 14.9 Source: Statistics Canada - CANSIM - 202-601

33
Table 49 Average Household Expenditure by Quintile
Summary of Average Household Expenditure - 2011 - Canada Selected Categories Total Quintile1 Quintile2 Quintile3 Quintile4 Quintile5
Estimated number of households (000) 13,514 2,701 2,704 2,703 2,703 2,703
Household size 2.48 1.47 2.10 2.57 2.90 3.34
Household income before tax 77,269 17,312 37,937 60,559 90,855 179,659
Homeowner at time of interview 66.8% 35.1% 54.7% 69.5% 82.9% 92.0%
Vehicle owner at time of interview 83.2% 53.5% 81.0% 90.6% 94.0% 97.1%
Total expenditure 73,457 29,129 45,057 62,941 86,682 143,519
Total current consumption 55,151 27,645 40,029 51,759 65,482 90,886
Food purchased from stores 5,588 3,134 4,667 5,421 6,593 8,133
Shelter 15,198 9,257 11,566 14,202 17,474 23,491
Household operation 4,135 2,154 2,925 3,840 4,972 6,790
of which Pet expenses 644 409 409 557 752 1,096
of which Household cleaning supplies and equipment 225 139 187 216 287 295
of which Paper, plastic and foil household supplies 314 166 254 292 384 474
of which Garden supplies and services 414 146 222 336 610 760
Household furnishings and equipment 2,027 807 1,477 1,747 2,375 3,732
Clothing and accessories 3,360 1,333 2,197 3,165 3,986 6,118
Transportation 11,229 4,595 7,392 11,068 14,189 18,912
of which Automotive accessories 12 2 10 11 20 19
of which Gas and other fuels 2,606 1,120 1,864 2,699 3,415 3,940
Health care 2,211 1,186 2,010 2,273 2,429 3,155
of which Direct costs to household 1,584 935 1,541 1,567 1,645 2,234
of which Medicines, drugs and pharmaceutical products prescribed 476 365 560 522 412 522
of which Other medicines and pharmaceutical products and health care supplies 358 205 381 344 373 484
of which Prescription eye wear 626 251 469 706 784 921
of which Other eye care goods and non-prescription eyewear 1,082 609 844 897 1,257 1,805
of which Health insurance premiums 140 71 121 132 171 206
Personal care 24 10 10 18 28 55
of which Personal care preparations 681 364 518 572 809 1,143
of which Personal care services 401 245 326 325 448 662
Recreation 3,711 1,354 2,320 3,396 4,624 6,865
of which Recreation equipment and rel. services 862 300 523 820 1,073 1,598
of which Home entertainment equipment and services 413 208 292 390 509 666
of which Recreation services 1,750 746 1,204 1,464 2,081 3,253
of which Recreational vehicles and associated services 686 100 301 721 962 1,348
of which Purchase of recreational vehicles 494 73 196 581 754 865
Education 1,216 738 721 880 1,338 2,402
Reading materials and other printed matter 221 117 156 185 220 427
Tobacco products and alcoholic beverages 1,199 595 799 1,222 1,503 1,879
Games of chance 166 107 161 168 173 222
Miscellaneous expenditures 1,602 680 1,131 1,213 1,829 3,154

34
Summary of Average Household Expenditure - 2011 - Canada Selected Categories Total Quintile1 Quintile2 Quintile3 Quintile4 Quintile5
Income taxes 12,442 348 2,272 6,394 13,232 39,960
Personal insurance payments and pension contributions 4,191 437 1,594 3,493 6,009 9,423
Gifts of money, alimony and contributions to charity 1,673 699 1,162 1,294 1,958 3,250
Retail-related exp excl Autos etc 17,841 8,687 13,295 16,845 21,287 29,115
As a share of total consumption 32.3% 31.4% 33.2% 32.5% 32.5% 32.0%
As a share of total expenditure 24.3% 29.8% 29.5% 26.8% 24.6% 20.3%
as a share of total income 23.1% 50.2% 35.0% 27.8% 23.4% 16.2% Source: Statistics Canada 62F00032X
Table 50 Consumption Relationships 2011
Consumption Relationships -2011 - Canada
Total Quintile1 Quintile2 Quintile3 Quintile4 Quintile5
Income 77,269 17,312 37,937 60,559 90,855 179,659
Expenditure 73,457 29,129 45,057 62,941 86,682 143,519
Consumption 55,151 27,645 40,029 51,759 65,482 90,886
As a share of Income 71.4% 159.7% 105.5% 85.5% 72.1% 50.6%
Non-Auto Retail Consumption 17,841 8,687 13,295 16,845 21,287 29,115
As a share of Income 23.1% 50.2% 35.0% 27.8% 23.4% 16.2% Source: Statistics Canada - CANSIM
Table 51 Household Consumption Shares
Household Consumption Shares - 2011 - Canada
Total Quintile1 Quintile2 Quintile3 Quintile4 Quintile5
Retail-related exp excl Autos etc 32.3% 31.4% 33.2% 32.5% 32.5% 32.0%
Health 4.0% 4.3% 5.0% 4.4% 3.7% 3.5%
Transportation 20.4% 16.6% 18.5% 21.4% 21.7% 20.8%
Shelter 27.6% 33.5% 28.9% 27.4% 26.7% 25.8%
Other 15.7% 14.2% 14.4% 14.2% 15.4% 17.8% Source: Statistics Canada - CANSIM
Table 52 Shares of Consumption 2011
Shares of Consumption - 2011
Total Quintile
1 Quintile
2 Quintile
3 Quintile
4 Quintile
5 Household furnishings and equipment 3.7% 2.9% 3.7% 3.4% 3.6% 4.1%
Clothing and accessories 6.1% 4.8% 5.5% 6.1% 6.1% 6.7% Recreation equipment and rel. services 1.6% 1.1% 1.3% 1.6% 1.6% 1.8% Home entertainment equipment and services 0.7% 0.8% 0.7% 0.8% 0.8% 0.7% Source: Statistics Canada - CANSIM

35
Table 53 Average Household Expenditure by Household Type
Summary of Average Household Expenditure - 2011 - Canada Household Type
Selected Categories All
classes
One person
households
Couples without children
Couples
with children
Couples with other related or unrelated persons
Lone-parent
households with no
additional persons
Other households with related
or unrelated persons
Estimated number of households (000) 13,514 3,729 3,740 3,670 636 834 905
Household size 2.48 1.00 2.00 3.93 4.93 2.65 2.79
Household income before tax 77,269 38,341 84,056 108,721 120,824 53,246 73,583
Homeowner at time of interview 66.8% 46.0% 77.7% 81.7% 80.6% 54.8% 48.8%
Vehicle owner at time of interview 83.2% 63.2% 92.6% 95.5% 93.2% 75.1% 77.6%
Total expenditure 73,457 40,915 76,725 102,536 105,858 56,954 68,180
Total current consumption 55,151 31,830 56,089 75,543 80,873 47,322 53,435
Food purchased from stores 5,588 2,851 5,761 7,958 8,102 5,111 5,062
Shelter 15,198 10,676 14,434 19,499 23,294 13,453 15,465
Household operation 4,135 2,233 3,982 6,018 5,588 4,287 3,810
of which Pet expenses 644 364 786 756 542 822 672
of which Household cleaning supplies and equipment 225 121 224 339 308 201 147
of which Paper, plastic and foil household supplies 314 160 353 417 451 318 268
of which Garden supplies and services 414 210 575 528 361 306 271
Household furnishings and equipment 2,027 1,001 2,363 2,737 2,955 1,533 1,777
Clothing and accessories 3,360 1,556 3,028 4,895 6,546 3,263 3,791
Transportation 11,229 5,345 11,955 16,147 17,806 8,341 10,503
of which Automotive accessories 12 F 9 27 28 8 F
of which Gas and other fuels 2,606 1,251 2,801 3,787 3,595 2,232 2,175
Health care 2,211 1,377 2,753 2,539 2,702 1,680 2,222
of which Direct costs to household 1,584 1,027 1,970 1,750 1,948 1,213 1,708
of which Medicines, drugs and pharmaceutical products prescribed 476 327 619 462 688 380 504
of which Other medicines and pharmaceutical 358 226 448 386 478 321 365

36
Summary of Average Household Expenditure - 2011 - Canada Household Type
Selected Categories All
classes
One person
households
Couples without children
Couples
with children
Couples with other related or unrelated persons
Lone-parent
households with no
additional persons
Other households with related
or unrelated persons
products and health care supplies
of which Prescription eye wear 626 350 782 789 755 467 515
of which Other eye care goods and non-prescription eyewear 1,082 617 1,223 1,444 1,353 936 872
of which Health insurance premiums 140 82 166 175 153 103 156
Personal care 24 13 31 27 F F F
of which Personal care preparations 681 311 687 1,008 1,000 607 668
of which Personal care services 401 306 536 436 353 329 205
Recreation 3,711 2,068 4,009 5,378 4,266 2,847 2,826
of which Recreation equipment and rel. services 862 388 704 1,533 1,042 728 696
of which Home entertainment equipment and services 413 270 374 572 607 359 429
of which Recreation services 1,750 1,064 1,970 2,302 2,177 1,395 1,430
of which Recreational vehicles and associated services 686 346 962 970 440 365 272
of which Purchase of recreational vehicles 494 272 610 759 310 256 199
Education 1,216 491 547 2,338 2,168 1,252 1,713
Reading materials and other printed matter 221 148 260 278 230 174 161
Tobacco products and alcoholic beverages 1,199 789 1,525 1,338 1,158 927 1,245
Games of chance 166 129 239 136 146 172 158
Miscellaneous expenditures 1,602 1,095 1,718 1,902 2,129 1,501 1,726
Income taxes 12,442 5,710 14,506 18,765 17,041 5,751 8,945
Personal insurance payments and pension contributions 4,191 1,734 3,966 6,786 6,295 2,991 4,355
Gifts of money, alimony and 1,673 1,641 2,164 1,442 1,649 890 1,444

37
Summary of Average Household Expenditure - 2011 - Canada Household Type
Selected Categories All
classes
One person
households
Couples without children
Couples
with children
Couples with other related or unrelated persons
Lone-parent
households with no
additional persons
Other households with related
or unrelated persons
contributions to charity
Retail-related exp excl Autos etc 17,841 9,395 19,050 24,604 25,284 15,738 16,616
As a share of total consumption 32.3% 29.5% 34.0% 32.6% 31.3% 33.3% 31.1% As a share of total expenditure 24.3% 23.0% 24.8% 24.0% 23.9% 27.6% 24.4% as a share of total income 23.1% 24.5% 22.7% 22.6% 20.9% 29.6% 22.6% Source: Statistics Canada 62F00032X
Table 54 Household Consumption Shares by Type
Household Consumption Shares - 2011
All classes
One person
households
Couple
s withou
t childre
n
Couples with childre
n
Couples
with other
related or
unrelated
persons
Lone-parent
households with
no additional persons
Other households with
related or unrelated persons
Retail-related exp excl Autos etc 32.3% 29.5% 34.0% 32.6% 31.3% 33.3% 31.1%
Health 4.0% 4.3% 4.9% 3.4% 3.3% 3.6% 4.2%
Transportation 20.4% 16.8% 21.3% 21.4% 22.0% 17.6% 19.7%
Shelter 27.6% 33.5% 25.7% 25.8% 28.8% 28.4% 28.9%
Other 15.7% 15.8% 14.1% 16.9% 14.6% 17.1% 16.1% Source: Statistics Canada - CANSIM

38
Table 55 Consumption Relationships by Household Type
Consumption Relationships -2011
All
classes
One person
households
Couples without children
Couples with
children
Couples with other
related or
unrelated persons
Lone-parent
households with no additional persons
Other household
s with related or unrelated persons
Income 77,269 38,341 84,056 108,721 120,824 53,246 73,583
Expenditure 73,457 40,915 76,725 102,536 105,858 56,954 68,180
Consumption 55,151 31,830 56,089 75,543 80,873 47,322 53,435
As a share of Income 71.4% 83.0% 66.7% 69.5% 66.9% 88.9% 72.6%
Non-Auto Retail Consumption 17,841 9,395 19,050 24,604 25,284 15,738 16,616
As a share of Income 23.1% 24.5% 22.7% 22.6% 20.9% 29.6% 22.6% Source: Statistics Canada - CANSIM
Table 56 Consumption Relationships by Age
Consumption Relationships -2011
All
classes Less than 30
years 30 to 39
years 40 to 54
years 55 to 64
years 65 years and over
Income 77,269 59,786 75,916 96,392 82,785 53,841
Expenditure 73,457 63,640 79,258 89,965 75,177 47,810
Consumption 55,151 51,177 61,551 65,176 54,603 37,717
As a share of Income 71.4% 85.6% 81.1% 67.6% 66.0% 70.1%
Non-Auto Retail Consumption 17,841 15,092 19,359 20,919 18,129 13,187
As a share of Income 23.1% 25.2% 25.5% 21.7% 21.9% 24.5% Source: Statistics Canada - CANSIM

39
Table 57 Household Consumption Shares by Age
Household Consumption Shares - 2011
All
classes Less than 30
years 30 to 39
years 40 to 54
years 55 to 64
years 65 years and over
Retail-related exp excl Autos etc 32.3% 29.5% 31.5% 32.1% 33.2% 35.0%
Health 4.0% 2.6% 3.0% 3.5% 4.7% 6.8%
Transportation 20.4% 20.7% 19.6% 20.9% 21.7% 17.9%
Shelter 27.6% 29.5% 30.0% 27.2% 25.4% 26.9%
Other 15.7% 17.7% 16.0% 16.3% 15.0% 13.4% Source: Statistics Canada - CANSIM
Table 58 Shares of Consumption by Age
Shares of Consumption - 2011
All classe
s Less than 30 years
30 to 39 years
40 to 54 years
55 to 64 years
65 years and over
Household furnishings and equipment 3.7% 4.1% 3.7% 3.6% 4.0% 3.2%
Clothing and accessories 6.1% 6.6% 6.7% 6.4% 5.6% 4.8% Recreation equipment and rel. services 1.6% 1.9% 1.9% 1.7% 1.4% 0.9% Home entertainment equipment and services 0.7% 1.0% 0.8% 0.8% 0.7% 0.5% Source: Statistics Canada - CANSIM

40
Table 59 Household Structure by Age
Summary of Average Household Structure - 2011 - Canada - Age
Selected Categories
All classes
Less than 30
years 30 to
39 years 40 to
54 years 55 to
64 years
65 years
and over Estimated number of households (000) 13,514 1,481 2,219 4,397 2,477 2,939
Household size 2.5 2.2 3.0 3.0 2.2 1.7
Age of reference person 50.9 25.6 34.6 47.2 59.1 74.5
Household income before tax 77,269 59,786 75,916 96,392 82,785 53,841
Homeowner at time of interview 66.8% 34.2% 58.3% 73.5% 75.3% 72.6%
Vehicle owner at time of interview 83.2% 74.5% 83.7% 87.1% 88.9% 76.7% Household Type
One-person households 27.6% 27.9% 22.0% 20.2% 28.0% 42.3%
Couples only 27.7% 29.5% 15.5% 16.4% 39.4% 43.0%
Couples with children only 27.2% 18.0% 43.6% 42.3% 18.3% 4.1%
Couples with other related or unrelated persons 4.7% 3.9% 5.4% 6.1% 4.4% 2.7%
Lone-parent households 6.2% 3.2% 6.8% 9.1% 5.4% 3.4%
Other households with related or unrelated persons 6.7% 17.5% 6.7% 5.8% 4.5% 4.4% Household Structure
With children under 5 years 10.6% 22.6% 34.2% 6.7% F F
With children aged 5 to 15 years 19.0% 6.4% 38.9% 34.0% 3.8% F
With adults aged 16 and 17 years 5.6% F 3.9% 12.6% 3.5% F
With adults aged 18 to 64 years 82.8% 99.9% 100.0% 100.0% 100.0% 20.9%
With adults aged 65 years and over 25.5% F 3.0% 4.0% 10.0% 100.0%
With no full-time earner 46.9% 44.7% 28.9% 29.6% 45.5% 88.6%
With one full-time earner 35.6% 38.6% 50.2% 43.3% 37.6% 9.6%
With two or more full-time earners 17.6% 16.8% 20.9% 27.0% 16.9% 1.8% Age of reference person
Under 25 years 3.2% 28.9% … … … …
25 to 44 years 34.6% 71.1% 100.0% 32.0% … …
45 to 64 years 40.5% … … 68.0% 100.0% …
65 years or older 21.7% … … … … 100.0% Source: Statistics Canada 62F00032X

41
Table 60 Household Characteristics by Income
Summary of Average Household Characteristics - 2011 - Canada
Selected Categories Total Quintile1 Quintile2 Quintile3 Quintile4 Quintile5
Estimated number of households (000) 13,514 2,701 2,704 2,703 2,703 2,703
Household size 2.5 1.5 2.1 2.6 2.9 3.3
Age of reference person 50.9 54.8 54.0 49.1 47.5 49.1
Household income before tax 77,269 17,312 37,937 60,559 90,855 179,659
Homeowner at time of interview 66.8% 35.1% 54.7% 69.5% 82.9% 92.0%
Vehicle owner at time of interview 83.2% 53.5% 81.0% 90.6% 94.0% 97.1% Household Type
One-person households 27.6% 68.4% 35.1% 18.7% 11.1% 4.8%
Couples only 27.7% 14.1% 31.3% 33.2% 30.5% 29.3%
Couples with children only 27.2% 5.4% 15.9% 26.6% 39.8% 48.1%
Couples with other related or unrelated persons 4.7% F 1.7% 5.5% 6.5% 9.6%
Lone-parent households 6.2% 8.0% 8.6% 7.3% 4.7% 2.4%
Other households with related or unrelated persons 6.7% 3.9% 7.5% 8.8% 7.4% 5.9% Household Structure
With children under 5 years 10.6% 4.0% 9.6% 12.7% 14.6% 11.9%
With children aged 5 to 15 years 19.0% 6.4% 14.6% 19.6% 25.0% 29.3%
With adults aged 16 and 17 years 5.6% 1.5% 3.5% 5.2% 7.5% 10.5%
With adults aged 18 to 64 years 82.8% 68.1% 72.1% 86.1% 92.8% 94.7%
With adults aged 65 years and over 25.5% 35.0% 36.7% 24.3% 16.4% 14.9%
With no full-time earner 46.9% 93.5% 69.0% 39.8% 22.3% 9.9%
With one full-time earner 35.6% 6.2% 29.2% 51.9% 50.2% 40.2%
With two or more full-time earners 17.6% F 1.8% 8.3% 27.5% 49.9% Age of reference person
Under 25 years 3.2% 6.5% 3.8% 2.5% 1.8% F
25 to 44 years 34.6% 26.5% 30.1% 40.8% 42.1% 33.6%
45 to 64 years 40.5% 32.8% 32.3% 36.7% 45.2% 55.3%
65 years or older 21.7% 34.2% 33.9% 19.9% 10.9% 9.9% Source: Statistics Canada 62F00032X

42
Table 61 Household Characteristics by Type
Summary of Average Household Characteristics- 2011 - Canada - HT
Selected Categories All classes
One person
households
Couple
s withou
t childre
n
Couples with
children
Couples
with other
related or
unrelated
persons
Lone-parent
households with
no addition
al persons
Other households with related
or unrelate
d persons
Estimated number of households (000) 13,514 3,729 3,740 3,670 636 834 905
Household size 2.5 1.0 2.0 3.9 4.9 2.7 2.8
Age of reference person 50.9 55.2 55.8 44.4 47.9 49.1 43.4
Household income before tax 77,269 38,341 84,056 108,721 120,824 53,246 73,583
Homeowner at time of interview 66.8% 46.0% 77.7% 81.7% 80.6% 54.8% 48.8% Vehicle owner at time of interview 83.2% 63.2% 92.6% 95.5% 93.2% 75.1% 77.6% Household Structure
With children under 5 years 10.6% … … 29.4% 28.2% 11.7% 8.0% With children aged 5 to 15 years 19.0% … … 50.2% 41.5% 43.2% 11.0% With adults aged 16 and 17 years 5.6% … F 15.1% 12.2% 11.7% 3.3% With adults aged 18 to 64 years 82.8% 66.6% 72.3% 100.0% 98.8% 99.5% 96.3% With adults aged 65 years and over 25.5% 33.4% 37.9% 4.0% 44.5% 12.0% 27.3%
With no full-time earner 46.9% 71.8% 49.9% 22.2% 26.3% 51.6% 42.1%
With one full-time earner 35.6% 28.2% 30.9% 44.6% 43.3% 44.1% 35.0% With two or more full-time earners 17.6% … 19.1% 33.3% 30.5% F 22.8% Age of reference person
Under 25 years 3.2% 3.2% 2.3% 1.1% F 1.6% 17.4%
25 to 44 years 34.6% 29.2% 22.3% 50.5% 40.5% 38.5% 35.8%
45 to 64 years 40.5% 34.3% 41.6% 45.2% 44.7% 47.8% 32.4%
65 years or older 21.7% 33.4% 33.8% 3.3% 12.6% 12.0% 14.4% Source: Statistics Canada 62F00032X

43
Table 62 Economic Impacts of Retail - Summary
Input-Output Analysis of the Economic Influences of Retail
Open Direct +Indirect Allocation
Additional Impact
Induced through Re-
spent Wages
Total Effect with Re-Spent Wages
($000)
Initial Shock 1,000,000
Less Final Demand Indirect Taxes Paid to Government 110,649
Flowing to Economy as Final Expenditures after initial taxes 889,351 256,434 1,145,785
Less Final Expenditure Imports - 248,790 -32,305 -281,095
Less Imported Inputs to Domestic Production -85,931 -21,848 -107,778
Domestic GDP at Market Price (excluding initial taxes) 554,631 202,282 756,912
Indirect taxes on products (final expenditures) 0 20,871 20,871
Indirect taxes on products (intermediate inputs) 7,435 2,687 10,121
Indirect taxes on products (import duties) 7,636 806 8,442
Subsidies on products (intermediate inputs) -7,069 -2,875 -9,944
GDP at basic prices 546,629 180,793 727,423
Subsidies on production -471 -97 -568
Indirect taxes on production 22,332 13,372 35,704
Wages and salaries 290,125 75,783 365,908
Supplementary labour income 34,978 9,077 44,056
Mixed income 24,876 17,168 42,044
Other operating surplus 174,789 65,491 240,280
Memo Items
Domestic GDP at Market Prices including taxes 665,280 202,282 867,561
Net Indirect Taxes Received by Government 140,511 34,763 175,274
Total Imports - 334,720 - 54,152 - 388,873
Direct Import Share (after initial Final Demand Taxes) -28.0% -12.6% -24.5%
Total Import Share (after initial FD Taxes) -37.6% -21.1% -33.9% Full-time, Part-Time and Temporary Jobs 8,766 2,230 10,996
Full-Time Equivalent Labout Inputs 7,493 1,881 9,374
FTE Per $Million of Initial Shock 7.49 1.88 9.37
Note: Shock is patterned after 2008 goods-related final demand excluding cars and gasoline
Source: Statistics Canada Input-Output Model, JCI calcutations

44
Table 63 GDP and Job Implications of Retail Expenditure
GDP & Job Implications of Retail Expenditure In Canada
Implications of a Shock of $1 billion on non-automobile expenditure by persons
GDP at Basic Prices FTE Jobs
Direct Direct + Indirect
Direct + Indirect Share Direct
Direct + Indirect
Direct + Indirect Share
Crop and Animal Production 4,424 19,151 3.5% 77 358 4.8%
Forestry and Logging 34 657 0.1% 0 6 0.1%
Fishing, Hunting and Trapping 442 643 0.1% 6 8 0.1% Support Activities for Agriculture and forestry 28 721 0.1% 0 17 0.2% Mining and Oil and Gas Extraction 290 12,390 2.3% 2 16 0.2%
Utilities 4,539 12,517 2.3% 12 34 0.4%
Construction 3 4,011 0.7% 0 52 0.7%
Manufacturing 67,719 93,686 17.1% 671 931 12.4%
Wholesale Trade 54,512 68,008 12.4% 597 745 9.9%
Retail Trade 177,556 183,282 33.5% 3,341 3,448 46.0% Transportation and Warehousing 8,168 25,195 4.6% 106 343 4.6% Information and Cultural Industries 5,001 18,439 3.4% 52 151 2.0% Finance, Insurance, Real Estate and Rental and Leasing 1,207 44,451 8.1% 9 278 3.7% Professional, Scientific and Technical Services 1,883 22,362 4.1% 27 313 4.2% Administrative and Support, Waste Management and Remediation Services 153 16,616 3.0% 3 318 4.2%
Educational Services 0 758 0.1% 0 21 0.3% Health Care and Social Assistance 0 442 0.1% 0 5 0.1% Arts, Entertainment and Recreation 553 1,393 0.3% 14 35 0.5% Accommodation and Food Services 744 3,976 0.7% 17 97 1.3% Other Services (Except Public Administration) 8,589 12,015 2.2% 183 251 3.3% Operating, Office, Cafeteria and Laboratory Supplies 0 0 0.0% 0 0 0.0% Travel, Entertainment, Advertising and Promotion 0 0 0.0% 0 0 0.0%
Transportation Margins 0 0 0.0% 0 0 0.0% Non-Profit Institutions Serving Households 0 71 0.0% 0 1 0.0%
Government Sector 948 5,845 1.1% 11 65 0.9%
Totals 336,793 546,629 100.0% 5,128 7,493 100.0% Note: Shock is patterned after 2008 goods-related final demand excluding cars and gasoline
Source: Statistics Canada Input-Output Model, JCI calcutations