the strategic implications of scale in choice-based
TRANSCRIPT

This article was downloaded by: [74.104.133.83] On: 11 December 2019, At: 07:29Publisher: Institute for Operations Research and the Management Sciences (INFORMS)INFORMS is located in Maryland, USA
Marketing Science
Publication details, including instructions for authors and subscription information:http://pubsonline.informs.org
The Strategic Implications of Scale in Choice-BasedConjoint AnalysisJohn R. Hauser, Felix Eggers, Matthew Selove
To cite this article:John R. Hauser, Felix Eggers, Matthew Selove (2019) The Strategic Implications of Scale in Choice-Based Conjoint Analysis.Marketing Science 38(6):1059-1081. https://doi.org/10.1287/mksc.2019.1178
Full terms and conditions of use: https://pubsonline.informs.org/Publications/Librarians-Portal/PubsOnLine-Terms-and-Conditions
This article may be used only for the purposes of research, teaching, and/or private study. Commercial useor systematic downloading (by robots or other automatic processes) is prohibited without explicit Publisherapproval, unless otherwise noted. For more information, contact [email protected].
The Publisher does not warrant or guarantee the article’s accuracy, completeness, merchantability, fitnessfor a particular purpose, or non-infringement. Descriptions of, or references to, products or publications, orinclusion of an advertisement in this article, neither constitutes nor implies a guarantee, endorsement, orsupport of claims made of that product, publication, or service.
Copyright © 2019, The Author(s)
Please scroll down for article—it is on subsequent pages
With 12,500 members from nearly 90 countries, INFORMS is the largest international association of operations research (O.R.)and analytics professionals and students. INFORMS provides unique networking and learning opportunities for individualprofessionals, and organizations of all types and sizes, to better understand and use O.R. and analytics tools and methods totransform strategic visions and achieve better outcomes.For more information on INFORMS, its publications, membership, or meetings visit http://www.informs.org

MARKETING SCIENCEVol. 38, No. 6, November–December 2019, pp. 1059–1081
http://pubsonline.informs.org/journal/mksc ISSN 0732-2399 (print), ISSN 1526-548X (online)
The Strategic Implications of Scale in Choice-BasedConjoint AnalysisJohn R. Hauser,a Felix Eggers,b Matthew Selovec
a Sloan School of Management, Massachusetts Institute of Technology, Cambridge, Massachusetts 02142; b Faculty of Economics andBusiness, University of Groningen, 9747 AE Groningen, Netherlands; cThe George L. Argyros School of Business and Economics,Chapman University, Orange, California 92866Contact: [email protected], http://orcid.org/0000-0001-8510-8640 (JRH); [email protected], https://orcid.org/0000-0001-9753-1227 (FE);[email protected], http://orcid.org/0000-0001-6706-0049 (MS)
Received: October 3, 2017Revised: June 19, 2018; November 9, 2018;March 8, 2019; April 26, 2019Accepted: May 5, 2019Published Online in Articles in Advance:November 14, 2019
https://doi.org/10.1287/mksc.2019.1178
Copyright: © 2019 The Author(s)
Abstract. Choice-based conjoint (CBC) studies have begun to rely on simulators to forecastequilibrium prices for pricing, strategic product positioning, and patent/copyright val-uations. Whereas CBC research has long focused on the accuracy of estimated relativepartworths of attribute levels, predicted equilibrium prices and strategic positioningare surprisingly and dramatically dependent on scale: the magnitude of the partworths(including the price coefficient) relative to the magnitude of the error term. Althoughthe impact of scale on the ability to estimate heterogeneous partworths is well known,neither the literature nor current practice address the sensitivity of pricing and posi-tioning to scale. This sensitivity is important because (estimated) scale depends on seeminglyinnocuous market-research decisions such as whether attributes are described by text or byrealistic images. We demonstrate the strategic implications of scale using a stylized model inwhich heterogeneity is modeled explicitly. If a firm shirks on the quality of a CBC study andacts on incorrectly observed scale, a follower, but not an innovator, can make costlystrategic errors. Externally valid estimates of scale are extremely important. We dem-onstrate empirically that image realism and incentive alignment affect scale sufficientlyto change strategic decisions and affect patent/copyright valuations by hundreds ofmillions of dollars.
History: Yuxin Chen served as the senior editor and Carl Mela served as associate editor for this article.Open Access Statement: This work is licensed under a Creative Commons Attribution 4.0 International
License. You are free to copy, distribute, transmit and adapt this work, but youmust attribute this workas “Marketing Science. Copyright © 2019 The Author(s). https://doi.org/10.1287/mksc.2019.1178, usedunder a Creative Commons Attribution License: https://creativecommons.org/licenses/by/4.0/.”
Supplemental Material: Data files and the online appendices are available at https://doi.org/10.1287/mksc.2019.1178.
Keywords: conjoint analysis • market research • choice models • scale
1. Scale Affects Strategic DecisionsWith an estimated 18,000 applications per year, conjointanalysis is one of the most-used quantitative marketresearch methods (Orme 2014, Sawtooth Software2015). Over 80% of these conjoint applications arechoice based (Sawtooth Software 2016). Firms rou-tinely use choice-based conjoint (CBC) analysis toidentify preferred product attributes in the hopes ofmaximizing profit—for example, General Motors alonespends tens of millions of dollars each year (Urbanand Hauser 2004). CBC analysis is increasingly usedin litigation, and courts have awarded billion-dollarjudgments for patent or copyright infringement basedon CBC studies (Mintz 2012, Cameron et al. 2013,McFadden 2014).
Research in CBC analysis has long focused onthe ability to estimate accurate relative trade-offsamong product attribute levels. Improved question
selection, improved estimation, and techniques suchas incentive alignment all enhance accuracy of iden-tified relative trade-offs and lead to better managerialdecisions. However, with the advancement of CBCsimulators and faster computers, researchers havebegun to use CBC studies to estimate price equilibriaand the resulting equilibrium profits (e.g., Allenbyet al. 2014). This use of CBC analysis raises a newconcern because, as shown in this paper, the calculatedprice equilibria depend critically on “scale,” wherescale is the magnitude of the partworths (includingthe price partworths) relative to the magnitude of theerror.1 Whereas the literature has long focused onthe impact of scale heterogeneity in CBC estimation,our focus is on a common scale factor in CBC studies.For example, we demonstrate that scale can be quitedifferent if we use realistic images rather than text-only stimuli or if we use incentive alignment rather
1059
than no incentive alignment. (The goal of realism isto represent better choices made by consumers in themarketplace.)
Our research combines formal modeling to un-derstand the phenomena and empirical CBC studiesthat vary on the realism of the stimuli and on incentivealignment. The empirical studies include a delayed vali-dation task that mimics consumers’ marketplace de-cisions as a proxy to estimate “true” scale. Together, thetheory and practice provide complementary insights:
Theory• Scale affects strategic decisions, such as how to
position and set price, even when we account forunobserved attributes and preference heterogeneity(a stylized version of commonhierarchical Bayes [HB],latent structure, or machine-learning estimation).
• Equilibria prices are extremely sensitive to truescale; that is, the scale that best describes marketplacedecisions.
• For high relative values of true scale, the profit-maximizing strategy is to differentiate. For low relativevalues of true scale, the profit-maximizing strategy isnot to differentiate.
• If a follower shirks onmarket research and gets abiased estimate of scale, the follower could make thewrong strategic decisions (price and positioning) andforego substantial profits.
• The innovator’s strategic decisions do not dependon estimated scale.
Practice• When the stylized assumptions are relaxed in
empirical studies, the identified phenomena and stra-tegic recommendations remain valid.
• Seemingly innocuous aspects of a CBC study canhave huge effects on predicted equilibrium prices. Wetest incentive alignment and image realism.
• Aspects of a CBC study can affect strategic po-sitioning, that is, which attribute level maximizesequilibrium profits.
• If estimated scale is adjusted based on a mar-ketplace validation task, then both pricing and po-sitioning decisions are affected. A firm may positiondifferently and choose a different price dependingon whether the firm acts on unadjusted scale orvalidation-adjusted scale.
• Data-based hypotheses for further research areas follows: (1) Image realism is very important.(2) Image realism may be more important than incen-tive alignment. (3) Validation-adjusted scale impliespredicted price equilibria that differ dramaticallyfrom price equilibria based on scale estimated fromthe CBC profile choices.
The practical implications are important. Althougha few CBC studies (academic literature and practice)
use highly realistic images and incentive alignment,most do not. Although a very few CBC studies adjustestimates with validation tasks, the vast majority donot. Because our theory and data suggest that such“craft” matters substantially, we also recommendpractical decision processes by which firms can de-cide whether to invest in these elements of CBC craft.We expect that CBC craft can impact managerial
decisions—this is intuitive. But neither the magni-tude and direction of the strategic errors nor the largeeffect of seemingly minor differences in CBC craftare obvious without the insights from the stylizedmodel. (At minimum, many aspects of craft are un-derappreciated in the academic literature and the vastmajority of CBC applications.)
2. Typical Practice in CBC Studies andRecent Changes in Practice
2.1. Typical Current PracticeIn CBC analysis, products (or services) are summa-rized by a set of levels of the attributes. For example, asmartwatchmight have awatch face (attribute) that iseither round or rectangular (levels), be silver or goldcolored, and have a black or brown leather band. Byvarying the smartwatch attribute levels systemati-cally within an experimental design, CBC analysisestimates preferences for attribute levels (and price),called “partworths,” which describe the differentialvalue of the attribute levels. For example, one part-worth might represent the differential value of a rect-angular watch face relative to a round watch face.Applied practice focuses on estimating accurately
the relative partworths. For example, if rectangularand round watch faces are equally costly but thepartworth of a rectangular watch face is greater thanthe partworth of a round watch face for most con-sumers, then a typical recommendation would beto launch a product with a rectangular watch face.The relative partworths can also be used to calculatewillingness to pay (WTP) by comparing differencesin partworths to the estimated price coefficient. Forexample, if a consumer’s differential value between arectangular and a round watch face is higher thanthe consumer’s valuation of a $100 reduction in thepurchase price,firms typically infer that the consumeris willing to pay more than $100 for a rectangularrather than a round watch face. (There are subtletiesin this calculation because of the Bayesian nature ofmost estimates, but this is the basic concept.)These calculations depend only on the (posterior
distribution of) relative partworths. Because attribute-level partworths and the price coefficient are definedrelative to one another, if we multiply all partworths andthe price coefficient by a constant, the comparative valueandWTPcalculations remainunchanged.However, the
Hauser, Eggers, and Selove: Scale in Choice-Based Conjoint Analysis1060 Marketing Science, 2019, vol. 38, no. 6, pp. 1059–1081, © 2019 The Author(s)

literature has established that estimated partworthsalso depend on scale heterogeneity. In particular, ifscale varies among consumers, then the accuracy withwhich the relative partworths can be estimated dependson accounting for heterogeneity in scale during esti-mation (e.g., Beck et al. 1993, Swait and Louviere 1993,Fiebig et al. 2010, Salisbury and Feinberg 2010,Pancreas et al. 2016). Scale heterogeneity affects part-worth estimation and/or aggregation of respondents’WTP, but, once researchers account for heterogene-ity, WTP does not depend on a common (across re-spondents) increase or decrease in scale (e.g., Ofek andSrinivasan 2002, equation 15). The phenomenon weinvestigate is different from scale heterogeneity; wefocus on the strategic implications of a common scalefactor in a stylized model assuming accurate relativepartworths and assuming the estimation accounts forscale heterogeneity. (The assumptions of accurate rela-tive partworths is relaxed in the empirical analyses.)
The literature recognizes that estimated partworthsmay need to be adjusted to better represent market-place choices. One approach is to adjust scale andrelative partworths to match market shares and use theadjusted scale and partworths in simulations (e.g.,Gilbride et al. 2008). The adjustments are motivatedby predictive ability rather than strategic implica-tions. A second approach adjusts scale directly or in aprocedure known as randomized first choice (RFC),in which an additive error is included in the simu-lations (Huber et al. 1999). RFC automatically de-termines the random perturbations to yield “ap-proximately the same scale factor as the [logit]model”(Sawtooth Software 2019). Scale adjustments are easyto implement, but usage is rare—users almost alwaysstick with the scale observed in the CBC estimation(Orme 2017). Many users report that marketplacedata, as a benchmark to adjust scale and relativepartworths, are often not available, for example, forinnovations, or not relevant to the simulated markets.Our stylized model and empirical illustrations suggestthat validation adjustments are critical and should beused more often. We also provide an alternative ad-justment that does not require marketplace data.
2.2. Current Practice is Changing: The Implicationsof Price Equilibria
WTP provides valuable diagnostic information forpricing and attribute-level decisions and has beenused to motivate and interpret valuations in patent/copyright cases (e.g., Mintz 2012, Cameron et al. 2013,McFadden 2014), but WTP does not account forcompetitive response. WTP does not indicate howmarketplace prices will respond to new products orchanges in a product’s attributes (Orme 2014, pp. 90–91;Orme and Chrzan 2017, p. 194). Because of the in-fluence of game theory in marketing science, CBC
simulators are beginning to consider competitive re-sponse. For example, if an innovator introduces asilver-colored watch face and a follower respondswith a gold-colored watch face (and all other attri-butes are held constant), then CBC simulations can beused to calculate the Nash price equilibrium. Allenbyet al. (2014) propose that these methods be used tovalue patents and copyrights. Courts recognizedthe issue as early as 2005 for class-action cases (e.g.,Whyte 2005; albeit not CBC) and since at least 2012 inpatent cases (Koh 2012). Although not proposed pre-viously, simulators can use equilibrium prices to calcu-latethefollower’smost-profitable strategic-positioningresponse (silver versus gold) to the innovator’s newproduct (silver or gold).We show that scale (and validation-based scale
adjustment) plays a central role when predicting priceequilibria and predicting optimal competitive reac-tions. We illustrate the magnitude of the managerialimplications. (Sawtooth Software estimates that 80%of managerial CBC applications consider competi-tion in market simulations, although the explicitcalculation of equilibrium prices is relatively new(Orme 2017).)
3. Empirical Illustration to Motivate thePhenomena We Seek to Study
Before we derive the stylized model and before we de-scribe fully the empirical tests, it is useful to illustrate thephenomena we seek to study.
3.1. Scale Affects the Price Equilibria ThatAre Calculated
As an illustration, we plot the predicted equilibriumprice of an innovator as a function of the true scale(γtrue). Figure 1 illustrates how the predicted priceequilibrium might change if estimated scale dependson the craft of a CBC study. We use the distribution ofrelative partworths obtained in our empirical study
Figure 1. Predicted Equilibrium Price Depends on Scale
Notes. Data are from our empirical study of smartwatches. Error barsare posterior standard deviations.
Hauser, Eggers, and Selove: Scale in Choice-Based Conjoint AnalysisMarketing Science, 2019, vol. 38, no. 6, pp. 1059–1081, © 2019 The Author(s) 1061

about smartwatches (HB CBC details in Section 8.5)and calculate the (counterfactual) price equilibria foreach level of scale (methods described in Section 8.8).The equilibria are based on a market with two firmswhose products differ on the watch color (silverversus gold). We chose the range of the scales to betypical of those reported in the literature and in ourempirical studies. (Over the range in Figure 1, equi-librium prices are monotonically deceasing in scale,but there is no guarantee that they do not increaseslightly as γtrue →∞. Indeed, they do so in the illustra-tive example in Online Appendix 1.) We obtain similarresults for watch face (round versus rectangular) andwatch band (combinations of three levels).
The intuition of Figure 1, shown formally in thestylized model, is that simulated choice probabilitiesare more sensitive to price changes (or changes inattribute levels) when scale increases even though therelative partworths remain unchanged. Greater sen-sitivity implies more price competition, which drivesdown equilibrium prices.
This wide difference in (predicted) equilibrium priceshasmanagerial and litigation implications. For example,suppose that a firm’s CBC study reports scale � 0.4 butthe marketplace acts according to scale � 1.0; then thefirm would likely earn substantially less profit than itexpects. The effect is real. In Section 8.7, data suggestthat differences in craft yield estimates of (relative)scale that vary from 0.35 to 1.00.
Using estimates of over 11.9 million Apple Watchsales in 2016 (Reisinger 2017), the calculated priceequilibrium swing of $158 implies a swing of morethan $1.8 billion in revenue. If the predicted multiyearprofit were only a small fraction of the revenue swing,it would still be substantial. Profits are based on prices,quantities, and costs, which we address later. In litiga-tion, units sold and costs are often held constant in the“but-for” world; CBC craft would swing damagesestimates by $1.8 billion.
3.2. Scale Affects Strategic Positioning DecisionsWe use the same smartwatch empirical data, but re-port predicted profits for (counterfactual) values ofscale. In this illustration, profits are price times share.We consider a two-stage game. In the first stage, firmschoose their positioning (silver versus gold). In thesecond stage, firms launch their products, the mar-ketplace reacts, and the firms obtain equilibriumprofits based on equilibrium prices. Table 1 presentsthe equilibrium profits for all possible positioningdecisions by an innovator and a follower. (The in-novator’s profit is the top number in each subcell ofTable 1; the follower’s profit is the bottom number.)If scale is higher, in equilibrium, the innovator andfollower choose to differentiate their products (theinnovator chooses silver, the follower chooses gold),
whereas if scale is lower, the innovator and followerchoose to offer the same product (both choose silver).At least for the follower, the recommended attributelevel depends on the “true” scale, holding relativepartworths constant.Typical CBC studies make recommendations based
on the partworths and scale as estimated based on theCBC design (choice sets). But consumers may choosedifferently in the marketplace. In Section 8, we use avalidation task that mimics the marketplace to adjustscale. We illustrate that strategic recommendationschange depending on whether scale is adjusted basedon the validation task. Unadjusted scale recommendsdifferentiation; validation-adjusted scale recommendsno differentiation for the data in this paper. This is a newreason to consider including realistic validation tasksthat go beyond holdout validation in a CBC study.
4. General Formulation andBasic NotationWe begin with notation for a fully heterogeneous modelbecause the empirical studies in Section 8 use a fullyheterogeneous model. (Different consumers can havedifferent relative partworths and scale.) Appendix Asummarizes notation for both the heterogeneousmodel and a more stylized formal model. Althoughempirical studies, including ours, can have many at-tributes and many levels for each attribute, we focusin the stylized model on a single attribute with twolevels. This focus in the stylized model is sufficient toillustrate the impact of scale and is consistent withIrmen and Thisse (1998, p. 78), who conclude that“differentiation in a single dimension is sufficient torelax price competition and to permit firms to enjoy theadvantages of a central location in all other characteris-tics.”Our stylized model also applies to simultaneousdifferentiation of a composite of multiple dimensions,say, a silver smartwatch with a rectangular face anda black leather band versus a gold smartwatch with a
Table 1. Relative Profits as a Function of StrategicPositioning
Follower’s position
Innovator’s position Silver GoldHigher scale (0.8)Silver 72.7 110.8
72.7 81.2
Gold 81.2 62.8110.8 62.8
Lower scale (0.4)Silver 112.6 132.9
112.6 106.6Gold 106.6 100.2
132.9 100.2
Notes. RelativeHBCBCpartworths are heterogeneous, but the same inhigher- and lower-scale markets. Innovator’s profit is the top numberin a subcell; follower’s profit the bottom number. Bold indicates anequilibrium.
Hauser, Eggers, and Selove: Scale in Choice-Based Conjoint Analysis1062 Marketing Science, 2019, vol. 38, no. 6, pp. 1059–1081, © 2019 The Author(s)
round watch face and a metal band. Both stylisticallyand empirically, we hold all attributes other than ourfocal attributes constant across products. In the stylizedmodel, there are no unobserved attributes.
4.1. Formal DefinitionsTo match typical applications of CBC, we focus ondiscrete (horizontal) levels of an attribute that we labelr and s. A product can have either ror s, but not both. Ifmnemonics help, think of r as round, regular, routine,ruby, or rust colored, and s as square, small, special,sapphire, or scarlet. Although the empirical model canhandle many firms, it is sufficient for the stylized modelto focus on twofirms, each ofwhich sells one product.Weallow an “outside option” to capture other firms andproducts that are exogenous to the strategic decisionsof the two-firm duopoly. In Section 9.4, we show thatthe insights apply when there are more than two prod-ucts, more than one attribute, and more than two levels.
Let uij be consumer i’s utility for firm j’s product, letuio be i’s utility for the outside option, and let pj beproduct j’s price. Let βri and βsi be i’s partworths forattribute levels r and s, respectively, and let δrj and δsjbe indicator functions for whether firm j’s producthas r or s, respectively. Let ηi indicate i’s preferencefor price, let εij be an extreme value error term withvariance π2/6γ2
i . If the error terms are independentand identically distributed, we have the standardlogit model for the probability, Pij, that consumer ipurchases firm j’s product (relative to firm k’s productand the outside option):
uij � βriδrj + βsiδsj − ηipj + εij,
Pij � eγi(βriδrj+βsiδsj−ηipj)
eγi(βriδrj+βsiδsj−ηipj) + eγi(βriδr,k≠ j+βsiδs,k≠ j−ηipk≠ j) + eγiuio.
(1)
Utility (uij) is unique to at most a positive lineartransformation (Train 2009, p. 27); hence, the mag-nitude of the error term (εij), the inverse of the errorstandard deviation (γi), and the price and partworthcoefficients (ηi, βri, βsi) are defined to at most a mul-tiplicative constant. For a single CBC study, we cannotsimultaneously estimate βri, βsi, ηi, and γi, nor can weindependently interpret the magnitude of any of theseconstructs. Within a CBC study, the magnitudes ofthese constructs can be interpreted (and estimated) onlyrelative to one another. (We can, and do, show howestimates can vary between different domains such asbetween higher-cost and lower-cost CBC studies.)
4.2. Relationships Among Different NormalizationsBecause βri, βsi, ηi, and γi are relative constructs, wemust impose one constraint for identification for bothinterpretation and estimation. The constraint variesin the literature. McFadden (2014) constrains the price
coefficient, ηi, to unity. In the McFadden (2014) nor-malization, scale is defined as ηiγi. Because ηi ≡ 1,scale becomes ηiγi � γi. The McFadden (2014) nor-malization has the intuitive advantage that the attribute-level relative partworth differences are measured incurrency units and can be interpreted as WTPs. Fromour perspective, the McFadden (2014) normalizationenables the stylized model to manipulate scale in-dependently from the relative partworths.Sonnier et al. (2007) normalize theCBCmodel using
µi � 1/γi. When ηi � 1, we define scale as ηi/µi �1/µi ≡ γi. The Sonnier et al. (2007) normalization hasno effect for maximum-likelihood estimation, butwe must adjust the prior distributions for µi whencomputing Bayesian posterior distributions. For thestylized model, we use the McFadden (2014) normal-ization because it is more intuitive when greater scaleimplies that the “signal-to-noise” ratio is larger.The Allenby et al. (2014) normalization, used com-
monly in practice, sets γi � µi � 1. In this normali-zation, WTPs require division by ηi and scale isproportional to the magnitude of the partworths. For-mally, in the Allenby et al. (2014) normalization, scalebecomes ηiγi ≡ ηi/µi � ηi. Although the Allenby et al.(2014) normalizationmakes it more difficult to untanglerelative partworths and scale, the basic theoretical andpractical insights do not change. For the stylizedmodel, all three normalizations are strategically equiv-alent (Keeney and Raiffa 1976). Empirically, HB, butnot maximum likelihood, estimation is slightly dif-ferent with the Allenby et al. (2014) normalizationversus the McFadden (2014) and the Sonnier et al.(2007) normalizations. Section 9.1 summarizes the em-pirical implications of the three normalizations.In our stylized model, we focus on the effect of a
common scale factor that may be affected by CBCcraft. To isolate the effect of scale in the stylizedmodel, we assume relative partworths are not af-fected by craft. (The impacts on relative partworthsare well studied, not new to this paper, and are addedback to the empirical model.)When CBC craft affects both scale and relative part-
worths (Section 9.3), researchers may prefer a dif-ferent empirical definition of scale. For example, withthe Allenby et al. (2014) normalization, researchershave defined scale as the sum of the estimated im-portances. (The importance of an attribute is defined asthe difference between the largest and smallest part-worth of an attribute.) This alternative definition doesnot affect the stylized model, because, in the styl-ized model, relative partworths do not depend on craft.Empirically, when scale is isolated such that relativepartworths are mostly unaffected by craft, the compar-isons among experimental conditions do not depend onthe normalization-dependent definition of scale.
Hauser, Eggers, and Selove: Scale in Choice-Based Conjoint AnalysisMarketing Science, 2019, vol. 38, no. 6, pp. 1059–1081, © 2019 The Author(s) 1063
4.3. Profit EquationsIf V is the market volume (including volume due tothe outside option), cj is the marginal cost for productj, Cj is firm j’s fixed cost, and f (βri, βsi, γi) is the prob-ability distribution over the relative partworths andscale (posterior if Bayesian), then the profit, πj, forfirm j is given by
πj � V (pj − cj)∫
Pij f (βri, βsi, γi)dβridβsidγi − Cj. (2)
(Empirically, if all estimates are Bayesian, we use theposterior distribution in the standard way.)
For the purposes of this paper, we assume that cjdoes not depend on the quantity sold nor the choice ofr or s. These assumptions can be relaxed and do notreverse the basic intuition in this paper. (The effect ofthe relative cost of r or s is well studied; see, e.g.,Moorthy 1988.)
4.4. Interpretation and Implications of theError Term
The error term in CBC analysis has many interpre-tations and implications. It has been interpreted asinherent stochasticity in consumer choice behavior and/or sources that are unobservable to the researcher, suchas unobserved heterogeneity, unobserved attributes,functional misspecifications, or consumer stochasticitythat is introduced by the CBC experiment (e.g., becauseof fatigue; see, e.g., Thurstone 1927, Manski 1977). Weare most interested in what happens to the (observed)scale when the craft of the CBC study changes, say,by the addition of incentive alignment or images thatbetter approximate the marketplace (more realisticimages). To address this issue, we assume that thefirm acts strategically on a CBC study anticipating theprice equilibria implied by the CBC study. However,after the firm selects its positioning strategy (saya silver versus gold smartwatch) and launches itsproduct, the prices are set by market forces; that is, themarketplace reaches the equilibrium prices becausefirms adjust price after launch until they reach a Nashprice equilibrium.
If the firm acts on a CBC study it believes to becorrect, the firm will anticipate a price equilibriumbased on the scale it believes to be true andwill chooseits position optimally based on its beliefs. But theactual realized equilibrium prices may differ if thefirm’s beliefs about scale are not sufficiently accurate.The mechanism by which marketplace prices adjustafter positioning decisions is based on market re-action. The mechanism is different from the more com-mon simplifying assumption in modern game theorythat “firms compete non-cooperatively in productspecifications with instantaneous adjustment to theNash equilibrium prices” (Economides 1986, p. 67).
The difference is necessary because, unlike typicalmodels, the firm may act based on market research itonly believes to be accurate. Ourmechanism is similarto that expressed by Hotelling (1929, pp. 48–49):
But understandings between competitors are notori-ously fragile. Let one of these business men, say B, findhimself suddenly in need of cash. Immediately at handhe will have a resource: Let him lower his price a little,increasing his sales. His profits will be larger untilA decides to stop sacrificing business and lowers hisprice to the point of maximum profit. B will now belikely to go further in an attempt to recoup, and so thesystem will descend to the equilibrium position. Hereneither competitor will have any incentive to lower hisprice further, since the increased business obtainablewould fail to compensate him.
Because actual sales and equilibrium prices dependon how consumers react to the products’ chosenpositions after the products are introduced to themarket, we need the concept of a true scale (γtrue) thatrepresents how the marketplace reacts. We pur-posefully do not define true scale as a philosophicalconstruct—it is defined as the scale that best repre-sents how consumers actually react in the market-place. Practically, we expect the true scale to be finitebecause of inherent stochasticity (e.g., Bass 1974),but our stylized theory allows true scale to approachinfinity. Our model admits many explanations of in-herent uncertainty. The stylized model needs to assumeonly that, even with the best possible craft, the firm’sprediction of consumer behavior includes a (possiblyzero) error term. True scale is a latent construct; thefirm can at best estimate its value.
4.5. Relationship to Prior ResearchOur perspective draws on, but is quite different fromthe pioneering work by Anderson et al. (1999), dePalma et al. (1985, 1987), and Rhee et al. (1992), whoalso explore the strategic implications of a normali-zation constant in a logit model. They represent themarketplace, not individual consumers, by a logitmodel and interpret the normalization constant(µ � 1/γ) as heterogeneity in consumer utility as inthe paper by de Palma et al. (1985, p. 779), who state,“theworld is pervasively heterogeneous, andwehavemade it clear how, in a particular model, this restoressmoothness [that leads to differentiation].” In theiranalyses, the firms act strategically on their un-certainty about this heterogeneity. As heterogeneityincreases firms on a Hotelling line seek minimumdifferentiation.Our stylized model makes different assumptions
and has different foci:• We explicitly constructed the stylized model to
model heterogeneity and, hence, rule out unobserved
Hauser, Eggers, and Selove: Scale in Choice-Based Conjoint Analysis1064 Marketing Science, 2019, vol. 38, no. 6, pp. 1059–1081, © 2019 The Author(s)
heterogeneity as an explanation for scale and crafteffects.
• We explicitly constructed the stylized model sothat there are no unobserved attributes and, hence,rule out unobserved attributes as an explanation forscale and craft effects. (Online Appendix 13 reviewsminimum versus maximum differentiation theoriesthat rely on unobserved attributes.)
• We focus on how craft (and external validation)in CBC studies affects scale and, through scale, dif-ferentiation.We do not focus on differentiation per se.
• We allow firms to act on different types of in-formation (CBC studies) about consumers; our theoryseeks to provide practical suggestions forwidely usedmarket research methods.
• We illustrate the effects of craft on scale andprovide examples of the effect sizes, using data fromprofessional-quality CBC studies.
• Empirically, we model heterogeneity explicitlyand attempt to rule out unobserved attributes.
5. Stylized Formal Model withTwo-Segment Heterogeneity
In the stylized model, we focus on two mutuallyexclusive and collectively exhaustive consumer seg-ments with different relative partworths. This level ofheterogeneity is sufficient to enable two firms to targetdifferent segments and sufficient to illustrate the stra-tegic effects of scale. The strategic effects survive themore general empirical applications in Section 8, whichuse standard estimation procedures (HB CBC, testedwith three related normalizations).
We label the segments R and S, with segment sizesR and S, respectively. Partworths vary between seg-ments, but are homogeneous within segment (βri � βrRand βsi � βsR for all i in segment R; βri � βrS and βsi �βsS for all i in segment S). Scale varies among consumersin the empirical applications, but in the stylized modelwe focus on a common scale adjustment that mightvary among CBC studies of different quality. For thispurpose, it is sufficient to assume scale is constant acrossconsumers such that γi � γ for all i.
We investigate trade-offs that firms make between(1) a differentiated strategy in which each firm targetsdifferent attribute levels and (2) an undifferentiatedstrategy in which both firms target the same attributelevels. To do so, we need one attribute level to bemoreattractive than the other. Given the other symmetriesin the model, it is sufficient to model the relativeinfluence of an attribute level by the percent of con-sumerswhoprefer that attribute level,Ror S.We needpartworths to vary between segments. It is suffi-cient that their relative values reverse (r_s in onesegment and s_r in the other segment). Although thepartworths differ between segments, it would be re-dundant to also vary the magnitude of partworth
differences; thus, we set βrR � βsS � βh and βsR � βrS �βℓ. We set βh ≥ βℓ and R≥ Swithout loss of generality.Setting R≥S assures that the firm prefers r≽ s, ceterisparibus. (We can also set βℓ = 0 without loss of gen-erality, but interpretations are more intuitive if weretain βℓ in the notation.)The costs, cj and Cj, affect strategic decisions in the
obvious ways and need not be addressed in thispaper. For example, a firm might require a minimumprice such that pj ≥ cj or choose not to enter if Cj is toolarge. Such effects are well studied and affect firmdecisions above and beyond the strategic effect ofscale. For focus, we normalize V to a unit marketvolume, set Cj � 0, and roll marginal costs into priceby setting cj � 0.We label the potential strategic positions for firms 1
and 2, respectively, as either rr, rs, sr, or ss. For example,rsmeans that firm 1 positions at r and firm 2 positionsat s. Because prices,market shares, and profits dependon these strategic positioning decisions, we subscriptprices, shares, and profits accordingly. For example,p1rr is firm 1’s price in a market in which firm 1’sposition is r and firm 2’s position is r.
6. The Effect of Scale on Equilibrium Pricesand Strategic Positioning Decisions
6.1. Basic Game to Demonstrate the Impact of TrueScale (Inherent Stochasticity)
The price-positioning game is consistent with keyreferences in the strategic positioning literature (seeOnline Appendix 13) and realistic for most markets.Temporarily, we assume the firms believe they knowγtrue, which may be either finite or approach infinity.(Infinite γtrue is equivalent to a first-choice rule in CBCsimulators.) Based on this knowledge, the firms firstchoose their product positions (r or s) sequentially,and then the marketplace sets prices. (If the firmsare correct in their beliefs, they correctly anticipateequilibriumprices.)Thepositioningdecisions,oncemade,are not easily reversible, perhaps because of produc-tion capabilities or ephemeral advertising investments.Without loss of generality, firm 1 is the innovator, andfirm 2 is the follower. The innovator enters assumingthat the follower will choose its positions optimally.(We abstracted away from entry decisions by settingcj � Cj � 0.) After the firms have entered, Nash equilib-rium prices, if they exist, are realized. This two-stagegamewill be embedded in another game in Section 7 inwhich firms know that the CBC study may be im-perfect and choose whether to invest in higher-costcraft to better estimate scale prior to making strategicpositioning decisions. We address the relationship tosimultaneous entry in Online Appendix 14. We useasterisks to indicate Nash equilibrium prices, shares,and profits.
Hauser, Eggers, and Selove: Scale in Choice-Based Conjoint AnalysisMarketing Science, 2019, vol. 38, no. 6, pp. 1059–1081, © 2019 The Author(s) 1065
The equilibria we obtain, and strategies that arebest for the innovator and follower, have the flavorof models in the asymmetric competition literature(minimum versus maximum differentiation), butwith two important differences: (1) Our results are notdriven by unobserved heterogeneity or strategicallyrelevant unobserved attributes. (2) Our results arefocused on providing a structure to understand andevaluate the impact of improvements in CBC craft. Wedevelop the formal structure as a practical tool to eval-uate whether improvements, such as more realistic im-ages or incentive alignment, affect strategic decisions.
6.2. Price Equilibria in Heterogeneous Logit Models(as in CBC Analysis)
We are not the first to investigate price equilibria inlogit models. Choi et al. (1990) demonstrate that priceequilibria exist if partworths are homogeneous and con-sumers are not overly price sensitive. Their condition(Choi et al. 1990, p. 179) suggests that price equilibriaare more likely to exist if there is greater uncertaintyin consumer preferences—a result consistentwith ourmodel which, in addition, accounts for heterogeneity.Choi andDeSarbo (1994) use similar concepts to solvea positioning problem with exhaustive enumeration.Luo et al. (2007) extend the analysis to include het-erogeneous partworths and equilibria at the retaillevel. They use numeric methods to find Stackelbergequilibria if and when the equilibria exist.
We cannot simply assume that price equilibria existand are unique. For example, Aksoy-Pierson et al.(2013) (hereafter, APAF) warn that price equilibriain heterogeneous logit models may not exist. APAFgeneralize the analyses of Caplin and Nalebuff (1991)to establish sufficient conditions for price equilibriato exist, to be unique, and to be given by thefirst-orderconditions. The APAF conditions apply to typical HBCBC studies (Aksoy-Pierson et al. 2013, section 6);thus, we check existence and uniqueness in both ourstylized model and in our empirical analyses.
6.3. Equilibria in the Price SubgameUsing Equation (1), we obtain implicit first-orderand second-order conditions for optimal prices andprofits. We use these conditions to derive implicitequations for the equilibrium prices and profits.Differentiating further, we obtain implicit second-order and cross-partial conditions (see Appendix B).We establish that interior equilibria exist and areunique given (mild) sufficient conditions. Equilibriaexist and are unique for most posterior draws in theempirical analysis when prices are constrained to bewithin the range of measurement. When they exist,the empirical equilibria are unique. The equilibriaexist and are unique in an illustrative example of thestylized model (Section 7.6).
6.4. True Scale Affects the Relative Profits of theFirms’ Positioning Strategies
We temporarily assume the firm believes it knows thetrue scale, which can be either finite (inherent un-certainty in consumer choices) or approach infinity(no inherent uncertainty). In Section 7, we use theresults of this section to explore what happens whenthe firm does not know the true scale and bases itsdecisions on CBC market research. All proofs areformalized in Appendix B.To understand the effect of true scale on firms’
positioning strategies (choice of attribute levels inequilibrium), we examine how profit-maximizingattribute levels change as true scale increases fromsmall to large. Because the functions are continuous,we need only show the extremes. Appendix B es-tablishes that, for sufficiently low true scale, pricemoderation through differentiation does not offsetthe advantage of targeting the larger segment andboth innovator and follower choose the most profit-able attribute level, r. The proof is driven by the factthat the logit curve becomes flatter as γtrue → 0. Inthis regime, the effect of attribute changes or pricechanges has less effect on choice probabilities.When price is endogenous, common intuition is not
correct. All shares, including the outside option, donot tend toward equality as γtrue → 0. The endogenousincrease in equilibrium prices offsets this effect. In-stead, while the innovator and follower shares movecloser to one another, the equilibrium prices increaseand reduce shares relative to the outside option.As γtrue gets large, both the innovator and the fol-
lower prefer differentiation. Formally, we use twomild sufficient, but not necessary, conditions: (1) therelative partworth of r is larger than the relativepartworth of the outside option and (2) the relativepartworth of the outside option is at least as large asthe relative partworth of s. We also prove that, amongthe undifferentiated strategies, both the innovator andfollower prefer to target the larger segment and, underthe sufficient conditions and large γtrue, the innovatorprefers the larger segment. These intermediate re-sults produce an equilibrium in product positions.(See Appendix B for proofs.)
6.5. Equilibrium in Product Positions
Proposition 1. For low true scale (γtrue → 0), the innovator(firm 1) targets the larger segment (r), and the followerchooses not to differentiate. The follower targets the largersegment (r).
Proposition 2. If βh is sufficiently larger than uo and ifuo ≥ βℓ, then there exists a sufficiently large γtrue such thatthe innovator targets the larger segment (r), and the followerchooses to differentiate by targeting the smaller segment (s).
Hauser, Eggers, and Selove: Scale in Choice-Based Conjoint Analysis1066 Marketing Science, 2019, vol. 38, no. 6, pp. 1059–1081, © 2019 The Author(s)

Because the profit functions are continuous (seealso APAF), Propositions 1 and 2 and the mean valuetheorem imply that there exists a γcutoff such that thefollower is indifferent between rr and rs. We calculateγcutoff as {γ : π*
2rs(γ) � π*2rr(γ)}. Numerically, for awide
variety of parameter values, the profit functions aresmooth, the cutoff value is unique, and π*
2rs − π*2rr is
monotonically increasing in γtrue. We have not founda counterexample.
7. Implications for Investing in the Qualityof CBC Studies
7.1. Aspects of Craft in CBC StudiesWe reviewed the conjoint analysis papers in Mar-keting Science from the last 16 years (2003–2018).Forty-six papers addressed new estimation methods,newadaptivequestioningmethods,methods tomotivaterespondents, more efficient designs, noncompensatorymethods, and other improvements. Mostly, papers fo-cused on the improved estimation of relative partworthsor implied managerial interpretations. Six of the papersaddress the implications of scale (or a related conceptfor non-CBC papers) explicitly, and of those six, threefocus on more accurate estimation, one on weightingconsumers, one on brand credibility, and one on peerinfluence. None discuss the strategic (price or position-ing) implications of scale (see Online Appendix 15).
There is substantially less focus in the conjoint-analysis literature on data-quality issues such asselecting stimuli to best represent marketplace choices(realistic stimuli). Most papers do not report whetherstimuli are text only, pictorial, or animated, but of thosethat do, the vast majority are text only. Although in-terest in incentive alignment is growing, no papersdiscuss the impact of either realistic stimuli or incentivealignment on the scale observed for the estimation data.Furthermore, in practice, defaults in software leadmostapplications to use text-only stimuli without incentivealignment.
Improving craft in CBC can be expensive. Somefirms, such as Procter & Gamble, Chrysler, andGeneral Motors, are sophisticated and spend sub-stantially on CBC. Some CBC studies invest tens ofthousands of dollars to create realistic animated de-scriptions of products and attributes complete withtraining videos. And some include additional preteststo assure that the stimuli are seen as realistic-to-marketplace by consumers. Incentive alignment canalso be expensive: one CBC study gave 1 in 20 re-spondents $300 toward a smartphone and anothergave every respondent $30 toward amusic-streamingsubscription (Koh 2012, McFadden 2014). Firms rou-tinely use high-quality internet panels, often pay-ing as much as $5–$10 for each respondent and up to$50–$60 for hard-to-reach respondents. Our reviewof the literature suggests that firms believe that each
of these investments increases the accuracy withwhich relative partworths are estimated. On the otherhand,manyfirms reduceCBC costs by using text-onlyattribute descriptions, no incentive alignment, lesssophisticated methods, convenience samples, andsmall sample sizes. We show, in the stylized modeland by example empirically, that the managerialimplications of these craft decisions (and defaults)are not trivial.
7.2. Modeling Decisions with Respect to CBC CraftIn Section 6.4, we temporarily assumed the firm be-lieved the true scale to be accurate. True scale was thescale that described how consumers would react to r,s, and price in the marketplace. We are interested inwhat happens if the firms (or testifying experts) shirkon their investments in the craft of CBC studies. Wedefine two additional constructs: γmarket research is thescale estimated by the CBC study, and may or maynot equal the true scale, and γasymptotic is the scale thatthe firm would obtain with the highest possible levelof CBC craft. If craft were costless, the firm wouldalways seek the best craft in the hopes that γasymptotic
would approximate (unobserved) γtrue. But craft isnot costless.We embed the game from Section 6 into a larger
game. We assume that if the firm invests more in CBCcraft, its estimate of scale becomes better, that is,|γmarket research − γtrue | becomes smaller. (Strategic er-rors can be made if γtrue is underestimated or over-estimated.) To focus on scale in the stylized model, weassume all (reasonable) CBC studies estimate the rel-ative partworths correctly so that the firm knows thatr_s in R, s_r in S, and R> S. In Section 9.3, we in-vestigate a double whammy whereby craft affectsboth estimated scale and estimated relative part-worths. Our results are complementary to researchto improve relative partworth estimates; hence, weneed not address the accuracy of relative partworthsin the stylized model.It is sufficient to illustrate the phenomenon in the
stylized model if we consider lower-cost and higher-cost CBC studies such that γhigher � γtrue for the higher-cost study and γlower ≠ γtrue for the lower-cost study.(In Sections 8 and 9, we demonstrate empirically thatcostly craft affects γmarket research and that it is likelythat costly craft reduces |γmarket research − γtrue |.) For thestylized model, we formally state the game order eventhoughwe can prove the results for other orders andwecan relax many assumptions empirically.) The gameorder is as follows:
1. The innovator decides whether to invest in thelower-cost or the higher-cost CBC study. (To focuson scale, we assumed that both CBC studies revealcorrectly that r_s in R, s_r in S, and R>S.)
Hauser, Eggers, and Selove: Scale in Choice-Based Conjoint AnalysisMarketing Science, 2019, vol. 38, no. 6, pp. 1059–1081, © 2019 The Author(s) 1067

2. The innovator completes its CBC study andobserves γmarket research.i.
3. Based on its observed γmarket research.i, the inno-vator announces and commits to either r or s.
4. The follower decides whether to invest in the lower-cost or the higher-cost CBC study. (By assumption, bothCBC studies reveal that r_s in R, s_r in S, and R> S.)
5. The follower completes its CBC study and ob-serves γmarket research.f . (The innovator has already acted;the follower observes the innovator’s position, r or s.)
6. Based on its observed γmarket research.f , the followerannounces and commits to either r or s. (Becausethe innovator has acted, the follower need not as-sume anything about the innovator’s belief aboutγmarket research.i.)
7. Both firms launch their products. The market-place determines sales and price based on γtrue—thescale that best describes consumer response. Thefirms realize their profits.
It will be obvious in Section 7.3 that the followercould have made its craft decision before learning ofthe innovator’s positioning—such a game orderingwould give the same results. Commitment to r or s im-plicitly assumes that positioning decisions are “sticky,”expensive, or based on know-how, patents, or copy-rights. Once made, the firm cannot change its position-ing even when the market price, market shares, andprofits are not as forecast. Propositions 1 and 2 give ussufficient insight to understand the innovator’s and thefollower’s craft decisions. Online Appendix 14 ad-dresses a game in which the innovator and followermove simultaneously. The simultaneous game doesnot determine which firm positions at r in a differ-entiated market, but all other implications remain.
7.3 Innovator’s Strategic Positioning Decision DoesNot Depend on Observed Scale
The innovator chooses to target the larger segment (r)in both Propositions 1 and 2, and thus the innovatormakes the same decision whether γmarket research � γtrue
or γmarket research ≠γtrue. Because the innovator’s stra-tegic positioning decision is independent of the ob-served scale, investing in a higher-cost CBC study hasno effect on the innovator’s positioning strategy. (Westate and prove the result formally in Appendix B.)The insight is consistent with recommendations inproduct development (e.g., Urban and Hauser 1993,Ulrich and Eppinger 2004). These texts advise inno-vators to use market research to identify the best at-tributes, but also advise that the accuracy need only besufficient for a go/no-go decision.
7.4. Follower’s Strategic Positioning DecisionDepends on Observed Scale
If a naıve follower underinvests in CBC craft andobserves γlower ≠γtrue, and if either γlower <γcutoff <γtrue
or γlower >γcutoff >γtrue, then the follower makes astrategic error by choosing the wrong strategic po-sition (the wrong attribute level). We state and provethe result formally in Appendix B. For example, ifγcutoff <γtrue, then Proposition 2 implies that the mostprofitable attribute level for the follower is s. How-ever, if the follower acts on γmarket research � γlower, and ifγlower <γcutoff , then, by Proposition 1, the follower willchoose the less profitable attribute level, r. In somecases, the naıve follower may underinvest in CBCstudies, but get lucky, say, if γtrue <γcutoff and γlower <γcutoff . The first inequality implies r is the follower’smost profitable attribute level, and the second in-equality implies the follower chooses r. The importantinsight is that if the naıve follower underinvests inthe craft of a CBC study, then it is relying on luck tomake the right decision.Although some authors interpret higher scale as a
surrogate for higher response accuracy (Toubia et al.2004, Evgeniou et al. 2005), we interpret scale as moreaccurate if |γmarket research − γtrue | is lower. A CBC studythat uses less costly craft can have higher estimatedscale, but those estimates can be less accurate forrepresenting the marketplace. For example, a CBCstudy with two convenient attributes, text-only stim-uli, and no incentive alignment might estimate thatscale is high because respondents answer choice tasksmore consistently. But the CBC study with such craftmight overestimate true scale because two text-basedattributes without incentive alignment may not ap-proximate marketplace choices that are more de-liberate and externally valid.
7.5. Sophisticated Bayesian Follower’s Decision onInvestments in CBC Studies
As firms become more sophisticated, they might useBayesian decision theory to decide whether to investin a higher-cost or lower-cost craft. For example, if thefollower can investK dollars to learn γtrue, the firm cancompare expected profits, from acting optimally onγtrue, to expected profits based on the prior distri-bution of γtrue. If the higher-cost study updates theprior, the calculations take this into account. Theexpected-value-of-sample-information calculationsare straightforward and provide no incremental insightabout craft decisions. For completeness, we provideexample calculations in Online Appendix 2.
7.6. Illustrative ExampleIn Online Appendix 1, we provide an illustrativenumerical example with βh � 2, βℓ � 1, uo � 1, andR � 0.55. (R programs are available from the authors.)The effect of γtrue on equilibrium prices is similar tothat observed for the empirical data in Figure 1. Forthe vast majority of the range of scale, especially inthe range we observe in empirical data, equilibrium
Hauser, Eggers, and Selove: Scale in Choice-Based Conjoint Analysis1068 Marketing Science, 2019, vol. 38, no. 6, pp. 1059–1081, © 2019 The Author(s)

prices (and profits) decrease with scale. Prices in-crease slightly as γtrue →∞. The latter is a result ofmultiple offsetting forces when the market ap-proaches extreme behavior—very small increases inprice relative to competition have large impacts onmarket shares. As predicted, differentiated positionsare most profitable when γtrue is large, and undif-ferentiated positions are most profitable when γtrue issmall. In the illustrative example, we calculate γcutoff �{γ : π*
2rs(γ) � π*2rr(γ)} to be approximately 1.0. For the
illustrative example, opportunity losses for choosingan incorrect strategic position are quite large.
7.7. Sensitivity of the Stylized Model toAlternative Normalizations
All three normalizations imply the same stylized re-sults. For the Allenby et al. (2014) normalization (γ �µ � 1), holding the ratios of βh/η and βℓ/η constant,firms differentiate if η→∞ and choose not to differ-entiate if η→ 0. For the Sonnier et al. (2007) normali-zation (η � 1, γ ≡ 1/µ), firms differentiate as µ→ 0and choose not to differentiate as µ gets large.
8. Empirical Test: SmartwatchesIt is reasonable to ask whether the phenomena westudy stylistically are sufficiently strong that they areobservable in empirical applications. Our empiricalapplications relax the formalized assumptions of onestrategic attribute, two levels, two products, hetero-geneity limited to two segments, homogeneous scale,and homogeneous within-segment partworths. Wedemonstrate that scale can be manipulated by differ-ences in CBC craft and that recommended strategic priceand positioning decisions depend on whether scale isadjusted with validation tasks. Empirically, scale drivesstrategic decisions even when relative partworths donot vary, when firms do not react to unobserved attri-butes, and when we allow full heterogeneity.
To test the implications of the stylized theory, weundertake CBC studies in a realistic product categoryusing multiple attributes, some with more than twolevels. We vary two representative aspects of craft whilemaintaining other aspects at professional-level quality.We test the implications of an example validation task.
8.1. Smartwatch CBC StudiesWe focused on four attributes of smartwatches: casecolor (silver or gold), watch face (round or rectan-gular), watch band (black leather, brown leather, ormatching metal color), and price ($299, $349, $399, or$449). We held all other attributes constant, includingbrand and operating system. (In Section 9.4, we discusstwo studies with more attributes and a multitudeof levels.) We designed our stimuli so that any un-observed attributes were unlikely to vary amongexperimental conditions. By assumption in counterfactual
simulations, unobserved attributes were not usedstrategically for positioning decisions.We used 16 choice sets for estimation (and two as
internal holdouts) with three profiles per choice set.We included the outside option via a dual-responseprocedure (Meissner et al. 2016, Wlomert and Eggers2016).We followed standard survey design principlesincluding extensive pretesting (66 respondents) toassure that (1) the questions, attributes, and tasks wereeasy to understand; (2) that the manipulation of craftbetween respondents was not subject to demand ar-tifacts; and (3) that respondents did not report basingdecisions on any attributes that were not varied.
8.2. Image Realism and Incentive AlignmentWe varied image realism and incentive alignment in a2 × 2 between-subjects design. These aspects of CBCcraft are chosen as illustrative—we expect many as-pects of craft to have strategic implications, includingthe representativeness of the respondents, the com-pleteness and clarity of the product attributes, thetype of questions (simple versus dual response), thenumber of choice tasks, the number of profiles per choicetask, the quality of respondent training, and the qualityof partworth estimation. We chose incentive alignmentbecause of the growing academic interest in incentivealignmentandbecauseof its proven impact onpredictiveability, for example, in Ding (2007) and Ding et al.(2005, 2011). We chose image realism because theproduct-development literature suggests visual de-pictions and animations provide nearly the sameresults as physical prototypes and that rich visual rep-resentations are more realistic than text and morelikely to evoke marketplace-like responses fromrespondents (e.g., Vriens et al. 1998, Dahan andSrinivasan 2000, Dahan and Hauser 2002). Further-more, Dzyabura et al. (2019) suggest that conjointanalysis with physical prototypes provides differentconjoint-analysis estimates than less realistic stimuli. Ourreview of the Marketing Science literature (Section 7.1)suggests that realistic images and incentive alignmentare rare in the academic literature and in practice.
8.2.1. Image Realism. After the screening questions,respondents entered the CBC section. Following atraining task (not used in estimation), each respondentchose repeatedly among three smartwatch profilesand indicated whether he or she would purchase thesmartwatch. Respondents in the realistic-image exper-imental cells saw high-realism images that attemptedto represent marketplace stimuli closely (Figure 2). Tomake the images more realistic, the respondent couldtoggle among a detailed view, a top view, and an appview (not shown in Figure 2). Respondents in the less-realistic-image cells saw only text-based stimuli (withsimple images) and coud not toggle among views
Hauser, Eggers, and Selove: Scale in Choice-Based Conjoint AnalysisMarketing Science, 2019, vol. 38, no. 6, pp. 1059–1081, © 2019 The Author(s) 1069

(see Figure 3). Text-only stimuli are common in prac-tice and are the defaults in most professional CBCsoftware packages. On the other hand, realistic imagesare common in marketplace choices among smart-watches (see https://www.apple.com/watch/compare/).
8.2.2. Incentive Alignment. In the incentive-alignedexperimental cells, respondents saw an animatedvideo to induce incentive alignment (https://www.youtube.com/watch?v=DBLPfRJo2Ho). Specifically,respondents were told that 1 in 500 respondentswould receive a smartwatch and/or cash with a com-bined value of $500, based on their answers to thesurvey. Image realism in the video was matched toimage realism in the experimental cell (see Figure 4).Respondents who were not in incentive-aligned ex-perimental cells received the same cash offer, but thecash was not tied to their answers.
8.3. Validation TaskThe ideal external validation is whether the CBCmodel predicts the choices consumers would makeif the hypothetical profiles were to become realproducts in the marketplace. But most hypotheticalprofiles will never be market tested. Instead, wemimic marketplace choices by creating a “market”that approximates the marketplace as closely as
feasible while controlling for unmodeled market-ing actions. In this validation task, respondents choseamong 12 smartwatches and an outside option.Twelve smartwatches represent all possible designcombinations. Price was chosen randomly (withoutreplacement) according tominimal overlap regardingthe design attributes. The resulting prices are almostorthogonal to the design attributes. The task wasdelayed three weeks to cleanse memory. We believe,and an empirical posttest confirms, that this valida-tion task is perceived by respondents to be closer tomarketplace choices thanwithin-study holdout tasks.(See Online Appendix 12 for an empirical posttest.Marketplace market shares were not available forthe hypothetical smartwatch profiles in our experi-ment.) If scale adjustment based on this validation taskaffects strategic decisions, then we have demonstratedthe phenomenon empirically. Future research can ex-plore other validation tasks such as those proposed byGilbride et al. (2008) and Wlomert and Eggers (2016).
8.4. SampleOur sample was drawn from a professional panel.2
We screened the sample so that respondents ex-pressed interest in the category but did not own asmartwatch,were based in theUnited States, were aged20–69, and agreed to informed consent as required by
Figure 2. Realistic Images: Choice-Based Dual Response Task
Note. The images were animated allowing respondents to toggle views.
Hauser, Eggers, and Selove: Scale in Choice-Based Conjoint Analysis1070 Marketing Science, 2019, vol. 38, no. 6, pp. 1059–1081, © 2019 The Author(s)

our institutional review boards. Respondents in bothstudies received standard panel incentives for par-ticipating in the study.
Overall, 1,693 respondents completed thefirstwaveof studies, and, of these, 1,147 completed the delayedvalidation task (68%). We considered respondentswho completed both the study and validation task. Weremoved respondents who always chose the outsideoption. There were no significant differences betweenthe experimental cells and the exclusion of respon-dents (p = 0.86). The final sample size was 1,044 withsample sizes varying from 248 to 275 among exper-imental conditions. To illustrate the effect of CBCcraft, we focus on comparisons among the realistic-image, incentive-aligned experimental cell (n = 270)and the text-only, not-incentive-aligned experimentalcell (n = 275). In Section 9.2, we compare the effect ofrealistic images to the effect of incentive alignmentusing the full 2 × 2 design.
8.5. Estimation of Heterogeneous Partworths andScale: Standard HB CBC Model
We adopt a standard HB CBC estimation methodconsistent with the stylized model. The basic utilitymodel generalizes the utility model in the stylizedmodel (recall that uij is consumer i’s utility for productprofile j and pj is the price). For notational simplicity,we state the utility for binary attributes recognizingthe standard generalization to multilevel attributes(as in our empirical CBC studies). If profile j has at-tribute k, then ajk � 1; otherwise ajk � −1. The utilitymodel is
uij � γi
(∑Kk�1
βkiajk − pj
)+ εij. (3)
The probability of choosing each profile (or the out-side option) is given by the standard logit modelanalogous to that used for the stylized model. This
Figure 3. Lower-Quality Study: Choice-Based Dual Response Task (No Ability to Toggle)
Figure 4. Incentive Alignment Screenshot
Hauser, Eggers, and Selove: Scale in Choice-Based Conjoint AnalysisMarketing Science, 2019, vol. 38, no. 6, pp. 1059–1081, © 2019 The Author(s) 1071

McFadden (2014) normalization is similar to thenormalization used by Sonnier et al. (2007) withthe exception that the latter estimate µi ≡ 1/γi. TheAllenby et al. (2014) normalization estimates an ex-plicit price coefficient ηi by setting γi � µi � 1; hence,scale is quantified by ηi. Empirically, strategic im-plications from the three normalizations are notsignificantly different (see Online Appendices 6, 7,and 8).
Like Allenby et al. (2014, p. 436), we use a hierar-chical estimation that assumes the observed data aregiven by the choice model (as a function of theβki
′s, γi′s, and ajk′s). The βki’s and ln(γi)’s are distrib-
uted multivariate normal. We use a random-effectsspecification for scale allowing the means of thedistribution to vary according to the experimentalcondition (see Section 8.6). The second-stage prior isthe standard Normal-inverted-Wishart conditionallyconjugate prior. Allenby et al. (2014) use the standardrelatively diffuse prior for the βki’s, but modify the priorfor ln(γi) to be more diffuse (ln(ηi) in their model).Details are provided in Online Appendix 5 and byAllenby et al. (2014), who provide graphical moti-vation for the prior.
To avoid misspecification errors, we tested for in-teraction effects. We did not detect significant im-provements, and hence our final model is based onmain effects. All settings not specified by Allenby et al.(2014) followed standard procedures as in SawtoothSoftware (2015). For example, we used 10,000 burn-initerations for convergence and a subsequent 10,000iterations to draw partworths and scale, from whichwe kept every 10th draw. All subsequent summaries,profits, and other reported quantities are based onthe posterior distributions.
8.6. Identification of Relative Scale as a Function ofCraft and Validation
We identify how scale changes as a function of craftby using an experimental design. The ratio of scaleamong experimental conditions is well defined andidentified for all three normalizations. With twoexperimental cells times two types of choice tasks(estimation and validation), we identify three scaleadjustments, all relative to the text-only, not-incentive-aligned, no-validation-adjustment factor, which wenormalize to 1.0. Accordingly, we estimate scale-adjustment factors for the realistic-image, incentive-aligned condition, λQh ; the validation task, λV ; andtheir interaction, λQhV . Following Fiebig et al. (2010),we use an exponential transformation to assure thatall scale factors are positive.
Let Qhi � 1 if respondent iwas exposed to the realistic-
image, incentive-aligned condition (0, otherwise), and
let Vi � 1 for respondent i’s validation task (0 for theestimation tasks). Then we obtain
uij � γQVγi
(∑Kk�1
βkiajk − pj
)+ εij, (4)
where ln(γQV) � λQhQhi + λVVi + λQhVQh
i Vi.
This specification was estimated as a random-effects model within a HB framework that assumes anormal distribution for ln(γi) with means accordingto ln(γQV). The priors are otherwise consistent. Thefull specification can be found in Online Appendix 6.Following Bayesian principles, this specification
uses all of the data simultaneously and rigorously.Wecompared this specification to an ad hoc method inwhich we estimate parameters for each experimen-tal cell using the CBC choice tasks and then use asingle-parameter logit model to estimate a scale-adjustment factor between choice tasks and the vali-dation task. The ad hoc specification has the advan-tage of separating relative partworth estimation fromscale-adjustment because the relative partworths areestimated independently for each experimental cell.When we compared the results, the specification inEquation (4) was highly correlated with the ad hocmethod (ρ = 0.995).
8.7. CBC Market-Research Quality and ValidationAffect Scale as Observed by the Firm
The posterior means and standard deviations of thescale-adjustment posterior distributions of γQV aregiven in Table 2. First, we notice that in the major-ity of posterior draws (99%) for the estimation choiceprofiles only, relative scale is higher for text-onlyquestions without incentive alignment than it is formore realistic images with incentive alignment. Ifscale is used as a surrogate for response accuracy asin Evgeniou et al. 2005, Toubia et al. 2004, and others,the firm might conclude that investments in realisticimages and incentive alignment reduced responseaccuracy among the CBC profiles. But the goal is nota higher scale based on CBC profiles; the goal is tominimize |γmarket research − γtrue |.Scale might be artificially inflated among text-only
choice tasks because it is easier for respondents toanswer such questions consistently, but at the sametime text-only choice tasks might be less predictiveof choices in a marketplace than incentive-alignedquestions based on stimuli that match the market-place. To the extent that scale based on realistic im-ages and incentive alignment and adjusted for thevalidation task is our best estimate of γtrue, then|γmarket research − γtrue | is best, by assumption, for the
Hauser, Eggers, and Selove: Scale in Choice-Based Conjoint Analysis1072 Marketing Science, 2019, vol. 38, no. 6, pp. 1059–1081, © 2019 The Author(s)

realistic-image, incentive-aligned, validation-adjustedestimates. All relative comparisons make intuitivesense. The next-best estimate is for realistic-image,incentive-aligned, estimation-only scale, then text-only, not-incentive-aligned, validation-adjusted scale.The worst estimate is text-only, not-incentive-aligned,estimation-only scale.
Table 2 isolates a scale effect. A common measure,hit rates, isolate a relative-partworth effect. As ex-pected, hit rates are substantially improved for therealistic-image, incentive-aligned condition—hit ratesincrease from 24% to 39% (chance is 7.7%) for thevalidation task and from 64% to 77% (chance is 25%)for the estimation task.
Uncertainty explained (U2; Hauser 1978) is basedon the joint accuracy of scale and relative partworths.In our data, U2 increases for the realistic-image,incentive-aligned condition—from 0.16 to 0.33 forthe validation task and from 0.34 to 0.53 for the es-timation task. Based on the posterior distribution, alldifferences (hit rates and U2) are significant (seeOnline Appendix 11). There was no draw in whichthe text-only, not-incentive-aligned condition per-formed better. Taken together, these results implythat γmarket research is closer to γtrue for the realistic-image, incentive-aligned condition.
The effects appear to be robust. For example, whenwe use a mixture of normal distributions to estimateupper-level heterogeneity or random splits of thesample or the choice tasks used for the estimation, weobtain the same basic results. Scale adjustment fac-tors are also not affectedwhen using less data, neithervia splits of the sample nor choice tasks; only posteriorstandard deviations increase for subsets of the sample(see Online Appendix 8). The results are robust to al-ternative model normalizations (see Section 9.1).
Table 2 is important for practice because the vast ma-jority of CBC studies rely on unadjusted CBC-choice-task-only estimates of scale. Text-only, not-incentive-alignedmeasures based on estimation data alonemightgive the firm false confidence because the analysisoverestimates scale, but increases |γmarket research − γtrue |.We next show that errors due to over- or underesti-mating scale have substantial strategic implications.
8.8. The Empirical Data Produce Strategic EffectsAnalogous to Those in the Stylized Model
Table 1 previewed relative profits as a function ofstrategic positioning. We created Table 1 by holdingconstant the (heterogeneous) relative partworths fromthe smartwatch study, but counterfactually varying thelevel of scale adjustment. (Unadjusted γi continues tovary among respondents.) For each combination ofstrategic positioning attributes (silver versus goldcolor), we use the root-finding method described inAllenby et al. (2014) to find the price equilibria. Inorder to avoid extrapolation beyond the price rangeused in the CBC experiment, we cap prices at the upperlimit of the data ($449). Because more respondentspreferred silver to gold (65.7%) than vice versa, theanalogy to the stylizedmodel is r = silver, even though“r” is mnemonically cumbersome for silver.Using the same heterogeneous relative partworths,
we calculate γcutoff as the scale adjustment for whichthe follower’s undifferentiated profits (π*
2rr) equal itsdifferentiated profits (π*
2rs). Numerically, γcutoff @ 0.6.As an illustration only, we choose a true scale abovethe cutoff (γtrue � 0.8) and a true scale below the cutoff(γtrue � 0.4). If we assume that the true scale is 0.8 andthe market is 11.9 million units (Reisinger 2017), thenmisestimating the true scale to be below the cutoff andnot differentiating from the innovator would result inover a $100 million opportunity loss for the follower.We obtained similar results when we used CBC sim-ulators forwatch face (rectangular versus round),watchband (black versus brown or other combinations), oralternative model normalizations. In all counterfactualtests using empirical HB CBC partworths, the marketalways shifted from differentiated to undifferentiatedas (true) scale decreased through a critical value.With γcutoff @ 0.6, we interpret the implications of
Table 2. For the text-only, no-incentive CBC study,estimation-based scale implies differentiation, whereasvalidation-based scale reverses the strategic recom-mendation to no differentiation. For the realistic-image,incentive-aligned CBC study, estimation-based scaleimplies differentiation, whereas validation-based scaleimplies that scale is close to the cutoff where differen-tiation and no differentiation are equally profitable.Validation adjustment has strategic implications.
Table 2. Posterior Means of Relative Scale Adjustment
Text only, no incentive alignment Realistic images, incentive alignment
Scale is based on estimation choice tasks 1.00a 0.86(n.a.) (0.06)
Scale is adjusted to validation task 0.35 0.61(0.04) (0.06)
Notes. Standard deviations are in parentheses. The full posterior distribution is available from the authors. n.a., not applicable.aNormalized to 1.00 for identification.
Hauser, Eggers, and Selove: Scale in Choice-Based Conjoint AnalysisMarketing Science, 2019, vol. 38, no. 6, pp. 1059–1081, © 2019 The Author(s) 1073
9. Robustness Tests9.1. Alternative Normalizations of Scale Do Not
Change the ResultsWe compare empirical estimates obtained from theMcFadden (2014) normalization in the stylizedmodel(ηi � 1 and γi log-normally distributed), the Sonnieret al. (2007) normalization (ηi � 1 and µi � 1/γi log-normally distributed), and the Allenby et al. (2014)normalization (γi � 1 and ηi log-normally distrib-uted). The posterior means of the scale adjustmentsvary slightly, but well within posterior confidenceintervals. The implications of the stylized model arenot dependent on the empirical normalization. Ratio-based WTP posterior means and medians are almostidentical between the McFadden (2014) normaliza-tion, and the Sonnier et al. (2007) normalization. Asanticipated by Sonnier et al. (2007, pp. 315–317), ratio-basedWTPposteriormeans varymore for theAllenbyet al. (2014) normalization, although median WTPestimates reduce this variation. Detailed estimatesare provided in Online Appendix 10.
9.2. Realistic Images and Incentive Alignment, EachActing Alone, Affect Relative Scale
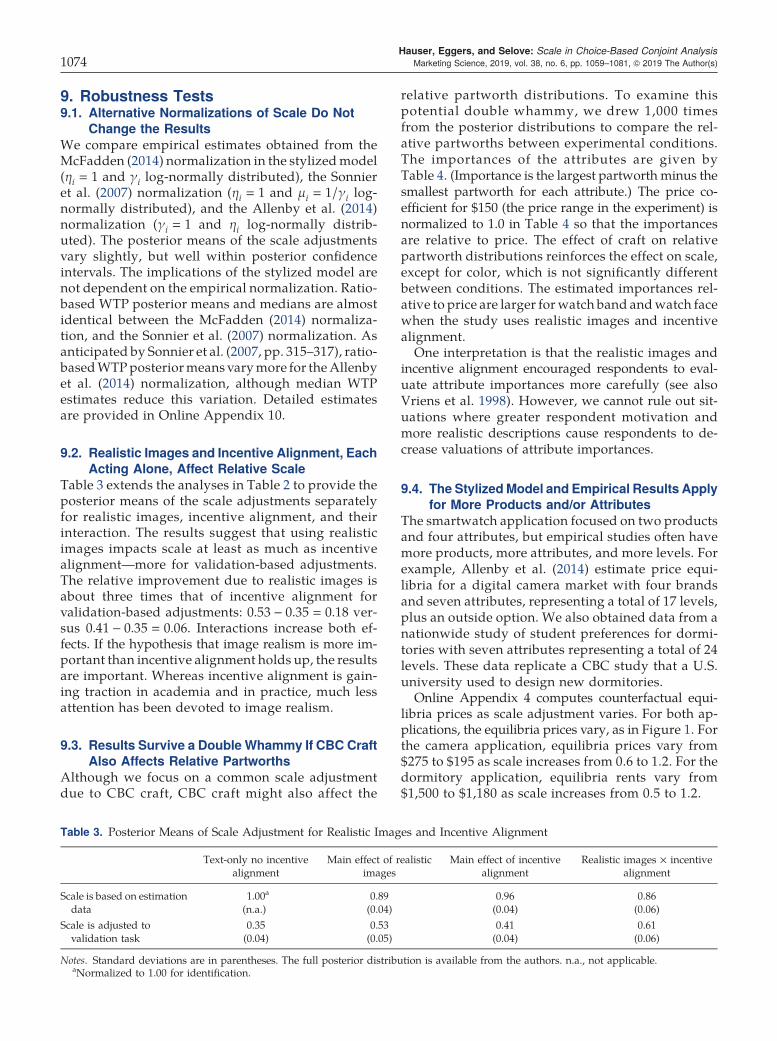
Table 3 extends the analyses in Table 2 to provide theposterior means of the scale adjustments separatelyfor realistic images, incentive alignment, and theirinteraction. The results suggest that using realisticimages impacts scale at least as much as incentivealignment—more for validation-based adjustments.The relative improvement due to realistic images isabout three times that of incentive alignment forvalidation-based adjustments: 0.53 − 0.35 � 0.18 ver-sus 0.41 − 0.35 � 0.06. Interactions increase both ef-fects. If the hypothesis that image realism is more im-portant than incentive alignment holds up, the resultsare important. Whereas incentive alignment is gain-ing traction in academia and in practice, much lessattention has been devoted to image realism.
9.3. Results Survive a Double Whammy If CBC CraftAlso Affects Relative Partworths
Although we focus on a common scale adjustmentdue to CBC craft, CBC craft might also affect the
relative partworth distributions. To examine thispotential double whammy, we drew 1,000 timesfrom the posterior distributions to compare the rel-ative partworths between experimental conditions.The importances of the attributes are given byTable 4. (Importance is the largest partworth minus thesmallest partworth for each attribute.) The price co-efficient for $150 (the price range in the experiment) isnormalized to 1.0 in Table 4 so that the importancesare relative to price. The effect of craft on relativepartworth distributions reinforces the effect on scale,except for color, which is not significantly differentbetween conditions. The estimated importances rel-ative to price are larger for watch band andwatch facewhen the study uses realistic images and incentivealignment.One interpretation is that the realistic images and
incentive alignment encouraged respondents to eval-uate attribute importances more carefully (see alsoVriens et al. 1998). However, we cannot rule out sit-uations where greater respondent motivation andmore realistic descriptions cause respondents to de-crease valuations of attribute importances.
9.4. The StylizedModel and Empirical Results Applyfor More Products and/or Attributes
The smartwatch application focused on two productsand four attributes, but empirical studies often havemore products, more attributes, and more levels. Forexample, Allenby et al. (2014) estimate price equi-libria for a digital camera market with four brandsand seven attributes, representing a total of 17 levels,plus an outside option. We also obtained data from anationwide study of student preferences for dormi-tories with seven attributes representing a total of 24levels. These data replicate a CBC study that a U.S.university used to design new dormitories.Online Appendix 4 computes counterfactual equi-
libria prices as scale adjustment varies. For both ap-plications, the equilibria prices vary, as in Figure 1. Forthe camera application, equilibria prices vary from$275 to $195 as scale increases from 0.6 to 1.2. For thedormitory application, equilibria rents vary from$1,500 to $1,180 as scale increases from 0.5 to 1.2.
Table 3. Posterior Means of Scale Adjustment for Realistic Images and Incentive Alignment
Text-only no incentivealignment
Main effect of realisticimages
Main effect of incentivealignment
Realistic images × incentivealignment
Scale is based on estimationdata
1.00a 0.89 0.96 0.86(n.a.) (0.04) (0.04) (0.06)
Scale is adjusted tovalidation task
0.35 0.53 0.41 0.61(0.04) (0.05) (0.04) (0.06)
Notes. Standard deviations are in parentheses. The full posterior distribution is available from the authors. n.a., not applicable.aNormalized to 1.00 for identification.
Hauser, Eggers, and Selove: Scale in Choice-Based Conjoint Analysis1074 Marketing Science, 2019, vol. 38, no. 6, pp. 1059–1081, © 2019 The Author(s)
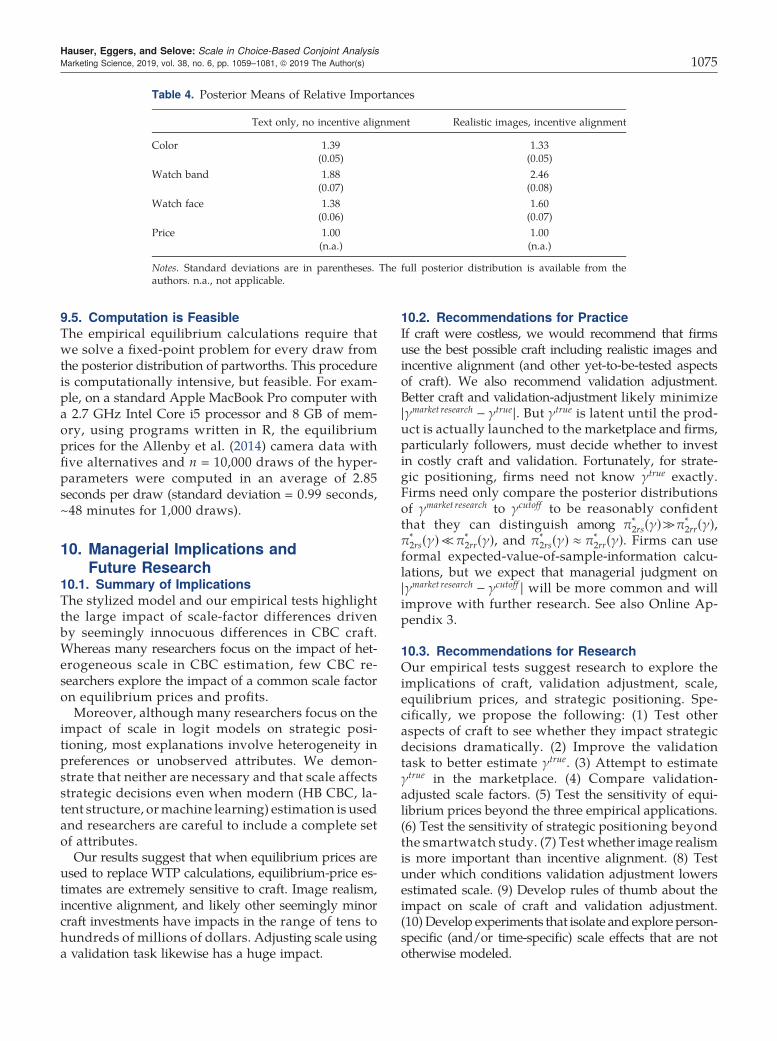
9.5. Computation is FeasibleThe empirical equilibrium calculations require thatwe solve a fixed-point problem for every draw fromthe posterior distribution of partworths. This procedureis computationally intensive, but feasible. For exam-ple, on a standard Apple MacBook Pro computer witha 2.7 GHz Intel Core i5 processor and 8 GB of mem-ory, using programs written in R, the equilibriumprices for the Allenby et al. (2014) camera data withfive alternatives and n = 10,000 draws of the hyper-parameters were computed in an average of 2.85seconds per draw (standard deviation = 0.99 seconds,~48 minutes for 1,000 draws).
10. Managerial Implications andFuture Research
10.1. Summary of ImplicationsThe stylized model and our empirical tests highlightthe large impact of scale-factor differences drivenby seemingly innocuous differences in CBC craft.Whereas many researchers focus on the impact of het-erogeneous scale in CBC estimation, few CBC re-searchers explore the impact of a common scale factoron equilibrium prices and profits.
Moreover, although many researchers focus on theimpact of scale in logit models on strategic posi-tioning, most explanations involve heterogeneity inpreferences or unobserved attributes. We demon-strate that neither are necessary and that scale affectsstrategic decisions even when modern (HB CBC, la-tent structure, ormachine learning) estimation is usedand researchers are careful to include a complete setof attributes.
Our results suggest that when equilibrium prices areused to replace WTP calculations, equilibrium-price es-timates are extremely sensitive to craft. Image realism,incentive alignment, and likely other seemingly minorcraft investments have impacts in the range of tens tohundreds of millions of dollars. Adjusting scale usinga validation task likewise has a huge impact.
10.2. Recommendations for PracticeIf craft were costless, we would recommend that firmsuse the best possible craft including realistic images andincentive alignment (and other yet-to-be-tested aspectsof craft). We also recommend validation adjustment.Better craft and validation-adjustment likely minimize|γmarket research − γtrue |. But γtrue is latent until the prod-uct is actually launched to the marketplace and firms,particularly followers, must decide whether to investin costly craft and validation. Fortunately, for strate-gic positioning, firms need not know γtrue exactly.Firms need only compare the posterior distributionsof γmarket research to γcutoff to be reasonably confidentthat they can distinguish among π*
2rs(γ)≫π*2rr(γ),
π*2rs(γ)≪π*
2rr(γ), and π*2rs(γ) ≈ π*
2rr(γ). Firms can useformal expected-value-of-sample-information calcu-lations, but we expect that managerial judgment on|γmarket research − γcutoff | will be more common and willimprove with further research. See also Online Ap-pendix 3.
10.3. Recommendations for ResearchOur empirical tests suggest research to explore theimplications of craft, validation adjustment, scale,equilibrium prices, and strategic positioning. Spe-cifically, we propose the following: (1) Test otheraspects of craft to see whether they impact strategicdecisions dramatically. (2) Improve the validationtask to better estimate γtrue. (3) Attempt to estimateγtrue in the marketplace. (4) Compare validation-adjusted scale factors. (5) Test the sensitivity of equi-librium prices beyond the three empirical applications.(6) Test the sensitivity of strategic positioning beyondthe smartwatch study. (7) Test whether image realismis more important than incentive alignment. (8) Testunder which conditions validation adjustment lowersestimated scale. (9) Develop rules of thumb about theimpact on scale of craft and validation adjustment.(10) Develop experiments that isolate and explore person-specific (and/or time-specific) scale effects that are nototherwise modeled.
Table 4. Posterior Means of Relative Importances
Text only, no incentive alignment Realistic images, incentive alignment
Color 1.39 1.33(0.05) (0.05)
Watch band 1.88 2.46(0.07) (0.08)
Watch face 1.38 1.60(0.06) (0.07)
Price 1.00 1.00(n.a.) (n.a.)
Notes. Standard deviations are in parentheses. The full posterior distribution is available from theauthors. n.a., not applicable.
Hauser, Eggers, and Selove: Scale in Choice-Based Conjoint AnalysisMarketing Science, 2019, vol. 38, no. 6, pp. 1059–1081, © 2019 The Author(s) 1075

AcknowledgmentsThe authors thank the editor, the area editor, and the anon-ymous reviewers for their comments during the revisionprocess. They are grateful for comments and suggestions by
participants of the 2016 Sawtooth Software Conference and2017 Marketing Science Conference. They thank Greg Allenbyfor sharing the data and code from the camera study com-pleted by him and his co-authors.
Appendix B. Proofs of Results and PropositionsThroughout this appendix, for notational simplicity, we dropthe superscript onγtrue and write it simply as γ. Results in thisappendixare stated innotationalshorthand,butare thesameasthose in the text. All proofs assume η is normalized to 1.
Result B.1. For γ→ 0, π*2rr >π*
2rs, π*1rs >π*
1rr, and π*1rs >π*
2rs.
Proof. This proof addresses first-order conditions. We ad-dress second-order and cross-partial conditions when weexamine existence and uniqueness later in this appendix.As γ→ 0, the logit curve becomes extremely flat, whichmotivates a Taylor’s series expansion of market share aroundβh � βℓ. When βh � βℓ, the logit equations for the marketshares are identical for firms 1 and 2; identical for all
Appendix A. Summary of Notationi Indexes consumersj Indexes firms; firm 1 is the innovator, and firm 2 is the followerajk Indicator function; ajk � 1 if profile j has attribute k, ajk � −1 otherwisecj Firm j’s marginal costCj Firm j’s fixed costsr A product attribute; we can think of r as red (or rose, regular, round, or routine)s Aproduct attribute; we can think of s as silver (or sapphire, small, square, or special); a firm’s product can have either r
or s, but it cannot have both or neitherpj Firm j’s pricep*jrr Nash equilibrium price for firm j given that firm 1 chooses r and firm 2 chooses r; define p*jrs, p
*jsr, and p*jss analogously
Pijrr Probability that consumer i purchases product from firm j given that firm 1 chooses r and firm 2 chooses r; define Pijrs,Pijsr, and Pijss analogously
PRjrr Probability that a consumer in segment R purchases product from firm j given that firm 1 chooses r and firm 2chooses r; define PRjrs, PRjsr, PRjss, PSjrs, PSjsr, and PSjss, analogously
R Size of segment R; we use italics for the size of the segment; non-italics to name the segmentS Size of segment SWTP Willingness to payHB CBC Hierarchical Bayes choice-based conjointuij Utility that consumer i perceives for firm j’s productuio Utility that consumer i perceives for the outside optionuo Utility of outside option for segments R and SuRj Utility of firm j’s product among consumers in segment RuSj Utility of firm j’s product among consumers in segment SV Number (measure) of consumersβri Relative partworth for r for consumer iβsi Relative partworth for s for consumer iβrR Relative partworth of r for all i∈ R; define βsR, βrS, and βsS analogouslyβh Higher partworth, βrR � βsS � βh
βℓ Lower partworth, βrS � βsR � βℓ; theory holds if βℓ normalized to zero, but is less intuitiveβki Relative partworth for attribute k and consumer iδrj Indicator function for whether firm j’s product has attribute r; define δsj analogouslyεij Error term for consumer i for firm j’s product; errors are independent and identically distributed extreme value
random variablesηi Price coefficient, normalized to 1 in the stylized model and some empirical applicationsγi Scale when ηi normalized to 1; larger values imply smaller relative magnitude of the error termγasymptotic Scale obtained with theoretically best quality market researchγcutoff cutoff value for scale; γ>γcutoff implies differentiation; γ<γcutoff no differentiationγhigher, γlower Scale as affected by higher- or lower-cost market researchγQV Scale adjustment due to experimental cell and/or validation taskγtrue The true scale (sometimes γ for notational simplicity in proofs if not confused with γi)λQh , λV , λQhV Used to identify scale effects for market-research-quality conditions (Qh
i , Vi indicators)µi Sonnier et al. (2007) renormalization such that γi ≡ 1/µiπj Profits for firm jπ*jrr Profits for firm j at the Nash equilibrium prices; define π*
jrs, π*jsr, and π*
jss analogouslyΔR2rr Defined in the proof to Result B.1; ΔS2rr and other terms for rs, sr, and ss are defined analogously
Hauser, Eggers, and Selove: Scale in Choice-Based Conjoint Analysis1076 Marketing Science, 2019, vol. 38, no. 6, pp. 1059–1081, © 2019 The Author(s)

strategies, rr, rs, sr, and ss; and symmetric with respect to firm1 and firm 2. Thus, at βh � βℓ, we have
p*1rr � p*2rr � p*1rs � p*2rs � p at βh � βℓ,
P*R1rr � P*
R2rr � P*R1rs � P*
R2rs � P at βh � βℓ,
P*S1rr � P*
S2rr � P*S1rs � P*
S2rs � P at βh � βℓ.
Because the prices and shares are identical, we have
π*1rr � π*
2rr � π*1rs � π*
2rs �1γ
P1 − P
at βh � βℓ,
where the last step comes from substituting the equalitiesfor P in the implicit first-order conditions and simplifyingusingR + S � 1. Similar equations apply for rs, sr, and ss andfirm 2:
∂PR1rr
∂p1rr� −γtrueeγ
true(βh−p1rr)[eγtrue(βh−p2rr) + eγtrueuo ]
[eγtrue(βh−p1rr) + eγtrue(βh−p2rr) + eγtrueuo ]2� −γtruePR1rr(1 − PR1rr),
∂π1rr
∂p1rr�RPR1rr + SPS1rr − γtruep1rr{RPR1rr(1 − PR1rr)+ SPS1rr(1 − PS1rr)} � 0,
p*1rr �1
γtrue
RP*R1rr + SP*
S1rr
RP*R1rr(1 − P*
R1rr) + SP*S1rr(1 − P*
S1rr),
π*1rr �
1γtrue
(RP*R1rr + SP*
S1rr)2RP*
R1rr(1 − P*R1rr) + SP*
S1rr(1 − P*S1rr)
.
We obtain the optimal price by solving the followingfixed-point problem in p:
γp � 11 − P
� 2e−γp + eγuo
e−γp + eγuousing P � e−γp
2e−γp + eγuo.
Because the right-hand side is decreasing in p on the range[1, 1.5], there will be exactly one solution in the range ofγp∈ [1, 1.5] for small γ. We compute the partial derivatives ofthe P’s at βh � βℓ:
∂PR2rr
∂βh� γP(1 − 2P) ≡ γΔR2rr,
∂PS2rr
∂βh� 0 ≡ γΔS2rr,
∂PR2rs
∂βh� −γP2 ≡ γΔR2rs,
∂PS2rs
∂βh� γP(1 − P) ≡ γΔS2rs,
Δ � βh − βℓ.
We now use a Taylor’s series expansion with respect toβh. Using standard mathematical arguments, higher-orderterms that are O(γ2) or higher vanish as γ→ 0. (The ratioof terms O(γ2) or higher to terms O(γ) goes to zero as γ→ 0.)Substituting the expressions for the partial derivatives intothe first-order conditions, multiplying by γ, and using theabove notation, we obtain
γπ*2rr �
[R(P + γΔR2rrΔ) + S(P + γΔS2rrΔ]2 +O(γ2)[R(P + γΔR2rrΔ)((1 − P) − γΔR2rrΔ) +
S(P + γΔS2rrΔ)((1 − P) − γΔS2rrΔ) +O(γ2)],
γπ*2rr �
P2 + 2γΔ(RΔR2rr + SΔS2rr) +O(γ2)P(1 − P) + γΔ(1 − 2P)(RΔR2rr + SΔS2rr) +O(γ2).
Similarly,
γπ*2rs �
P2 + 2γΔ(RΔR2rs + SΔS2rs) +O(γ2)P(1 − P) + γΔ(1 − 2P)(RΔR2rs + SΔS2rs) +O(γ2).
Because all terms in the numerators and denominators ofγπ*
2rr and γπ*2rs are clearly positive, the condition for γπ*
2rr >
γπ*2rs for γ→ 0 becomes
P2 + 2γΔ(RΔR2rr + SΔS2rr)[P(1 − P) + γΔ(1 − 2P)(RΔR2rs
+ SΔS2rs)]>P2 + 2γΔ(RΔR2rs + SΔS2rs)[P(1 − P)+ γΔ(1 − 2P)(RΔR2rs + SΔS2rs)].
After simplification and ignoring terms that are O(γ2), thisexpression reduces to
γΔP[(RΔR2rr + SΔS2rr) − (RΔR2rs + SΔS2rs)][2 − 3P + 2P2]> 0.
We need only show that both terms in brackets are positive.We show the first term in brackets is positive because
(RΔR2rr + SΔS2rr) − (RΔR2rs + SΔS2rs)� (RP(1 − P) − RP2) − (SP(1 − P) − RP2)> 0.
The last step follows from R>S. We show the second term ispositive because its minimum occurs at P � 3
4 and its value atthis minimum is 2 − 3P + 2P2 � 7
8. Thus, 2 − 3P + 2P2 is pos-itive for all P∈ [0, 1].
To prove that π*1rs >π*
1rr for γ→ 0, we use another Taylor’sseries expansion and simplify by the same procedures thatrecognize that higher-order terms vanish. Most of the algebrais the same until we come down to the following term inbrackets (now reversed because rs is more profitable for firm 1than rr as γ→ 0). Taking derivatives gives
∂PR1rr
∂βh� γP(1 − 2P) ≡ γΔR1rr,
∂PS1rr
∂βh� 0 ≡ γΔS1rr,
∂PR1rs
∂βh� γP(1 − P) ≡ γΔR1rs,
∂PS1rs
∂βh� −γP2 ≡ γΔS1rs.
The corresponding expression in brackets becomes (forγπ*
1rs − γπ*1rr)
(RΔR1rs + SΔS1rs) − (RΔR1rr + SΔS1rr)� (RP(1 − P) − SP2) − (RP(1 − P) − RP2)> 0,
where the last step is true because R> S.By exploiting symmetry, we have π*
1rr � π*2rr, yielding the
result that π*1rs >π*
1rr � π*2rr >π*
2rs. □
Lemma B.1. γp*1rs < (1 − P*R1rs)−1 and γp*2rs < (1 − P*
S2rs)−1. Re-lated conditions hold for rr, ss, and sr.
Proof. We use the first-order conditions (for rs) given in theproof to Result B.1. All terms are positive, so we cross mul-tiply. After cross multiplying, the first expression is equivalentto RP*
R1rs(1−P*R1rs)+SP*
S1rs(1−P*S1rs)>RP*
R1rs(1−P*R1rs)+SP*
S1rs(1−P*
R1rs), which is true if P*R1rs >P*
S1rs. The latter holds when-ever βh > βℓ for all γ by substituting directly into the logitequation.Weprove the second expression by using thefirst-order
Hauser, Eggers, and Selove: Scale in Choice-Based Conjoint AnalysisMarketing Science, 2019, vol. 38, no. 6, pp. 1059–1081, © 2019 The Author(s) 1077
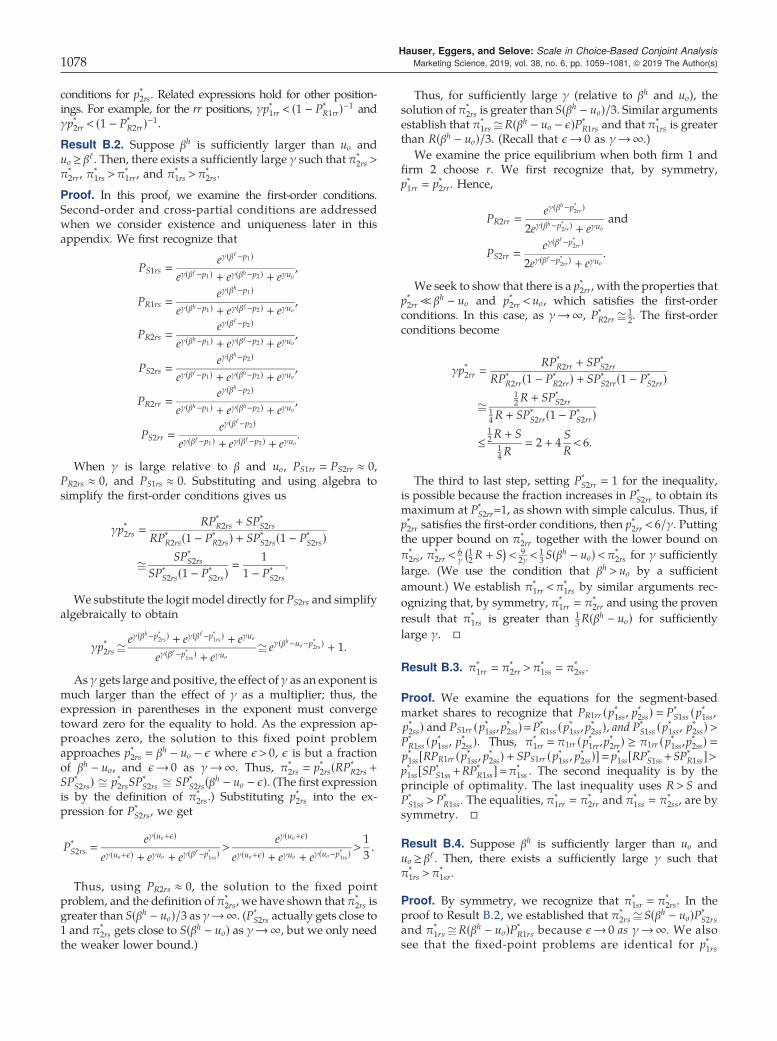
conditions for p*2rs. Related expressions hold for other position-ings. For example, for the rr positions, γp*1rr < (1 − P*
R1rr)−1 andγp*2rr < (1 − P*
R2rr)−1.Result B.2. Suppose βh is sufficiently larger than uo anduo ≥ βℓ. Then, there exists a sufficiently large γ such that π*
2rs >π*2rr, π
*1rs >π*
1rr, and π*1rs >π*
2rs.
Proof. In this proof, we examine the first-order conditions.Second-order and cross-partial conditions are addressedwhen we consider existence and uniqueness later in thisappendix. We first recognize that
PS1rs � eγ(βℓ−p1)
eγ(βℓ−p1) + eγ(βh−p2) + eγuo,
PR1rs � eγ(βh−p1)
eγ(βh−p1) + eγ(βℓ−p2) + eγuo,
PR2rs � eγ(βℓ−p2)
eγ(βh−p1) + eγ(βℓ−p2) + eγuo,
PS2rs � eγ(βh−p2)
eγ(βℓ−p1) + eγ(βh−p2) + eγuo,
PR2rr � eγ(βh−p2)
eγ(βh−p1) + eγ(βh−p2) + eγuo,
PS2rr � eγ(βℓ−p2)
eγ(βℓ−p1) + eγ(βℓ−p2) + eγuo.
When γ is large relative to β and uo, PS1rr � PS2rr ≈ 0,PR2rs ≈ 0, and PS1rs ≈ 0. Substituting and using algebra tosimplify the first-order conditions gives us
γp*2rs �RP*
R2rs + SP*S2rs
RP*R2rs(1 − P*
R2rs) + SP*S2rs(1 − P*
S2rs)@
SP*S2rs
SP*S2rs(1 − P*
S2rs)� 11 − P*
S2rs.
We substitute the logit model directly for PS2rs and simplifyalgebraically to obtain
γp*2rs @eγ(βh−p*2rs) + eγ(βℓ−p*1rs) + eγuo
eγ(βℓ−p*1rs) + eγuo@ eγ(β
h−uo−p*2rs) + 1.
As γ gets large and positive, the effect of γ as an exponent ismuch larger than the effect of γ as a multiplier; thus, theexpression in parentheses in the exponent must convergetoward zero for the equality to hold. As the expression ap-proaches zero, the solution to this fixed point problemapproaches p*2rs � βh − uo − ε where ε> 0, ε is but a fractionof βh − uo, and ε→ 0 as γ→∞. Thus, π*
2rs � p*2rs(RP*R2rs +
SP*S2rs) @ p*2rsSP
*S2rs @ SP*
S2rs(βh − uo − ε). (The first expressionis by the definition of π*
2rs.) Substituting p*2rs into the ex-pression for P*
S2rs, we get
P*S2rs �
eγ(uo+ε)
eγ(uo+ε) + eγuo + eγ(βℓ−p*1rs)>
eγ(uo+ε)
eγ(uo+ε) + eγuo + eγ(uo−p*1rs)>13.
Thus, using PR2rs ≈ 0, the solution to the fixed pointproblem, and the definition of π*
2rs, we have shown that π*2rs is
greater than S(βh − uo)/3 as γ→∞. (P*S2rs actually gets close to
1 and π*2rs gets close to S(βh − uo) as γ→∞, but we only need
the weaker lower bound.)
Thus, for sufficiently large γ (relative to βh and uo), thesolution of π*
2rs is greater than S(βh − uo)/3. Similar argumentsestablish that π*
1rs @R(βh − uo − ε)P*R1rs and that π*
1rs is greaterthan R(βh − uo)/3. (Recall that ε→ 0 as γ→∞.)
We examine the price equilibrium when both firm 1 andfirm 2 choose r. We first recognize that, by symmetry,p*1rr � p*2rr. Hence,
PR2rr � eγ(βh−p*2rr)
2eγ(βh−p*2rr) + eγuoand
PS2rr � eγ(βℓ−p*2rr)
2eγ(βℓ−p*2rr) + eγuo.
We seek to show that there is a p*2rr, with the properties thatp*2rr ≪ βh − uo and p*2rr < uo, which satisfies the first-orderconditions. In this case, as γ→∞, P*
R2rr @12. The first-order
conditions become
γp*2rr �RP*
R2rr + SP*S2rr
RP*R2rr(1 − P*
R2rr) + SP*S2rr(1 − P*
S2rr)@
12R + SP*
S2rr14R + SP*
S2rr(1 − P*S2rr)
≤12R + S
14R
� 2 + 4SR< 6.
The third to last step, setting P*S2rr � 1 for the inequality,
is possible because the fraction increases in P*S2rr to obtain its
maximum at P*S2rr=1, as shown with simple calculus. Thus, if
p*2rr satisfies the first-order conditions, then p*2rr < 6/γ. Puttingthe upper bound on π*
2rr together with the lower bound onπ*2rs, π
*2rr <
6γ
(12R + S
)< 9
2γ<13S(βh − uo)<π*
2rs for γ sufficientlylarge. (We use the condition that βh > uo by a sufficientamount.) We establish π*
1rr <π*1rs by similar arguments rec-
ognizing that, by symmetry, π*1rr � π*
2rr and using the provenresult that π*
1rs is greater than 13R(βh − uo) for sufficiently
large γ. □
Result B.3. π*1rr � π*
2rr >π*1ss � π*
2ss.
Proof. We examine the equations for the segment-basedmarket shares to recognize that PR1rr (p*1ss, p*2ss) � P*
S1ss (p*1ss,p*2ss) and PS1rr (p*1ss,p*2ss)�P*
R1ss (p*1ss,p*2ss), and P*S1ss (p*1ss, p*2ss)>
P*R1ss (p*1ss, p*2ss). Thus, π*
1rr � π1rr (p*1rr,p*2rr) ≥ π1rr (p*1ss,p*2ss) �p*1ss[RPR1rr (p*1ss, p*2ss) + SPS1rr (p*1ss, p*2ss)]�p*1ss[RP*
S1ss+SP*R1ss]>
p*1ss[SP*S1ss+RP*
R1ss]�π*1ss . The second inequality is by the
principle of optimality. The last inequality uses R> S andP*S1ss >P*
R1ss. The equalities, π*1rr � π*
2rr and π*1ss � π*
2ss, are bysymmetry. □
Result B.4. Suppose βh is sufficiently larger than uo anduo ≥ βℓ. Then, there exists a sufficiently large γ such thatπ*1rs >π*
1sr.
Proof. By symmetry, we recognize that π*1sr � π*
2rs. In theproof to Result B.2, we established that π*
2rs @ S(βh − uo)P*S2rs
and π*1rs @R(βh − uo)P*
R1rs because ε→ 0 as γ→∞. We alsosee that the fixed-point problems are identical for p*1rs
Hauser, Eggers, and Selove: Scale in Choice-Based Conjoint Analysis1078 Marketing Science, 2019, vol. 38, no. 6, pp. 1059–1081, © 2019 The Author(s)

and p*2rs; thus, as γ→∞, p*1rs @ p*2rs, which implies thatP*R1rs @P*
S2rs. Putting these relationships together impliesthat π*
1rs @R(βh − uo)P*R1rs > S(βh − uo)P*
R1rs @ S(βh − uo)P*S2rs @
π*2rs�π*
1sr. □
Proposition 1. For low true scale (γtrue → 0), the innovator (firm 1)targets the larger segment (r), and the follower chooses not to differ-entiate. The follower targets the larger segment (r).
Proposition 2. If βh is sufficiently larger than uo and if uo ≥ βℓ,then there exists a sufficiently large γtrue such that the innovatortargets the larger segment (r), and the follower chooses to differ-entiate by targeting the smaller segment (s).
Proof of Propositions 1 and 2. We prove the two prop-ositions together. Result B.1 establishes that π*
2rr >π*2rs as
γ→ 0. Result B.2 establishes that π*2rs >π*
2rr when γ is suffi-ciently large. Thus, if firm 1 chooses r, firm 2 chooses r asγ→ 0 and chooses s when γ gets sufficiently large.
To prove that firm 1 always chooses r, we first consider thecase where γ→ 0. If firm 1 chooses r, then firm 2 chooses r byProposition 1. Suppose instead that firm 1 chooses s; then firm2 will choose r. Firm 2 will choose r in this case because, byResult B.1, π*
1rs >π*1rr, and by symmetry, π*
2sr � π*1rs; hence,
π*2sr >π*
1rr � π*2rr. If firm 2 would choose r whenever firm 1
chooses s, firm 1would earn π*1sr. But π
*1sr � π*
2rs by symmetryand π*
2rs <π*2rr � π*
1rr by Result B.1. Thus, firm 1 earns moreprofits (π*
1rr) by choosing r than the profits it would obtain(π*
1sr) by choosing s.We now consider the case where γ is sufficiently large.
Suppose firm 1 chooses r; then firm 2 will choose s byResult B.2. Firm 1 receives π*
1rs. Suppose instead that firm 1chooses s; then firm 2 will choose r because π*
2sr � π*1rs by
symmetry and π*1rs >π*
1ss � π*2ss under the conditions of
Result B.2. Thus, if firm 1 chooses s, it receives π*1sr. Because
π*1rs >π*
1sr by Result B.4, firm 1 will choose r. □
Existence and UniquenessThe existence and uniqueness arguments require sub-stantial algebra. To avoid an excessively long appendix, weprovide the basic insight. Detailed calculations are availablefrom the authors. The proofs to Result B.1–Result B.4 rely onthe first-order conditions; thus we must show that a solu-tion to the first-order conditions, if it exists, satisfies thesecond-order conditions. We seek to show that the second-order conditions for the rs positions are negative at equilib-rium. Taking derivatives, we obtain the following second-order conditions for the rs positions:
∂2π*1rs
∂p21rs� − γRP*
R1rs(1 − P*R1rs)[2 − γp*1rs(1 − 2P*
R1rs)]− γSP*
S1rs(1 − P*S1rs)[2 − γp*1rs(1 − 2P*
S1rs)].Weuse LemmaB.1 to substitute (1 − P*
R1rs)−1 forγp*1rs. Theformer is a larger value, so if the conditions hold forthe larger value, they hold for γp*1rs. Algebra simplifiesthe right-hand side of the second-order condition to−γ{RP*
R1rs(1 − P*R1rs) + SP*
S1rs(1 − P*S1rs)(1 − 2P*
R1rs + 2P*S1rs)}.
With direct substitution in the logit model, recognizingp*1rs ≥ p*2rs, we show P*
S2rs ≥P*R1rs ≥P*
R2rs ≥P*S1rs. (We show
p*1rs ≥ p*2rs with implicit differentiation of the first-orderconditions with respect to R.) These inequalities implythat P*
S1rs < min{P*R1rs, 1 − P*
R1rs}. Hence, RP*R1rs(1 − P*
R1rs) ≥SP*
S1rs(1 − P*S1rs) whenever R> S. Thus, the second-order
condition is more negative than −γSP*S1rs(1 − P*
S1rs)(2−2P*
R1 + 2P*S1)< 0. We repeat the analysis for p*2rs using a
sufficient technical condition that either P*S2rs ≤ 1
2 or that theratio of S/R is above a minimum value. (The condition, notshown here, requires only S> 0 as γ→∞.) Although ourproof formally imposes the technical sufficient condition,we have not found any violation of the second-orderconditions at equilibrium, even with small S. Thus, witha (possible) mild restriction on S, the second-order condi-tions are satisfied whenever the first-order conditions hold.
We now establish that the second-order conditionsare satisfied on a compact set. We begin by showing al-gebraically that (1 − P*
R1rs)−1 is decreasing in p1rs and thatit decreases from a finite positive value, which we callFR1rs (p1rs � 0)> 1 . As p1rs →∞, (1 − P*
R1rs)−1decreases to 1.But γp1rs increases from 0 to ∞; thus, there must be a so-lution to γp1rs � (1 − PR1rs)−1 for every p2rs. Call this solutionpm1rs (p2rs). Because (1 − P*
R1rs)−1 is decreasing in γp1rs, it mustbe true that γp1rs ≤ (1 − PR1rs)−1 for all p1rs ∈ [0, pm1rs (p2rs)].Using similar arguments, we show there exists a pm2rs (p1rs)such that γp2rs ≤ (1 − PS2rs)−1for all p2rs ∈ [0, pm2rs (p1rs)]. To-gether, p1rs ∈ [0, pm1rs (p2rs)] and p2rs ∈ [0, pm2rs (p1rs)] define acompact set that is a subset of p1rs ∈ [0, pm1rs(0)] andp2rs ∈ [0, pm2rs(0)]. (The term pm1rs (p2rs) is continuous and de-creasing in p2rs, and pm2rs (p1rs) is continuous and decreas-ing in p1rs; pm1rs (p2rs), pm2rs (p1rs)> 0.) We have already estab-lished that P*
S2rs ≥P*R1rs ≥P*
R2rs ≥P*S1rs when p*1rs ≥ p*2rs. If we
restrict the compact set to p1rs ≥ p2rs and the price differ-ence is not too large, we have PS2rs ≥PR1rs ≥PR2rs ≥PS1rs onthe set. This simplifies the proof, but is not necessary. Thus,we can choose a compact set such that γp1rs � (1 − PR1rs)−1,γp2rs ≤ (1 − PS2rs)−1, and PS2rs ≥PR1rs ≥PR2rs ≥PS1rs on the set.This set contains the interior solution to the first-orderconditions. Using arguments similar to those we used forthe equilibrium prices, we establish that the second-orderconditions hold on this compact set. If necessary,we imposea weak technical condition on S/R. This implies that bothprofit functions are concave on the compact set. Concavityon a compact set guarantees that the solution exists and, bythe arguments in the previous paragraph, that the solutionis an interior solution. Numerical calculations, for a widevariety of parameter values, suggest that the second-orderconditions hold on the compact set, that the second-orderconditions hold outside the set (the restrictions are suffi-cient but not necessary), that the second-order conditionshold for prices satisfying p2rs > p1rs, and that, at equilibrium,the second-order conditions hold for all S.
The proof for the rr positions follows arguments that aresimilar to those for the rs positions. We do not need thetechnical condition on S because P*
S2rr ≤ 12 implies that S> 0 is
sufficient. The compact set is simpler because p*1rr � p*2rr bysymmetry. The proofs for the sr and ss positions use relatedconditions and follow the logic of the proofs for the rs and rrpositions. □
Hauser, Eggers, and Selove: Scale in Choice-Based Conjoint AnalysisMarketing Science, 2019, vol. 38, no. 6, pp. 1059–1081, © 2019 The Author(s) 1079
Uniqueness requires that we examine the cross-partialderivatives, illustrated here for rs:
∂2π1rs
∂p1rs∂p2rs� γRPR1rsPR2rs[1 − γp1rs(1 − 2PR1rs)]+ γRPS1rsPS2rs[1 − γp1rs(1 − 2PS1rs)].
Restricting ourselves to the a compact set as in the existencearguments,we canuseγp1rs≤1/(1−PR1rs), γp2rs ≤ 1/(1 − PS2rs),and PS2rs ≥PR1rs ≥PR2rs ≥PS1rs. We substitute to show thatwhen the cross-partial derivative is positive (similar con-ditions and a similar proof apply when it is negative),
∂2π1rs
∂p21rs
−
∂2π1rs
∂p1rs∂p2rs
≥ γ
1 − PR1rs
{RPR1rs(1 − PR1rs)2
+ R(1 − PR1rs − PR2rs)P2R1rs
+ SPS1rs(1 − PS1rs)(1 − PR1rs)+ SPS1rs(1 − PS1rs − PS2rs)· (2PS1rs − PR1rs)}.
We substitute further to show the third term on the right-hand side is larger than the, possibly negative, fourth term.Hence, the cross-partial condition is positive for π1rs on thecompact set. The cross-partial condition for π2rs is satisfiedwith a technical condition on S. Numerical calculations, fora wide variety of parameter values, suggest that the cross-partial conditions hold on the compact set, that the cross-partial conditions hold outside the set (the restrictions aresufficient but not necessary), that the cross-partial conditionshold for prices satisfying p2rs > p1rs, and that, at equilibrium,the cross-partial conditions hold for all S.
In summary, subject to (possible) technical conditions onthe magnitude of S, we have proven that interior-solutionprice equilibria exist and are unique. At minimum, we haveshown that this is true for many, if not most, markets, Wehave proven that the equilibria exist and are unique formarkets satisfying the technical conditions on S/R. □
Corollary B.1. Firm 1 selects r for both γlower and γhigher.
Proof. The result follows directly from Propositions 1 and 2.
Firm chooses r if γlower <γcutoff by Proposition 1 and chooses r ifγlower ≥γcutoff by Proposition 2. Thus, firm 1 chooses r inde-pendently of γlower. We use the same arguments to show thatfirm1 chooses r independently ofγhigher. (The result also requirescontinuity of the profit functions, proven elsewhere.) □
Corollary B.2. If firm 2 acts on γlower (believes γlower � γtrue) andif, in the marketplace, γlower ≠γtrue, then firm 2 might choose thestrategy that does not maximize profits.
Proof. We provide two examples. If γlower <γcutoff <γtrue, then,if firm 2 acts on γlower, it will choose r by Proposition 1 becauseγlower <γcutoff , but the profit-maximizing decision is s byProposition 2 because γcutoff <γtrue). If γtrue <γcutoff <γlower, thenfirm 2 will choose s by Proposition 2 because γcutoff <γlower, butthe profit-maximizing decision is to choose r by Proposition 1because γtrue <γcutoff . The word “might” is important. Firm 2might choose the correct strategy, even if γlower ≠γtrue whenboth γlower and γtrue are on the same side of γcutoff . □
Appendix C. List of Online Appendices1. Numerical Example to Illustrate Stylized Model2. Numerical Example of Craft Decisions by a Sophisti-
cated Follower3. Practical Recommendations for CBC Craft4. Equilibrium Prices and Brief Descriptions for the
Camera and Dormitory Studies5. Brief Summary of the McFadden (2014) (Used in
StylizedModel), Sonnier et al. (2007), andAllenby et al. (2014)HB CBC Normalizations
6. Specifications of the Bayesian Methods to Estimate theScale-Adjustment Factors
7. Comparison of Estimates for Scale Adjustment Factorsfrom the Three Normalizations
8. Alternative Estimations Accounting for Gender, forSplit Sample, for Split Choice Task, and for a Mixture ofNormal Distributions
9. Posterior Distributions for Scale Adjustment Factorsand Attribute Importances
10. Posterior WTP Estimates from the Three Norma-lizations
11. Hit Rates and Uncertainty Explained (U2) for HoldoutTests and Validation Tests
12. Empirical Posttest for Validation Task13. Relationship of the Minimum vs. Maximum Differ-
entiation Literature to the Stylized Model14. Comments on a Simultaneous Positioning Game15. Additional Citations: SixMarketing Science Papers That
Discuss Scale Explicitly
Endnotes1 Following McFadden (2014), we define scale as the magnitude ofthe price coefficient relative to the standard deviation of the error.Other authors use alternative normalizations (e.g., Allenby et al.2014, p. 427; Sonnier et al. 2007, p. 315; Train 2009, p. 40). Weaddress the impact of these normalizations in later sections.2Peanut Labs is an international panel with 15 million prescreenedpanelists from 36 countries. Their many corporate clients cumula-tively gather data from approximately 450,000 completed surveys permonth. Peanut Labs is a member of the Advertising Research Foun-dation, Council of American Survey ResearchOrganizations, EuropeanSociety for Opinion and Market Research, and Marketing ResearchAssociation and has won many awards (see web.peanutlabs.com).
ReferencesAksoy-Pierson M, Allon G, Federgruen A (2013) Price competition
under mixed multinomial logit demand functions. ManagementSci. 59(8):1817–1835.
AllenbyGM, Brazell J, Howell JR, Rossi PE (2014) Economic valuationof product features. Quant. Marketing Econom. 12(4):421–456.
Anderson SP, de Palma A, Thisse JF (1999) Discrete Choice Theory ofProduct Differentiation (MIT Press, Cambridge, MA).
Bass FM (1974) The theory of stochastic preference and brandswitching. J. Marketing Res. 11(1):1–20.
Beck MJ, Rose JM, Hensher DA (1993) Consistently inconsistent:The role of certainty, acceptability and scale in choice. Trans-portation Res. Part E: Logist. Transportation Rev. 56(September):81–93.
Cameron L, Cragg M, McFadden DL (2013) The role of conjointsurveys in reasonable royalty cases. Law360 (October 16),https://www.law360.com/articles/475390/the-role-of-conjoint-surveys-in-reasonable-royalty-cases.
Hauser, Eggers, and Selove: Scale in Choice-Based Conjoint Analysis1080 Marketing Science, 2019, vol. 38, no. 6, pp. 1059–1081, © 2019 The Author(s)

Caplin A, Nalebuff B (1991) Aggregation and imperfect competition:On the existence of equilibrium. Econometrica 59(1):25–59.
Choi SC, DeSarbo WS (1994) A conjoint simulation model in-corporating short-run price competition. J. Product InnovationManagement 11(5):451–459.
Choi SC, DeSarbo WS, Harker PT (1990) Product positioning underprice competition. Management Sci. 36(2):175–199.
Dahan E, Hauser JR (2002) The virtual customer. J. Product InnovationManagement 19(5):332–354.
Dahan E, Srinivasan V (2000) The predictive power of Internet-basedproduct concept testing using visual depiction and animation.J. Product Innovation Management 17(2):99–109.
de Palma A, Ginsburgh V, Thisse JF (1987) On existence of locationequilibria in the 3-firm Hotelling problem. J. Indust. Econom.36(2):245–252.
de Palma A, Ginsburgh V, Papageorgiou YY, Thisse JF (1985) Theprinciple of minimum differentiation holds under sufficientheterogeneity. Econometrica 53(4):767–781.
Ding M (2007) An incentive-aligned mechanism for conjoint analysis.J. Marketing Res. 54(May):214–223.
Ding M, Grewal R, Liechty J (2005) Incentive-aligned conjointanalysis. J. Marketing Res. 42(February):67–82.
Ding M, Hauser JR, Dong S, Dzyabura D, Yang Z, Su C, Gaskin S(2011) Unstructured direct elicitation of decision rules.J. Marketing Res. 48(February):116–127.
Dzyabura D, Jagabathula S, Muller E (2019) Accounting for dis-crepancies between online and offline shopping behavior.Marketing Sci. 38(1):88–106.
Economides N (1986) Minimal and maximal product differentiationin Hotelling’s duopoly. Econom. Lett. 21(1):67–71.
Evgeniou T, Boussios C, Zacharia G (2005) Generalized robustconjoint estimation. Marketing Sci. 24(3):415–429.
Fiebig DG, Keane MP, Louviere J, Wasi N (2010) The generalizedmultinomial logit model: Accounting for scale and coefficientheterogeneity. Marketing Sci. 29(3):393–421.
Gilbride TJ, Lenk PJ, Brazell JD (2008) Market share constraints andthe loss function in choice-based conjoint analysis.Marketing Sci.27(6):995–1011.
Hauser JR (1978) Testing the accuracy, usefulness, and significance ofprobabilistic models: An information theoretic approach. Oper.Res. 26(3):406–421.
Hotelling H (1929) Stability in competition. Econom. J. 39(153):41–57.Huber J, Orme BK, Miller R (1999) Dealing with product similarity
in conjoint simulations. Sawtooth Software: Research Paper Series,https://www.sawtoothsoftware.com/download/techpap/prodsim.pdf.
Irmen A, Thisse JF (1998) Competition in multi-characteristics spaces:Hotelling was almost right. J. Econom. Theory 78(1):76–102.
Keeney RL, Raiffa H (1976) Decisions with Multiple Objectives: Pref-erences and Value Tradeoffs (John Wiley & Sons, New York).
Koh L (2012) Order granting in part and denying in part motions toexclude certain expert opinions: Public redacted version. Apple,Inc. v. Samsung Elecs. Co., Case No. 12-CV-00630-LHK (N.D.Cal. Feb. 25, 2014).
Luo L, Kannan PK, Ratchford BT (2007) New product developmentunder channel acceptance. Marketing Sci. 26(2):149–163.
Manski CF (1977) The structure of random utility models. TheoryDecision 8(3):229–254.
McFadden DL (2014) Testimony of Daniel L. McFadden in the matterof determination of rates and terms for digital performance insound recordings and ephemeral recordings (WEB IV). Beforethe Copyright Royalty Board Library of Congress, WashingtonDC, Docket No. 14-CRB-0001-WR, October 6.
Meissner M, Oppewal H, Huber J (2016) How many options? be-havioral responses to two vs. five alternatives per choice. Proc.Sawtooth Software Conf.: September 2016 (Sawtooth Software, ParkCity, UT), 19–36.
Mintz H (2012) Apple wins $1 billion victory over Samsung. San JoseMercury News (August 24), https://www.mercurynews.com/2012/08/24/2012-apple-wins-1-billion-victory-over-samsung/.
Moorthy KS (1988) Product and price competition in a duopoly.Marketing Sci. 7(2):141–168.
Ofek E, Srinivasan V (2002) How much does the market value animprovement in aproduct attribute?Marketing Sci. 21(4):398–411.
Orme B (2014) Getting Started with Conjoint Analysis: Strategies forProduct Design and Pricing Research, 3rd ed. (Research PublishersLLC, Manhattan Beach, CA).
Orme B (2017) Personal email to the authors, July 25, 2017.Orme B, Chrzan K (2017) Becoming an Expert in Conjoint Analysis:
Choice Modelling for Pros (Sawtooth Software, Orem, UT).Pancreas J, Wang X, Dey DK (2016) Investigating the impact of
customer stochasticity on firm price discrimination strategiesusing a new Bayesian mixture scale heterogeneity model.Marketing Lett. 27(3):537–552.
Reisinger D (2017) Here’s howpopular AppleWatchwas last quarter.Fortune (February 8), http://fortune.com/2017/02/08/apple-watch-2016-sales/.
Rhee BD, de Palma A, Fornell C, Thisse JF (1992) Restoring theprinciple of minimum differentiation in product positioning.J. Econom. Management Strategy 1(3):475–505.
Salisbury LC, Feinberg FM (2010) Alleviating the constant stochasticvariance assumption in decision research: Theory, measurement,and experimental test. Marketing Sci. 29(1):1–17.
Sawtooth Software (2015) Report on conjoint analysis usage amongSawtooth Software customers. Accessed May 9, 2019, http://www.sawtoothsoftware.com/download/Conjoint_Report_2015.pdf.
Sawtooth Software (2016) Results of Sawtooth Software user sur-vey. AccessedMay 9, 2019, https://www.sawtoothsoftware.com/about-us/news-and-events/news/1693-results-of-2016-sawtooth-software-user-survey.
Sawtooth Software (2019) Randomized first choice settings. AccessedMay 9, 2019, https://www.sawtoothsoftware.com/help/lighthouse-studio/manual/randomizedfirstchoicesettingswindow.html.
Sonnier G, Ainslie A, Otter T (2007) Heterogeneity distributions ofwillingness-to-pay in choice models. Quant. Marketing Econom.5(3):313–331.
Swait J, Louviere J (1993) The role of the scale parameter in the es-timation and comparison of multinomial logit models. J. MarketingRes. 30(3):305–314.
Thurstone LL (1927) A law of comparative judgment. Psych. Rev.34(4):273–286.
Toubia O, Hauser JR, Simester DI (2004), Polyhedral methods foradaptive choice-based conjoint analysis, J. Marketing Res. 41(1):116–131.
Train KE (2009) Discrete Choice Methods with Simulation (CambridgeUniversity Press, Cambridge, UK).
Ulrich KT, Eppinger SD (2004) Product Design and Development,3rd ed. (McGraw-Hill, New York).
Urban GL, Hauser JR (1993) Design and Marketing of New Products,2nd ed. (Prentice-Hall, Englewood Cliffs, NJ).
Urban GL, Hauser JR (2004) “Listening-in” to find and explore newcombinations of customer needs. J. Marketing 68(April):72–87.
Vriens M, Loosschilder GH, Rosbergen E, Wittink DR (1998) Verbalvs. realistic pictorial representations in conjoint analysis withdesign attributes. J. Product InnovationManagement 15(5):455–467.
Whyte RM (2005) Order granting in part and denying in part Olin’smotion to exclude the testimony of John Kilpatrick. Palmisanoet al. v. Olin Corporation et al., Case No. C-03-01607 RMW(N.D. Cal. July 5, 2005).
Wlomert N, Eggers F (2016) Predicting new service adoption withconjoint analysis: External validity of BDM-based incentive-aligned and dual-response choice designs. Marketing Lett. 27(1):195–210.
Hauser, Eggers, and Selove: Scale in Choice-Based Conjoint AnalysisMarketing Science, 2019, vol. 38, no. 6, pp. 1059–1081, © 2019 The Author(s) 1081