the state of sustainability initiatives review 2014 · the state of sustainability initiatives ......
TRANSCRIPT

The State of Sustainability Initiatives Review 2014 Standards and the
Green Economy
Jason Potts, Matthew Lynch,Ann Wilkings, Gabriel Huppé,Maxine Cunningham, Vivek Voora
A Joint Initiative of ENTWINED, IDH, IIED, FAST, IISD
Authors: Jason Potts, Matthew Lynch, Ann Wilkings, Gabriel Huppé, Maxine Cunningham, Vivek Voora
Implementing Partners: International Institute for Sustainable Development (Jason Potts, Vivek Voora, Maxine Cunningham, Gabriel Huppé); International Institute for Environment and Development (Bill Vorley, Emma Blackmore); Finance Alliance for Sustainable Trade (Noemi Perez, Kim Kenney); ENTWINED Research Consortium (Mark Sanctuary, Maria Karborn, Stellan Forsberg); and the Sustainable Trade Initiative (Dave Boselie, Lucian Peppelenbos)
Contributors: Jan Maarten Dros (palm oil), Yvette Faber (coffee) and Gert van der Bijl (soy), Solidaridad; Ulrich Helberg (cocoa), consultant, sustainable cocoa sector in West Africa; Emma Blackmore (tea) and Simon Milledge (forestry), IIED; Simon Ferrigno (cotton), consultant, Sustainable & Organic Farm Systems; and Kevin Ogorzalek (sugarcane), WWF.
Cover image: CIFOR / CC BY-NC 2.0
Editors: Roma Ilnyckyj, Debora Holmes and Eve RickertDesigners: Joy Kenney and Jeff Werner
International Institute for Sustainable Development161 Portage Avenue East, 6th FloorWinnipeg, Manitoba Canada R3B 0Y4Tel: +1 (204) 958-7700Fax: +1 (204) 958-7710Email: [email protected] | Website: www.iisd.org
International Institute for Environment and Development80-86 Gray’s Inn Road, London WC1X 8NH Tel: +44 (0)20 7388 2117Fax: +44 (0)20 7388 2826
Email: [email protected]: www.iied.org
© 2014 International Institute for Sustainable Development (IISD) and the International Institute for Environment and Development (IIED).ISBN: 978-1-894784-45-0
2 | SSI Review 2014
Note from the SSI Management TeamThe State of Sustainability Initiatives (SSI) project is facilitated by the Sustainable Commodity Initiative and has been directly managed by the International Institute for Environment and Development (IIED), the International Institute for Sustainable Development (IISD), the Finance Alliance for Sustainable Trade, Environment and Trade in a World of Interdependence (ENTWINED), and the Sustainable Trade Initiative (IDH). The SSI project is motivated by recognition of the need for improved information exchange among stakeholders in voluntary sustainability initiatives and among voluntary sustainability standards themselves. The objective of the SSI project is to stimulate regular reporting on the state of play across voluntary sustainability standards, offering a framework for understanding the characteristics, important issues and market trends for select sustainability initiatives and standards operating in global markets. It is hoped that the Review can serve as a valuable tool for learning and strategic decision making between the private sector and the sustainability initiatives themselves.
The SSI management team
Shaping Sustainable Markets is the flagship research project for the Sustainable Markets Group at IIED. Can markets be “governed” to better benefit people and planet? This project explores the individual and combined impact of market governance mechanisms on sustainable development to find out what works where and why. We want to improve and broaden understanding of how market governance mechanisms can be designed and used to secure livelihoods and protect environments. Find out more about our work at http://shapingsustainablemarkets.iied.org.
The Swiss State Secretariat for Economic Affairs is a founding and core donor of the State of Sustainability Initiatives project. Current funding for the SSI is provided as part of a larger initiative led by SECO entitled the “VSS Information System Programme,” which supports data collection and dissemination to enable more strategic decision making by investors and other stakeholders in sustainable supply chains.
This research was funded in part by aid from the UK Government; however, the views expressed do not necessarily reflect the views of the UK Government.
SSI Review 2014 | 3
ReferencesConclusion
Markets
Criteria Development
Standards ContextThe Green Econom
y
Foreword
In 1992 the leaders of the world came together at the first Rio Earth Summit, historically acknowledging the imperative of a needs-based approach to sustainable development. Although Agenda 21 and the corresponding Rio Declaration made a call upon all citizens of the world to play a role in ensuring sustainable development, the UNCED process primarily spoke to the aspirations and obligations of governments.
Now, some 20 years later, we are forced to make a further acknowledgement, namely that governments alone cannot be relied upon to generate coordinated action at the global level with either the precision or timeliness typically required by the plethora of sustainability issues facing the planet today. The recent growth in the number and use of voluntary sustainability standards can largely be traced to a growing recognition of the failure of public action in addressing a host of sustainability issues.
In a very real sense, voluntary sustainability standards allow the very actors implicated in the processes leading to sustainable development impacts to identify and implement the appropriate corrective measures while integrating them directly within their business models. The need and ability of private sector innovation and investment, not to mention allocative efficiency of the market, to provide a more targeted and nimble approach to the implementation of sustainable development also explains the recent emphasis put on the need for a “green economy.”
Both voluntary sustainability standards and policy measures aimed at promoting a green economy hold the promise of more efficient and effective implementation of sustainable development goals. The common logic underlying green economy and voluntary sustainability standards discussions points toward their potential to play mutually reinforcing roles.
However, if voluntary sustainability standards and the green economy are tied by a common potential, they are also tied by common challenges. Both efforts, by virtue of their voluntary and largely unregulated character, have the ability to “say more than they do”—that is, to market themselves beyond their actual capacity to deliver. In so doing, voluntary sustainability standards and related green economy measures have the potential to enable
a misguided sense of complacency—potentially leading to reduced vigilance when vigilance is needed most. Rather disconcertingly, the “danger” posed by such approaches grows in proportion to their acceptance—which speaks to the immediate importance of deepening our understanding of whether, how and where such initiatives are delivering the desired outcomes.
The State of Sustainability Initiatives Review 2014 represents one small effort toward strengthening our understanding of how voluntary sustainability standards are developing over time, both in terms of the systems they deploy and the market impacts that they have. It is hoped that the ensuing data and analysis, when read in conjunction with the growing body of field-level impact data, will allow supply chain decision-makers to strengthen their own strategic decision-making processes in ways that provide optimal sustainable development impact.
The importance of improving our knowledge of the potential role of voluntary standards, however, goes beyond merely pragmatic questions of what the “most efficient means for achieving sustainable development” might be. The combined forces of globalization and trade liberalization have arguably established economic rationality as the supreme authority in international relations. When the very institutions that define “who we are” absorb and embody the vision of humans as homo economicus, we risk losing the capacity to care for those who lack economic “voice,” of which the poor and the environment are only too evident as examples.
Voluntary standards represent one of the most explicit efforts to balance purely “economic” interests with a deeper sense of human morality by asserting the primacy of care and compassion for others. In a word, the highest promise of voluntary standards may rest in their potential to make us more human. And so it is that we can also hope that by improving our understanding of the world of voluntary sustainability standards, we may also be able to improve our understanding of ourselves.
Sustainably yours,
Jason Potts, 2014
4 | SSI Review 2014
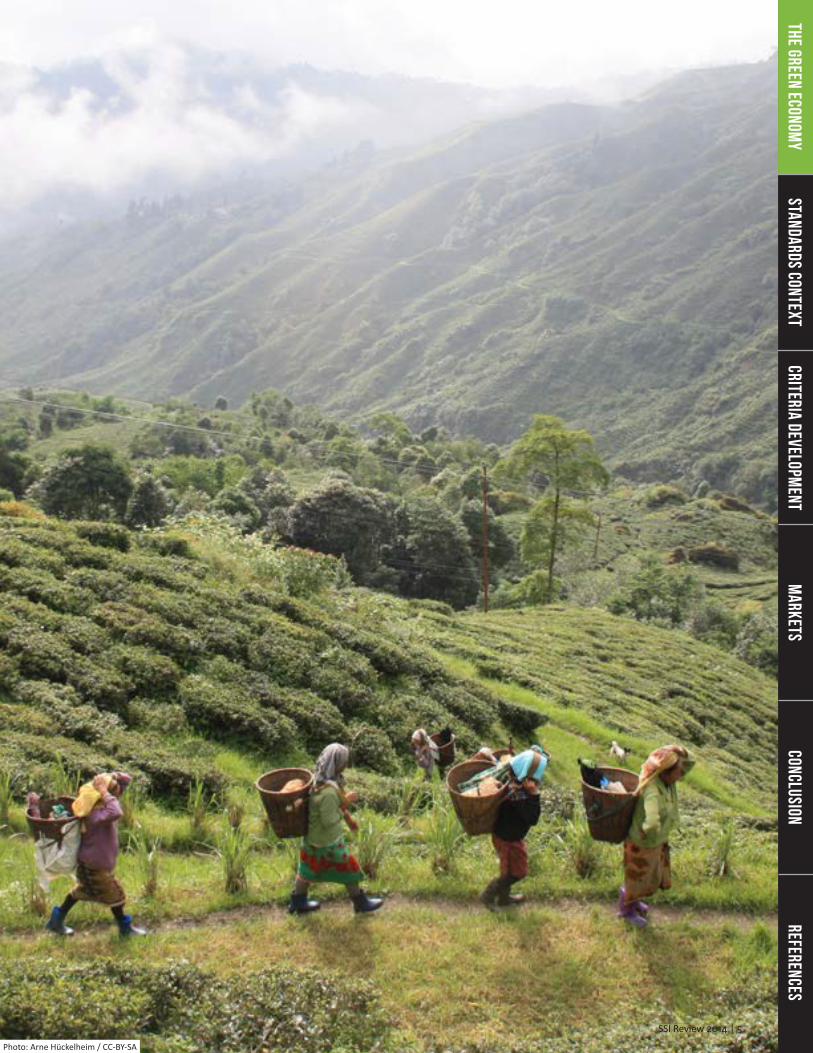
Photo: Arne Hückelheim / CC-BY-SA
SSI Review 2014 | 5
ReferencesConclusion
Markets
Criteria Development
Standards ContextThe Green Econom
y
Acknowledgements
The State of Sustainability Initiatives (SSI) project is a result of the support and efforts of many individuals and organizations. The SSI team thanks all those who supported the development of the project and, in particular, this edition of the SSI Review.
In particular, we would like to thank the SSI Advisory Panel for its strategic advice and guidance on the overall initiative, including the identification of key reporting indicators as well as the content and presentation of the SSI Review. Members include Ravi Sharma (CBD), Bruce Schlein (Citi), Daniele Giovannucci (COSA), Pilar Santacoloma (FAO), Salvador Garibay (FiBL), Helga Willer (FiBL), Catherine van der Wees (Hivos), Ricardo Melendez (ICTSD), Charlotte Hebebrand (IFA), Ellen Terpstra (IPC), Kristin Komives (ISEAL), Oliver von Hagen (ITC), Joseph Wozniak (ITC), Vanessa Stiffler-Claus (John Deere), Eddy Esselink (Product Board MVO), Chris Wunderlich (SCAN), Hans-Peter Egler (SECO), Ulrich Hoffman (UNCTAD), James Lomax (UNEP), Jan Kees Vis (Unilever) and Lee Ann Jackson (WTO). We extend a special thanks to Joseph Wozniak and Mathieu Lamolle at the International Trade Centre and Kristen Komives at ISEAL, each of whom provided instrumental support in communicating with voluntary sustainability initiatives and in collecting the data contained within this report. We would also like to thank Jason Clay (WWF), Cassio Franco Moreira (WWF), Kevin Ogorzalek (WWF) and Martin Peter (SECO) for their guidance throughout the development of the report. Lukas Kilcher (FiBL) and Nick Betts (Grain Farmers of
Ontario) provided support in collecting data on organic markets and soy markets more specifically. We express our deep gratitude to all the sustainability initiatives that agreed to provide information to the SSI project, both directly and through the International Trade Centre’s T4SD database. The shared commitment to transparency demonstrated by these organizations is particularly appreciated within the context of the limited resources of most initiatives. Participating organizations included the 4C Association, Better Cotton Initiative (BCI), Bonsucro, Cotton made in Africa (CmiA), Ethical Tea Partnership (ETP), Fairtrade International, Forest Stewardship Council (FSC), GLOBALG.A.P., International Federation of Organic Agriculture Movements (IFOAM), Programme for the Endorsement of Forest Certification (PEFC) schemes, ProTerra Foundation, Roundtable on Sustainable Biomaterials (RSB), Roundtable on Sustainable Palm Oil (RSPO), Round Table on Responsible Soy (RTRS), Sustainable Agriculture Network (SAN) of the Rainforest Alliance, and UTZ Certified.
Finally, the SSI Review would not have been possible without the monetary and in-kind contributions of the Swedish Foundation for Strategic Environmental Research (MISTRA) through the ENTWINED Research Consortium, UKAID, the Norwegian Agency for Development Cooperation (NORAD), and the State Secretariat for Economic Affairs (SECO). This report was also financially underwritten by IISD and IIED.
Data Sources and Disclaimer
One of the objectives of the SSI project is to contribute to the development of a more harmonized infrastructure for data collection and reporting. To that end, the SSI has worked in close partnership with a number of other leading organizations that share a similar objective, including, among others, the International Trade Centre (ITC), the International Social and Environmental Accreditation and Labelling Alliance (ISEAL), and the Research Institute of Organic Agriculture/Forschungsinstitut für biologischen Landbau (FiBL).
In particular, and in order to promote efficiency and accuracy, we have both fed data to, and drawn data from, the ITC’s Standards Map Database wherever possible. For data not covered under the ITC Standards Map Database, we have relied primarily on direct communication with standard-setting bodies and on third-party literature. Below is a brief listing of data sources, unless otherwise specified in the report:• Standard system data: ITC• Governance data: Standards bodies and ITC• Standard system content and criteria data: ITC.
Note: Criteria coverage only reflects specific matching with SSI indicators and should not be understood to suggest a given initiative’s entire treatment on a specific sustainability topic.
• Market data: Standards bodies and third-party literature. Note: SSI organic market data, unless otherwise specified, represents estimates made by the SSI drawing from FiBL and other data sources.
Unless otherwise reported, all of the market analysis and numerical representations of all data, regardless of the source, are strictly the work and responsibility of the SSI. Although we have done our best to ensure that our reporting reflects the data as provided by these sources as accurately as possible through a two-stage vetting process, the SSI takes full responsibility for all data and analysis contained within this report.
The Sustainable Agricultural Network (SAN) sets the standards for the Rainforest Alliance (RA) label. Therefore, the systems section of this review, with its focus on the standards bodies, refers to both SAN/RA; however, for simplicity, the market section refers to only Rainforest Alliance. Similarly, the systems section describes the work of the International Federation of Organic Agriculture Movements (IFOAM), which sets the standards for organic commodities. The market section uses “organic” to refer to commodities certified under any recognized organic certification, independent of whether or not they are actually compliant with IFOAM global standards.
6 | SSI Review 2014
NGO non-governmental organizationOECD Organisation for Economic Co-operation and DevelopmentPEFC Programme for the Endorsement of Forest CertificationPPM production and processing methodRA Rainforest AllianceRED Renewable Energy DirectiveRSB Roundtable on Sustainable BiomaterialsRSPO Roundtable on Sustainable Palm OilRTRS Round Table on Responsible SoySAN Sustainable Agriculture NetworkSFI Sustainable Forestry InitiativeSSI State of Sustainability InitiativesUNCED United Nations Conference on Environment and Development UNDP United Nations Development ProgrammeUNEP United Nations Environment ProgrammeUSDA United States Department of AgricultureVSS voluntary sustainability standardWCF World Cocoa FoundationWTO World Trade Organization
Acronyms
ACP African, Caribbean and Pacific BCI Better Cotton InitiativeCAGR compound annual growth rateCmiA Cotton made in AfricaCoC Chain of CustodyCOSA Committee on Sustainability AssessmentCSPK Certified Sustainable Palm KernelCSPO Certified Sustainable Palm OilETP Ethical Tea PartnershipEU-RED European Union Renewable Energy DirectiveFAO Food and Agriculture Organization of the United Nations FAST Finance Alliance for Sustainable TradeFiBL Research Institute of Organic AgricultureFLO Fairtrade Labelling Organizations International (“Fairtrade” or “Fairtrade International”) FSC Forest Stewardship CouncilGMO genetically modified organismGRASP GLOBALG.A.P. Risk Assessment on Social PracticeICCO International Cocoa OrganizationICI International Cocoa InitiativeICO International Coffee OrganizationIDH Sustainable Trade Initiative IFOAM International Federation of Organic Agriculture Movements (“Organic”)IISD International Institute for Sustainable DevelopmentILO International Labour OrganisationISEAL International Social and Environmental Accreditation and Labelling AllianceISCC International Sustainability and Carbon CertificationISO International Organization for StandardizationITC International Trade Centre
Units and Measures
KG kilogramMT metric tonHA hectareUS$ U.S. dollarUSD U.S. dollar€ euro£ pound sterling
SSI Review 2014 | 7
ReferencesConclusion
Markets
Criteria Development
Standards ContextThe Green Econom
y
Executive Summary
Voluntary sustainability standards have grown rapidly in number and importance in global commodity markets over the past decade. The growth of voluntary sustainability standards has occurred in parallel with growing recognition of the importance of economic drivers in implementing sustainable development, as evidenced by the global call for a green economy.
The State of Sustainability Initiatives Review 2014 reports on systems and market trends across 16 of the most important standards initiatives operating across 10 key commodity sectors. Initiatives covered in this report account for an estimated $31.6 billion in trade value, pointing toward their growing importance in defining terms of trade and opportunities for development across the commodity-producing world.
Key findings of the SSI Review 2014 include:
Sustainability standards continue to experience exceptional growth: The average annual growth rate of standard-compliant production across all commodity sectors in 2012 was a stunning 41 per cent, significantly outpacing the annual average growth of 2 per cent in the corresponding conventional commodity markets. Growth in compliant production was strongest in the palm oil sector, which experienced 90 per cent growth in 2012. Other leading commodity sectors for production growth in 2012 were sugar (74 per cent growth), cocoa (69 per cent growth) and cotton (55 per cent growth).
Sustainability standards have forcefully penetrated mainstream markets: The Review documents a persistent trend in sustainable sourcing commitments by manufacturers, which is resulting in significant market penetration in several commodity markets. For example, standard-compliant coffee, which led in terms of market penetration, reached a 40 per cent market share of global production in 2012 (up from 15 per cent in 2008). Other commodities with significant market shares (in terms of global production) in 2012 include cocoa (22 per cent; up from 3 per cent in 2008), palm oil (15 per cent; up from 2 per cent in 2008) and tea (12 per cent; up from 6 per cent in 2008).
Sustainable markets continue to be defined by persistent oversupply of standard-compliant production: While standard-compliant production has reached significant levels across select commodities, actual sales of products as “standard compliant” have not grown as rapidly, resulting in significant oversupply (typically between one-third and one-half of total compliant production is actually sold as compliant). This situation means that companies have ample choice for sustainable sourcing (positive outcome), but also suggests that the market may be placing downward pressure on the prices of sustainable products due to oversupply (negative outcome).
Production for sustainable markets is concentrated in more advanced, export-oriented economies: Supply of sustainable products is concentrated in select regions with more developed production capacity. Across developing countries, sustainable production is concentrated in Latin America. When developed countries can supply sustainable markets (as in the forestry sector), they tend to dominate supply. In light of this, special investment will be necessary if voluntary standards are to effectively operate as tools for poverty reduction among those most in need.
Sustainability standards are creating new opportunities for stakeholder participation in supply chain decision making: Whereas conventional commercial relationships rely principally on agreement between buyer and seller, sustainability standards have done a good job at integrating non-traditional perspectives into supply chain decision making by the standard-setting and implementation process, as represented by board member representation. Although developed country representation is still dominant across most boards, developing country representation is significant and remarkable.
Sustainability standards are strengthening the reliability of market claims through increasingly independent monitoring and enforcement processes: All of the initiatives surveyed applied some form of third-party conformity assessment procedure. A full three-quarters apply third-party certification—which adds to the independence of claims. Some of the newer initiatives have focused on using only verification for conformity assessment in order to cut costs and allow for more rapid growth.
8 | SSI Review 2014
Average criteria coverage of voluntary sustainability standards is declining as standards target mainstream markets: An analysis of voluntary sustainability standard criteria suggests that newer, mainstream-oriented standards apply criteria of reduced depth and breadth as a means for allowing for more rapid uptake. Across the initiatives surveyed, negative rights related to ILO core labour standards, as well as environmental practices with direct quality and yield outcomes, show the greatest degree of coverage. Most initiatives contain few criteria related to economic sustainability, reflecting a general belief that economic benefits should follow automatically upon reaching compliance.
Voluntary sustainability standards offer an important contribution to the green economy but cannot be assumed to deliver sustainable development outcomes: Voluntary standards have a close relationship with efforts to build a green economy. On the one hand, sustainability standards can help the market better achieve full-cost accounting in the pricing mechanism. On the other hand, voluntary sustainability standards can facilitate investment in sustainable technologies and practices. The ability of voluntary standards to do so, however, depends fundamentally on the credibility and objective accuracy of such initiatives in linking product sustainability claims to truly sustainable outcomes on the ground. The report highlights the many ways in which such accuracy and objectivity can be challenged by market forces, signalling the importance of public policy and related “non-market” frameworks for creating a level and transparent playing field in the standards sector.
Overall, the SSI Review concludes that the opportunities for voluntary standards to enable transformational change across major mainstream markets are now well established and continue to grow, but that taking full advantage of them will require a better understanding of field-level impacts, as well as a host of strategic policy measures to ensure that such standards effectively serve public sustainable development objectives.
SSI Review 2014 | 9
ReferencesConclusion
Markets
Criteria Development
Standards ContextThe Green Econom
y
Contents
Foreword 4Acknowledgements 6Data Sources and Disclaimer 6Acronyms 7Units and Measures 7Executive Summary 8Contents 10List of Figures 12List of Tables 151 Voluntary Sustainability Standards and the Green Economy 19
1.1 References 262 The Standards Context 27
2.1 The Initiatives Covered in This Report 272.2 Historical Trends 322.3 Setting the Context 342.4 References 46
3 Criteria Development, Implementation and Conformity Assessment 473.1 Voluntary Standards and Local Interests: The Principle of Subsidiarity 483.2 Smallholders 493.3 Conformity Assessment 513.4 Governance Systems 593.5 SSI Content and Criteria Coverage 663.6 SSI Indices Analysis 713.7 Single-Sector Versus Multisector Initiative Analysis 793.8 Indicator Analysis 843.9 References 87
4 Global Market Overview 894.1 Market Data Presentation Reader Roadmap 954.2 References 96
5 Banana Market 975.1 Market Review 1015.2 Market Development 1035.3 Market Performance 1055.4 Supply 1115.5 Pricing and Premiums 1145.6 Challenges and Opportunities 1165.7 References 117
6 Biofuels Market 1196.1 Market Review 1216.2 Market Development 1216.3 Market Performance 1236.4 Pricing and Premiums 1286.5 Challenges and Opportunities 1286.6 References 129
7 Cocoa Market 1317.1 Market Review 1357.2 Market Development 1377.3 Market Performance 1397.4 Supply 1487.5 Pricing and Premiums 1517.6 Challenges and Opportunities 1537.7 References 154
10 | SSI Review 2014
8 Coffee Market 1558.1 Market Review 1608.2 Market Development 1638.3 Market Performance 1678.4 Supply 1788.5 Pricing and Premiums 1818.6 Challenges and Opportunities 1838.7 References 184
9 Cotton Market 1879.1 Market Review 1919.2 Market Development 1939.3 Market Performance 1959.4 Supply 2029.5 Pricing and Premiums 2049.6 Challenges and Opportunities 2059.7 References 207
10 Forestry Market 20910.1 Market Review 21410.2 Market Development 21510.3 Market Performance 22010.4 Supply 22510.5 Pricing and Premiums 23110.6 Challenges and Opportunities 23110.7 References 233
11 Palm Oil Market 23511.1 Market Review 23911.2 Market Development 24011.3 Market Performance 24211.4 Supply 24511.5 Pricing and Premiums 24811.6 Challenges and Opportunities 24811.7 References 251
12 Soybean Market 25312.1 Market Review 25812.2 Market Development 26012.3 Market Performance 26312.4 Supply 26912.5 Pricing and Premiums 27212.6 Challenges and Opportunities 27312.7 References 274
13 Sugar Market 27513.1 Market Review 28013.2 Market Development 28213.3 Market Performance 28413.4 Supply 28913.5 Pricing and Premiums 29313.6 Challenges and Opportunities 29413.7 References 295
14 Tea Market 29714.1 Market Review 30114.2 Market Development 30314.3 Market Performance 30614.4 Supply 31414.5 Pricing and Premiums 31814.6 Challenges and Opportunities 31914.7 References 321
SSI Review 2014 | 11
ReferencesConclusion
Markets
Criteria Development
Standards ContextThe Green Econom
y

List of Figures
Figure 1.1 Voluntary sustainability standards and the pricing mechanism. 22Figure 2.1 The start dates of each of the 16 standards in relation to the Rio Earth Summit. 32Figure 2.2 Industry coverage across voluntary sustainability standards reviewed. 34Figure 2.3 Main activities of voluntary sustainability initiatives. 36Figure 2.4 Current geographic scope of verified or certified operations (services or production). 39Figure 2.5 Total standard-compliant hectares in each continent across all commodities, aggregated by initiative, 2011/2012. 40Figure 2.6 Single-sector initiatives lead in production volume. 42Figure 2.7 Potential impacts of different business models on the operational sustainability of initiatives. 43Figure 2.8 Revenue sources, by initiative. 44Figure 2.9 Annual budgets: Single sector versus multisector, by initiative. 45Figure 3.1 Degree of independence of conformity assessment processes (from most to least dependent). 51Figure 3.2 Conformity assessment procedures and frequency. 55Figure 3.3 Board representation by stakeholder role in supply chain. 60Figure 3.4 Board representation by geographical location (developing/developed countries). 61Figure 3.5 Degree of coverage methodology. 67Figure 3.6 SSI social indices and indicators. 69Figure 3.7 SSI environmental indices and indicators. 70Figure 3.8 SSI economic indices and indicators. 70Figure 3.9 Average coverage of SSI social indices among all 16 voluntary sustainability initiatives. 71Figure 3.10 Average coverage of SSI environmental indices among all 16 voluntary sustainability initiatives. 73Figure 3.11 Average environmental index coverage by year compared with total number of hectares certified over time. 74Figure 3.12 Average coverage of SSI economic indices among all 16 voluntary sustainability standards. 76Figure 3.13 Average coverage of SSI social indices across single-sector and multisector initiatives. 79Figure 3.14 Average coverage of SSI environmental indices across single-sector and multisector initiatives. 81Figure 3.15 Average coverage of economic indices across single-sector and multisector initiatives. 82Figure 4.1 Growth of standard-compliant production (2008–2012, hectares compliant) 90Figure 4.2 Sustainable markets: Compliant production as a percentage of global production for 2008 and 2012 90Figure 4.3 Sustainable markets: Standard-compliant production versus standard-compliant sales for 2012 91Figure 4.4 Global versus sustainable distribution of supply (select commodities, hectares and metric tons, 2011/2012) 93Figure 5.1 Conventional versus standard-compliant banana production, 2011/2012. 98Figure 5.2 Leading producers of standard-compliant bananas by initiative, 2011/2012. 100Figure 5.3 Growth in standard-compliant banana production and sales, 2009–2012. 101Figure 5.4 Fairtrade, Rainforest Alliance and Organic banana production, 2008–2012. 102Figure 5.5 Fairtrade, Rainforest Alliance and Organic banana sales, time series, 2008–2012. 102Figure 5.6 Fairtrade banana sales by country, 2011. 105Figure 5.7 Fairtrade banana production and sales growth, 2008–2012. 106Figure 5.8 Rainforest Alliance banana production by country, 2012. 107Figure 5.9 Rainforest Alliance banana production (and sales) growth, 2010–2012. 107Figure 5.10 Organic banana production by country, 2011. 109
15 Conclusion 32316 References 32717 Appendices 342
Appendix I | SSI Content Criteria Indices and Indicators 342Appendix II | The SSI Indicators and Definitions 345Appendix III | VSS Labelling Policies 352Appendix IV | Voting Member Constitution of VSSs 357Appendix V | Social Criteria Coverage of Voluntary Sustainability Standards by Commodity 359Appendix VI | Environmental Criteria Coverage of VSSs by Commodity 360Appendix VII | Economic Criteria Coverage of VSSs by Commodity 361Appendix VIII | Description of Data Sources and Representations by Commodity Section 362
12 | SSI Review 2014

Figure 5.11 Organic banana production and sales growth, 2008–2011. 109Figure 5.12 Total (standard-compliant and conventional) banana production breakdown by country, 2011. 111Figure 5.13 Total (standard-compliant and conventional) banana export breakdown by country, 2011. 111Figure 5.14 Standard-compliant banana production by country, 2011/2012. 112Figure 5.15 Fifteen largest producers of standard-compliant bananas, 2011/2012. 112Figure 5.16 Standard-compliant banana production by continent, 2011/2012. 113Figure 5.17 Average monthly wholesale prices for Organic and conventional bananas (New York market, 2007–2010 [US$/box]). 115Figure 6.1 EU biodiesel and bioethanol consumption by feedstock, 2010. 123Figure 6.2 RSPO, Certified Sustainable Palm Oil and Certified Sustainable Palm Kernel production, 2008–2012. 126Figure 6.3 RTRS soybean production (total and under EU-RED scope) and sales, 2011–2012. 126Figure 6.4 Bonsucro sugar cane production, area and volume, 2011–2012. 127Figure 7.1 Conventional versus standard-compliant cocoa production, 2011/2012. 132Figure 7.2 Leading producers of standard-compliant cocoa by initiative, 2011/2012. 134Figure 7.3 Growth in standard-compliant cocoa production and sales, 2008–2012 135Figure 7.4 Fairtrade, Organic, Rainforest Alliance and UTZ Certified cocoa production, 2008–2012. 136Figure 7.5 Fairtrade, Organic, Rainforest Alliance and UTZ Certified cocoa sales, 2008–2012. 136Figure 7.6 Top global confectionery companies that manufacture some form of chocolate, by net confectionery sales value, 2012. 139Figure 7.7 Fairtrade cocoa production by country, 2011. 140Figure 7.8 Fairtrade cocoa production and sales, 2008–2011. 140Figure 7.9 Organic cocoa production by country, 2011. 142Figure 7.10 Organic cocoa production and sales, 2008–2011. 142Figure 7.11 Rainforest Alliance cocoa by country, 2012. 144Figure 7.12 Rainforest Alliance cocoa production and sales, 2008–2012. 144Figure 7.13 UTZ Certified cocoa production by country, 2012. 146Figure 7.14 UTZ Certified cocoa production and sales, 2009–2012. 146Figure 7.15 Global cocoa production by country, 2012. 149Figure 7.16 Standard-compliant cocoa production by country, 2011 (Fairtrade, Organic), 2012 (Rainforest Alliance, UTZ Certified). 149Figure 7.17 Top producing countries of standard-compliant cocoa by voluntary sustainability standard, 2011/2012. 149Figure 7.18 Top producing continents of standard-compliant cocoa by voluntary sustainability standard, 2011/2012. 150Figure 8.1 Conventional versus standard-compliant coffee production, 2011/2012. 156Figure 8.2 Leading producers of standard-compliant coffee by initiative, 2011/2012. 158Figure 8.3 Growth in standard-compliant coffee production and sales, 2008–2012. 161Figure 8.4 Standard-compliant coffee produced under AAA, 4C Association, C.A.F.E. Practices, Fairtrade, Organic,… 162Figure 8.5 Standard-compliant coffee sold under 4C Association, C.A.F.E. Practices, Fairtrade, Organic, Rainforest Alliance… 162Figure 8.6 4C coffee production volume by country, 2012. 168Figure 8.7 4C coffee production and sales, 2008–2012. 168Figure 8.8 Fairtrade coffee production volume by country, 2010–2011. 170Figure 8.9 Fairtrade coffee production and sales, 2008–2012. 170Figure 8.10 Organic coffee production volume by country, 2011. 172Figure 8.11 Organic coffee production and sales, 2008–2011. 172Figure 8.12 Rainforest Alliance coffee production volumes by country, 2012. 174Figure 8.13 Rainforest Alliance production and sales, 2008–2012. 174Figure 8.14 UTZ Certified coffee production volume by country, 2012. 176Figure 8.15 UTZ Certified coffee production and sales, 2008–2012. 176Figure 8.16 Global coffee production breakdown by country (includes conventional and standard-compliant), 2012. 178Figure 8.17 Standard-compliant coffee production by country, 2012. 178Figure 8.18 Standard-compliant coffee production by country, 2011/2012. 180Figure 8.19 Standard-compliant coffee production by continent, 2011/2012. 180Figure 8.20 UTZ Certified coffee, weighted average premiums by country, 2012 (US$c/lb). 182Figure 9.1 Conventional versus standard-compliant cotton production, 2012. 188Figure 9.2 Leading producers of standard-compliant cotton by initiative, 2012. 190Figure 9.3 Growth in standard-compliant cotton production and sales, 2008–2012. 191Figure 9.4 Standard-compliant BCI, CmiA, Fairtrade and Organic cotton production, 2008–2012. 192Figure 9.5 Standard-compliant cotton sold under BCI, CmiA, Fairtrade and Organic, 2008–2012. 192
SSI Review 2014 | 13
ReferencesConclusion
Markets
Criteria Development
Standards ContextThe Green Econom
y

Figure 9.6 Better Cotton production by country, 2012. 196Figure 9.7 Better Cotton production and sales, 2010–2012. 196Figure 9.8 CmiA production by country, 2012. 197Figure 9.9 CmiA production and estimated sales, 2009–2012. 198Figure 9.10 Fairtrade cotton production and sales, 2008–2012. 199Figure 9.11 Organic cotton production by country, 2012. 201Figure 9.12 Organic cotton production, 2008–2012. 201Figure 9.13 Fifteen largest standard-compliant cotton producers, 2012. 202Figure 9.14 Global cotton production by country (includes conventional and sustainable), 2012. 203Figure 9.15 Standard-compliant cotton production by country, 2012. 203Figure 9.16 Standard-compliant cotton production by continent, 2012. 204Figure 10.1 Certified versus uncertified forest area, 2013. 210Figure 10.2 Leading countries with standard-compliant forest area, 2012. 212Figure 10.3 Growth in forest area under FSC and PEFC, 2004–2013. 214Figure 10.4 Presence of forest certification in 2013 compared with the net change in forested area from 1992 to 2011. 219Figure 10.5 FSC forested area by country, July 2013. 220Figure 10.6 FSC forested area by biome, July 2013. 221Figure 10.7 FSC forested area by forest type, July 2013. 221Figure 10.8 PEFC forested area by country, June 2013. 223Figure 10.9 FSC and PEFC forested area by country, 2013. 226Figure 10.10 Forested area globally, 2012. 227Figure 10.11 Negative change in global forested area, 2000–2011. 227Figure 10.12 Roundwood production by country, 2012. 228Figure 10.13 Pulp for paper production, 2012. 228Figure 10.14 Countries with the most certified forest, 2013. 230Figure 10.15 FSC and PEFC forested area by continent, 2013. 230Figure 11.1 Conventional versus standard-compliant palm oil production, 2011/2012. 236Figure 11.2 Leading producers of sustainable palm oil by standard, 2011/2012. 238Figure 11.3 Organic and RSPO palm oil production, 2008–2012. 238Figure 11.4 Growth in standard-compliant palm oil production and sales, 2008–2012. 239Figure 11.5 Production of CSPO and CSPK, 2008–2012. 242Figure 11.6 CSPO production by country, 2012. 243Figure 11.7 CSPK production by country, 2012. 243Figure 11.8 Organic palm oil production by country, 2011. 244Figure 11.9 Production and sales of Organic palm oil, 2008–2011. 244Figure 11.10 Total (standard-compliant and conventional) palm oil production by country, 2012. 246Figure 11.11 Standard-compliant palm oil production by country, 2011/2012. 246Figure 11.12 RSPO and Organic palm oil production by country, 2011/2012. 246Figure 11.13 RSPO and Organic palm oil production by continent, 2011/2012. 247Figure 11.14 Growth interpretation of companies sourcing CSPO. 250Figure 12.1 Conventional versus standard-compliant soybean production, 2012. 254Figure 12.2 Leading producers of standard-compliant soybeans by voluntary sustainability standard, 2012. 256Figure 12.3 Growth in standard-compliant soy production and sales, 2008–2012. 258Figure 12.4 Organic, ProTerra and RTRS soybean production, 2008–2012. 259Figure 12.5 Organic, ProTerra and RTRS soybean sales, 2008–2012. 259Figure 12.6 Organic soybean production by country, 2011. 264Figure 12.7 Organic soybean production and sales, 2008–2011. 264Figure 12.8 Production and estimated sales growth of ProTerra soybeans, 2008–2012. 266Figure 12.9 RTRS soybean production by country, 2012. 267Figure 12.10 RTRS soybean production and sales, 2011–2012. 267Figure 12.11 Largest standard-compliant soy producers by country, 2012. 269Figure 12.12 Standard-compliant soy production by continent, 2012 (2011 data for Organic). 270Figure 12.13 Total (standard-compliant and conventional) soybean production by country, 2012. 270Figure 12.14 Standard-compliant soybean production by country, 2012 (2011 data for Organic). 270
14 | SSI Review 2014
Figure 13.1 Conventional versus standard-compliant cane sugar production, 2011/2012. 276Figure 13.2 Leading producers of standard-compliant cane sugar by standard, 2011/2012. 279Figure 13.3 Growth in standard-compliant cane sugar production and sales, 2008–2012. 280Figure 13.4 Fairtrade, Organic, Bonsucro and Rainforest Alliance cane sugar production, 2008–2012. 281Figure 13.5 Fairtrade and Organic cane sugar sales, 2008-2012. 281Figure 13.6 Bonsucro certified mills, 2013. 284Figure 13.7 Fairtrade cane sugar sales by country, 2011. 286Figure 13.8 Fairtrade cane sugar production and sales, 2008–2012. 286Figure 13.9 Rainforest Alliance cane sugar production by country, 2012. 287Figure 13.10 Organic cane sugar sales by country, 2011. 287Figure 13.11 Organic cane sugar production and sales, 2008–2011. 288Figure 13.12 Production of cane sugar (standard compliant and conventional), breakdown by country, 2013. 289Figure 13.13 Export volumes of cane sugar, breakdown by country, 2012. 290Figure 13.14 Sales volumes of standard-compliant cane sugar by country (Fairtrade and Organic), 2011. 290Figure 13.15 Volumes of standard-compliant cane sugar by country, 2012. 290Figure 13.16 Production volumes of standard-compliant cane sugar by country. 291Figure 13.17 Production volumes of standard-compliant cane sugar by continent. 291Figure 14.1 Conventional versus standard-compliant tea production, 2011/2012. 298Figure 14.2 Leading producers of standard-compliant tea by voluntary sustainability standard, 2011/2012. 300Figure 14.3 Growth in standard-compliant tea production, 2009–2012. 301Figure 14.4 Standard-compliant Fairtrade, Rainforest Alliance, Organic and UTZ Certified tea production, 2008–2012. 302Figure 14.5 Fairtrade, Organic, Rainforest Alliance and UTZ Certified tea sales, 2008–2012. 302Figure 14.6 Fairtrade tea production by country, 2011. 307Figure 14.7 Fairtrade tea production and sales, 2008–2012. 307Figure 14.8 Organic tea production by country, 2011. 308Figure 14.9 Organic tea production and sales, 2008–2011. 308Figure 14.10 Rainforest Alliance tea production by country, 2012. 310Figure 14.11 Rainforest Alliance tea production, 2008–2012. 310Figure 14.12 UTZ Certified tea production breakdown by country, 2012. 312Figure 14.13 UTZ Certified tea production and sales, 2009–2012. 312Figure 14.14 Fifteen largest standard-compliant tea producers by country, 2011/2012. 315Figure 14.15 Largest standard-compliant tea producers by continent, 2011/2012. 315Figure 14.16 Total (standard-compliant and conventional) tea production by country, 2011. 316Figure 14.17 Standard-compliant tea production by country, 2011/2012. 316
List of Tables
Table 2.1 Founding stakeholders, by initiative 33Table 3.1 Implementing the principle of subsidiarity: key indicators. 48Table 3.2 Requirements for smallholder producers. 50Table 3.3 Conformity assessment indicators. 52Table 3.4 Chain of Custody indicators. 57Table 3.5 External participation in rule-making processes for voluntary standards. 62Table 3.6 Dispute settlement index for voluntary sustainability standards reviewed in this report. 63Table 3.7 Availability of documents and decisions online. 65Table 3.8 Average coverage of SSI social indices for each voluntary sustainability initiative. 71Table 3.9 Average coverage of SSI environmental indices for each voluntary sustainability initiative. 73Table 3.10 Average coverage of SSI economic indices for each voluntary sustainability standard. 76Table 3.11 Average coverage of SSI social indices by single-sector and multisector initiatives. 79Table 3.12 Average coverage of SSI environmental indices by single-sector and multisector initiatives. 81Table 3.13 Average coverage of SSI economic indices by single-sector and multisector initiatives. 82Table 3.14 SSI social indicators, from highest to lowest coverage across 16 voluntary sustainability standards reviewed. 84Table 3.15 SSI environmental indicators, from highest to lowest coverage across 16 voluntary sustainability standards reviewed. 85
SSI Review 2014 | 15
ReferencesConclusion
Markets
Criteria Development
Standards ContextThe Green Econom
y
Table 3.16 SSI economic indicators, from highest to lowest coverage across 16 voluntary sustainability standards reviewed. 86Table 4.1 Indicators used for the market data collection and consistently collected across all voluntary sustainability standards. 95Table 5.1 Standard-compliant and conventional key statistics for banana production and trade. 100Table 5.2 Importance of voluntary sustainability standard (VSS) banana production and sales relative to the global market. 105Table 5.3 Fairtrade banana sales and area harvested, 2011. 106Table 5.4 Fairtrade banana sales and production, 2008–2012. 106Table 5.5 Rainforest Alliance banana production and area harvested by country, 2012. 108Table 5.6 Rainforest Alliance banana production and area harvested, 2008–2012. 108Table 5.7 Organic banana production, sales and area harvested by country, 2011. 110Table 5.8 Organic banana production, sales and area harvested, 2008–2012. 110Table 5.9 Standard-compliant production as a percentage of total national production for 20 largest banana producers, 2011/2012. 113Table 5.10 Estimated price distribution along value chain to New York market. 115Table 6.1 Standard-compliant and conventional key statistics for biofuel production and trade, 2010–2012. 120Table 6.2 EU biodiesel consumption differentiated by feedstock and main feedstock regions, 2009–2010. 124Table 6.3 EU bioethanol consumption differentiated by feedstock and main feedstock regions, 2009–2010. 125Table 6.4 RSB certificates, 2012. 125Table 7.1 Standard-compliant and conventional key statistics for cocoa production and trade. 134Table 7.2 Importance of voluntary sustainability standard (VSS) cocoa production and sales relative to the global market. 139Table 7.3 Fairtrade cocoa production and sales by country, 2011. 141Table 7.4 Fairtrade cocoa area harvested, production and sales, 2008–2012. 141Table 7.5 Organic cocoa area harvested, production and sales by country, 2011. 143Table 7.6 Organic cocoa area harvested, production and sales, 2008–2011. 143Table 7.7 Area harvested and production of Rainforest Alliance cocoa by country, 2012. 145Table 7.8 Area harvested, production and sales of Rainforest Alliance cocoa, 2009–2012. 145Table 7.9 Area harvested, production and sales of UTZ Certified cocoa by country, 2012. 147Table 7.10 Area harvested, production and sales of UTZ Certified cocoa, 2009–2012. 147Table 7.11 Standard-compliant production as a percentage of total national production for 20 largest cocoa producers, 2011/2012. 150Table 7.12 Reported premiums for standard-compliant cocoa, Ghana and Côte d’Ivoire. 151Table 8.1 Standard-compliant and conventional key statistics for coffee production and trade. 159Table 8.2 Importance of voluntary sustainability standard (VSS) coffee production and sales relative to the global market. 167Table 8.3 4C-compliant coffee area harvested, production and sales, by country, 2012. 169Table 8.4 4C coffee area harvested, production and sales, 2008–2012. 169Table 8.5 Fairtrade coffee production by country, 2011. 171Table 8.6 Fairtrade coffee area harvested, production and sales, 2008–2012. 171Table 8.7 Organic coffee area harvested, production and sales by country, 2011. 173Table 8.8 Organic coffee area harvested, production and sales, 2008–2012. 173Table 8.9 Rainforest Alliance coffee area harvested and production, by country, 2012. 175Table 8.10 Rainforest Alliance area harvested, production and sales, 2008–2012. 175Table 8.11 UTZ Certified coffee area harvested, production and sales, by country, 2012. 177Table 8.12 UTZ Certified coffee area harvested, production and sales, 2008–2012. 177Table 8.13 Standard-compliant production as a percentage of total national production for 20 largest coffee producers, 2012. 179Table 9.1 Standard-compliant and conventional key statistics for cotton production and trade. 190Table 9.2 Importance of voluntary sustainability standard (VSS) cotton production and sales relative to the global market. 195Table 9.3 Better Cotton area harvested and production by country, 2012. 196Table 9.4 Better Cotton area harvested, production and sales, 2010–2012. 197Table 9.5 CmiA area harvested and production by country, 2012. 197Table 9.6 CmiA area harvested and production, 2009–2012. 198Table 9.7 Fairtrade cotton area harvested, production and sales, 2008–2012. 199Table 9.8 Organic cotton production by country, 2012. 200Table 9.9 Organic cotton area harvested and production, 2008–2012. 201Table 9.10 Standard-compliant production as a percentage of total national production for 20 largest cotton producers, 2012. 203Table 9.11 Prices paid for CmiA, 2010–2012. 205Table 10.1 Standard-compliant and conventional key statistics for forestry production and trade. 213Table 10.2 Importance of certified area and roundwood production, relative to global figures. 220Table 10.3 FSC forested area and CoC certificates by country, 2013. 222
16 | SSI Review 2014
Table 10.4 FSC forested area, 2004–2013. 222Table 10.5 PEFC forested area and CoC certificates by country, 2013. 224Table 10.6 PEFC forested area and CoC certificates, 2004–2013. 224Table 10.7 Standard-compliant forested area 229Table 11.1 Standard-compliant and conventional key statistics for palm oil production and trade. 238Table 11.2 Importance of voluntary sustainability standard (VSS) palm oil production and sales relative to the global market. 243Table 11.3 RSPO production volumes and land area, 2012. 243Table 11.4 RSPO CSPO and CSPK production volumes and area harvested, 2008–2012. 245Table 11.5 Organic palm oil area harvested, sales and production volumes by country, 2011. 245Table 11.6 Organic palm oil production, sales and area harvested, 2008–2011. 245Table 11.7 Sustainability intensity of top 15 palm oil producing countries, 2012. 247Table 12.1 Standard-compliant and conventional key statistics for soybean production and trade. 257Table 12.2 Importance of voluntary sustainability standard (VSS) soy bean production and sales relative to the global market. 263Table 12.3 Organic soybean production, sales and area harvested, by country, 2011. 265Table 12.4 Organic soybean area harvested, production and sales, 2008–2011. 265Table 12.5 Volumes of ProTerra soybeans in Brazil, 2005–2011. 267Table 12.6 Production, area harvested and sales of RTRS soybeans, by country, 2012. 268Table 12.7 Volumes, area harvested and sales of RTRS soybeans, 2011–2012. 268Table 12.8 Largest producers of standard-compliant soy production as a percentage of total national production. 271Table 13.1 Standard-compliant and conventional key statistics for cane sugar production and trade. 278Table 13.2 Importance of voluntary sustainability standard (VSS) cane sugar production and sales relative to the global market. 284Table 13.3 Fairtrade cane sugar sales by country, 2011. 286Table 13.4 Fairtrade cane sugar area harvested, production and sales, 2008–2012. 286Table 13.5 Organic cane sugar sales by country, 2011. 288Table 13.6 Organic cane sugar area harvested and sales, 2008-2011. 288Table 13.7 Standard-compliant production as a percentage of total national production for 20 largest cane sugar producers, 2012. 292Table 14.1 Standard-compliant and conventional key statistics for tea production and trade. 300Table 14.2 Importance of voluntary sustainability standard (VSS) tea production and sales relative to the global market. 306Table 14.3 Fairtrade tea production and sales by country, 2011. 307Table 14.4 Fairtrade tea production, sales and area harvested, 2008–2012. 307Table 14.5 Organic tea production, sales and area harvested, 2011. 309Table 14.6 Organic tea production, sales and area harvested, 2008–2011. 309Table 14.7 Rainforest Alliance tea production and area harvested, 2012. 311Table 14.8 Rainforest Alliance tea production and area harvested, 2008–2012. 311Table 14.9 UTZ Certified tea production, area harvested and sales, by country, 2012. 313Table 14.10 UTZ Certified tea production and sales, 2009–2012. 313Table 14.11 Standard-compliant production as a percentage of total national production for 20 largest tea producers, 2012. 317
SSI Review 2014 | 17
ReferencesConclusion
Markets
Criteria Development
Standards ContextThe Green Econom
y
18 | SSI Review 2014
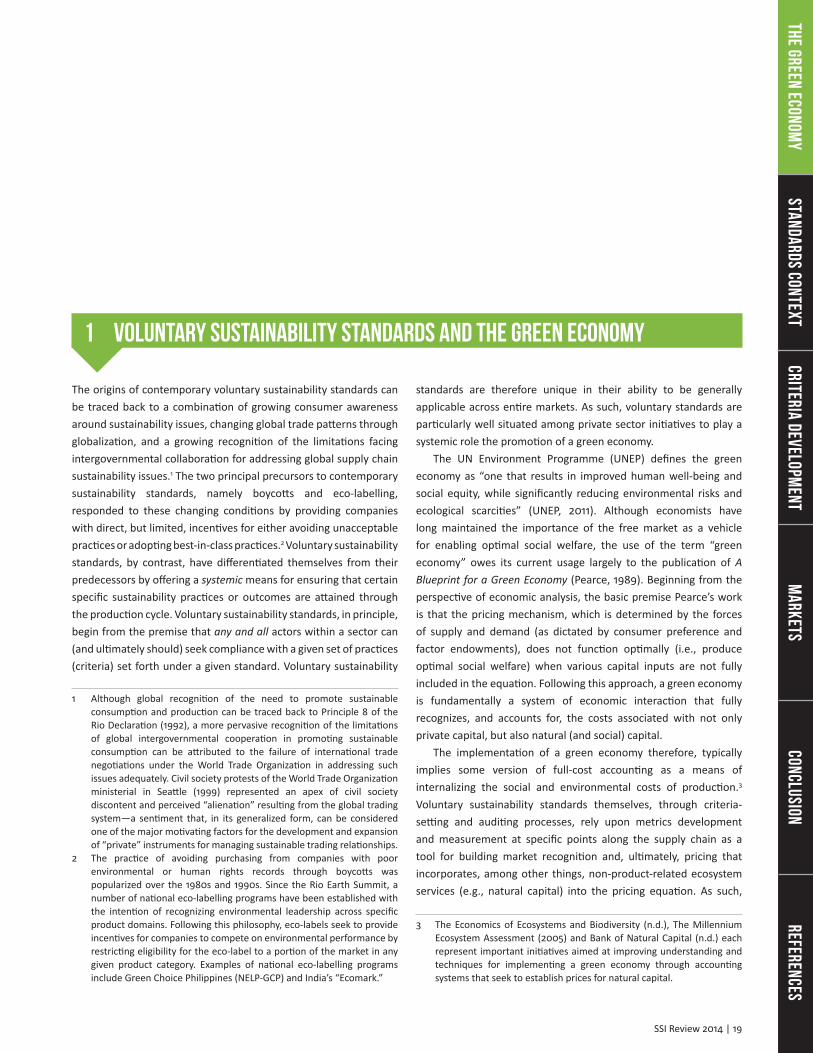
1 Voluntary Sustainability Standards and the Green Economy
The origins of contemporary voluntary sustainability standards can be traced back to a combination of growing consumer awareness around sustainability issues, changing global trade patterns through globalization, and a growing recognition of the limitations facing intergovernmental collaboration for addressing global supply chain sustainability issues.1 The two principal precursors to contemporary sustainability standards, namely boycotts and eco-labelling, responded to these changing conditions by providing companies with direct, but limited, incentives for either avoiding unacceptable practices or adopting best-in-class practices.2 Voluntary sustainability standards, by contrast, have differentiated themselves from their predecessors by offering a systemic means for ensuring that certain specific sustainability practices or outcomes are attained through the production cycle. Voluntary sustainability standards, in principle, begin from the premise that any and all actors within a sector can (and ultimately should) seek compliance with a given set of practices (criteria) set forth under a given standard. Voluntary sustainability
1 Although global recognition of the need to promote sustainable consumption and production can be traced back to Principle 8 of the Rio Declaration (1992), a more pervasive recognition of the limitations of global intergovernmental cooperation in promoting sustainable consumption can be attributed to the failure of international trade negotiations under the World Trade Organization in addressing such issues adequately. Civil society protests of the World Trade Organization ministerial in Seattle (1999) represented an apex of civil society discontent and perceived “alienation” resulting from the global trading system—a sentiment that, in its generalized form, can be considered one of the major motivating factors for the development and expansion of “private” instruments for managing sustainable trading relationships.
2 The practice of avoiding purchasing from companies with poor environmental or human rights records through boycotts was popularized over the 1980s and 1990s. Since the Rio Earth Summit, a number of national eco-labelling programs have been established with the intention of recognizing environmental leadership across specific product domains. Following this philosophy, eco-labels seek to provide incentives for companies to compete on environmental performance by restricting eligibility for the eco-label to a portion of the market in any given product category. Examples of national eco-labelling programs include Green Choice Philippines (NELP-GCP) and India’s “Ecomark.”
standards are therefore unique in their ability to be generally applicable across entire markets. As such, voluntary standards are particularly well situated among private sector initiatives to play a systemic role the promotion of a green economy.
The UN Environment Programme (UNEP) defines the green economy as “one that results in improved human well-being and social equity, while significantly reducing environmental risks and ecological scarcities” (UNEP, 2011). Although economists have long maintained the importance of the free market as a vehicle for enabling optimal social welfare, the use of the term “green economy” owes its current usage largely to the publication of A Blueprint for a Green Economy (Pearce, 1989). Beginning from the perspective of economic analysis, the basic premise Pearce’s work is that the pricing mechanism, which is determined by the forces of supply and demand (as dictated by consumer preference and factor endowments), does not function optimally (i.e., produce optimal social welfare) when various capital inputs are not fully included in the equation. Following this approach, a green economy is fundamentally a system of economic interaction that fully recognizes, and accounts for, the costs associated with not only private capital, but also natural (and social) capital.
The implementation of a green economy therefore, typically implies some version of full-cost accounting as a means of internalizing the social and environmental costs of production.3 Voluntary sustainability standards themselves, through criteria-setting and auditing processes, rely upon metrics development and measurement at specific points along the supply chain as a tool for building market recognition and, ultimately, pricing that incorporates, among other things, non-product-related ecosystem services (e.g., natural capital) into the pricing equation. As such,
3 The Economics of Ecosystems and Biodiversity (n.d.), The Millennium Ecosystem Assessment (2005) and Bank of Natural Capital (n.d.) each represent important initiatives aimed at improving understanding and techniques for implementing a green economy through accounting systems that seek to establish prices for natural capital.
SSI Review 2014 | 19
ReferencesConclusion
Markets
Criteria Development
Standards ContextThe Green Econom
y
Image: CIFOR / CC BY-NC
20 | SSI Review 2014
they potentially have an important, if not critical, role to play in the implementation of a green economy.
More recently, the concept of the green economy, largely inspired by the economic crisis of 2008, has emphasized the role of public and private investment in driving more sustainable production practices rather than implementing full-cost accounting per se. Under this rubric, green economy policy discussions have largely revolved around the creation of appropriate incentives to stimulate investment that promotes sustainable production and consumption. Following this line of thought, policy-makers have referred to the notion of “green stimulus” as the focal point for discussions on the green economy (see UNEP, 2009).
Voluntary sustainability standards also have a specific role to play in promoting investment in sustainable practices. By providing a basis for making (credible) market claims related to sustainable practice, voluntary standards can be regarded as tools for both brand development and risk management, thereby providing a basis for targeted investment into green supply chains. The potential of voluntary standards to operate as a stimulus to investment in green production systems is perhaps nowhere better evidenced than through the multitude of mainstream corporate commitments to adopt standard-compliant supply within the coming decade.4 Achieving such rapid and widespread adoption of compliant practices across many markets almost necessarily implies concordant investments at the level of production.5
Whether one considers a green economy in terms of corrections to the pricing mechanism or in terms of targeted investments for sustainable production and infrastructure, there can be little question that voluntary sustainability standards have the potential to offer a positive contribution. What remains less certain, however, is precisely what the boundaries of that contribution might be.
Notwithstanding the promise of sustainability standards through their applicability to entire markets, the relationship of such standards to the market more generally has, at best, been relatively opaque. At the most basic level, voluntary standards have, historically, focused on building their markets rather than measuring them. As a result, there has been, and continues to be, a rather startling absence of consistently reported information related to
4 Many leading retailers and product manufacturers have made public commitments to source 100 per cent of their supply from sustainable sources by 2020. Enabling such a widespread transition, particularly among developing country supply, may imply significant investments upstream in the supply chain. See Market Development sections of individual commodity market chapters.
5 Some voluntary sustainability standards, such as Fairtrade (through its Producer Support Network) and UTZ Certified (through its relationship with Solidaridad), have also played significant roles in raising affiliated investment in technical assistance to facilitate a transition to compliance. Increasingly, there is a trend to use certification as a component in broader sustainable supply chain investment strategies. Two important programs with an explicit mandate of facilitating investment in certified supply chains include the Sustainable Trade Initiative/Initiatief Duurzame Handel (IDH) and the Sustainable Commodity Assistance Network (SCAN). In 2012 the annual budget of IDH was €32.5 million (IDH, 2012).
the market performance of such initiatives. Similarly, there is little explicit recognition or research on the potential effects of voluntary sustainability standard systems on the pricing mechanism, despite the fact that, from an economic perspective, this represents one of the main pathways through which such systems operate.
At the same time, and equally importantly, voluntary sustainability standards offer a number of “non-market” pathways for promoting sustainability across global supply chains, through the provision of institutions for participatory governance, criteria development, education, technical assistance and so on. However, as market-based instruments, even these non-market pathways remain subject to market forces, raising the question of how, and to what degree, such pathways can be considered extensions of the market itself (see Box 1.1, Voluntary standards and the green economy: Potential contributions and constraints).
As market-based instruments, voluntary sustainability standards may be able to provide efficiency gains over more traditional command-and-control mechanisms for correcting for market failure. However, as instruments of the market, voluntary standards remain inherently challenged in their ability to fully “correct” for market imperfections (see Figure 1.1, Voluntary sustainability standards and the pricing mechanism.). This context provides the backdrop for supply chain decision-makers seeking to play a proactive role in the green economy and/or to understand the potential role of sustainability standards within a context of policy measures for promoting a green economy. It also provides context for understanding the role different implementation and content systems may have in contributing to the broader goal of building a greener economy.
Although the current review cannot hope to determine whether or when sustainability standards are effective at promoting a green economy, it does hope to provide a window into understanding the current state of play and issues related to the implementation of a green economy among 16 leading sustainability standards in the agriculture and forestry sectors. And if we are not able to find the perfect path to a green economy through our analysis, perhaps we can be contented by a greater awareness of the boundaries of that path.
SSI Review 2014 | 21
ReferencesConclusion
Markets
Criteria Development
Standards ContextThe Green Econom
y

Voluntary sustainability standards have the potential to contribute to a green economy in a variety of ways. Below we consider some of the main market and non-market means by which voluntary sustainability standards can contribute to the implementation of a green economy, as well as key constraints facing each pathway.
1 Perfecting the pricing mechanism In theory, the “perfect market” provides optimal social welfare based on given factor endowments and, as such, represents a pillar of sustainable development. Indeed, it is widely recognized that many, if not most, of the sustainability challenges facing the planet today are the result of market imperfections. Accordingly, a logical starting point for promoting sustainable development rests with “perfecting” the market.
One of the four conditions of the perfect market is “perfect information,” which refers to the ability of buyers and sellers to know everything and anything about the relevant economic inputs to a given transaction.6 Historically, one of the reasons that sustainable practice has not formed an integral part of economic transactions is simply because no credible, recognized means for understanding or identifying such practice within the market has previously existed with any consistency. Voluntary sustainability standards, by both identifying sustainable practice (through criteria development) and credibly linking such practice to physical products (through conformity assessment systems), directly enable the market in communicating “non-product-related” production practices across the marketplace.7
As such, voluntary sustainability standards systems provide a means for integrating sustainable practice within the pricing mechanism in a way that conventional markets, in their absence, may not. This arguably represents one of the most direct and systemic manners in which voluntary standards may contribute to a green economy.8
6 Imperfect information represents one of the sources of “market externalities” that leads to sub-optimal welfare outcomes through market interaction alone.
7 Non-product-related production and processing methods (PPMs) have earned considerable attention within the context of international trade negotiations. Because protectionism itself is one form of non-product-related PPM (i.e., a product’s place of production can be considered a part of the method of production), governments have been cautious to accept differential treatment based on non-product-related PPMs alone. To the extent that governments may have legitimate social or environmental reasons for selecting products based on specific PPMs, the ability to credibly link PPMs to specific products has potentially important repercussions for international trade policy as well (see Potts, 2008).
8 Although one of the most important practical accomplishments of voluntary standards has been their ability to credibly link sustainable practices to physical products, thereby allowing markets to more efficiently include such characteristics within the pricing mechanism, few voluntary standards initiatives advertise this achievement explicitly.
The degree to which voluntary standards are able to actually provide a “perfect” adjustment to conventional market conditions is constrained by a number of factors including, but not limited to, diversity of conditions for sustainable production across different producing regions and systems that decrease the appropriateness of global criteria for local conditions, the need to design rules capable of securing voluntary market acceptance, and imperfections in conformity assessment processes allowing for non-compliant practices to be communicated as “compliant” in the marketplace.
Box 1.1 VoluNtarY staNdards aNd the greeN eCoNomY: PoteNtial CoNtriButioNs aNd CoNstraiNts
Figure 1.1 VoluNtarY sustaiNaBilitY staNdards aNd the PriCiNg meChaNism.
PVSS
QVSS
PS
VSS
C
PS
VSS
C
The light green line (VSS) in Figure 1.1 represents voluntary sustainability standard supply. The dark green line (PS) represents the perfectly sustainable supply curve. The black line (C) represents the conventional supply curve. The voluntary standard’s supply curve facilitates movement toward more sustainable equilibrium but faces barriers in achieving perfectly sustainable equilibrium due to system imperfections and/or political processes involved in establishing this curve. Because market acceptance is a major part of decision making, the standard may also face pressures to compromise in rule making, conformity assessment processes or other decisions that increase overall implementation costs. Voluntary standards may also have impacts on the supply curve, either by increasing efficiency of production (shift downward) or by increasing overall costs of production (shift upward). These effects are not represented in the diagram.
22 | SSI Review 2014
2 Promoting efficiency through the allocation of sustainable production
A common strategy for governments attempting to correct for market imperfections is to resort to the use of command-and-control mechanisms that require firms to comply with specified practices or performance outcomes.9 Command-and-control mechanisms are attractive because they allow policy-makers to achieve fixed performance outcomes. However, they may not do so in the most efficient manner possible, due to their requiring different market actors to attain equal levels of compliance.
Market-based instruments, including voluntary sustainability standards, have the advantage of allowing market actors to select their level of adoption of sustainable practices based on the relative costs (efficiencies) with which they are able to do so.10 Moreover, firms that can improve their efficiency in the adoption of sustainable practices (through the development of new technologies) have the potential of being rewarded by the market for doing so.11 As such, voluntary sustainability standards have the potential to promote more efficient allocation of sustainable practices across a diverse base of firms and regions.
The degree to which voluntary sustainability standards are able to promote the efficient allocation of sustainable development efforts, however, may be constrained by barriers to entry in international markets and correspondingly different levels of development among producing regions and firms, thereby preventing otherwise “efficient” firms from gaining access to sustainable markets.12
9 For example, in regulations establishing maximum pollution levels applicable to all firms within a given region.
10 By allowing the market to determine the allocation of adopting sustainable practices, lower cost adopters will bear a larger share of the market for compliant products. In doing so, it is said that market mechanisms promote static efficiency in promoting given sustainability practices.
11 By rewarding firms that can “transition” to sustainable practices most efficiency, market-based systems promote innovative or “dynamic” efficiency.
12 The most obvious example of this comes in the form of less developed countries and producing regions. In Section 4 we observe a general trend toward the concentration of standard-compliant supply in more developed countries. The trend toward seeking efficient supply needs to be balanced against the interest in ensuring that international markets provide benefits to those “most in need.”
3 Correcting for collective choice problemsOne of the most common sources of market failure is the inability of individual actors to know, or plan for, the actions of other economic actors in a manner that maximizes benefits for all. The “tragedy of the commons,” which results from individual, non-collaborative self-interest maximization, is a classic problem in sustainable development13 and provides the basic rationale for multi-party cooperation through international treaties, etc.14
Voluntary sustainability standards have the potential to offer a pre-competitive venue for the identification of common, collectively identified production rules for the entire supply chain, and in so doing can embody a soft form of collective action. To the extent that competitors agree upon basic practices, these practices may become integrated across entire markets, thereby being removed from the competitive equation altogether.15
The ability of voluntary sustainability standards to serve this function will be constrained by the degree to which standard systems represent “binding” commitments among competitors to comply with common rules (typically they do not include such commitments16) as well as by the degree to which all major competitors partake in the standards scheme. Initiatives with limited representation from market players in their governance process may be less likely to serve this particular function in the marketplace.
13 In the face of public goods where joint conservation of resources would result in improved overall welfare, individual self-interest-maximizing decision making results in the persistent overuse of the resource and correspondingly reduced total social welfare (see Hardin, 1968).
14 The solution to the “tragedy of the commons” is known as the “Nash equilibrium” and posits that each player’s optimal strategy is that which is subject to the constraint that other players’ strategies are also optimal. In tragedy-of-the-commons situations, some levels of individual constraints on the pursuit of self-interest produce outcomes that are better for all involved (Nash, 1950, 1951).
15 Note that to the extent that voluntary standards serve this function, they reduce the role of such practices as a basis for competition among actors. Even where common principles have been established, however, higher level standards may nevertheless be adopted as a means for improving competitiveness within the market.
16 Indeed, most national competition policies would prohibit such agreements among competitors due to the potential risks to the conditions of competition in the market (Potts, 2004).
Box 1.1 VoluNtarY staNdards aNd the greeN eCoNomY: PoteNtial CoNtriButioNs aNd CoNstraiNts Box 1.1 CoNtiNued
SSI Review 2014 | 23
ReferencesConclusion
Markets
Criteria Development
Standards ContextThe Green Econom
y
4 Stimulating investment in sustainable productionSustainability standards provide a framework for market recognition based on compliance with established criteria. As such, standards effectively have the potential of creating “new” markets. Recognizing this, firms can more safely invest in the adoption of sustainable practices within their product and brand development strategies.17 The more thoroughly and deeply companies build sustainable practices within their supply chains, the greater the potential gains offered by growing markets for sustainable products are likely to be. Following this logic, the infrastructure offered by voluntary sustainability standards provides a basis for increased investment in the adoption of sustainable practices through supply chains.
The degree to which voluntary sustainability standards are able to stimulate increased investment in sustainable practice is constrained by the market benefits available as a result of adopting sustainable practices. Persistent imperfections in the pricing mechanism therefore operate as constraints on the ability of voluntary sustainability standards to stimulate investment into sustainable practice. Even the mere absence of clear data or understanding of the market benefits of such investments can reduce the investment stimulus effect of standards.18
17 There are many rationales by which companies may choose to do so. One rationale is that given the link between social and environmental sustainability and actual physical outputs, firms may seek the adoption of sustainable practices as a means of managing physical risks. Firms may also adopt sustainable practices as part of a risk management strategy on the understanding that the failure to comply with publicly accepted norms may lead to reduced brand value. Finally, firms adopting sustainable practices may be able to secure market advantage by being first movers or otherwise contributing to brand development.
18 The Finance Alliance for Sustainable Trade (FAST) represents a group of leading social lenders seeking to create a better understanding of the impacts (and financial performance) of investing in agricultural small and medium enterprises. The general inability to collect such information through conventional sources or through individual data monitoring efforts provides the rationale for bringing such work together under a single dedicated umbrella organization (Larrea, Minteuan & Potts, 2013).
5 Promoting participatory governanceParticipatory governance plays a role in ensuring that the parameters of a green economy respond to the diverse social, economic and geographic conditions of production. One of the main rationales for the adoption of voluntary sustainability standards has been the corresponding failure of public institutions at ensuring desired sustainability outcomes. One of the appeals of voluntary sustainability standards is the immense flexibility they provide in establishing common rules for supply chain management.
While the range of governance regimes for voluntary standards is more or less infinite, the credibility of such systems is increasingly understood as a function of the inclusiveness of their governance processes (see, for example, the ISEAL standard-setting code [ISEAL, 2012b]). Importantly, sustainability standards have the potential to integrate stakeholders that might not otherwise have a significant voice within international supply chains and within the voluntary sustainability standard decision-making process. Voluntary standards can therefore promote a green economy by improving participatory governance within economic decision making.
The degree to which voluntary sustainability standards can realize this potential may be constrained by the resources available to voluntary standards systems in managing international governance systems, as well as by the potential need to secure market acceptance and therefore disproportionately accommodate larger market players in decision-making processes (see Figure 1.1, Voluntary sustainability standards and the pricing mechanism.).
Box 1.1 CoNtiNued
24 | SSI Review 2014
6 Changing consumer preferenceA green economy is one that is under a continuous process of renewal toward increased sustainability, drawing from and stimulating new knowledge and innovation. Through their rule- and criteria-setting functions, sustainability standards can play an important role in building knowledge on what constitutes sustainable production practices for a given region or sector, which may differ according to situation and context. By doing so, these standards have the ability to increase global understanding of the meaning of, and solutions to, sustainable development challenges at the local and global scale.
The rules that are identified by voluntary sustainability standard systems can serve not only as a vehicle for allowing consumers to act on existing preference (see Figure 1.1), but also as a vehicle for modifying existing consumer preference to select for more sustainable practices. In so doing, the voluntary sustainability standard systems have the effect of adjusting the consumption function toward more sustainable practices.
The degree to which voluntary standards are able to meet this objective may be constrained by the depth and accuracy of the knowledge developed through the standards process itself (including a standard’s ability to integrate continual improvement in its own knowledge and processes), as well as the resources available to invest in consumer education. Standards operating on business-to-business models may seek to exert influence on consumer preference through choice editing rather than direct education.
Box 1.1 CoNtiNued
SSI Review 2014 | 25
ReferencesConclusion
Markets
Criteria Development
Standards ContextThe Green Econom
y
1.1 References
Bank of Natural Capital. (n.d.). Welcome. Retrieved from http://bankofnaturalcapital.com/
The Economics of Ecosystems & Biodiversity. (n.d.). Home. Retrieved from http://www.teebweb.org
Hardin, G. (1968). The tragedy of the commons. Science, 162(3859), 1243-1248, doi: 10.1126/science.162.3859.1243.
Initiatief Duurzame Handel (IDH). (2012). Annual report 2012: Measuring impact and creating shared value. Sustainable Trade Initiative/Initiatief Duurzame Handel. Retrieved from http://www.idhsustainabletrade.com/idh-corporate-reports
International Social and Environmental Accreditation and Labelling Alliance (ISEAL). (2012b). Standard-setting code. Retrieved from http://www.isealalliance.org/our-work/defining-credibility/codes-of-good-practice/standard-setting-code
Larrea, C., Minteuan, S., & Potts, J. (2013). Investing for change: An analysis of the impacts of agricultural investments from select FAST social lenders. Retrieved from Finance Alliance for Sustainable Trade (FAST) website: https://www.fastinternational.org/files/FAST%202013%20Impact%20Report_0.pdf
Millennium Ecosystem Assessment. (2005). Guide to the Millennium Assessment Reports. Retrieved from http://www.maweb.org/en/index.aspx
Nash, John F. (1950). Equilibrium points in n-person games. Proceedings of the National Academy of Sciences of the United States of America 36(1), 48-49, doi: 10.2307/88031.
Nash, John F. (1951). Non-cooperative games. The Annals of Mathematics 54(2), 286-295.
Pearce, D. (1989). Blueprint for a green economy. London: Earthscan Publications.
Potts, J. (2004). Multi-stakeholder collaboration for a sustainable coffee sector: Meeting the challenge of US anti-trust law. Winnipeg: IISD.
Potts, J. (2008). The legality of PPMs under the GATT. Winnipeg: IISD.
Sustainable Trade Initiative (IDH). (2012). Annual report 2012: Measuring impact and creating shared value. Initiatief Duurzame Handel/Sustainable Trade Initiative. Retrieved from http://www.idhsustainabletrade.com/idh-corporate-reports
UN Environment Programme. (UNEP). (2009). Global green deal: An update for the G20 Pittsburgh Summit. Retrieved from www.unep.org/pdf/G20_policy_brief_Final.pdf
UN Environment Programme (UNEP). (2011). Towards a green economy: Pathways to sustainable development and poverty eradication. Retrieved from www.unep.org/greeneconomy
26 | SSI Review 2014