the solar resource - mit opencourseware · the solar resource lecture 2 – 9/13/2011 mit...
TRANSCRIPT

The Solar Resource Lecture 2 – 9/13/2011
MIT Fundamentals of Photovoltaics 2.626/2.627 – Fall 2011 Prof. Tonio Buonassisi

Buonassisi (MIT) 2011
2.626/2.627 Census 2011

Buonassisi (MIT) 2011
11
7 6
3 3 2 2 2 2
1
9
6 5
2 2 2 1 1 1 1 1 1
Department Affiliation
Self-Defined Expertise
10
20
2
Undergrad Grad ASP
Degree in Progress
14 PhD
6 SM

Buonassisi (MIT) 2011
29 27
29
Hands-on labs Field trips Guest lectures
Learning Methods Class Project Interest
25 24
6
Working closelywith PV
company
Preparing techprospectus onemerging PV
A self-designedproject

Buonassisi (MIT) 2011
Economy / Market (15)
Fundamentals (25)
Systems/Grid (5)
Natural Sciences Engineering Social Sciences
Emerging Technologies
(10)
Current Tech (6)
Manufacturing (3)
Mater-ials (2)
Characterization
(1)
Environmental Impact
(1)
Developing Countries
(4)
Policy (3)
History (2)
Social Impact
(2)
Jobs / Contacts
(3)
Design (1)
Learning Objectives

Buonassisi (MIT) 2011
The Solar Resource Lecture 2 – 9/13/2011
MIT Fundamentals of Photovoltaics 2.626/2.627 – Fall 2011 Prof. Tonio Buonassisi

Buonassisi (MIT) 2011
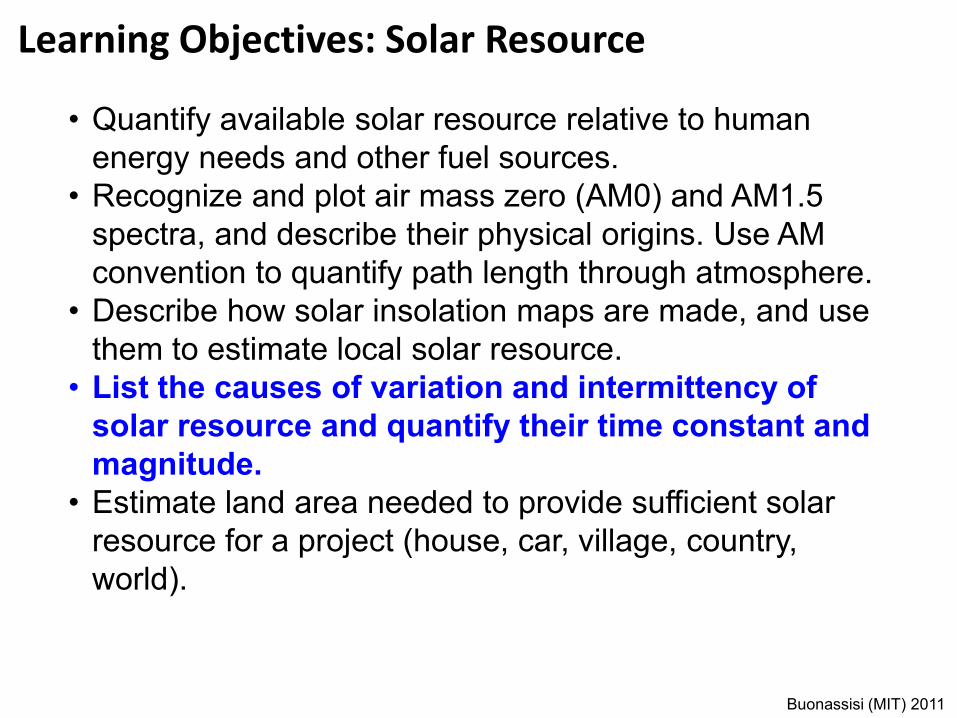
• Quantify available solar resource relative to human energy needs and other fuel sources.
• Recognize and plot air mass zero (AM0) and AM1.5 spectra, and describe their physical origins. Use AM convention to quantify path length through atmosphere.
• Describe how solar insolation maps are made, and use them to estimate local solar resource.
• List the causes of variation and intermittency of solar resource and quantify their time constant and magnitude.
• Estimate land area needed to provide sufficient solar resource for a project (house, car, village, country, world).
Learning Objectives: Solar Resource

Buonassisi (MIT) 2011
Before we begin… Review of Readings
http://pveducation.org/pvcdrom/properties-of-sunlight/declination-angle
Courtesy of PVCDROM. Used with permission.

Buonassisi (MIT) 2011
Before we begin… Review of Readings
http://pveducation.org/pvcdrom/properties-of-sunlight/solar-time
Courtesy of PVCDROM. Used with permission.
Buonassisi (MIT) 2011
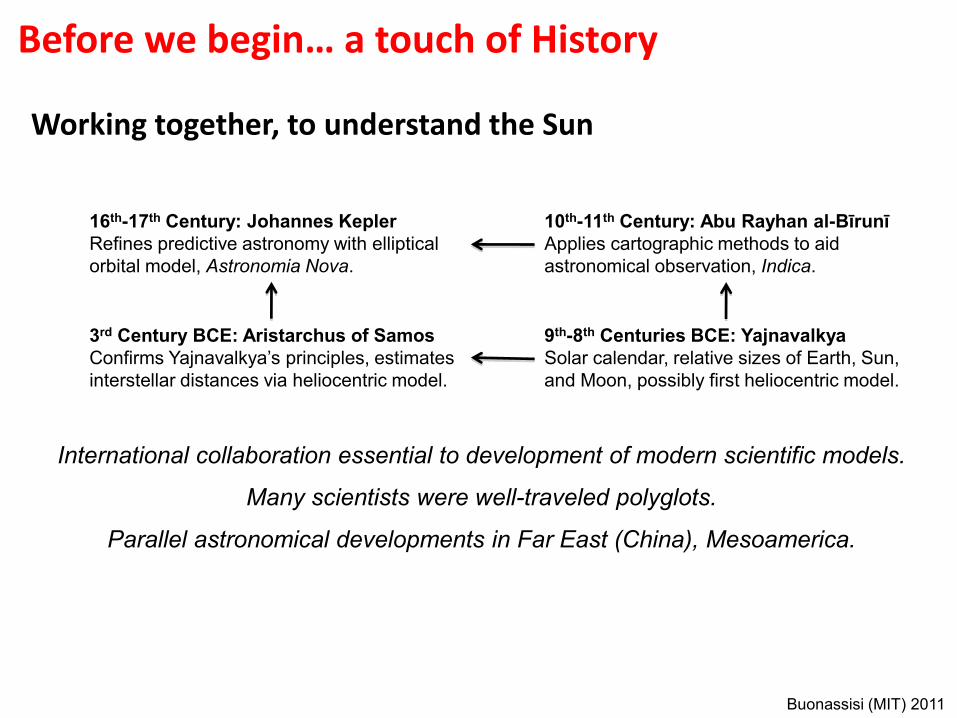
Working together, to understand the Sun
International collaboration essential to development of modern scientific models.
Many scientists were well-traveled polyglots.
Parallel astronomical developments in Far East (China), Mesoamerica.
9th-8th Centuries BCE: Yajnavalkya Solar calendar, relative sizes of Earth, Sun, and Moon, possibly first heliocentric model.
3rd Century BCE: Aristarchus of Samos Confirms Yajnavalkya’s principles, estimates interstellar distances via heliocentric model.
10th-11th Century: Abu Rayhan al-Bīrunī Applies cartographic methods to aid astronomical observation, Indica.
16th-17th Century: Johannes Kepler Refines predictive astronomy with elliptical orbital model, Astronomia Nova.
Before we begin… a touch of History

Buonassisi (MIT) 2011
• Quantify available solar resource relative to human energy needs and other fuel sources.
• Recognize and plot air mass zero (AM0) and AM1.5 spectra, and describe their physical origins. Use AM convention to quantify path length through atmosphere.
• Describe how solar insolation maps are made, and use them to estimate local solar resource.
• List the causes of variation and intermittency of solar resource and quantify their time constant and magnitude.
• Estimate land area needed to provide sufficient solar resource for a project (house, car, village, country, world).
Learning Objectives: Solar Resource

Buonassisi (MIT) 2011
Human Energy Use (mid- to late-century)
4x10¹⁴ kWh/year 50 TWave
Wind Energy Resource Base
6x10¹⁴ kWh/year 72 TWave
Solar Energy Resource Base
1.5x10¹⁸ kWh/year 1.7x10⁵ TWave
Solar Resource is VAST!
References: Wind Energy: C.L. Archer and M.Z. Jacobson, J. Geophys. Res. 110, D12110 (2005).

Buonassisi (MIT) 2011
Wind Energy Resource Base
6x10¹⁴ kWh/year 72 TWave
Solar Energy Resource Base 1.5x10¹⁸ kWh/year
1.7x10⁵ TWave
Solar Resource is VAST!
Solar Resource on Earth’s Surface
5.5x10¹⁷ kWh/year 3.6x10⁴ TWave
References: Wind Energy: C.L. Archer and M.Z. Jacobson, J. Geophys. Res. 110, D12110 (2005).
Human Energy Use (mid- to late-century)
4x10¹⁴ kWh/year 50 TWave

Buonassisi (MIT) 2011
Wind Energy Resource Base
1.4 HEC
Solar Energy Resource Base 3400 HEC
Solar Resource is VAST!
Solar Resource on Earth’s Surface
720 HEC
References: Wind Energy: C.L. Archer and M.Z. Jacobson, J. Geophys. Res. 110, D12110 (2005).
Human Energy Use (mid- to late-century)
1 HEC
In units of HEC (human energy consumption)

Buonassisi (MIT) 2011
Sun
Quantifying Solar Power
RSun
Po T4

Buonassisi (MIT) 2011
Sun
Quantifying Solar Power
RSun
Power radiated per unit area
6.250x10⁷ W/m2
Total Radiative Power of Sun (from
Stefan-Boltzman law, T =5762±50K)
Po T4
Assumes Sun is a “black body.”

Buonassisi (MIT) 2011
Earth Sun
PEarth
Quantifying Solar Power
not to scale!
RSun
D (distance to Sun)
PEarth RSun
2
D2Po
Po T4

Buonassisi (MIT) 2011
Earth Sun
PEarth
Quantifying Solar Power
not to scale!
Rsun~6.955x10⁸ m
D (distance to Sun)
PEarth RSun
2
D2Po
Po T4
Average PEarth ≈ 1366
W/m2 Ratio of Surface Areas
of Spheres: 4πR2.
D ~ 1.496x10¹¹ m

Buonassisi (MIT) 2011
• Quantify available solar resource relative to human energy needs and other fuel sources.
• Recognize and plot air mass zero (AM0) and AM1.5 spectra, and describe their physical origins. Use AM convention to quantify path length through atmosphere.
• Describe how solar insolation maps are made, and use them to estimate local solar resource.
• List the causes of variation and intermittency of solar resource and quantify their time constant and magnitude.
• Estimate land area needed to provide sufficient solar resource for a project (house, car, village, country, world).
Learning Objectives: Solar Resource

Buonassisi (MIT) 2011
Source: NASA (public domain)
Atmospheric Absorption

Buonassisi (MIT) 2011 Source: IPCC, from J. T. Houghton et al., Climate Change 1995: The Science of Climate Change (Cambridge Univ. Press, Cambridge, 1996), p. 58.; data from Kiehl and Trenberth (1996).
ATMOSPHERIC EFFECTS
IPCC’s assessment on the quantity of insolation (incoming solar radiation) reaching the Earth’s surface.
25
25
5
Reflected
Absorbed
29AtmosphericProcesses
45Absorbed
70OutgoingInfrared
104RadiationFrom theEarth
88Greenhouseeffect
Heat trapping in the atmosphere dominates the earth's energy balance. Some 30% of incoming solar energy is reflected (left), either from clouds and particles in the atmosphere or from the earth's surface; the remaining 70% is absorbed. The absorbed energy is reemitted at infrared wavelengths by the atmosphere (which is also heated by updrafts and cloud formation) and by the surface. Because most of the surface radiation is trapped by clouds and greenhouse gases and returned to the earth, the surface is currently about 33 degrees Celsius warmer than it would be without the trapping.
100
Image by MIT OpenCourseWare.

Buonassisi (MIT) 2011 22
The Air Mass is the path length which light takes through the atmosphere normalized to the shortest possible path length (that is, when the sun is directly overhead). The Air Mass quantifies the reduction in the power of light as it passes through the atmosphere and is absorbed by air and dust. The Air Mass is defined as:
AIR MASS
Valid for small to medium AM1: Sun directly overhead AM1.5G: “Conventional” G (Global): Scattered and direct sunlight D (Direct): Direct sunlight only
AM0: Just above atmosphere (space applications)
Source: http://www.pveducation.org/pvcdrom Courtesy of PVCDROM. Used with permission.

Buonassisi (MIT) 2011 23
SOLAR SPECTRUM
6000K Black Body
Visible Spectrum
From: http://www.pveducation.org/pvcdromStandard Solar Spectra Downloadable from: http://rredc.nrel.gov/solar/spectra/am1.5/
Courtesy of PVCDROM. Used with permission.

Buonassisi (MIT) 2011 24
6000K Black Body
AMO
SOLAR SPECTRUM
From: http://www.pveducation.org/pvcdrom Standard Solar Spectra Downloadable from: http://rredc.nrel.gov/solar/spectra/am1.5/
Courtesy of PVCDROM. Used with permission.

Buonassisi (MIT) 2011 25
SOLAR SPECTRUM
Qu ick Ti me ™ a nd aTIFF (LZW) d ecom p re ssor
are nee ded to see thi s p ic ture.
6000K Black Body
AMO
AM1.5
Sensitivity of Human Eye [a.u.]
From: http://www.pveducation.org/pvcdrom Sekuler R. and Blake, R., "Perception", Alfred A. Knopf Inc, New York, 1985.
Courtesy of PVCDROM. Used with permission.

Buonassisi (MIT) 2011
SOLAR SPECTRUM
AM1.5 Global: Used for testing of Flat Panels (Integrated power intensity: 1000 W/m2) AM1.5 Direct: Used for testing of concentrators (900 W/m2) AM0: Outer space (1366 W/m2)
The above charts, in Excel files: http://www.pveducation.org/pvcdrom/appendicies/standard-solar-spectra
Source of data: http://www.nrel.gov/rredc/smarts/
Courtesy of PVCDROM. Used with permission.

Buonassisi (MIT) 2011
SOLAR SPECTRUM
From: http://www.pveducation.org/pvcdrom Standard Solar Spectra Downloadable from: http://rredc.nrel.gov/solar/spectra/am1.5/
Courtesy of PVCDROM. Used with permission.

Buonassisi (MIT) 2011
• Quantify available solar resource relative to human energy needs and other fuel sources.
• Recognize and plot air mass zero (AM0) and AM1.5 spectra, and describe their physical origins. Use AM convention to quantify path length through atmosphere.
• Describe how solar insolation maps are made, and use them to estimate local solar resource.
• List the causes of variation and intermittency of solar resource and quantify their time constant and magnitude.
• Estimate land area needed to provide sufficient solar resource for a project (house, car, village, country, world).
Learning Objectives: Solar Resource
Buonassisi (MIT) 2011 29
Insolation: Incomming Solar Radiation Typically given in units of: Energy per Unit Area per Unit Time (kWh/m2/day) Helpful when designing or projecting PV systems: Expected yield Affected by: latitude, local weather patterns, etc.
INSOLATION

Buonassisi (MIT) 2011
Equipment for solar irradiance measurements http://www.nrel.gov/data/pix/searchpix_visual.html
Global/Direct Insolation: Ground Measurements
pyranometer
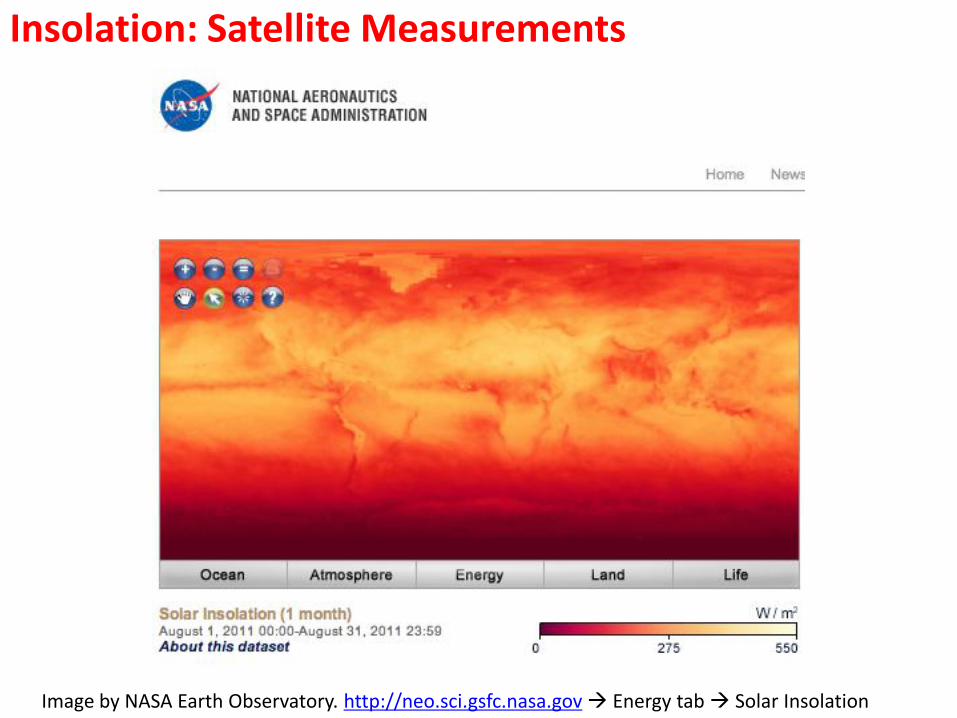
Buonassisi (MIT) 2011 Image by NASA Earth Observatory. http://neo.sci.gsfc.nasa.gov Energy tab Solar Insolation
Insolation: Satellite Measurements

Buonassisi (MIT) 2011 http://eosweb.larc.nasa.gov/sse/
Global Insolation Data

Buonassisi (MIT) 2011 http://eosweb.larc.nasa.gov/sse/
Global Insolation Data
Buonassisi (MIT) 2011
• Quantify available solar resource relative to human energy needs and other fuel sources.
• Recognize and plot air mass zero (AM0) and AM1.5 spectra, and describe their physical origins. Use AM convention to quantify path length through atmosphere.
• Describe how solar insolation maps are made, and use them to estimate local solar resource.
• List the causes of variation and intermittency of solar resource and quantify their time constant and magnitude.
• Estimate land area needed to provide sufficient solar resource for a project (house, car, village, country, world).
Learning Objectives: Solar Resource

Buonassisi (MIT) 2011
Seasonal Variation of Insolation
http://pveducation.org/pvcdrom/properties-of-sunlight/calculation-fo-solar-insolation
Courtesy of PVCDROM. Used with permission.

Buonassisi (MIT) 2011
Seasonal & Diurnal Variations
Really awesome app: http://astro.unl.edu/naap/motion3/animations/sunmotions.html
• The trajectory of the sun relative to a fixed ground position is important when mounting a fixed solar array.
• Local weather patterns may limit exposure of sun at certain times of day.
• When do you want more power? Summer vs. winter?
• Not only does the length of the day change, but so does the position of the sun in the sky throughout the seasons.
• Important when considering shading effects!

Buonassisi (MIT) 2011

Buonassisi (MIT) 2011
~21 m
2.5 m

Buonassisi (MIT) 2011
Fixed vs. Tracking Systems
• As mentioned in previous slide, the sun moves through the sky. Panels that are able to constantly move and follow the sun, can increase their output per day!
• Of course added cost of building a concentrator may not make this idea a good one…
0
100000
200000
300000
400000
500000
600000
700000
800000
-1 4 9 14 19 24
tota
l sys
tem
ou
pu
t [k
Wh
]
hour of day
Fixed
1 axis
2 axis
0
1000000
2000000
3000000
4000000
5000000
6000000
7000000
Fixed 1-axis 2-axis
Tota
l Ou
tpu
t [k
Wh
]
Total Annual System Output
From PVWatts for Boston

Buonassisi (MIT) 2011
Direct vs. Diffuse Sunlight
Diffuse
Direct © source unknown. All rights reserved. This content is excluded from our CreativeCommons license. For more information, see http://ocw.mit.edu/fairuse.

Buonassisi (MIT) 2011
http://sunbird.jrc.it/pvgis/countries/countries-non-europe.htm
http://earthobservatory.nasa.gov/GlobalMaps/view.php?d1=CERES_NETFLUX_M&d2=MODAL2_M_CLD_FR
Local Weather Patterns: Long Time Constant
Image by PVGIS © European Communities, 2001-2007.

Buonassisi (MIT) 2011
• Question: Why do many solar panels in the San Francisco Bay Area point south or south-west, instead of south-east?
Local Weather Patterns: Short Time Constant
Please see lecture video or go to the links below to see the explanatory cartoon images:http://www.newport.com/images/web150w-EN/images/1069.gifhttp://www.newport.com/images/web150w-EN/images/1070.gif
Buonassisi (MIT) 2011
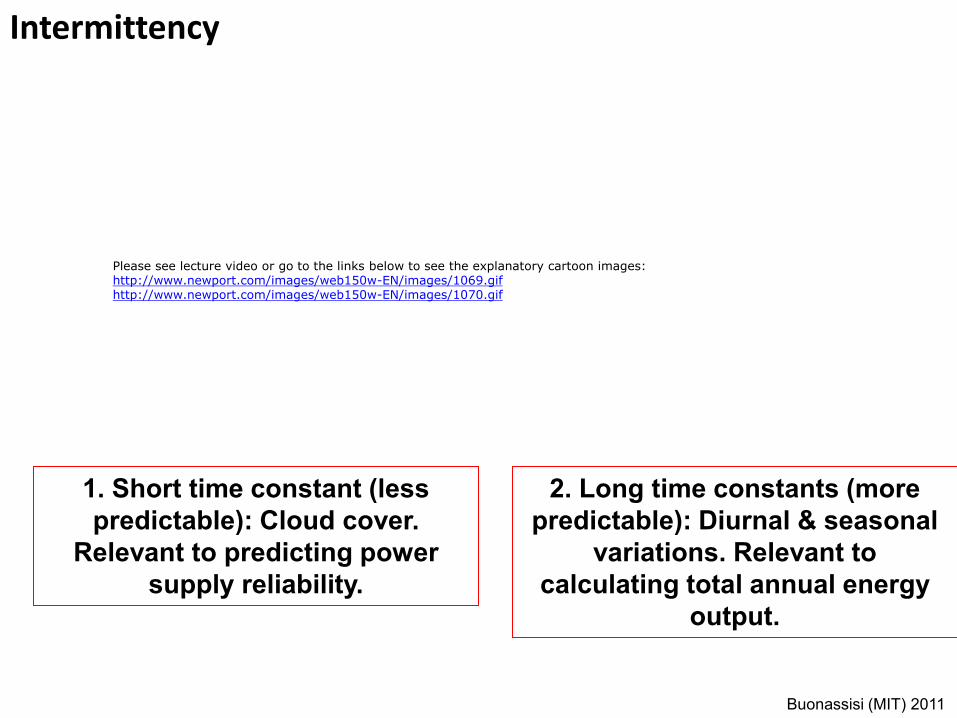
Intermittency
1. Short time constant (less predictable): Cloud cover.
Relevant to predicting power supply reliability.
2. Long time constants (more predictable): Diurnal & seasonal
variations. Relevant to calculating total annual energy
output.
Please see lecture video or go to the links below to see the explanatory cartoon images:http://www.newport.com/images/web150w-EN/images/1069.gifhttp://www.newport.com/images/web150w-EN/images/1070.gif
Buonassisi (MIT) 2011
One out of every two installed solar panels
is in Germany…
Germany & U.S. : A quick comparison
Yet we have much more sun! Conclusion: Solar resource is
part but not all of the equation.
Please see lecture video for comparative insolation between Germany and the US.

Buonassisi (MIT) 2011
• Quantify available solar resource relative to human energy needs and other fuel sources.
• Recognize and plot air mass zero (AM0) and AM1.5 spectra, and describe their physical origins. Use AM convention to quantify path length through atmosphere.
• Describe how solar insolation maps are made, and use them to estimate local solar resource.
• List the causes of variation and intermittency of solar resource and quantify their time constant and magnitude.
• Estimate land area needed to provide sufficient solar resource for a project (house, car, village, country, world).
Learning Objectives: Solar Resource

Buonassisi (MIT) 2011
Units 101 • Basic Units Check: Assign Appropriate Units
• Energy
• Power
• Current
• Voltage
• Amps (A)
• Kilowatt Hours (kWh)
• Kilowatts (kW)
• Volts (V)

Buonassisi (MIT) 2011
Units 101 • Basic Units Check: Assign Appropriate Units
• Energy
• Power
• Current
• Voltage
• Amps (A)
• Kilowatt Hours (kWh)
• Kilowatts (kW)
• Volts (V)

Buonassisi (MIT) 2011
Unit Check
• Current, voltage, power, and energy.
– Example: Hairdrier vs. Fridge.
• Which is more likely to blow a fuse?
• Which is more likely to blow your budget?
0.044 kWave
~ 1 kWh/day
1.88 kWpeak
~ 0.5 kWh/day
Photo courtesy of Niels van Eck on Flickr.

Buonassisi (MIT) 2011
Why “Peak Power”? • Why is “peak power” (kWp) useful?
– Because it is a location (resource) neutral rating of output power. A PV module will have the same kWp in Arizona or Alaska, although the kWave will be very different! Useful spec when designing systems.

Buonassisi (MIT) 2011
Estimating System Output from Insolation Maps
Q: Let’s say I have a 2.2 kWp photovoltaic array. How much energy will it produce in a year? A: Let’s say our location receives, on average, 4 kWh/m2/day from the Sun. The calculation is then straightforward:
Energy Output 2200 Wp 4.0 kWh/m2 /day
1000 Wp/m2
8.8 kWh/day 3200 kWh/year
AM 1.5G
System size
Insolation at site of
installation

Buonassisi (MIT) 2011
More Accurate Predictions
PVWatts: Tapping into the NREL database http://www.pvwatts.nrel.gov/
SAM (Solar Advisor Model) https://www.nrel.gov/analysis/sam/

Buonassisi (MIT) 2011
Actual system outputs may be significantly lower, due to suboptimal system performance, design, installation, shading losses, etc.: Source (outdated): https://web.archive.org/web/20081025200657/http://soltrex.masstech.org/systems.cfm
Actual System Outputs

Buonassisi (MIT) 2011
Material Helpful for Homework Problems

Buonassisi (MIT) 2011
Estimating Solar Land Area Requirements
Land Requirements (m2) = Energy Burn Rate (kWh/yr)
Solar Resource kWh
m2 yr
Conversion Efficiency
Here’s the equation to use, when calculating the area of land needed to produce a certain amount of energy over a year, given a technology with a certain conversion efficiency.
How much energy from the Sun is available (read values off insolation maps
in previous slides for a particular location. (Watch
units: days-1 vs. years-1)
How much land is needed
The ability of a given technology to convert sunlight into a usable form. NB: This is the
conversion efficiency for the entire system, not just
the device.
How much energy (kWh) will be produced by the
solar system over the course of a year.
Buonassisi (MIT) 2011
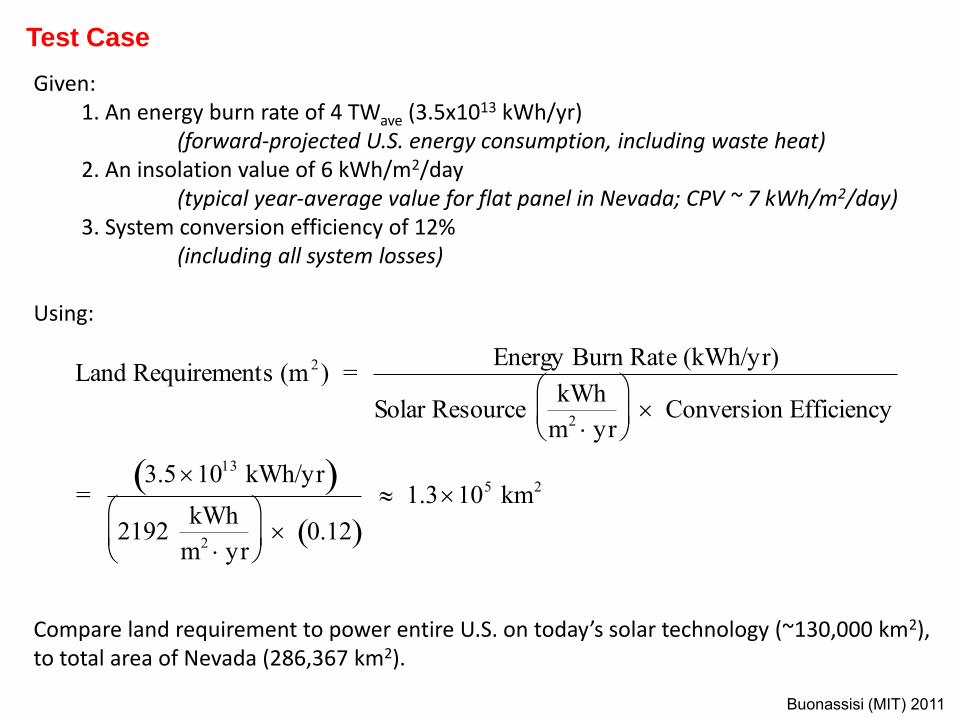
Test Case
Given: 1. An energy burn rate of 4 TWave (3.5x10¹³ kWh/yr) (forward-projected U.S. energy consumption, including waste heat) 2. An insolation value of 6 kWh/m2/day (typical year-average value for flat panel in Nevada; CPV ~ 7 kWh/m2/day) 3. System conversion efficiency of 12% (including all system losses) Using: Compare land requirement to power entire U.S. on today’s solar technology (~130,000 km2), to total area of Nevada (286,367 km2).
Land Requirements (m 2) = Energy Burn Rate (kWh/yr)
Solar Resource kWh
m2 yr
Conversion Efficiency
= 3.51013 kWh/yr
2192 kWh
m2 yr
0.12
1.3105 km2
Buonassisi (MIT) 2011
0
0.5
1
1.5
2
2.5
3
3.5
0 20 40 60
Lan
d A
rea
Re
qu
ire
d
(x 1
05 k
m2)
System Conversion Efficiency (%)
Flat Panel
CPV
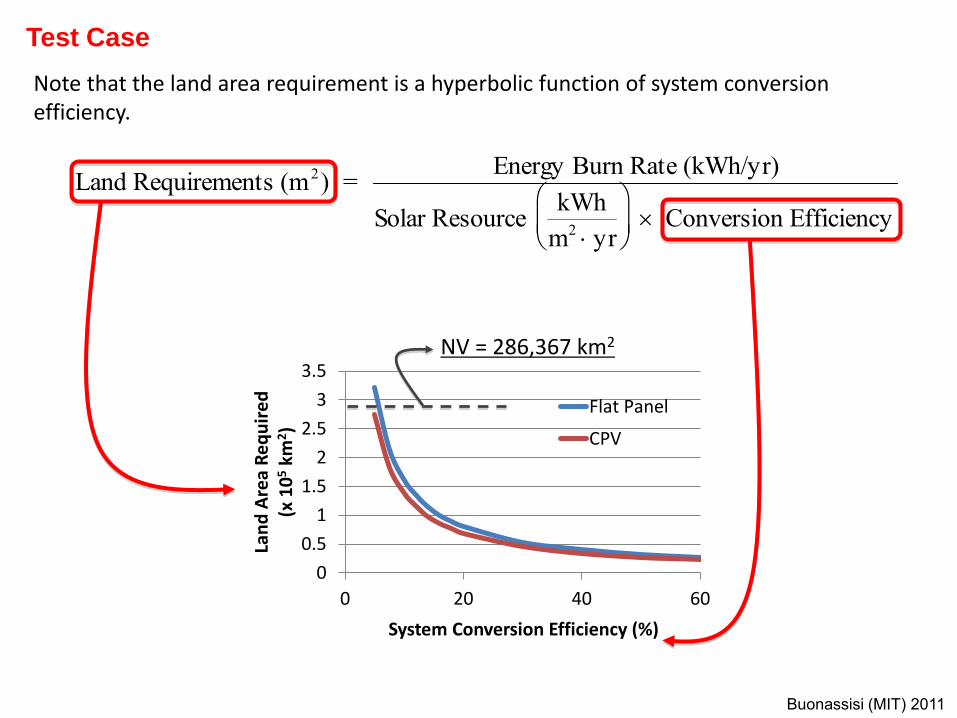
Test Case
Note that the land area requirement is a hyperbolic function of system conversion efficiency.
Land Requirements (m2) = Energy Burn Rate (kWh/yr)
Solar Resource kWh
m2 yr
Conversion Efficiency
NV = 286,367 km2
Buonassisi (MIT) 2011 61
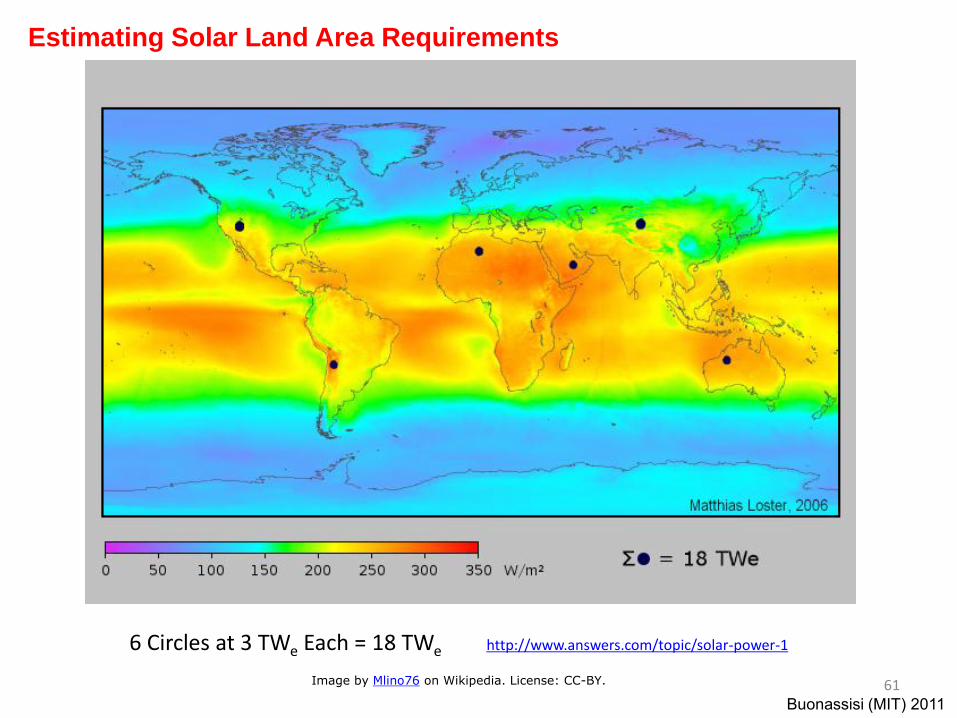
Estimating Solar Land Area Requirements
6 Circles at 3 TWe Each = 18 TWe http://www.answers.com/topic/solar-power-1
Image by Mlino76 on Wikipedia. License: CC-BY.

MIT OpenCourseWarehttp://ocw.mit.edu
2.627 / 2.626 Fundamentals of PhotovoltaicsFall 2013
For information about citing these materials or our Terms of Use, visit: http://ocw.mit.edu/terms.