the socio-economic impacts of the lake havasu fisheries improvement program · lake havasu...
TRANSCRIPT

The Socio-Economic Impacts of the
Lake Havasu Fisheries Improvement Program
Bernard E. Anderson, Ph.D. Economist
Anderson & Associates
Economic and Social Impact Specialists October 30, 2001
i
- EXECUTIVE SUMMARY - This study evaluates the socio-economic impacts of the Lake Havasu Fisheries Improvement
Partnership. The fishery program is massive in scope and after 8 years of implementation has resulted in the enhancement of Lake Havasu’s popularity among anglers. The resulting increase in fishing activity, and associated fishing related expenditures in the local area, have produced significant, long term socioeconomic benefits to the local area, including increases in employment, income and tax revenues. These benefits are expected to last into the foreseeable future with relatively low program and structure maintenance costs. The Partnership has been run efficiently and with tremendous cooperation among six government agencies and one private non-profit organization. In addition, it was primarily funded with money coming from outside of the Lake Havasu Area. Non-resident fishing expenditures in the Lake Havasu area (e.g. lodging, food, guides, terminal tackle, and fuel, among others) generate the following economic benefits within the local area: ?? Value added of over $18,000,000 per year ?? Labor income of over $11,000,000 per year ?? Employee income of about $10,000,000 per year ?? Proprietors income of about $1,320,000 per year ?? Property income of about $4,500,000 per year ?? Indirect business taxes of about $2,400,000 per year ?? 650 jobs per year ?? Total output of about $33,800,000 per year
In addition, resident anglers’ expenditures in the local area generates an additional $17.7 million in value added, 639 jobs, and $2.6 million in state and local tax revenues. Other indicators of the success of the Fisheries Improvement Program include: ?? 84% of anglers indicated they were familiar with the Program ?? 97% of those noticed an improvement in the quality of the fishery ?? On a scale of 1 to 5 (5 being highest quality) anglers gave the fishery a rating of 4.1 ?? In 1987 angler use days numbered 43,000 – today there are over 170,000 per year, a
212% increase ?? Fish size and quality has increased at the same time angler pressure has more than
tripled ?? Populations of two threatened and endangered fish augmented ?? 70% of anglers come from outside of the Lake Havasu area The program has also enhanced social values for those living or visiting the area: ?? 5 fully accessible fishing piers/picnic areas have been completed with a focus on
family use ?? Increased fishery quality has led to increased use by kids and parents alike ?? Birding, scuba diving, interpretive walking paths, and nature studies are enhanced
ii
Acknowledgements
This study was completed under contract with the Lake Havasu Chapter of Anglers United. Initial organization and assistance came from this chapter as well as from the Scottsdale Chapter of Anglers United in Phoenix, Arizona. Funding was provided by a combined grant from the American Sportfishing Association and the Bureau of Land Management. All studies require the help and assistance of many people. This study is no exception. A number of state and federal agencies were supportive including the Bureau of Land Management, the Bureau of Reclamation, the U.S. Fish and Wildlife Service, the Arizona Game and Fish Department, the California Department of Fish and Game, and the Metropolitan Water District of Southern California. Anglers United, a private volunteer organization was also heavily involved. Each of these entities supplied data, advice and, in some cases, individual help in administering surveys. The author is indebted to each member of Anglers United and the wonderful volunteers who day after day and year after year construct, develop and place the artificial reef habitat in Lake Havasu. Not only have these people completed this work for no economic remuneration but also many of them helped collect the survey data included in this study and many of them were involved in test runs in the development of the survey instrument. There were some individuals who gave advice and much effort in many phases of this study who need to be mentioned by name. Robert Koeppe, President of the Lake Havasu Chapter of Anglers United was a great help in data gathering and advice from the angler’s prospective. Kirk Koch, Fisheries Program Manager, U.S. Bureau of Land Management is the leader of the many public sector organizations involved in habitat improvement. He manages the Lake Havasu Habitat Improvement Program. His assistance was invaluable. His advice and counsel were crucial and most welcomed in all aspects of this study. Loren Cabe, Senior Economist with the BLM in Denver gave advice throughout the study period and helped edit the final report. Vicki Josupait, Recreation Planner with the BLM in Denver completed a final edit and arranged the layout of the final report. Larry Riley, Chief of Fisheries, Arizona Game and Fish Department provided crucial data and editing advice. His colleague Todd Pringle provided valuable data on angler populations along the Colorado River. Dr. Chuck Minckley with the U. S. Fish and Wildlife Service provided information on endangered species and helped in editing. Robert Veazey, President of Anglers United Scottsdale Chapter, provided data and advice, especially from the professional angler’s point of view. There were others too numerous to mention by name but who helped in many ways. Numerous citizens of Lake Havasu City as well as citizens of Parker, Arizona helped to make this study more complete. Employees of the Lake Havasu Habitat Improvement Program were invaluable, as were the secretaries and staff of the Lake Havasu Office of the BLM. I thank the anglers themselves for taking the time to provide us with their data. This study would not have been possible without their cooperation. Bernard E. Anderson, Ph.D. Economist 170 Meadowridge Trail Durango, Colorado 81301 970-247-4947 970-759-1685 cell [email protected]

iii
List of Tables and Charts
Tables: Page: Table 1. Angler Opinion Regarding Improved Fishing Quality at Lake Havasu…. 13 Table 2. Angler Opinion Regarding Habitat Program Familiarity and Improved
Fishery Since 1996 ………………………………………………………... 14
Table 3. Mohave County Economic Data – 1998 ………………………………… 33 Table 4. New Final Demand – Annual Rates of Spending ………………………. 34
Table 5. Annual Economic Impacts – Additions to Levels of Income, Output, Jobs,
Taxes Caused By Non-Resident, Non-Tournament Angler Spending …… 35
Table 6. Annual Economic Impacts – Additions to Levels of Income, Output, Jobs, Taxes Caused By Non-Resident, Tournament Angler Spending ………… 36
Table 7. Annual Economic Impacts – Additions to Levels of Income, Output, Jobs, Taxes Caused By Total Non-Resident Angler Spending ………………… 37
Table 8. Annual Economic Impacts – Amounts of Income, Output, Jobs,
Taxes Supported By Resident Angler Spending …………………………. 38 Charts: Chart 1. Windsor Beach Tournament Boats ………………………………………. 8 Chart 2. Proportional Stock Densities, Largemouth Bass in Lake Havasu ………………. 9 Chart 3. Angler Success Rate, Lake Havasu …………………………………...… 10 Chart 4. Angler Catch Rates, Fish Caught & Fish Kept, Lake Havasu …………... 10 Chart 5. Average Size of Fish Kept, Lake Havasu ……………………………….. 11 Chart 6. Location of Surveys ……………………………………………………... 16 Chart 7. Residence of Anglers ………………………………………………….… 17 Chart 8. Pier Fishermen Residence ……………………………………………….. 18 Chart 9. Days Fished Per year …………………………………………….………. 22 Chart 10. Number of Days Fished Per Year at Lake Havasu ……………………... 22

iv
Chart 11. Percentage of Total Days Fished Per Year Spent at Lake Havasu ……... 23 Chart 12. Length of Current Trip to Lake Havasu ………………………………… 24 Chart 13. Expenditures Per Day On Lodging …………………………………...… 25 Chart 14. Expenditures Per Day On Food ………………………………………… 25 Chart 15. Expenditures Per Day On Terminal Tackle …………………………….. 26 Chart 16. Expenditures Per Day On Fuel …………………………………………. 26 Chart 17. Expenditures on Rods and Reels – Last Five Years ……………………. 27 Chart 18. Expenditures on Boats and Motors – Last Five Years ………………….. 28 Chart 19. Expenditures In The Last Year On Storage and Maintenance………….. 29 Chart 20. Expenditures for Rods & Reels and Boat & Motors Allocated to
Lake Havasu Use ………………………………………………………….. 30 Chart 21. Mesquite Pier #1 Percentage of Use …………………………………… 42 Chart 22. Mesquite Pier #2 Percentage of Use …………………………………… 43 Chart 23. Havasu Springs Pier Percentage of Use ……………………………….. 43 Chart 24. Take Off Point Pier Percentage of Use ………………………………... 44 Chart 25. Site 6 Pier Percentage of Use ………………………………………….. 44 Chart 26. Percent of Physically Challenged Anglers …………………………….. 45 Chart 27. Angler Gender …………………………………………………………. 46 Chart 28. Age Distribution of Anglers …………………………………………… 47
Cover Photo: The Havasu Springs fishing dock, since dedication by Interior Secretary Bruce Babbitt in 1994, has accounted for thousands of angler use days per year.

v
Table of Contents:
Executive Summary …………………………………………………………… i Acknowledgements ………………………………………………………………………… ii List of Tables and Charts …………………………………………………….. iii Table of Contents ……………………………………………………………... v Section 1. – History of Lake Havasu and the Habitat Program ……………. 1 Section 2. – The Question of “Cause” and “Effect” – Has the Program
Caused A Better Fishery? …………………………………………….. 5 Section 3. – Angler Survey and Results – Spring 2001 ……………………… 15 Section 4. – Economic Impact ………………………………………………… 31 Section 5. – Social Aspects of Project ………………………………………… 39 References……………………………………………………………………… 49

1
Section 1 - History of Lake Havasu and the Habitat Project:
In order to begin to understand the importance of the Lake Havasu Habitat Project and its
relationship to current angler activity, one needs a rudimentary comprehension of the history of Lake Havasu and Lake Havasu City.
Parker Dam:
Mankind has long admired the Colorado River for its economic potential. Ancient dwellers along this river have used it not only as a source for domestic water but also for its life giving potential for crop production and for transportation. Modern man, for similar reasons, has eyed the Colorado River as an important source of domestic water for his cities. This desire for water existed even though the delivery of the water would require enormous expenditures for canals and pumping stations. There were few alternatives to using Colorado River water. Considering that water was a necessity for population growth on the West Coast, the development of the Colorado River was a foregone conclusion.
Los Angeles was the first to actually propose a site for water storage behind Parker Dam.
Planning by the Metropolitan Water District of Los Angeles began in 1928. Construction of the aqueduct began in 1932. The dam was built between 1934 and the system’s final completion in 1941.
The second major player in the diversion of Colorado River water was the State of Arizona.
Dry desert and the increasing use of well water for agriculture along with the increasing population pressures made the river a logical source of water. It was a long process but through the persistence of many, including the leadership of Senator Carl Hayden of Arizona, the Central Arizona Project became a reality in 1992.
Thus, the damming of the Colorado River at Parker was necessitated by the desire to create
a huge reservoir. The reservoir was to provide water for pumping to Los Angeles and eventually to central and southern Arizona. In addition, the reservoir would allow silts to settle to the lake bottom, necessitating minimal purification by metropolitan users. This reservoir was named Lake Havasu.
Lake Havasu is somewhat unique when compared to its bigger sister lakes upstream. Lake Havasu is relatively shallow in comparison to Lake Powell or Lake Mead. The depth of Lake Havasu and thus the position of the shoreline do not vary much. Lake Powell will vary in depth over a year cycle by as much as 40 feet. Lake Mead fluctuates a great deal also. The creation of Lake Havasu drowned relatively shallow arroyos and small mounds of rock and sand. Lake Powell and Mead drowned massive, boulder strewn canyons and sheer rock escarpments. The average depth of Lake Havasu is 30 feet although the southern one-third averages 70 feet (Jim Ocker 2001). Lake Powell and Mead are much, much deeper.
Recent Havasu Settlement:
The modern day settlement of Lake Havasu began under the auspices of the U.S. Army Air Corp. WW II pilot training in the area necessitated a secondary landing field. A rough airbase was established on the Lake Havasu peninsula (now an island). In addition, General Patton’s tank Corp used the surrounding area as training ground in preparation for their duties in North Africa. The

2
land and lake lay mostly unused until Mr. Robert McCulloch Sr., looking for motor testing site, flew over the area in 1964. He spotted the old Army Air Force training center, which fit his needs perfectly. He purchased 26 square miles and was instrumental in turning the current site of Lake Havasu City into a true town. In 1968 he purchased the London Bridge from the City of London and after moving it to Lake Havasu City and reconstructing it in its current location, dug a channel underneath the bridge, making the old peninsula into an island. And, one might say, “the rest is history!”
Today, Lake Havasu City is approaching 50,000 in population. It is a full service city with
excellent health care facilities, modern housing, and all the conveniences of a modern city. Retirees have found it a perfect place to spend winters. In addition, recreation, much of it focusing on the miles of shore bordering the town and the lake, is an extremely important drawing card. It is part of what people living in Arizona call “Arizona’s West Coast.”
The Impact of Dam Building on the Fishery:
The original channel of the Colorado River from just above the current-day Lake Havasu City towards the site of Parker Dam was covered by a vast grove of cottonwood trees. These flooded trees provided initial habitat for the development of a bass and crappie fishery. Striped bass were introduced which fed on the smaller bass and crappie as well as native fish in the area. Over time, the threadfin shad became the main diet of the striped bass. However, the success of the fishery depended on habitat suitable for the production of food for forage fish and others and also habitat suitable to provide protection for spawning fish and young fry.
As with most young lakes, the flooding of trees, bushes, rocks and soil initially provided
plentiful habitat for the forage fish, crayfish and new young fish to develop. This, in turn, provided a food chain for the development of good largemouth bass, crappie and striped bass populations. Many stories abound regarding the catching of massive striped bass in the early days. But, over time the habitat disintegrated and became sterile in terms of good quality habitat. In addition, because the lake was fairly shallow, the cottonwood trees were a hazard to boating. They stood above the water like an orchard of tree “tombstones” marking the site where the grove of cottonwood trees flourished before the dam was construction. In the late 1960s, these old tree skeletons were cut with an underwater chainsaw and removed from the lake.
It should be pointed out that the removal of the tree trunks did not hurt the habitat a great
deal as the trees had been disintegrating on their own for many years. But, the removal was one more step in the otherwise natural decline of the habitat at Lake Havasu.
The decline in habitat, the alterations to the original Colorado River by the creation of Lake
Havasu and the development of a game fish population also caused a decline in the native fish populations. The Federal Government listed the razorback sucker and the bonytail chub, both endemic to the original river, as endangered species. As the decade of the 1980’s came to a close, it became obvious that something had to be done to enhance the declining natural habitat of Lake Havasu. “In the late 1980’s, fishing was only getting worse, native fish were almost extinct and anglers without boats could not access the shoreline to be rejuvenated with a day of fishing” (MidProgram Review 1998).

3
History of the Lake Havasu Fisheries Improvement Program:
Discussion among several state, federal and private groups regarding the poor sport fishery at Havasu resulted in the formation of the Lake Havasu Fisheries Improvement Program in 1992. Led by the Bureau of Land Management, the partnership now includes the Bureau of Reclamation, the U.S. Fish and Wildlife Service, the Arizona Game and Fish Department, the California Department of Fish and Game, the Metropolitan Water District of Southern California and Anglers United (including both the Scottsdale and Lake Havasu chapters) (MidProgram Review 1998). This project is truly unique because it includes agencies from the two states, agencies from the federal level and two private Anglers United chapters. The day to day management of the program became the responsibility of the Bureau of Land Management and Anglers United. Technical, financial, and other means of support came from the other agencies involved.
The Program focused on meeting three major goals: a. Improving vital game fish production by installing artificial reef
habitats and to provide physical habitat complexity in order to concentrate fishes
b. Enhancing shoreline angling access, including trails, restrooms and docks
c. Increasing endangered native fish populations
The old, submerged forest along the Colorado River provided excellent Sportfishing habitat that slowly deteriorated.
4
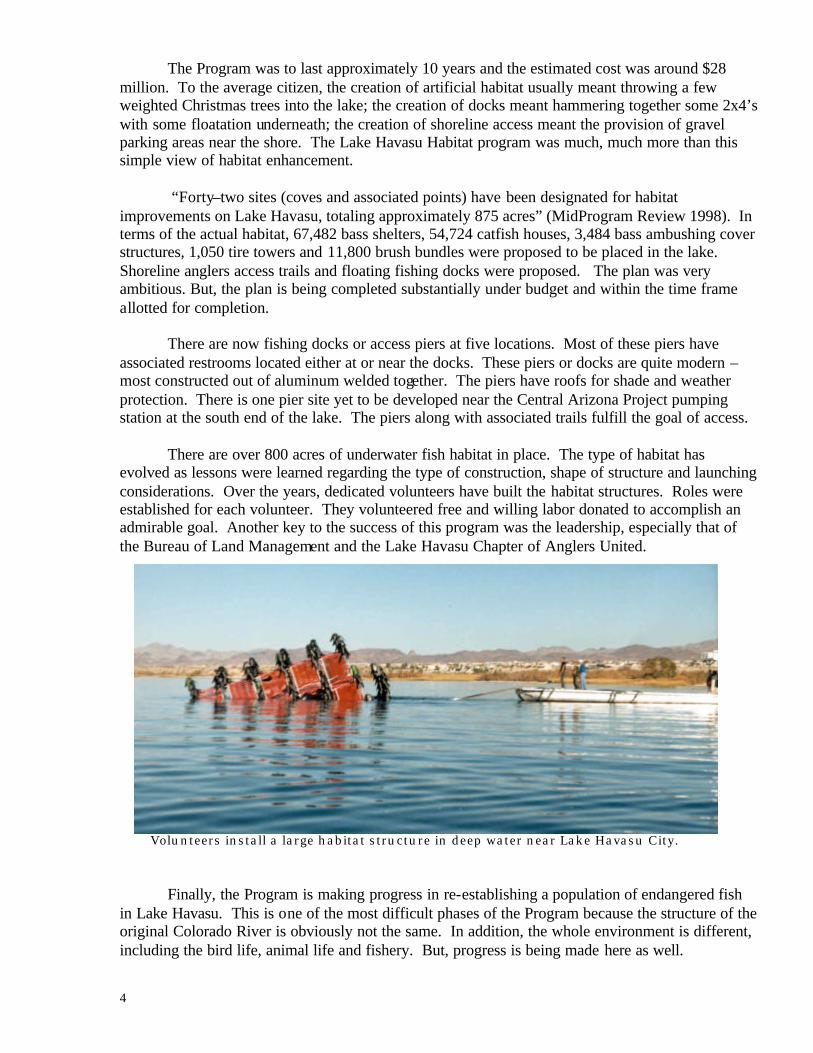
The Program was to last approximately 10 years and the estimated cost was around $28 million. To the average citizen, the creation of artificial habitat usually meant throwing a few weighted Christmas trees into the lake; the creation of docks meant hammering together some 2x4’s with some floatation underneath; the creation of shoreline access meant the provision of gravel parking areas near the shore. The Lake Havasu Habitat program was much, much more than this simple view of habitat enhancement.
“Forty–two sites (coves and associated points) have been designated for habitat
improvements on Lake Havasu, totaling approximately 875 acres” (MidProgram Review 1998). In terms of the actual habitat, 67,482 bass shelters, 54,724 catfish houses, 3,484 bass ambushing cover structures, 1,050 tire towers and 11,800 brush bundles were proposed to be placed in the lake. Shoreline anglers access trails and floating fishing docks were proposed. The plan was very ambitious. But, the plan is being completed substantially under budget and within the time frame allotted for completion.
There are now fishing docks or access piers at five locations. Most of these piers have
associated restrooms located either at or near the docks. These piers or docks are quite modern – most constructed out of aluminum welded together. The piers have roofs for shade and weather protection. There is one pier site yet to be developed near the Central Arizona Project pumping station at the south end of the lake. The piers along with associated trails fulfill the goal of access.
There are over 800 acres of underwater fish habitat in place. The type of habitat has
evolved as lessons were learned regarding the type of construction, shape of structure and launching considerations. Over the years, dedicated volunteers have built the habitat structures. Roles were established for each volunteer. They volunteered free and willing labor donated to accomplish an admirable goal. Another key to the success of this program was the leadership, especially that of the Bureau of Land Management and the Lake Havasu Chapter of Anglers United.
Volunteers install a large habitat structure in deep water near Lake Havasu City.
Finally, the Program is making progress in re-establishing a population of endangered fish
in Lake Havasu. This is one of the most difficult phases of the Program because the structure of the original Colorado River is obviously not the same. In addition, the whole environment is different, including the bird life, animal life and fishery. But, progress is being made here as well.
5
Section 2 - The Question of “Cause” and “Effect” – Has the Program Caused A Better Fishery?
Causation:
The main purpose of this study is to measure the economic impact of the Fisheries
Improvement Program by examining angler expenditures. But, did the anglers fish Lake Havasu because of the success of the Program in re-establishing fish habitat and therefore, fish numbers, or would the anglers have fished Lake Havasu anyway without any help from any habitat enhancement program? That is one of the most difficult questions to answer. There are several sources of evidence that can be examined to help answer this question.
Hard Numbers:
One of the problems in assessing the effects of the habitat improvement project is the lack of consistent historical data. As mentioned in the history section, Parker Dam and thus, Lake Havasu have been around since the 1930’s. People have been fishing this lake for a long time. However, laws have changed, economic conditions have fluctuated and wars have been fought during this long period of time. All of these occurrences have created an ebb and flow of interest in the fishery and thus, the flow of data from the use of Lake Havasu. The management of the lake has been impacted by decisions among the Bureau of Reclamation, the Bureau of Land Management, the Los Angeles Metropolitan Water District, the Central Arizona Water Project, the county of Mohave, the Arizona Game and Fish Department, the California Department of Fish and Game, Lake Havasu City, the Federal Fish and Wildlife Service, the Chemehuevi Native American tribe, La Paz County, and San Bernardino County. In addition, numerous private groups have had an influence at one time or another on the management decisions made throughout the Lake’s history. Today, if one is a non-resident of Arizona, one must have a non-resident Arizona fishing license to fish on the Arizona side of the Lake. If one is going to leave the shore, one must have, in addition to the Arizona license, a Colorado River Special Use Stamp. If one is from California and is fishing on the Lake he too must have a Colorado River Stamp. But, if he is just fishing from the shore (California side), he only needs the California license. If one is fishing from the Chemehuevi owned shore, permission must be obtained from the Tribe. But, if fishing from the tribal launch area and on the Lake, a Colorado River Stamp must be obtained. This is true if one is fishing anywhere along the Colorado River, not just on Lake Havasu. All of these sellers of permits and licenses are potential sources of data on angler use over time. The problem is that the rules and laws have changed and data history is somewhat clouded.
The examination of cause and effect is made even more difficult because it is possible that angler over use relative to the productivity of the lake in the 1980’s may have exacerbated the decline in the fishery. Once anglers find difficult fishing conditions, the angler mix changes. Tournaments tend to decline in numbers faster than general angler use declines. All of these things make determining cause and effect very difficult.

6
Data from Original Environmental Assessment: In preparation for the authorization of the Lake Havasu Fisheries Program, an environmental assessment was completed. In the report data was given on estimates of angler use days in 1989 at Lake Havasu. In 1989 it was estimated that the lake received approximately 43,000 angler use days (Marzoula et al., 1990). In 2001 the Arizona Game and Fish Department, based on a statewide angler use survey, estimated the user days to be 179,114 (Todd, 2001). The current study, using a process of aggregation of data collected by this survey, estimated angler use days at 175,455 (see Section 3, Number of Anglers). Obviously, if these data are close to correct, that represents an increase from 132,000 to 136,000 angler use days per year which, on a percentage basis, is an approximately 212% increase over 1989. Do these data mean that the fisheries program created about 134,000 additional angler use days by itself? Probably not, but these data do show that in the late 1980’s, not many anglers came to Lake Havasu. The same report gave data on catch rates. The 1989 report stated that “catch rates are currently (1989) one target fish per 5 hour period fished. One fish per hour is generally considered good fishing” (Marzoula et al, 1990). Jacobson, a fisheries specialist cited in a following section on biological evidence of improvement, gives data that shows the catch rate was about .35 fish per hour in 1987 and has risen to about .55 fish per hour (a 57% increase) in 2000. The keep rate was about .20 per hour in 1987 and is now (year 2000) about .35 per hour (a 75% increase) (Jacobson, 2001). This all happened while the pressure on the fish population from angling increased 212% (increase in angler use days between 1989 and 2001).
Past Trends in Use: Initially, it was felt that historical data on the number of Colorado River stamps would provide a trend that could be examined. A downward trend in stamp numbers prior to the implementation of the habitat program might be an indication of declining angler interest in Lake Havasu. A rising number of stamp sales after the program started might indicate that the program was doing its job. However, after gathering what data existed it quickly became apparent that one could not separate Lake Havasu stamp numbers from the total stamp sales for each of the years needed for trend analysis. Remember that Colorado stamp purchases are required of anyone fishing on the Colorado River anywhere between Boulder Dam and Mexico. A second focus was on those anglers who might be more discerning regarding the quality of the catch as well as the numbers of fish. These anglers are the tournament participants. Numbers of participants and tournaments held at Lake Havasu over time would be a good indication of the change in the quality of the fishery. The connection between fishery quality and tournament interest was recently pointed out in the conclusion section of a new study on attitudes and impacts of tournament participants in Virginia Beach, Virginia. The study was completed by the Department of Wildlife and Fisheries Sciences at Texas A&M University in March 2001.
7
“If fish stocks continue to decrease, angler satisfaction with the tournament fishing can be expected to decrease as well. When this occurs, anglers will be attracted to tournament events elsewhere, resulting in economic impact losses to the local community. The take home message here is that the current status of fish stocks is connected to fishing quality, which is linked to angler satisfaction, which is linked to their willingness to participate in local fishing tournaments on the regular basis. Fishing quality now and in the future is an important consideration for successful fishing tournaments” (Thailing, et al, 2001).
Almost all of the sponsored tournament activity at Lake Havasu launches at Windsor Beach State Park at Lake Havasu City. We do have historical data from the Arizona State Parks. Chart 1 illustrates data on the number of tournament boats launched at Windsor Beach for the years 1994 through 2000. With the exception of 1997 and 1999, boat numbers have increased substantially. Preliminary figures for 2001 indicate that there will be a huge increase in boat numbers for this year. The habitat program began in 1992 but did not really mature until the mid 1990’s. Obviously, habitat enhancement does not stimulate fish stocks instantaneously. Habitat development is an investment that requires years of maturity to enhance the fish stocks needed for reproduction and for food growth. There can be no question however, that the number of boats and the number of tournaments have increased dramatically since 1994.
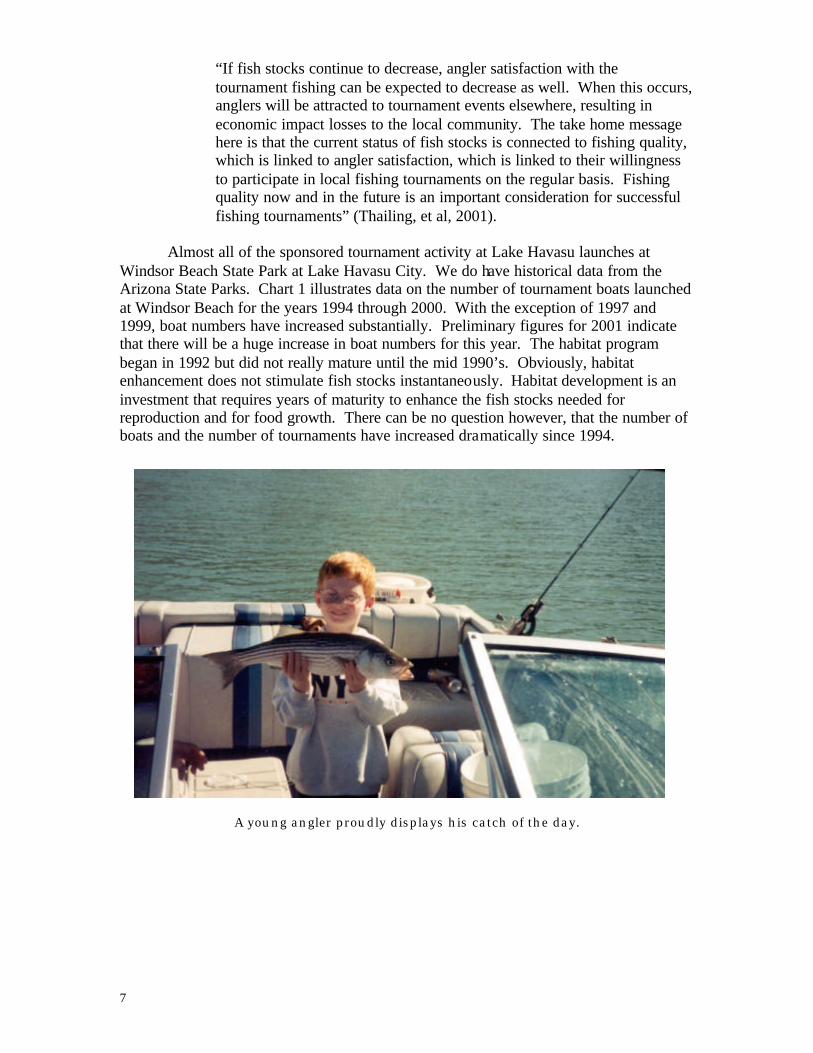
A young angler proudly displays his catch of the day.

8
Biological Evidence of Habitat Improvement Effectiveness:
Brad Jacobson, a fisheries specialist with the Arizona Game and Fish Department has studied the impact of the Habitat Improvement program at Lake Havasu. His conclusions follow:
“Has the fishery improved at Lake Havasu since the start of the Lake Havasu Fisheries Improvement Program? This question is the most common question asked and it isn’t an easy one to answer. As with any biological change there are several events which occur through time that could stimulate change and it is impossible to single out one and say that’s what changed the fishery. All we can do is report our findings both before and after the start of the improvement program and let you make your own determination. Since we are dealing with ever-changing population one needs to keep in mind that the trend information being presented will show some fluctuation. In my opinion the Lake Havasu Fisheries Improvement Program has played a significant role in the changes that are shown in the (data) that follow” (Jacobson, 2001).
?? “Channel catfish appear to have increased since the start of the improvement program.”
?? “Largemouth bass also show a slight increase.”
Chart 1 - Windsor Beach Tournament Boats
369
8951024
818
1311
937
1498
0
200
400
600
800
1,000
1,200
1,400
1,600
1994 1995 1996 1997 1998 1999 2000prelim.
Num
ber o
f Boa
ts

9
?? “Striped bass seem to change depending on the strength of the various year classes.”
?? “…the number of stock size bass (largemouth) over 12 inches since the start
of the fisheries improvement program appears to be more stable and at a higher level than it was before the program. The percentage of stock size bass over 15 inches also appears to be at a higher level” (Jacobson 2001).
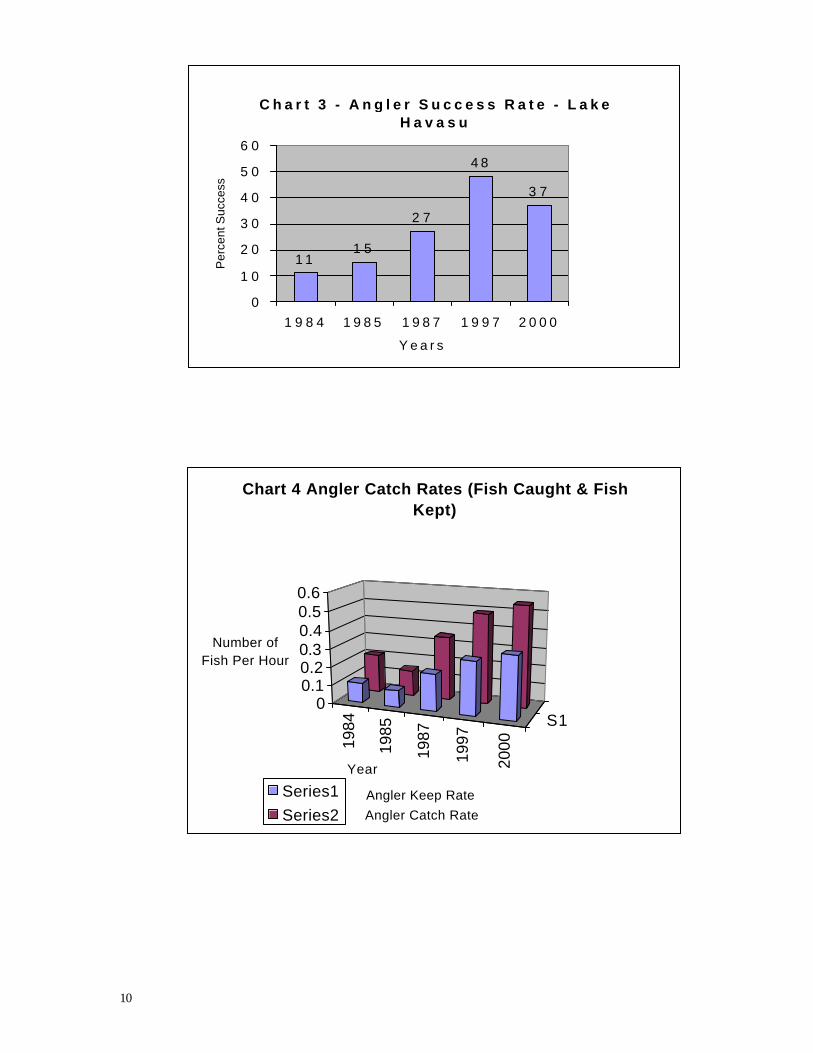
As previously cited in the Virginia Beach study, if fishermen are not increasingly satisfied, numbers of anglers will not increase and if the quality of the catch is not better, angler interest will wane. Jacobson has evidence on the quality of the catch at Lake Havasu. Chart 3 illustrates angler success rates. As can be seen, angler success rates have increased dramatically (year 2000 is partial data). Chart 4 gives data on the number of fish caught per hour. Again, dramatic increases are evident. Chart 5 illustrates size changes. Slight increases are evident. “The size of channel catfish that are being kept by the anglers appears to be increasing. This increase was also indicated in the survey data”(Jacobson, 2001). Tournament data show that in addition to these improvements, a substantial and growing population of small mouth bass is developing at Lake Havasu.
86 88 90 92 94 96 98
S1
0%10%
20%
30%
40%
50%
60%
70%
Percent Composition
Years
Chart 2 - Proportional Stock Densities (Largemouth Bass)
Series1 Series2 Series3
Over 15 in. Between 12 & 15 in. Proportional Stock Density
10
C h a r t 3 - A n g l e r S u c c e s s R a t e - L a k e H a v a s u
1 11 5
2 7
4 8
3 7
0
1 0
2 0
3 0
4 0
5 0
6 0
1 9 8 4 1 9 8 5 1 9 8 7 1 9 9 7 2 0 0 0
Y e a r s
Per
cent
Suc
cess
1984
1985
1987
1997
2000
S10
0.10.20.30.40.50.6
Number of Fish Per Hour
Year
Chart 4 Angler Catch Rates (Fish Caught & Fish Kept)
Series1Series2
Angler Keep RateAngler Catch Rate

11
Jacobson’s summary comments reinforce the importance of the Habitat Project. ?? The size of channel catfish appears to be increasing since the start of the
fisheries improvement program. ?? There appears to be a slight increase in the size of largemouth bass since
the start of the fisheries improvement program. ?? The proportional stock densities for largemouth bass have improved since
the start of the fisheries improvement program. ?? The percentage of stock size bass over 15 inches has increased since the
start of the fisheries improvement program. ?? A higher number of fishermen are successful (are catching fish) following
the start of the fisheries improvement program. ?? The catch rate has improved since the start of the fisheries improvement
program. ?? The fishermen are keeping more fish since the start of the fisheries
improvement program. ?? The size of channel catfish being caught by fishermen has increased since
the start of the fisheries improvement program. ?? The size of largemouth bass being caught by fishermen has not decreased
as a result of increased harvest since the start of the fisheries improvement program.
?? Another side note that needs to be mentioned is that the black crappie population at the lower end of Lake Havasu has increased drastically since the start of the fisheries improvement program and the flathead catfish populations appear to be increasing also.
Chart 5 - Average Size of Fish Kept
0
5
10
15
20
1984 1986 1987 1994 1997Years
Len
gth
in in
ches
Series1
Series2
Series3
Channel Catfish
Largemouth Bass
Striped Bass

12
Evidence From Users of the Fishery: Discussions with anglers who have fished Lake Havasu over many years have
produced a variety of descriptions regarding the impact of the Lake Havasu Fisheries Improvement Program.
“When the fisheries project began in 1992, ten or twelve pounds would win a
tournament and seven or eight would get you a check. Now depending on the time of year it can take as much as sixteen or seventeen to win and twelve or thirteen to get a check. It is my prediction that you will see a twenty pound bag be brought in within the next two or three years” (Locatis, 2001).
“The largemouth bass population is sufficient to support tournaments nearly every
weekend from September through May. The overall average size of the Bass is about 2 lbs. But fish from 4.5 to 5.5 lbs. are not uncommon. The summer months also offer good to excellent Bass fishing, but air temperatures that can exceed 115 degrees during the afternoon are difficult for tournament fishing. Summer fishing is confined to the morning hours or to late evening. The population seems to be increasing, probably due to a compilation of causes including heavily practiced catch and release angling, an increase in aquatic vegetation, introduction of massive amounts of man-made habitat, abundant (although not ideally diverse) forage, and care of tournament caught fish” (Ocker, 2001).
Local Lake Havasu City bass tournament pro and owner of “Sweetwater Tackle,”
Dave Mitchell, said in a phone interview on May 23, 2001, that the bass fishing quality has increased tremendously in the last five or six years. In addition, Mitchell said that the increased quality was not just in largemouth bass but also in other game species such as red ear perch. He said that the only negative regarding the habitat enhancement was that it was hard to fish around the structures without getting hung up but that without the structures the numbers and quality of the fish would not be near as great as they are now. In addition, Mitchell said that there are “hundreds” of small fish around the habitat that provide a great food chain for the game fish and that the numbers were great all over the lake “where there were habitat structures.”
This adult sunfish, surrounded by fingerlings, is utilizing an artificial habitat for cover and enhanced forage base.

13
Survey Evidence: Section 3 will discuss the details of the survey of anglers taken in the spring of
2001. Several questions regarding the impact of the habitat program were asked to try to get a feel for how much knowledge anglers had regarding the project and their assessment of it.
Anglers were asked the following question: “In your opinion, has the fishing improved at Lake Havasu since 1996? Please rate it on a scale of 1 to 5 (1 being the least improved and 5 being the most improved).” There was also a box to check if the angler did not have an opinion. Table 1 illustrates angler opinion regarding improved fishing at Lake Havasu.
Table 1
Angler Opinion Regarding Improved Fishing Quality at Lake Havasu
(scale of 1 – 5) n = 406
Residents of Non-Resident Non-Resident All Surveys Lake Havasu Non-Tournament Tournament 4.11 3.93 4.30 4.09
No Opinion 18.5% 13.1% 19.2% 19.4% Source: Lake Havasu survey, spring 2001 These results indicate a high rating of the improvement of the quality of fishing since 1996. As might be expected, there was a higher percentage of non-residents who indicated “no opinion.” Residents simply were more familiar with the habitat program, fished the lake more and lived close to it. Thirteen percent of residents had no opinion whereas over 19% of non-resident tournament anglers had no opinion.
The author had a chance to collect surveys, especially on the piers among locals who fished a lot. It is his opinion that the slightly lower rating by residents may come from the fact that some of them would get tangled with the habitat structures when landing fish. Still, a 3.9 rating out of 5 is quite high.
Two additional questions were asked of anglers regarding their familiarity with the habitat program. “Are you familiar with the Lake Havasu habitat improvement program?” and “If yes, do you feel that artificial habitat has improved fishing since 1996?” The results from the survey are given in Table 2. Among those who were familiar with the program an astonishing 97% said that it had improved the fishing (all surveys).

14
Table 2
Angler Opinion Regarding Habitat Program Familiarity And Improved Fishery Since 1996
n = 406
Residents of Non-Resident NonResident All Surveys Lake Havasu Non-Tournament Tournament
Are You Familiar With Habitat Program? Yes: 84.2% 95.9% 88.0% 74.9% If Familiar, Has It Improved The Fishery? Yes: 97.0% 96.0% 95.0% 98.0% Source: Lake Havasu Survey, spring 2001 The differing results regarding familiarity with the program among the four groups are what might be expected. The most familiar are the residents of Lake Havasu City and those least familiar are the non-resident tournament anglers. However, among those who were familiar, a very high percentage across all categories agreed that the program had improved the fishery and among those who were the “pros” a staggering 98% believed that the program had improved fishing quality. Summary Section 2:
This section had as its focus the problem of determining “cause” and “effect.”
Evidence was given using “hard” numbers as well as data and opinions from the fishery biologist perspective. Angler experience was measured and statements from various angler groups were given. Both angler and biologist opinions indicate increased catch numbers and fish weights. Competitive fishing has increased both in numbers of tournaments and in numbers of participants during the period of habitat enhancement. The determination of cause and effect still remains speculative. The case for the habitat program being the “cause” will probably always remain “circumstantial.”

15
Section 3 - Angler Survey and Results – Spring 2001
Questionnaire Design:
The main purpose of this study was to measure the economic impact of angler
spending at Lake Havasu. Obviously, angler expenditures had to be measured and data collection by questionna ire was determined to be mandatory. A survey document was designed and tested several times and several alterations were made before the final instrument was chosen. The questionnaire was tested on members of the Lake Havasu Chapter of Anglers United, the volunteers at the Partner’s Point work site and among numerous other smaller groups. Several potential questions were either thrown out or altered to improve the ease of response as well as the accuracy of the data collected.
There was a desire to keep the questionnaire short and on one page because the
method of obtaining the data was by personal, one on one contact. The angler completed the questionnaire while the interviewer stood by to answer any questions. Thus, a one page, easy to fill out type of questionnaire was desirable. In addition, since this survey was aimed at all Lake Havasu anglers, this represented a good opportunity to ask for non-economic data on habitat use. Some demographic data was also collected.
A set of instructions was prepared for interviewers and training was given.
Interviewers consisted of members of Anglers United, the Bureau of Land Management, the Arizona Game and Fish Department and the California Department of Fish and Game. Interviews were completed on piers, on the lake, at tournament sites, on the shore and at tournament banquet events.
Sample Size and Angler Population - Some Limitations: Understanding the population of anglers at Lake Havasu was the single most
difficult task of this entire study. There is no “phone book” of anglers. Any frame suggested was immediately discarded due to the incompleteness of the data. Cost becomes a real enemy of accuracy. To give one an idea of the problems, there are two states involved in selling licenses (the boundary of California and Arizona runs down the middle of the lake). In Arizona, there are general fishing licenses, combination licenses, non-resident general fishing licenses, non-resident combination licenses, non-resident Colorado River stamps, non-resident five day licenses, non-resident four month licenses, resident and non-resident one day licenses, resident and non-resident urban licenses and resident and non-resident youth licenses. License numbers are confusing and one still does not know to whom they are sold. California has it own set of licenses sold. That does not count the Chemehuevi Native American tribe.
Lack of information about the angler population prior to the administration of the
survey limited our ability to select a random sample of anglers. Without any secondary data describing angler characteristics at Lake Havasu along with the lack of a good frame from which a random sample could be economically taken led us to use a representative or judgement sample. Judgement sampling is based on the best judgement of those involved and is non-probabilistic in nature. This means that probabilistic based statements on sampling error cannot be made. Based on the judgement of those involved in the sample design, a sample size of 400 was selected. We collected 422 questionnaires and discarded 16 that were deemed unusable for a variety of reasons.

16
Timing: This project started in March 2001 and was to be completed at the end of
September 2001. During this seven-month period the quality of the fishery and the numbers of fishermen varied greatly. Angler’s fish when the fish are biting and when the weather won’t cause them harm. Lake Havasu is a desert community with an elevation of about 500 feet above sea level. Temperatures early in the year are in the pleasant 70’s and 80’s. By the end of June there have been many days well over 100 degrees. It is not uncommon to have daytime temperatures above 110 degrees many days in a row.
Because of weather patterns, the fishing season tends to be concentrated in the
late winter and spring months. There is fishing year around but at reduced numbers. This study aimed at the angler population that would include the most tournament and non-tournament anglers. The first questionnaire was administered March 30th and the last in late May 2001.
Location: Questionnaires were administered at various points both around the lake and on
the lake. Random distribution was desired as to the location of survey anglers. Tournament surveys were the most numerous. Chart 6 illustrates these data. The interviewers attempted to interview anglers on fishing piers located at five different points on the lake, at launch sites, on the shore, on the lake as casual fishermen as well as at tournament launches and weigh- ins. Some interviews were also completed at retail stores and over the phone with snowbirds that had already gone home.
Chart 6 Location of Surveys
Tournament51%
Retail Stores2%
On the Lake17%
Shore5%
Other7%
Fishing Piers14%
Boat Launches
5%

17
Residence of Angler: Interviewers were not instructed to select anglers from any particular city or
background. Again, interviewers were instructed to select anglers as much as possible on a random basis. The resulting residential profile is presented in Chart 7. A surprising 50% are residents of California. Lake Havasu City residents were the second largest group. Anglers living elsewhere in Arizona made up some 17% of the anglers while Nevada provided about 6%. However, since the survey did not begin until the end of March, we admittedly under-sampled this customer base. Snowbirds, those migrating retired folks from Canada and the northern tier of states in the U.S., amounted to the same percentage as Nevada residents (6%).
California residents were the largest category of anglers among tournament
fishermen, general boaters, and other anglers on the water. In contrast, the residence of those fishing on the piers was quite the opposite. Chart 8 illustrates that, as might be expected, pier fishermen are residents of Lake Havasu City or are residents of other parts of Arizona. Californians make up a small percent of pier users. Snowbirds are the third largest group.
Chart 7 Residence of Anglers
California40.4%
Other Arizona17.2%
Nevada5.7%
Lake Havasu City
30.0%
Snowbird5.7%
Other1.5%

18
Angler Spending Data: In order to assess the economic impact of anglers on an area, one must determine
what those expenditures are and how much is spent on them. This determination seemed fairly straightforward. However, angler spending is made up of not just current spending but also has a component of capital spending. Boaters spend heavily on things like motors, boats, rods and reels whose economic lives are spread over a much longer period of time. These are all necessary parts of the total spending package of anglers. These items are included in this report but are not used to estimate the economic impact of angler spending on the economy because most of the non-resident spending on these items would be done outside of Mohave County.
Current Expenditures: Guidance in selecting the categories of expenditures was received by examining
the 1996 National Survey of Fishing, Hunting and Wildlife-Associated Recreation report (U.S. Fish and Wildlife Service, 1996). Categories of expenditures chosen for this study were paralleled after some of those in the 1996 National Study. The following categories of expenditures were chosen:
1. Spending on Lodging 2. Spending on Food 3. Spending on Guides 4. Spending on Terminal Tackle 5. Spending on Fuel 6. Spending on Launches 7. Spending on Rentals These types of expenditures represent flows of money spent on a daily basis for
current goods and services.
Chart 8 Pier Fishermen Residence
Snowbird8.9%
Other Arizona12.5%
California1.8%
Lake Havasu Residents
71.4%
Other.1%
Nevada5.4%

19
Yearly Expenditures:
The above expenditures are daily expenditures. The expenditures listed in this next section are ones that are for items whose lives are for several years. There are a number of annual expenditures as well. Anglers must buy annual licenses for instance. Perhaps the largest expenditure is for boat storage and maintenance, as well as for boat and motor repairs. A question was asked on the questionnaire about the amount of money the angler spent per year on the following:
1. Spending on Storage and Maintenance Per Year
Capital Expenditures:
Anglers spend large amounts of money on boats and motors. Specialized bass boats are designed just for bass fishing and have high-powered motors that will allow the bass fisherman to move around the lake quickly. A bass tournament is usually won based on the greatest weight of five fish caught in a fixed period of time. Prizes are significant and money can be won or lost by the weight of one fish. The same can be said for rods and reels. Specialized equipment is expensive. Even the average angler is affected because much of the more moderate cost equipment is patterned after the expensive gear used by the pros.
Boats, motors, reels and rods have a functional life longer than just the length of the current fishing trip. Because of this long life and the fact that some of that life was being used at Lake Havasu, an attempt to measure the amounts spent on the following capital items was undertaken:
1. Spending on Rods and Reels in the Last 5 Years 2. Spending on Boats and Motors in the Last 5 Years
Spending Aggregation Goal: Spending Categories:
Economic impacts are usually measured on a per year basis. So much value added or employee compensation is created per year. The questionnaire was designed to measure spending by anglers per day for the trip they were enjoying right now. Recall of data is an illusive thing and the more immediate it is the more likely one is to collect accurate real data. The exceptions to this rule were the yearly maintenance estimates and the amounts spent on capital goods.
As per day expenditures were aggregated using the average trip length in days
which was also collected by the questionnaire. The angler was also asked how many trips per year he or she took to Lake Havasu. Thus, the per day data could be multiplied by the per trip data and that amount multiplied by the number of trips taken to Lake Havasu per year to arrive at an annual spending amount for each daily category.
Spending on maintenance and repair was an annual figure to begin with.
However, if one does not fish solely at Lake Havasu, not all of the spending can be allocated to Lake Havasu use. To solve this problem, anglers were asked how many days per year they fished. Knowing from the questionnaire how many days they also fished Lake Havasu a percentage was derived which gave an estimate of the percentage of time per year the angler used his gear at Lake Havasu.

20
Capital expenditures were also allocated to Lake Havasu use on the same basis. However, capital goods have a functional life of more than one year. It was assumed for purposes of this study that these expenditures had a life of five years. Thus, the amounts given on the questionnaire indicating expenditures on these goods in the last five years was divided by five to arrive at an annual figure. This figure was, in turn, adjusted by the percentage of Lake Havasu use percentage in the same way that annual maintenance spending was allocated.
Numbers of Anglers:
Once annual data on spending were derived the task then became one of estimating the annual number of resident and non-resident anglers at Lake Havasu. License data were examined; estimates of user days-spent fishing at Lake Havasu by both residents and non-residents were developed by the Arizona Game and Fish Department (Pringle, 2001).. The Arizona Game and Fish Department estimated that in 1999 (the most current year with complete data) 23.91% of the anglers at Lake Havasu were residents of Lake Havasu City. This estimate was based on the mailing addresses of respondents to the Arizona Game and Fish Department annual statewide angler survey. That meant that 76% were non-residents. The spending of this 76% created the economic impact on Lake Havasu.
The Arizona Game and Fish Department also estimated that there were
approximately 179,114 user days of angling at Lake Havasu in 1999 (Pringle, 2001). This estimate was made based on the total license sales of all categories of licenses. Using the data collected from the questionnaire on numbers of days fished per trip, number of trips per year and number of days fished at Lake Havasu, this study’s estimate of user days was 175,455. This figure is incredibly close to the Arizona Game and Fish figure, considering the different starting points of each estimate.
Total anglers fishing Lake Havasu was estimated by using 1999 license data for
the Colorado River. The total number of licensed anglers in 1999 was 54,597. It was estimated that 34.46% were Lake Havasu anglers. Thus, the number of anglers fishing Lake Havasu was estimated to be 18,800. Of those, some 14,300 were non-residents of Lake Havasu City.
Strict instructions were given to both interviewers and to anglers to ensure that the
spending figures they gave were to be just for them and no one else in their party. Instructions also indicated that the estimates given were to be on a per day basis. However, past studies of respondent estimates have shown that the average person’s response may be wide of the mark. In addition, spending on younger members of the family and wives and/or husbands tends to get mixed into the estimate given by the interviewee. Young members of families required to purchase fishing licenses show up in figures for total licenses sold. However, it is unlikely that they too spend money at the same rate as their adult family members.
As careful as one can be in administering these questionnaires, survey data
collected are based on the recall of the angler and can be off as much as 50% depending on the nature of the experience being measured and the amount of time between the actual expenditure and the interview. To be conservative it was assumed that 80% of anglers actually spent money at Lake Havasu.

21
Tournament anglers were estimated to number about 3,000. About 85% of the tournament anglers were non-residents which meant that about 2,500 were non-residents of Lake Havasu City. The final numbers of anglers who spent money at Lake Havasu are given below.
1. Effective number of non-resident anglers 11,453
a. Number of non-resident tournament anglers 2,547 b. Number of non-resident, non-tournament anglers 8,906
2. Effective Number of resident anglers 3,599 Total Anglers 15,051
Questionnaire Results:
After much deliberation it was decided that four separate groups of anglers should be examined. Much could be learned from a comparison of these groups. The four groups were the following.
1. All Anglers 2. Non-Resident, Non-Tournament Anglers 3. Non-Resident, Tournament Anglers 4. Lake Havasu City Resident Anglers Categories 2 and 3 are the most important in terms of net economic impact since
these are the “tourists anglers” who are “buying the exports” from the Lake Havasu area. These are the anglers who make a net additional contribution by coming to Lake Havasu and spending their money in the area.
Measurements of Angling Intensity:
Data were collected on days of fishing in order to get a clearer picture of how intensely different groups fished. In addition, data on angling intensity were necessary in order to allocate annual maintenance and repair and capital spending to Lake Havasu use. Lake Havasu anglers are serious fishermen. Lake Havasu City resident license holders spent an average of over 110 days per year fishing.
22
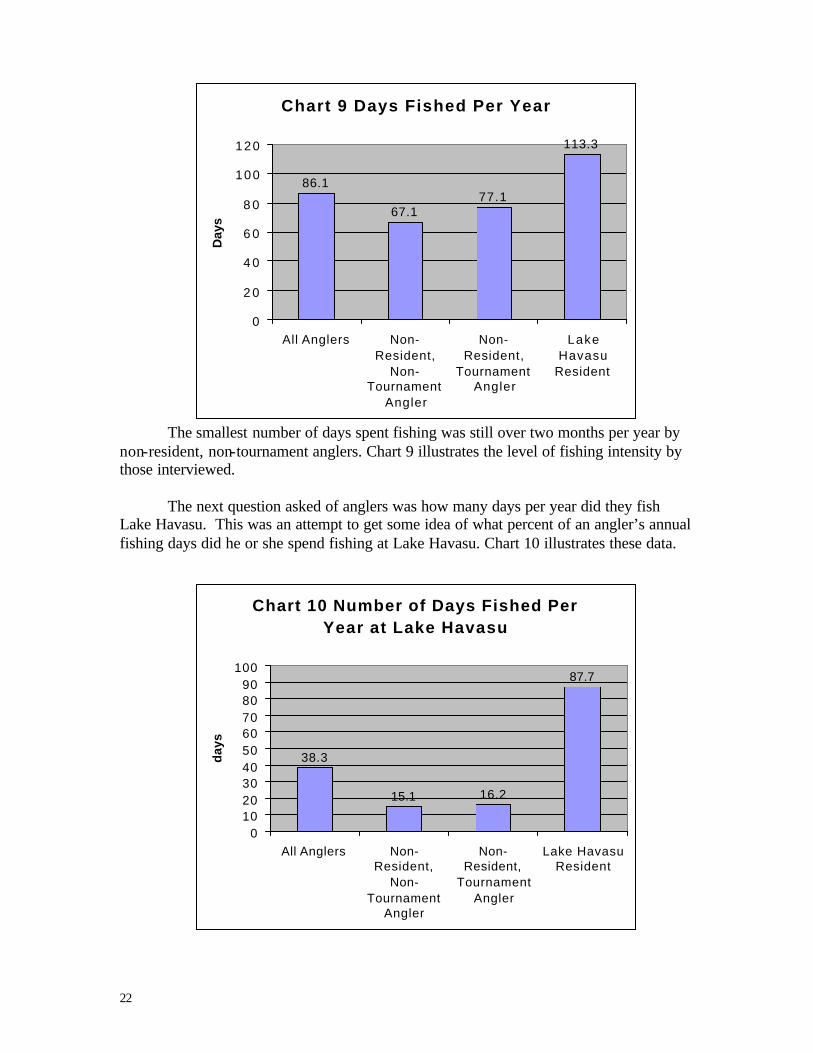
The smallest number of days spent fishing was still over two months per year by non-resident, non-tournament anglers. Chart 9 illustrates the level of fishing intensity by those interviewed.
The next question asked of anglers was how many days per year did they fish
Lake Havasu. This was an attempt to get some idea of what percent of an angler’s annual fishing days did he or she spend fishing at Lake Havasu. Chart 10 illustrates these data.
Chart 9 Days Fished Per Year
86.1
67.177.1
113.3
0
2 0
4 0
6 0
8 0
100
120
All Anglers Non-Resident,
Non-Tournament
Angler
Non-Resident,
TournamentAngler
LakeHavasu
Resident
Day
s
Chart 10 Number of Days Fished Per Year at Lake Havasu
38.3
15.1 16.2
87.7
0102030405060708090
100
All Anglers Non-Resident,
Non-Tournament
Angler
Non-Resident,
TournamentAngler
Lake HavasuResident
day
s
23
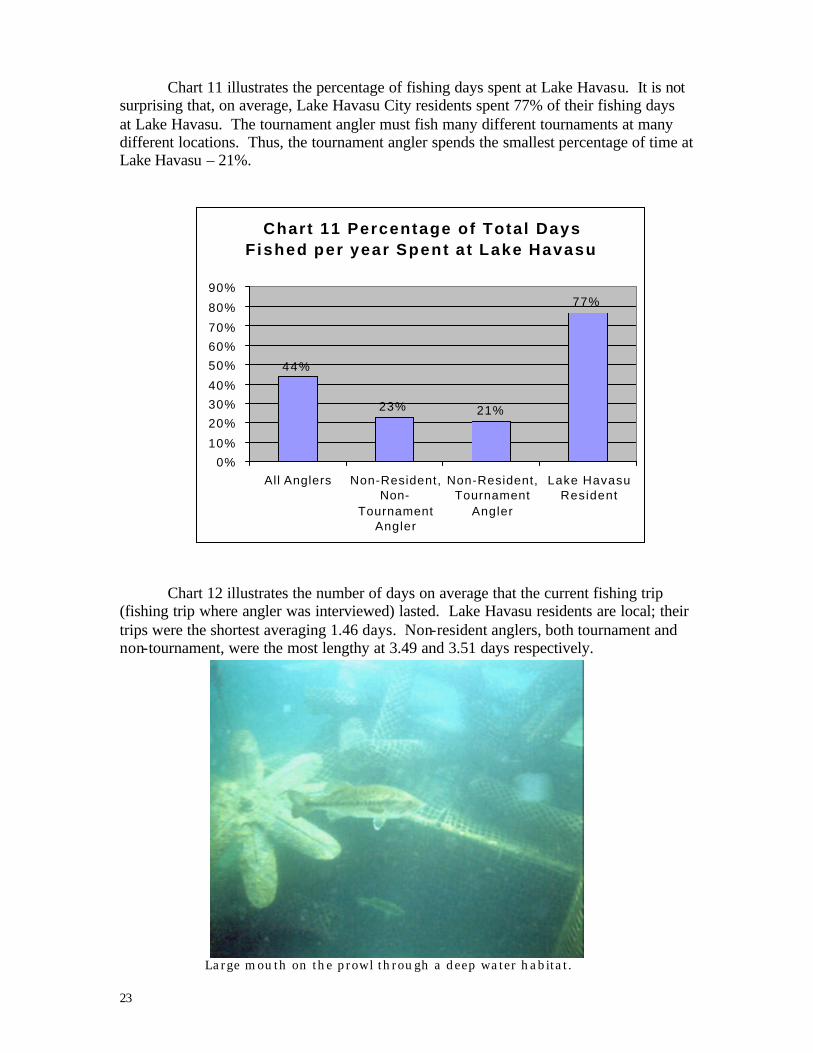
Chart 11 illustrates the percentage of fishing days spent at Lake Havasu. It is not
surprising that, on average, Lake Havasu City residents spent 77% of their fishing days at Lake Havasu. The tournament angler must fish many different tournaments at many different locations. Thus, the tournament angler spends the smallest percentage of time at Lake Havasu – 21%.
Chart 12 illustrates the number of days on average that the current fishing trip
(fishing trip where angler was interviewed) lasted. Lake Havasu residents are local; their trips were the shortest averaging 1.46 days. Non-resident anglers, both tournament and non-tournament, were the most lengthy at 3.49 and 3.51 days respectively.
Large mouth on the prowl through a deep water habitat.
Chart 11 Percentage of Total Days F ished per year Spent a t Lake Havasu
44%
23% 21%
77%
0%
10%
20%
30%
40%
50%
60%
70%
80%
90%
All Anglers Non-Resident,Non-
TournamentAngler
Non-Resident,Tournament
Angler
Lake HavasuResident

24
Spending by Anglers: As mentioned previously, a total of 422 questionnaires were completed. Sixteen
were discarded. Even after a close screening of each questionnaire, extreme variations existed within some data groups. The population of anglers at Lake Havasu, for a variety of reasons, gave extreme answers to some questions. Variability can be measured by a variety of statistics. The standard deviation along with the variance is usually an excellent measure of variability. Standard deviations were extreme (larger than the means) in three categories of expenditure; guide services, launch fees and rentals.
Guide services are available in the Lake Havasu area. In fact, one guide is quoted
in an earlier part of this study. However, for some reason anglers gave such a variety of answers on this question that us ing an average figure to represent the population in this category made no sense. The same was true for rental and launch expenditures. Rental data varied a great deal partially because of the fact that rental boats vary so much in cost. One can rent a houseboat or a rowboat. Launch fees were confusing to some anglers because most of the launches were done at Windsor Beach State Park. The Park charges an entry fee that includes a launch. Some did not know whether the fee was for launch or entry. Because of the variability of answers on these three items, they were omitted from the analysis.
Chart 12 Length of Current Tr ip to L a k e H a v a s u
2.82
3.51 3.49
1.46
0
0.5
1
1.5
2
2.5
3
3.5
4
All Anglers Non-Resident,
Non-Tournament
Ang le r
Non-Resident ,
TournamentAngler
Lake HavasuResident
days

25
Depending On Daily Items: Daily expenditure categories measured were lodging, food, tackle and fuel. Chart
13 gives data on average lodging expenditures by angler group. As might be expected, Lake Havasu City resident’s average lodging expenditure was the least at $13.52 while non-resident tournament anglers was the largest at $66.86.
Expenditures on food are illustrated in Chart 14. Again, Lake Havasu Residents
spend the least at $29.14 and non-resident tournament anglers spend the largest amount at $48.77.
Chart 13 Expenditures per day On Lodging
$47.44$55.84
$66.86
$13.52
$ -
$10
$20
$30
$40
$50
$60
$70
$80
All Anglers Non-Resident,
Non-Tournament
Angler
Non-Resident,
TournamentAngler
Lake HavasuResident
Char t 14 Expendi tures Per Day On F o o d
$39.90 $39.58
$48.77
$29.14
$-
$10
$20
$30
$40
$50
$60
Al l Anglers Non-Resident ,Non-
TournamentAngler
Non-Resident ,Tournament
Angler
Lake HavasuResident

26
Spending on terminal tackle is presented in Chart 15. The professional tournament angler spent the largest amount at $50.66.
Fuel expenditures included spending for auto fuel as well as for boat fuel.
Tournament fishermen again spent the most at $87.34. These data are presented in Chart 16.
C h a r t 1 5 E x p e n d i t u r e s P e r D a y O n T e r m i n a l T a c k l e
$ 4 2 . 2 7
$ 3 5 . 2 4
$ 5 0 . 6 6
$ 3 6 . 3 9
$ -
$ 1 0
$ 2 0
$ 3 0
$ 4 0
$ 5 0
$ 6 0
A l l Ang le rs N o n -Res ident ,
N o n -T o u r n a m e n t
Ang le r
N o n -Res iden t ,
T o u r n a m e n tAng le r
L a k e H a v a s uR e s i d e n t
Chart 16 Expenditures Per Day On Fuel
$72.01$76.08
$87.34
$46.86
$0$10$20$30$40$50$60$70$80$90
$100
All Anglers Non-Resident,
Non-Tournament
Angler
Non-Resident,
TournamentAngler
Lake HavasuResident

27
Capital Expenditures: Anglers were asked to estimate their expenditures on rods and reels and boats and
motors for the last five years. The assumption was made that these items had a useful life of five years and that some of this cost could be allocated to Lake Havasu use based on the angler’s percentage of annual fishing days spent fishing at Lake Havasu.
Angler equipment is not inexpensive. Spending on rods and reels is given in Chart 17. As might be expected, the tournament angler spends more than the other categories of anglers spending $657.71 over five years. The Lake Havasu resident spends the least at $421.49.
Chart 17 Expenditures On Rod & Reels Last Five Years
$565.93$593.98
$657.71
$421.49
$-
$100
$200
$300
$400
$500
$600
$700
All Anglers Non-Resident,Non-
TournamentAngler
Non-Resident,Tournament
Angler
Lake HavasuResident

28
Spending on boats and motors is also substantial. Non-resident, non-tournament anglers spend the most at $19,458 while Lake Havasu residents spend the least at $10,246. Chart 18 gives these data.
Annual Spending On Storage and Repairs: Expenditures for boat storage and repairs or maintenance were also measured.
Chart 19 gives data for these items. This category varies from a low of $234.34 per year for non-resident, non-tournament anglers to a high of $352.57 for non-resident, tournament anglers.
Storage and repair costs were not included in the economic impact section for two
reasons. First, it seemed likely that storage and repairs would take place in the angler’s hometown. Second, the impacts measured were from non-resident anglers and thus their spending on these items would impact their hometowns, not the Lake Havasu area.
Chart 18 Expenditures On Boats & Motors In Last Five Years
$15,949
$19,458$18,314
$10,246
$-
$5,000
$10,000
$15,000
$20,000
$25,000
All Anglers Non-Resident,Non-
TournamentAngler
Non-Resident,Tournament
Angler
Lake HavasuResident

29
Allocation of Capital Items to Lake Havasu Use: Chart 20 illustrates the allocation of capital items (boats, motors, rods and reels)
to Lake Havasu use. These data reflect the fact that Lake Havasu residents spend most of their fishing days at Lake Havasu, and thus more dollars of a given capital item are allocated to that lake. Tournament anglers travel to many sites, using their equipment at other lakes across the country.
Capital expenditures were not included in the economic impact section of this
study. There are boat dealers in Lake Havasu City but, since the focus was on the spending of non-residents, it was felt that the primary suppliers of these capital goods were located outside of the area. The enhanced fishery at Lake Havasu may have increased the interest of the angler to the point where he might spend more money on capital items. However, if he did spend the money, the non-resident angler was more likely to spend it outside of the Lake Havasu area.
Chart 19 Expenditures In The Last Year On Storage And Maintenance
$281.40
$234.34
$352.57
$229.51
$-
$50
$100
$150
$200
$250
$300
$350
$400
All Anglers Non-Resident,Non-
TournamentAngler
Non-Resident,Tournament
Angler
Lake HavasuResident

30
Yearling large mouth bass holding on an artificial reef habitat.
Chart 20 Expenditures for Rods & Reels and Boats & Motors Allocated To Lake Havasu Use
$1,467.32
$901.43$799.05
$1,650.92
$-
$200
$400
$600
$800
$1,000
$1,200
$1,400
$1,600
$1,800
All Anglers Non-Resident,Non-Tournament
Angler
Non-Resident,Tournament
Angler
Lake HavasuResident

31
Section 4 - Economic Impact
Economic Impact Model:
The primary purpose of this study is to measure the economic impact of angler spending on
the Lake Havasu area. Once one has gathered spending data the task must focus on how to measure the spending flows through the economy.
Each business is dependent on other businesses for its supply of materials,
inventory and raw materials. Each business is also dependent on a labor market for workers. Each business is dependent on other businesses that supply services such as accounting and consultant help. Each business is dependent on businesses that provide power, water and the basic necessities. Each business is dependent on levels of government that provide public goods and services.
When new spending occurs (called “new final demand”) the money flows from the spender to the business providing the good or service (called the “direct effect”). The business then must acquire products and services they need due to the new final demand. The impact of this new final demand on secondary and tertiary businesses is called the “indirect effect.” Employees who now receive new or additional income from providing their services to the creation of the new final demand also spend this income on additional goods and services. This impact is called the “induced effect.” Added together these three effects create the “total effect.” The model that allows the researcher to measure the impact of all these flows is called an input/output model. There are two popular I/O models in use today. One is the Regional Input-Output modeling system (RIMS II) which was produced by the U. S. Bureau of Economic Analysis. The other is the IMPLAN Professional model created by the Minnesota IMPLAN Group, Inc. (MIG). The IMPLAN Professional model was used in this study. There are many, many different impacts that could be measured using the I/O approach. Economists have focused on the following:
1. Total value added created by the new final demand a. Labor income 1). Employee compensation 2). Proprietors income b. Other Property income c. Indirect business taxes (sales taxes)
2. Numbers of employees created by the new final demand 3. Total value of the output created by the new final demand 4. Total taxes (federal, state and local) created by the new final demand

32
Anglers try their luck at the Mesquite Bay fishing pier at sunset.
Assumptions of Linearity: As mentioned above, this study uses the IMPLAN Professional program version
2.0, 2nd edition, June 2000. IMPLAN was developed by MIG (Minnesota IMPLAN Group, Inc.) and is modeled after the “Input-Output Study of the U.S. Economy” done by the U.S. Bureau of Economic Analysis in 1980. An I/O model is essentially a huge matrix of coefficients that reflect each economic component’s relationship to every other economic component.
These coefficients remain constant as greater numbers of anglers are included or
fewer numbers of anglers are analyzed. In other words, if one had evidence that the number of, say, tournament anglers was twice that arrived at in this study, then the economic impacts would be twice as large as those given here. Or, if one had evidence that the number of anglers was 25% too large, one could reduce the economic impact figures by 25% to arrive at what would be in their opinion, a more realistic figure.
Relative Economic Data on the Lake Havasu Area:
Before one can really understand the numbers generated by an I/O model, one must have some idea of the nature and size of the area in question. Lake Havasu City is a major city on the Colorado River. The cities of Yuma to the south and Bullhead City to the north are the only other cities on the Colorado River. Bullhead City and Lake Havasu City are both in Mohave County. The city of Kingman is the county seat. The IMPLAN model provides data on areas as small as counties. Therefore, Mohave County data was used as the basis for measuring the economic impact of non-resident angler spending. Jobs added, output created, etc. must be compared with total jobs, output, etc. of Mohave County. Table 3 gives these data.

33
Table 3
Mohave County Economic Data, 1998
Population: 136,989 Employment 49,973 Income per Household $46,898 Earnings per job $22,374 Number of Industries 173 Growth in Population approximately a five fold increase since 1970 Growth in Jobs from 1970 to 1998, 39,976 jobs were added Jobs in the Service and Professional area approximately 34,000 Job Growth over a five fold increase in jobs since 1970 Total Personal Income $2,487,000,000 ($2.4 billion plus) Fastest Growing segment Age related income (retirement, disability and Of Total Income Medicare)
Source: Population, Employment, Earnings and Personal Income Trends, Mohave County, Sonoran Institute, Bozeman, Montana, Sept. 21, 2001. &
IMPLAN data, 1998. Non-Resident Economic Impacts :
As was mentioned earlier in this report, net economic impacts are due to the “exporting” of “tourism” to non-residents who travel to the Lake Havasu area. In this case the tourists are anglers coming to either fish in tournaments or to enjoy a fishing vacation at Lake Havasu. The new final demand is the spending these tourists do on lodging, food, fuel and tackle.

34
Using the data collected from the survey, totals were aggregated for the new final demand on an annual basis for non-resident, non-tournament anglers and non-resident tournament anglers. Table 4 gives these data.
Table 4
New Final Demand Annual Rates of Spending
(8,907 Anglers) (2,547 Anglers) Non-Resident Non-Resident Non-Tournament Tournament Expenditures for Lodging $ 7,490,345 $ 2,763,846 Expenditures for Food $ 5,309,238 $ 2,016,045 Expenditures for Fuel $ 10,205,327 $ 3,610,444 Expenditures for Terminal Tackle $ 4,727,073 $ 2,094,173 Totals: $ 27,731,984 $ 10,484,509
The data illustrated in Table 4 were then analyzed using the IMPLAN I/O model. The results of this analysis are given in the following tables.
The Fisheries Program has provided enhanced opportunities for family recreation.
35
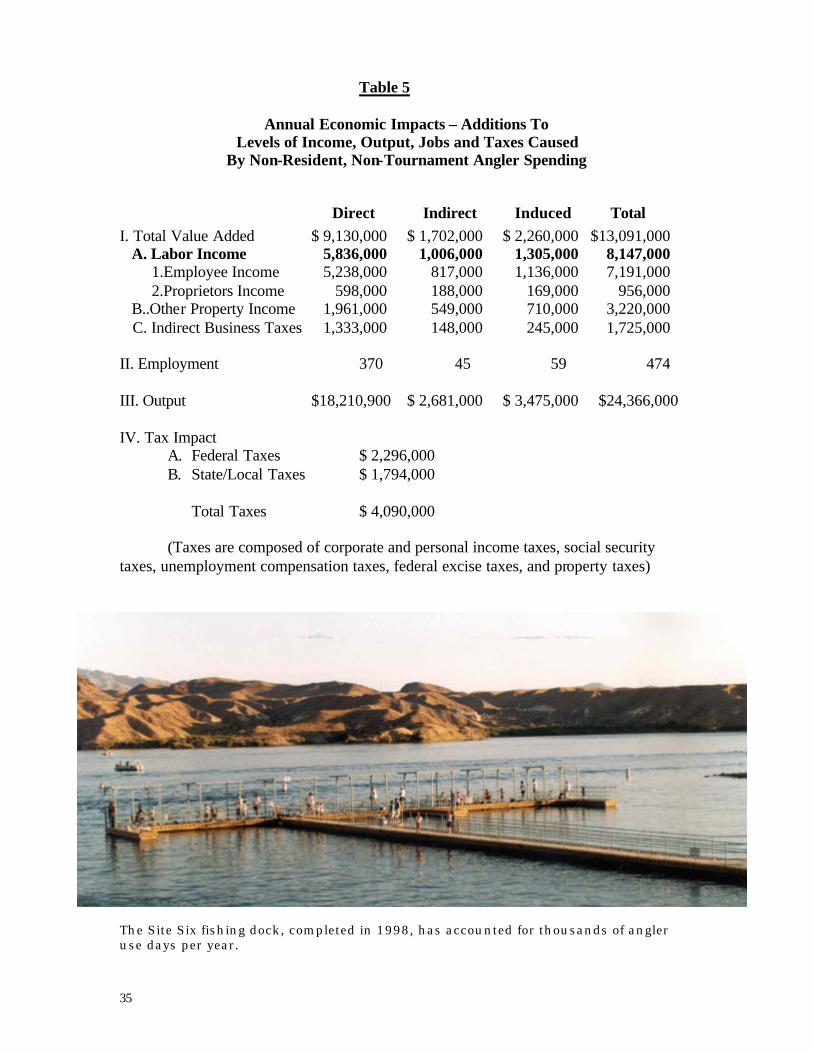
Table 5
Annual Economic Impacts – Additions To
Levels of Income, Output, Jobs and Taxes Caused By Non-Resident, Non-Tournament Angler Spending
Direct Indirect Induced Total I. Total Value Added $ 9,130,000 $ 1,702,000 $ 2,260,000 $13,091,000 A. Labor Income 5,836,000 1,006,000 1,305,000 8,147,000 1.Employee Income 5,238,000 817,000 1,136,000 7,191,000 2.Proprietors Income 598,000 188,000 169,000 956,000 B..Other Property Income 1,961,000 549,000 710,000 3,220,000 C. Indirect Business Taxes 1,333,000 148,000 245,000 1,725,000 II. Employment 370 45 59 474 III. Output $18,210,900 $ 2,681,000 $ 3,475,000 $24,366,000 IV. Tax Impact
A. Federal Taxes $ 2,296,000 B. State/Local Taxes $ 1,794,000
Total Taxes $ 4,090,000
(Taxes are composed of corporate and personal income taxes, social security
taxes, unemployment compensation taxes, federal excise taxes, and property taxes)
The Site Six fishing dock, completed in 1998, has accounted for thousands of angler use days per year.

36
Table 6
Annual Economic Impacts – Additions To
Levels of Income, Output, Jobs and Taxes Caused By Non-Resident, Tournament Angler Spending
Direct Indirect Induced Total I. Total Value Added $ 3,493,000 $ 646,000 $ 863,000 $ 5,001,000 A. Labor Income 2,231,000 381,000 498,000 3,110,000 1.Employee Income 2,004,000 310,000 434,000 2,748,000 2.Proprietors Income 227,000 71,000 64,000 363,000 B..Other Property Income 749,000 208,000 271,000 1,228,000 C. Indirect Business Taxes 514,000 56,000 93,000 663,000 II. Employment 141 17 23 181 III. Output $ 7,077,000 $ 1,018,000 $ 1,327,000 $ 9,421,000 IV. Tax Impact
C. Federal Taxes $ 876,969 D. State/Local Taxes $ 689,070
Total Taxes $ 1,566,039
(Taxes are composed of corporate and personal income taxes, social security taxes, unemployment compensation taxes, federal excise taxes, and property taxes)
Volunteers on a Fisheries Program barge prepare to install an artificial habitat on the bottom of the lake.
37
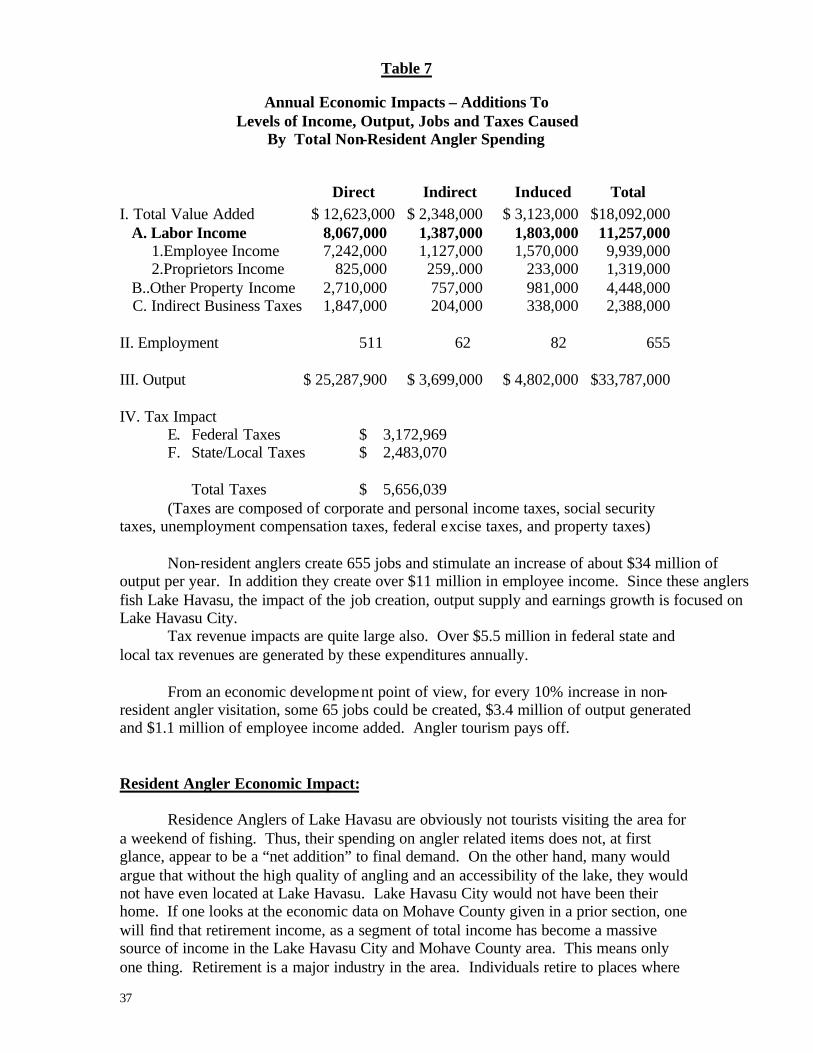
Table 7
Annual Economic Impacts – Additions To Levels of Income, Output, Jobs and Taxes Caused
By Total Non-Resident Angler Spending
Direct Indirect Induced Total I. Total Value Added $ 12,623,000 $ 2,348,000 $ 3,123,000 $18,092,000 A. Labor Income 8,067,000 1,387,000 1,803,000 11,257,000 1.Employee Income 7,242,000 1,127,000 1,570,000 9,939,000 2.Proprietors Income 825,000 259,.000 233,000 1,319,000 B..Other Property Income 2,710,000 757,000 981,000 4,448,000 C. Indirect Business Taxes 1,847,000 204,000 338,000 2,388,000 II. Employment 511 62 82 655 III. Output $ 25,287,900 $ 3,699,000 $ 4,802,000 $33,787,000 IV. Tax Impact
E. Federal Taxes $ 3,172,969 F. State/Local Taxes $ 2,483,070
Total Taxes $ 5,656,039
(Taxes are composed of corporate and personal income taxes, social security taxes, unemployment compensation taxes, federal excise taxes, and property taxes)
Non-resident anglers create 655 jobs and stimulate an increase of about $34 million of
output per year. In addition they create over $11 million in employee income. Since these anglers fish Lake Havasu, the impact of the job creation, output supply and earnings growth is focused on Lake Havasu City.
Tax revenue impacts are quite large also. Over $5.5 million in federal state and local tax revenues are generated by these expenditures annually.
From an economic development point of view, for every 10% increase in non-resident angler visitation, some 65 jobs could be created, $3.4 million of output generated and $1.1 million of employee income added. Angler tourism pays off. Resident Angler Economic Impact:
Residence Anglers of Lake Havasu are obviously not tourists visiting the area for
a weekend of fishing. Thus, their spending on angler related items does not, at first glance, appear to be a “net addition” to final demand. On the other hand, many would argue that without the high quality of angling and an accessibility of the lake, they would not have even located at Lake Havasu. Lake Havasu City would not have been their home. If one looks at the economic data on Mohave County given in a prior section, one will find that retirement income, as a segment of total income has become a massive source of income in the Lake Havasu City and Mohave County area. This means only one thing. Retirement is a major industry in the area. Individuals retire to places where

38
they can carry out their leisure time activities. One of the most important of these is fishing. The higher the quality of angling, the better the place to retire.
The habitat enhancement program has made Lake Havasu a great fishing lake.
Retirees come not only for the warmth (there are many, many areas that provide warmth) and the golf (there are many, many areas that provide golf). They come to fish and spend quality time on the lake. Lake Havasu City has become a mecca for retirees who want to live where the fishing is good.
Table 8 gives the influence of Lake Havasu City resident anglers spending on the
economics of the area. This influence is as great as the non-resident, non-tournament and non-resident tournament anglers combined.
Due to the success of the Fisheries Program, fishing from the docks is a popular and productive pass-time for Havasu residents.
Table 8
Annual Economic Influence –Amounts of
Income, Output, Jobs and Taxes Supported By Resident Angler Spending
Direct Indirect Induced Total I. Total Value Added $ 12,578,000 $ 2,055,000 $ 3,058,000 $17,691,000 A. Labor Income 8,062,000 1,202,000 1,766000 11,030,000 1.Employee Income 7,367,000 978,000 1,538,000 9,882,000 2.Proprietors Income 695,000 224,.000 228,000 1,147,000 B..Other Property Income 2,523,000 663,000 961,000 4,147,000 C. Indirect Business Taxes 1,993,000 190,000 331,000 2,514,000 II. Employment 507 53 80 639 III. Output $ 26,485,900 $ 3,292,000 $ 4,702,000 $34,479,000 IV. Tax Impact
G. Federal Taxes $ 3,120,000 H. State/Local Taxes $ 2,587,000 Total Taxes $ 5,707,000

39
Section 5 - Social Aspects of the Project
America’s Passion for Fishing: Fishing has always been one of the leisure time activities that Americans have enjoyed. Many fishing trips involve the whole family, where personal values are taught and relationships developed. And, there is the chance one might bring home a fish filet for dinner! The numbers are staggering.
“In 1996, 35.2 million U.S. residents 16 years old and older enjoyed a variety of fishing opportunities throughout the United States. Anglers fished 626 million days and took 507 million fishing trips. They spent almost $38 billion on fishing-related expenses during the year. Among the 29.7 million freshwater anglers, including those who fished in the Great Lakes, 515 million days were spent and 420 million trips were taken freshwater fishing. Freshwater anglers spent $24.5 billion on freshwater fishing trips and equipment” (U.S. Fish and Wildlife Service, 1996).
Fishing at Lake Havasu, as we now know from the numbers collected for this study, has become a big industry in the Lake Havasu area. Motel owners, restaurants, gas stations, fishing supply outlets, all have profited greatly by this industry. However, before the habitat project began, there was a major impediment to anglers and that was access to the shoreline of Lake Havasu. As mentioned previously, the western shoreline was owned primarily by the State of Arizona and blocked from access in many places by steel cable. Most other areas were blocked by rugged terrain. The only real way of accessing the lake was by boat. One had to put their boat on the lake (if they could afford a boat) and then access the shoreline by use of the boat. The Lake Havasu Fisheries Improvement Program had as one of its major goals the development of easily accessed shore sites. As seen in following sections, these goals are quickly moving toward fulfillment. Fishing piers are now in place and their popularity for a variety of uses is growing fast. Access Problems: Current Ownership and Control: Most of the shore of Lake Havasu is owned and controlled by several different public and tribal entities. The State of Arizona owns considerable shoreline on the East Side of the lake. Arizona State management policies have focused on purely economic objectives. The State’s current policy is to maximize the money coming from these lands. Currently, ten-year planning leases are made by the state to private developers with high priced real estate (both commercial and residential) objectives. These shore line developments would be exclusive and would limit any access by the public. The ten-year planning leases effectively bar public access and much of the accessible shoreline is cabled off. Prior to the development of what is called Site Six on the West End of the island and prior to the development of Windsor Beach State Recreation Area on the Arizona side, there were very few launch sites for anglers near Lake Havasu City.

40
The California side of the lake is even less developed. Much of the shoreline is within the Chemehuevi Native American tribe reservation and is only accessible by car over a narrow, out of the way, highway in California. There is very little development on the West Side primarily because of ownership and accessibility. One of the main goals of the Lake Havasu Fisheries Improvement Project was to drastically increase public access to the lake. The goal was to increase access both for anglers desiring to fish from the shore and also to enhance the development of launch facilities as much as possible. To accomplish this goal, the project has constructed permanent large piers from which people can fish and sightsee. These piers are covered so that shade is provided. The piers are large with benches and railings and have electricity for lighting. Fishing is probably the most popular use of the piers but many families use them for picnics and family enjoyment. Hiking trails leading to the piers have been constructed with interpretive walks, benches and exhibits adjacent to the locations. Large parking areas have been constructed and rest room facilities have been provided. Some of the piers are located adjacent to major paved roads and near housing and commercial areas. Site Six (a name that is historical, rather than descriptive of its location) is the most popular. It is located in a residential area with concrete parking and is connected to a major thoroughfare. Site six consists of a “T” shaped pier made of sturdy aluminum. It is equipped with a roof, benches, lights and even rod holders. There are always fishermen using this pier. It is also a favorite for tourists who come to just watch the passing parade of boats. A seaplane dock is near by. Boat docks are also close by and a favorite launching ramp is adjacent to the pier. Two of the piers, Mesquite #1 and Mesquite #2, are located to the north of Lake Havasu City in a primitive, swampy area. These piers are useful not only for fishing but also for birding and other activities. The water draws many different species of birds including ducks, doves, quail and several species of songbirds too numerous to list. The area also supports beaver, rabbits and wild pigs. Near the piers, there are also cultural sites where ancient peoples lived. These piers and adjacent areas are favorites for families on outings away from the pressures of civilization. Yet, these sites are literally within minutes of Downtown Lake Havasu City. Fishing is good here for catfish and bass. On the piers anglers will bring their lunch and sit on the benches provided and fish all day. Havasu Springs pier is located at the south end of Lake Havasu between the Central Arizona Water Project pumping site and Parker Dam. It is located adjacent to a private RV, mobile home and golf course. This pier is famous for its location in a prime striped bass spot. Large flathead catfish are caught here. The site is a beautiful place to view the Bill Williams natural area and the southeast corner of Lake Havasu. This site is lighted and many anglers spend evenings and nights fishing for the big ones. Modern toilet facilities have been constructed as a part of this pier. The least used site, Take Off Point, is not really a pier but a picnic site with fishing platforms, tables and barbecue grills. A wonderful view of the dam and steep, rugged terrain exists. This site provides parking and a little park area. Fishing is not as popular here because the site is harder to find and not located in an area that has turned

41
out to be as productive as other pier areas. It is a hidden jewel in terms of the views of the dam and the mountains adjacent to the lake.
The Central Arizona Project Peninsula is a significant landmark at the southern end of Lake Havasu, and will be a premier recreational fishing area in the near future. The habitat project has a final site under study that will, hopefully, become a reality soon. This site is located on a long peninsula opposite to the Central Arizona Project pumping site. This will become a visitors center with parking and modern restroom facilities. A long access trail will run the length of the peninsula and will access several fishing and picnicking sites. This site should be the crown jewel of the access sites and should become a showcase for project information and news about habitat development. It would become one of the first public information sites tourists would come to driving up from the south. All of these sites and piers are fully accessible and are designed for family use. All of these sites provide not only for angling, but also for viewing, bird watching nature study and provide the opportunity to experience the Lake Havasu area. The Cost of Access: The opportunity costs due to current state policy is the loss of use in the currently inaccessible shoreline. Opportunity costs are both short run and long run in nature. Just what are the opportunity costs of current Arizona State land policies? In the short run, these costs include lost opportunities by every type of shoreline user from family picnics to casual launch areas for small watercraft. Obviously, access for angling is severely limited under the current policies. Only the most agile can try to access these areas now. No phys ically challenged person has access. Economic development will change the shoreline and create long run positive modifications to the ecosystem.

42
Long run economic opportunity costs focus on the increasing costs associated with purchasing access sites for fishing, boat launching, picnicking, etc. As an example, what would it now cost to purchase and develop a launch and fishing site such as Site 6? What would be the cost to the public sector to purchase shoreline access sites in 5 years? In 10 years? In 25 years? Given the current and future values for private exclusive developments along the shoreline and close to existing cities, what is the “real value” of a Site 6? These are all extremely important factors in making decisions regarding access to Lake Havasu. These are the reasons the project has as one of its goals, the improvement of low cost access for the public. Pier Use: Charts 21 through 25 provide use data on each pier by category of angler. The amazing fact about pier use is that even tournament anglers use these piers. These are the most dedicated anglers on the lake, focused on productivity. The typical mindset is to fish hard, in several parts of the lake, via high-speed bass boat. However, they take the time to visit the piers, perhaps with their families along, to enjoy not just the fishing but the beauty of the area. Pier 6 is the overall winner for use reaching 50% of the Lake Havasu anglers. Mesquite #1 is a close second for the same category of angler (41.8%). Mesquite #2 is third (29.5%) followed by Havasu Springs at 30.3% and Take Off Point at 13.1%. Lake Havasu resident anglers represent the highest percentage of use at each pier. The overall trend among the four classes of anglers is that the piers are used most by Lake Havasu anglers, followed by the total angler category, non-resident non-tournament and lastly by the non-resident tournament angler. It seems that proximity to populated areas and angler residence are the two most important determinants of pier use. Residents are aware of the piers and, due to their convenient locations, tend to utilize them more than non-residents.
Chart 21 Mesquite Pier #1 Percentage of Use
22.40%19.30%
12.00%
41.80%
0%5%
10%15%20%25%30%35%40%45%
All Anglers Non-Resident,
Non-Tournament
Angler
Non-Resident,
TournamentAngler
Lake HavasuResident
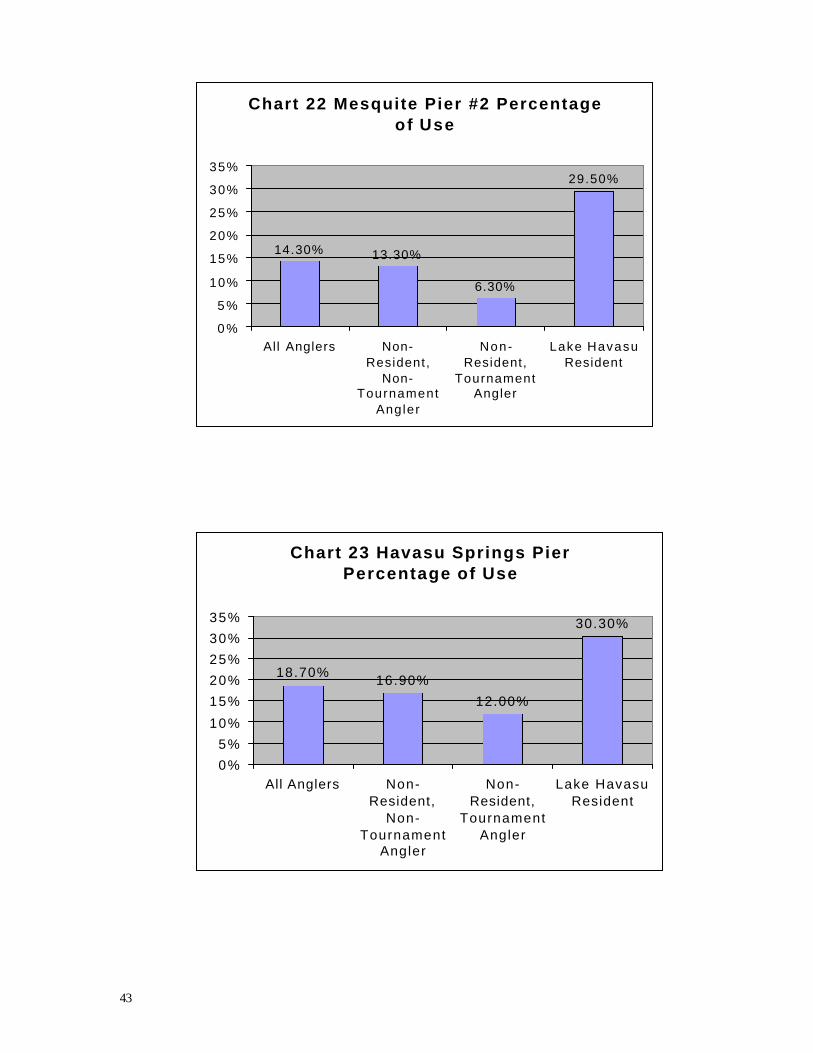
43
Chart 22 Mesquite Pier #2 Percentage of Use
14.30% 13.30%
6.30%
29.50%
0 %
5 %
10%
15%
20%
25%
30%
35%
All Anglers Non-Resident,
Non-Tournament
Angler
Non-Resident,
TournamentAngler
Lake HavasuResident
Chart 23 Havasu Springs Pier Percentage of Use
18.70% 16.90%
12.00%
30.30%
0%
5%
10%
15%
20%
25%
30%
35%
All Anglers Non-Resident,
Non-Tournament
Angler
Non-Resident,
TournamentAngler
Lake HavasuResident

44
Chart 24 Take Off Point Pier Percentage of Use
7.40% 7.20%
4.00%
13.10%
0%
2%
4%
6%
8%
10%
12%
14%
All Anglers N o n -Resident,
N o n -Tournament
Angler
N o n -Resident,
TournamentAngler
Lake HavasuRes ident
C h a r t 2 5 S i t e 6 P i e r P e r c e n t a g e o f U s e
2 6 . 1 0 %2 1 . 7 0 %
1 3 . 7 0 %
5 0 . 0 0 %
0%
1 0 %
2 0 %
3 0 %
4 0 %
5 0 %
6 0 %
A l l A n g l e r s N o n -R e s i d e n t ,
N o n -T o u r n a m e n t
A n g l e r
N o n -R e s i d e n t ,
T o u r n a m e n tA n g l e r
L a k e H a v a s uR e s i d e n t

45
Non-tangible Values Enhanced:
Family Values:
Fishing is a sport enjoyed by many Americans. It is a family sport where men and women teach their children to fish. The number of women participating in recreational and tournament fishing is growing. Fishing gives families a time to be together, because fishing is “fishing” not “catching” there is plenty of time to talk and relax together. The construction of pier and dock facilities was designed for family participation and ease of use. Safety and accessibility were important design considerations, especially for children and handicapped anglers. Nature trails and interpretive paths have been constructed so that families who walk these paths can see and discuss the different plants and animals that thrive in the area. These trails provide numerous opportunities, including but not limited to educational experience, family activities, physical exercise, relaxation, and access to fishing.
Use by Physically Challenged Anglers: The percentage of physically challenged anglers is illustrated in Chart 26. Providing access
for those with disabilities was a fundamental goal of the Lake Havasu Habitat Program. A significant 11.4% of tournament anglers listed themselves or someone in their party as being physically challenged. Lake Havasu residents included the highest percentage disable anglers at 12.3%. Overall the percent was 10.1%
All Americans have access to fishing at Lake Havasu no matter what their physical challenges might be.
C h a r t 2 6 P e r c e n t o f P h y s i c a l l y C h a l l e n g e d A n g l e r s
1 0 . 1 0 %
4 . 8 0 %
1 1 . 4 0 %1 2 . 3 0 %
0 %
2 %
4 %
6 %
8 %
1 0 %
1 2 %
1 4 %
A l l A n g l e r s N o n -R e s i d e n t ,
N o n -T o u r n a m e n t
A n g l e r
N o n -R e s i d e n t ,
T o u r n a m e n tA n g l e r
L a k e H a v a s uR e s i d e n t

46
Generosity of Tournament Anglers:
One of the wonderful benefits of having a good bass lake that draws tournaments is that tournament anglers are generous. They love the areas they fish, and they form relationships with locals that are unbreakable. Tournament anglers contribute their expertise on improvements that may be needed, and they watch for any weaknesses or trends in the fishery that might need to be addressed. They obviously are, as a group, a source for valuable information on fish species, weight and fish condition. Additionally, tournament anglers quietly donate money to local charities to assist citizens, communities, and fisheries. The donations of time and money are not made to gain recognition, rather to support and sustain valuable human and natural resources.
Demographic Data: Charts 27 and 28 illustrate the gender and age breakdowns measured by the study. The
author feels that the female – male division may be somewhat flawed as not as many female interviewers were used as might have been desired. Even though more females are fishing, it is predominantly a male sport and the leader of the group of anglers tends to be a male rather than a female. A lot of the male bias is simply due to the cultural values of Americans in general. These values are changing and female anglers are beginning to be more numerous.
Chart 27 Angler Gender
Male92%
Female8%
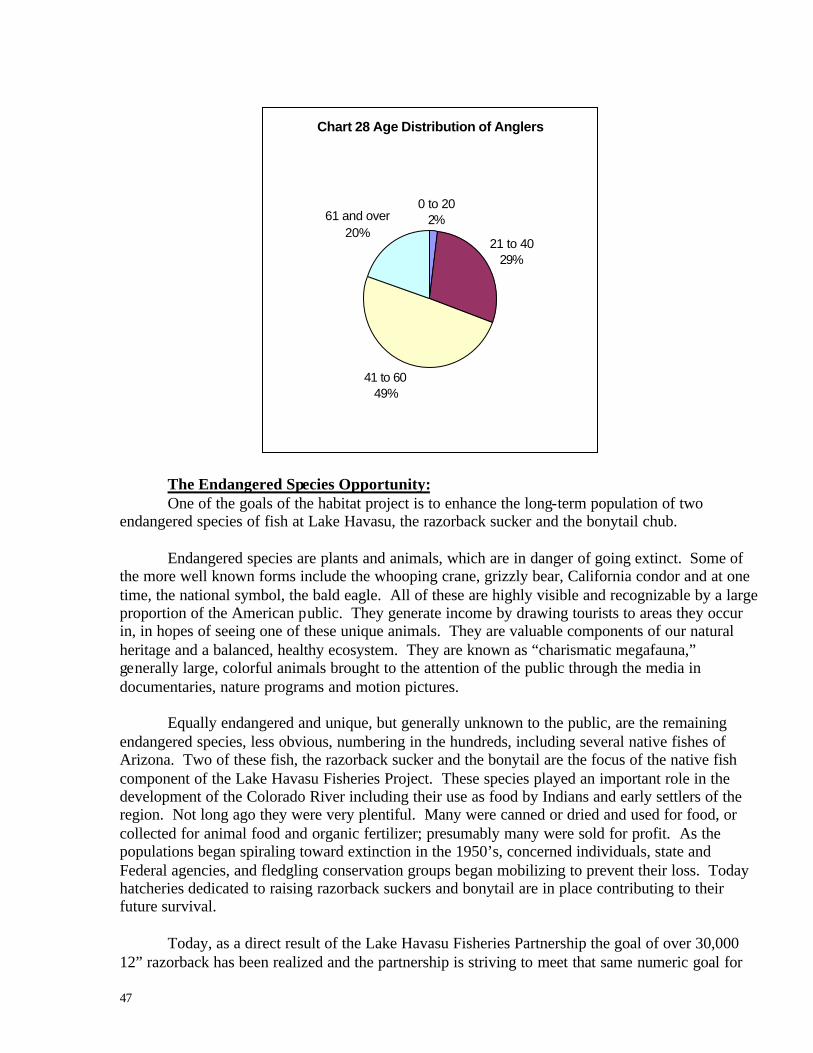
47
The Endangered Species Opportunity: One of the goals of the habitat project is to enhance the long-term population of two
endangered species of fish at Lake Havasu, the razorback sucker and the bonytail chub. Endangered species are plants and animals, which are in danger of going extinct. Some of
the more well known forms include the whooping crane, grizzly bear, California condor and at one time, the national symbol, the bald eagle. All of these are highly visible and recognizable by a large proportion of the American public. They generate income by drawing tourists to areas they occur in, in hopes of seeing one of these unique animals. They are valuable components of our natural heritage and a balanced, healthy ecosystem. They are known as “charismatic megafauna,” generally large, colorful animals brought to the attention of the public through the media in documentaries, nature programs and motion pictures.
Equally endangered and unique, but generally unknown to the public, are the remaining endangered species, less obvious, numbering in the hundreds, including several native fishes of Arizona. Two of these fish, the razorback sucker and the bonytail are the focus of the native fish component of the Lake Havasu Fisheries Project. These species played an important role in the development of the Colorado River including their use as food by Indians and early settlers of the region. Not long ago they were very plentiful. Many were canned or dried and used for food, or collected for animal food and organic fertilizer; presumably many were sold for profit. As the populations began spiraling toward extinction in the 1950’s, concerned individuals, state and Federal agencies, and fledgling conservation groups began mobilizing to prevent their loss. Today hatcheries dedicated to raising razorback suckers and bonytail are in place contributing to their future survival. Today, as a direct result of the Lake Havasu Fisheries Partnership the goal of over 30,000 12” razorback has been realized and the partnership is striving to meet that same numeric goal for
Chart 28 Age Distribution of Anglers
0 to 202%
21 to 4029%
41 to 6049%
61 and over 20%

48
bonytail. Economic benefits from this population are essentially intangible beyond the State and Federal wages paid to biologists to complete this work. Averaging over $100,000 per year in sum since 1993, these funds, generated from outside the area, have helped the community grow in many ways, but the benefits of native fish conservation goes far beyond that. The Lake Havasu population will be one of the largest on the river system, providing approximately a 40 year (expected fish life span) extension of time to learn about these unique fish and potentially define their value to the ecosystem. These two populations will provide important genetic stock should tragedy hit them elsewhere. They may hold promise for direct benefits to humanity through medicine, or indirect benefits simply by knowing we have not lost them forever. The value of these biological assets is incalculable, yet they are priceless benefits to science, our society, culture and natural heritage.
Father and son making a few more casts before nightfall.

49
References:
Arizona Parks and Recreation, Bass Tournaments, Past, Present, Lake Havasu Office,
Windsor Beach May, 2001
American Sportfishing Association, The Economic Importance of Sport Fishing, webpage: www.dfg.ca.gov, 2001
Bureau of Economic Analysis, U.S. Department of Commerce, Regional Input-Output
Modeling System (RIMS II), Third Edition, March 1997. Bureau of Land Management, Lake Havasu Fisheries Improvement – A Partnership
Program, project proposal and description, Lake Havasu City Office, 1993 Bureau of Land Management, Lake Havasu Fisheries Improvement Program, Mid-
Program Review, Lake Havasu Field Office, August 1998 Coupal, R. et al, An Evaluation of BLM Recreation Data and Economic Impact Analysis
of Recreation on BLM Lands in the Western United States, work in progress, Department of Agricultural and Applied Economic, University of Wyoming, February 2001.
D.K. Shifflet & Associates Ltd. Arizona’s West Coast Visitor Profile, January 1998. Fermata Inc., The Economic Impact of Hunting and Fishing on the Middle Platte River in
Nebraska – Executive Summary, Fermata Inc. Austin, Texas 1997 Gunderson, Jeff and Kreag, Glenn, Estimated Economic Impact of Recreational Fishing
on Minnesota Waters of Lake Superior, University of Minnesota, Sea Grant Program
Horton, Gary A.Assessing the Effects of Economic Impacts: The Derivation and
Application of Economic, Fiscal, Resource, and Environmental Impact Multipliers, Nevada Division of Water Planning
Horton, Gary A. An Introduction to Input-Output (I-O) Models and Economic Impact
Analysis, Nevada Division of Water Planning.
Jacobson, Brad, Lake Havasu Changes in the Fishery, Arizona Game and Fish Department, Yuma, Arizona, 2001
Lindall, Scott A. & Olson, Douglas C., MIG Inc. Minnesota IMPLAN Group Inc. Implan
Pro, The Implan Input-Output System, Stillwater, NM 55082. Locatis, Justin, Lake Havasu Fisheries Improvement Project, Arizona Outdoorsman,
website, www.azod.com, Arizona Outdoorsman, Inc. Wickenburg, Arizona, Mahara, Vishwanie and Janet E. Carpenter, American Sportfishing Association, the 1996

50
Economic Impact of Sport Fishing in Arizona and California Martin, William et al, The Economic Value of the Lake Mead Fishery With Special
Attention to the Largemouth Bass Fishery, Nevada Department of Wildlife, et al. October 15, 1980
Marzoula et al, Angler Use and Harvest of Sport Fish in Lake Havasu, California With Special Emphasis on Striped Bass – Final Report, California Department of Fish and Game, 1990
Mitchell, Dave, Owner, Sweetwater Tackle, Lake Havasu Arizona, phone interview, May
23, 2001 Ocker, Jim, Writer, Guide, Naturalist, Fishing Lake Havasu web site, www.citlink.net,
Pringle, Todd, Arizona Game and Fish Department, Estimate of Lake Havasu City Resident Anglers, Sept 2001.
Sonoran Institute, Northwest Office, Population, Employment, Earnings and Personal Income Trends, Mohave County, Arizona, August 2001.
Southwick Associates, Inc., The 1996 Economic Benefits of Watchable Wildlife Recreation in Florida, Fernandina Beach, FL, May 1998.
Southwick Associates, Inc. Statewide Economic Contributions from Diving and
Recreational Fishing Activities on the Mississippi’s Artificial Reefs, Fernandina Beach, FL, April 1998
Thailing, Carol E. et al, The 2000 Virginia Beach Red, White, and Blue Fishing Tournament: Participants’ Characteristics, Attitudes, Expenditures, and Economic Impacts, Department of Wildlife and Fisheries Sciences, Texas A&M University, College Station, Texas, March 15, 2001
The Economic Importance of Sport Fishing, The American Sportfishing Association,
Texas Parks and Wildlife, www.tpwd.state.tx.us, 2001 U. S. Fish and Wildlife Service, 1996 National Survey of Fishing, Hunting, and Wildlife-
Associated Recreation, Nevada, California, Arizona, March 1998 U. S. Fish and Wildlife Service, 1996, National Survey of Fishing, Hunting, and
Wildlife-Associated Recreation, November, 1997
Vogelsong, Hans and Graefe, Alan R. Economic Impact Analys is: A Look at Useful
Methods, Parks and Recreation Magazine, March 2001
Watts. Gary et al, The Endangered Species Act and Critical Habitat Designation: An Integrated Biological And Economic Approach, Watts and Associates, April 1997.