socio-economic and profitability of fisheries enterprises in kano state, nigeria
TRANSCRIPT

International Journal of Novel Research in Humanity and Social Sciences Vol. 2, Issue 1, pp: (72-83), Month: January - February 2015, Available at: www.noveltyjournals.com
Page | 72 Novelty Journals
Socio-Economic and Profitability of Fisheries
Enterprises in Kano State, Nigeria
1Dambatta, M.A,
2Dr. Sogbesan, Olukayode Amos
1,2 Department of Fisheries, Moddibo Adama University of Technology Yola, Adamawa State, Nigeria
Abstract: The study focused on the analysis of value chain- Addition of freshwater fisheries in Kano State, Nigeria.
The socio-economic characteristics of the stake holders along the fisheries enterprises and the marketing channel
of fresh and smoked fish in the study area were determined Gross margin analysis to assess the profitability of the
business was also determined. The constraints were also described and the factors that influence consumer
preferences in the study area were identified. Primary data were collected using questionnaire. A total of 30
fishermen, 30 processors and 20 consumers; were interviewed. Descriptive statistics gross margin were used to
analyze the data collected. Fishing was found to be male dominated (52.3%), while processing was found to be
female dominated (47.5%). The constraints of the fishermen were dwindling of the dam, high cost of fishing goes,
deformation and inadequate capital. The processors have been constrained, inadequate credit facility, inadequate
processing facilities and poor sale and bad roads. Other constraints experienced by consumers include high cost of
fish, fish fin problems, deterioration of fish and poor sanitary condition. In conclusion, profitability was
ascertained too good for both fishermen and processors. Therefore Government should provide loan scheme for
the proper increase and boasting of fisher men and processors activities.
Keywords: Socio-economics, Fishermen, Fish Processor, Fish Consumers, Constraints.
1. INTRODUCTION
Fish is an important source of protein to the teeming population in Nigeria. Fish could be regarded as one of the major
sources of animal protein in the country. According to Adekoya (2004), Fish represents about 55% of the protein sources
intake of Nigerians. A large population of Nigerians is fish consumers with a demand estimated at about 1.4 million
metric tons per annum.With a projected fish demand of 1.755 million metric tons in Nigeria (assuming a annual per
capital fish consumption of 12.5kg and human population of 140.45 million, in the year 2000) and a total annual domestic
production figure of less than 450,000metric tons, Nigeria has a fish supply deficit of about one million tons (Tobor,
1991). However, a demand supply gap of at least 0.7 million metric tons exists annually with imports making up the
shortfall at a cost of about 2.0 million US dollars every five years (Jim, 2004).Domestic fish production of about 500, 000
metric tons is supplied by artisanal fisher folks (estimated at about 85% despite over fishing in many water bodies across
the country). Fish farmers (1%) and industrial capture fisheries (14%) (FDF,2005). Fish is a popular, highly nutritious
aquatic vertebra, which serves as a delicacy to most of the sub-Sahara Africa providing over 18% of total animals protein
intake worldwide, with share as high as 40-60% in some West African States(FAO, 2002). Approximately 200 million
Africans rely on fish as an important part of their diet. Ten million houses directly derive income from fish production,
such as processing or trade. Yet the enormous potentials of fisheries to help feed and improve the nutritional status of the
rapidly increasing population of Africa is greatly under-realized and precious aquatic resources are being degraded
(World Fish Center, 2008).Fish is the cheapest animal’s protein source in Nigeria, and smoked fish in particular has the
potential to solve the pervasive protein shortage owing to its relative affordability compared with fresh fish. Boosting
smoked fish consumption will entails retail price reduction, which is achievable only if the market for smoked fish
operates efficiently (Taiwo, 2008).

International Journal of Novel Research in Humanity and Social Sciences Vol. 2, Issue 1, pp: (72-83), Month: January - February 2015, Available at: www.noveltyjournals.com
Page | 73 Novelty Journals
Aim and Objectives of the Study:
In line with the study, the research broad objective is to analyze the socio economic and profitability of fisheries
enterprises in Kano State, Nigeria. The specific objectives are to;
(i) Describe the socio-economic characteristics of the stakeholders.
(ii) Estimate the profit level of stakeholders along the fisheries enterprises.
(iii) Determine the consumer preferences to fish in the study area.
(iv) Identify the major constraints faced by the stakeholders in the study area.
2. METHODOLOGY
Description of the Study Area:
The study was carried out in Kano State; where freshwater fishes have a very old history due to availability of numerous
freshwater bodies in the State. The state lies on latitude 10°33´N to 12°37´N and Longitude 7°40´E to 9°29´E. It is within
Sudan Savannah zone. The total land area of the State is 20,709 square kilometer. The mean daily maximum and
minimum temperatures are 33.1°C and 15.85°C, respectively. Kano State is bordered to the north and northwest by
Katsina State, to the east and northeast by Jigawa State, to the south by Bauchi State and to the southwest by Kaduna
State. According to official Gazettes of the Federal Republic of Nigeria (2007), the State had a population of Nine million,
Three hundred and Eighty Three thousand Six hundred and Eighty two (9,383,682) inhabitants, with an annual growth
rate of 3.3% who are mainly Hausa and Fulani by tribe (NPC, 2006). Agriculture is the major employment of labor in the
State with many citizens involved in farming, fishing and marketing of aquatic resources such as fish, frogs either dried,
smoked or other fish by-products.
Major crops grown in the State include Millet, Sorghum, Cowpea, Corn, Wheat, Cotton, Gum Arabic, Groundnut and
Rice, fish and fish products available in the State, while rearing of animals like cattle, horses, goat and sheep are as well
prominent (Rim, 1992).The State has quite a large number of fish markets up to sixteen. These include rural and urban
markets where smoked and dry fishes are assembled. Most of the markets operate weekly or twice a week with the
exception of city markets, which operate on daily basis. Next to farming are non-farm activities such as building,
construction works, and so on. About twenty percent (20%) of the people engage in these activities to either supplement
their income from farming, fishing or those from the privates or public sectors.
Sampling Techniques:
The sampling frame for the data collection comprised of fishermen, processors, and consumers, in the three selected zones
of Kano State in accordance with the existing Agricultural Development programme (ADPs) Zones in the State.
Multistage sampling technique was used for sampling the respondents in the study area. The first stage involved purposive
selection of one local government area from each zone based on relative abundance of hydrological features. On that
basis, Bebeji Local Government Area was selected from Zone I (Tiga Dam), Kunchi Local Government Area was
selected from Zone II (Ghari Dam) and Gwale Local Government Area was selected from Zone III (Mai Allo Dam).
Sampling Size:
The second stage, involve simple random selection of respondents from the three selected landing sites. However, 30 each
of fishermen, processors (Women) and 20 consumers were used. The distribution of these respondents within the
purposively selected study sites was based on the proportion of the respondents in the site. A total of eighty (80)
respondents were covered by the survey.
Study Location and Distribution of Respondents in each of the selected Zone
ADPs Location / Actors Fisher Hydrological Features Sample Size
I Bebeji / Rano L.G. (Fisherman). Tiga Dam 30
II Kunchi L.G (Processors). Ghari Dam 30
III Gwale L.G. (Consumers). Mai Allo Dam 20
Total 80
Sources: Field Survey, 2014.

International Journal of Novel Research in Humanity and Social Sciences Vol. 2, Issue 1, pp: (72-83), Month: January - February 2015, Available at: www.noveltyjournals.com
Page | 74 Novelty Journals
Methods of data collection:
Primary data were used for this study. The data were collected with the aid of structured questionnaire administered to the
randomly selected respondents. The data on the socio-economic characteristics of the respondents, marketing costs
returns, processing cost and data on fishing operations; as well as constraints militating against fish marketing in the study
area, were collected. Structured questionnaire was prepared and used for collections of the primary data were tested for its
reliability. The questionnaire will contained section (A) Fisherman, Section (B) Processors and Section (C) Consumers.
Eighty (80) questionnaires were distributed to the targeted respondents. Data collection activities during these days
include very early morning visits to landing sites to interview fishermen. Processors and Consumers were interviewed at
different convenient time of the respondent.
Analytical tools:
The tools of analysis used for this study are:
Descriptive Statistics,
Profitability (Gross Margin), and
Net Income (NI)
Descriptive Statistical Tools:
Frequencies tables and percentages were used to describe the socio-economic characteristics of the respondents. The
characteristics include the Age, Marital Status, Education Attainment, and Occupation, Fishing experience and Sex among
others.
Gross Margin Analysis:
The budgetary technique was used to determine the gross margin income at each stage of the chain. The model that was
used in estimating the gross margin is:
Profitability:
Gross Margin = Revenue- Cost of Goods Sold
Revenue
3. RESULT
Socio-economic characteristic of fisheries stakeholders in Kano State:
The study examined the socio – economic characteristics of the respondents; such as age, sex, marital status, educational
status, livelihood activities, year of experience and benefits derived from association.
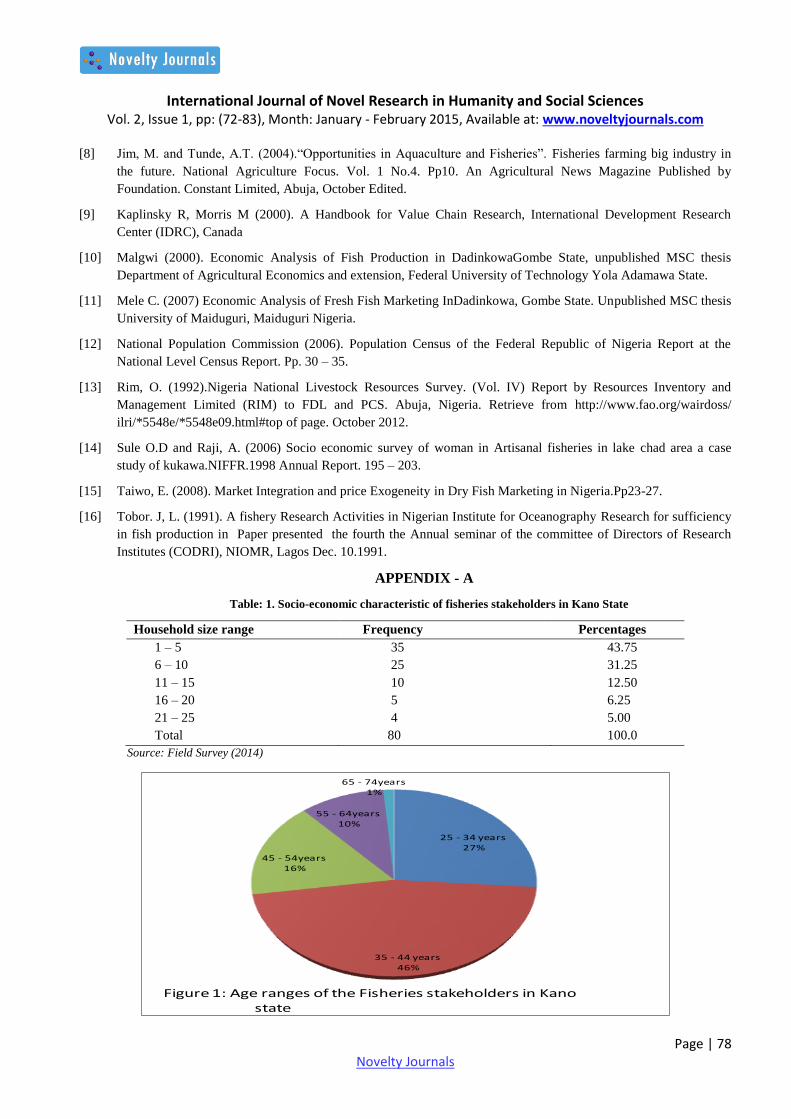
Ages of Fisheries Stakeholders in Kano State:
The Ages range of 35-44 years old had the highest percentage of respondents (46%), followed by 25 -34 years old with
27% and the least value of 1% was for those within 65-74 years old as shown on Figure 1.
Household sizes of fisheries stakeholders in Kano State:
Table 1 presented the Household sizes of the fisheries stakeholders in Kano state studied during the period of this research
work. The lowest household size range of 1-5 had the highest percentage of 43.75% while the highest size of 21-25
recorded the lowest occurrence percentage of 5.0%. There is a wide range of differences between these household in sizes
and percentage occurrence.
Gender and Educational Status of fisheries stakeholders in Kano State:
Table 2 also presented the gender and educational status of the fishers. The males had 52.5% composition while the
remaining of 47.5% were females. In terms of educational status of the populace of the study area, the educational

International Journal of Novel Research in Humanity and Social Sciences Vol. 2, Issue 1, pp: (72-83), Month: January - February 2015, Available at: www.noveltyjournals.com
Page | 75 Novelty Journals
background range from the First School leaving certificate, secondary, tertiary, qur’anic and adult education with
percentages of 18.75, 31.25, 7.5, 30, and 12.5% composition respectively as shown on Table 3
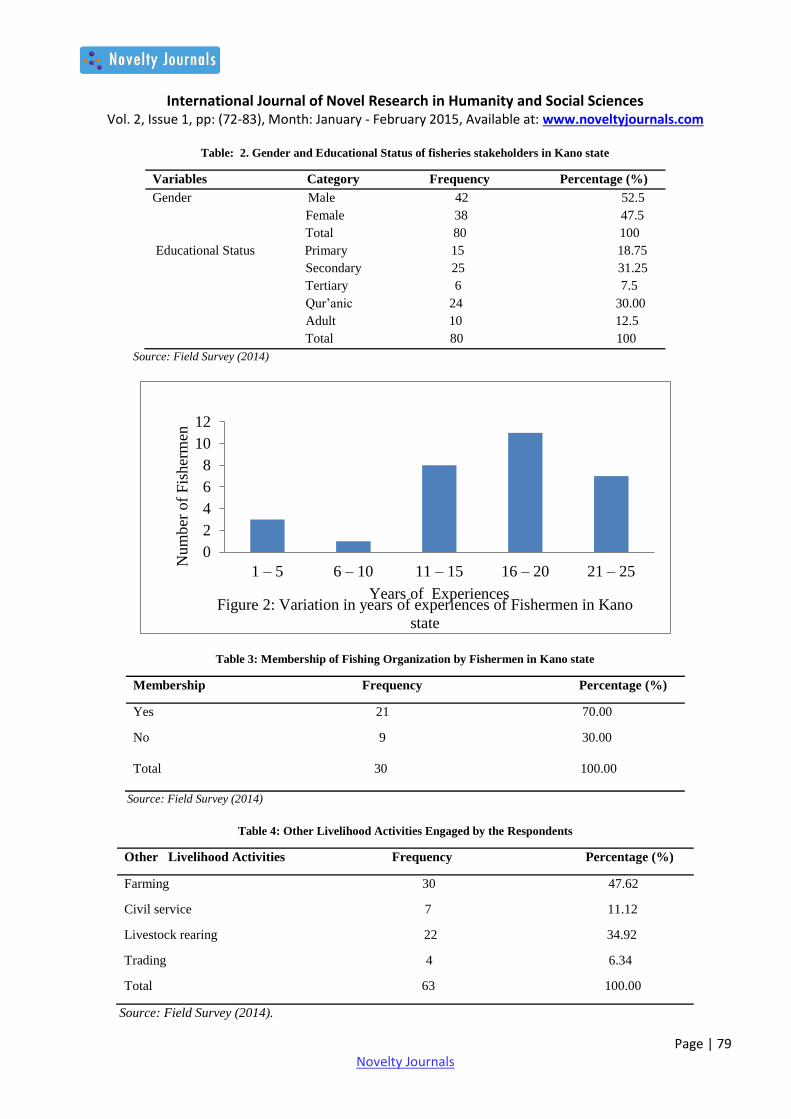
Fishing Experiences of the of fisheries stakeholders in Kano State:
A total of 30 respondents were recorded with varying years of experience as in Figure 2. Out of 30 respondents, 3 had 1-5
years of experience, 1 had 6-10 years of experience, 8 people had 11-15 years of experience, 11 people had 16-20 years of
experience and 7 people had 21-25 years of experience.
Fishing organizations and membership by the fishermen in kano state:
The information generated showed that 70% of the fishermen are actively engaged in fishing organization while the
remaining 30% do not belong to any fishing organization (Table 3). Majority of the fishermen in the studied communities
belong to Balako Cooperative Society, Tiga fishing association, Nakowa Cooperative society and Allah de Cooperative
Society. The membership ranged from 1 to 15 for the core fisheries cooperative society while some belong to more than
one cooperative society. Among all, Tiga fishing Association embraces all the fishermen in the studied community.
Alternative livelihood activities engaged by the fishermen in Kano state:
All the fishermen (100.00%) responded fully to be engaging in other or alternative livelihoods apart from fishing. In Table
4, other livelihood activities engaged by the respondents apart from fishing are farming, civil service, and livestock
rearing and trading. Farming had higher percentage of 47.62% more than other livelihood activities while the lowest is
trading consisting of 6.34% composition.
Profitability and handling of unsold Fish by Fishermen in Kano state:
In Table 5, the processing of Fish after catch was recorded. But in Table 6, methods of processing used in the study area
were smoking, sun drying, and frying. Table 7 recorded the profitability of Fish caught and value per week and the total
profit recorded was N30,600.
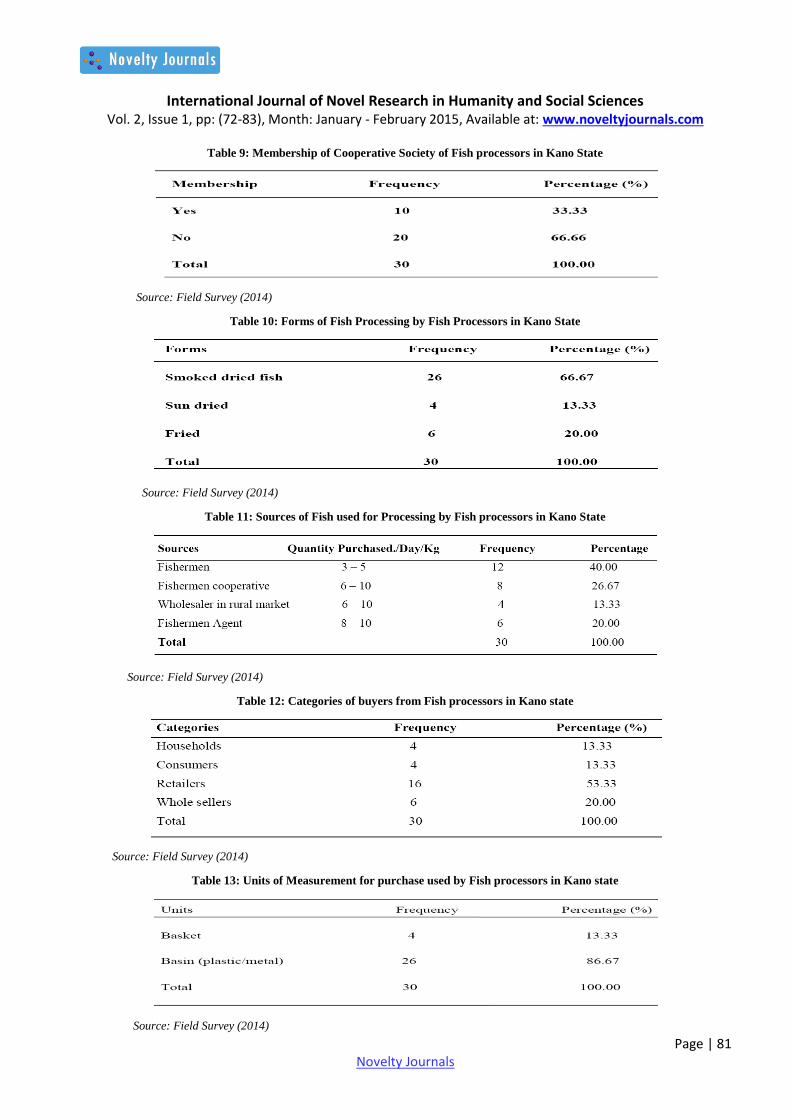
Fish Processors in Kano state:
The major occupation was Fish processor and livestock rearing according to Table 8. In the study area, 66.66% were
member of cooperative society while 33.33% were not a member (Table 9). The form of Fish processing were both
smoked dried and sun-dried Fish as presented in Table 10. Table 11 presented the source of Fish for processing which
consist of fishermen (53.33%), Fishermen cooperative (33.33%) and wholesaler in Rural market (13.33%). The category
of Fish buyers in from the processors are shown in Table 12 has households, consumers, retailers and wholesalers to be
13.33, 13.33, 53.33 and 20% respectively. And the units of measurement used are basket and basin with the basin had
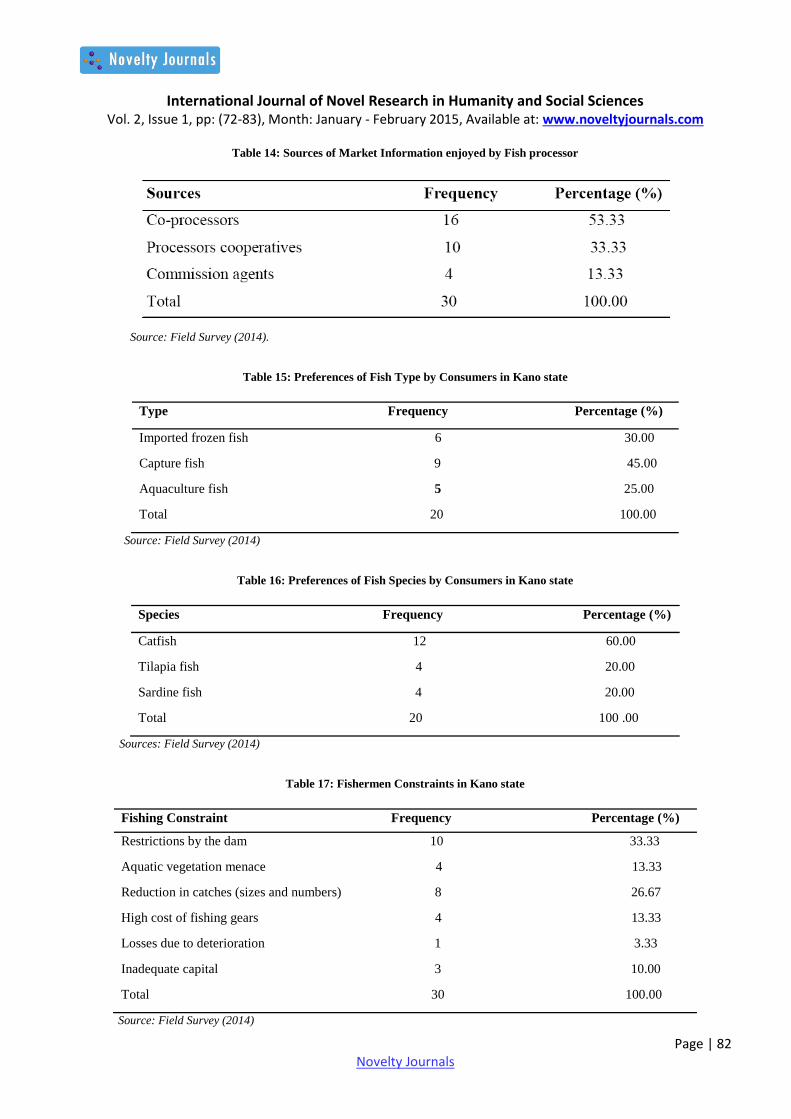
higher percentage of 86.67% more than the basket (Table 13). In the course of this study, the sources of market
information were co-processors, processor cooperatives and commission agents as recorded in Table 14.
Fish consumers in Kano state:
Table 16 presented the preference of the Fish type in the study area. Imported frozen fish were mostly preferred by the
people with 65% value of preference while the least preferred is aquaculture fish with 15%. Table 17 also presented
preference of fish species by the stakeholders. Catfish species is the most preferred with 60% followed by tilapia and
sardine with 20% each.
Constraints faced by the Fisheries stakeholders in Kano State:
The problems faced by the Fishermen are dividing of the dam, high cost of fishing gears, aquatic vegetation, reduction in
catches both in sizes and numbers, losses due to deterioration and inadequate capital (Table 17). Table 18 and 19 recorded
the fishermen solution such as provision of storage facilities and constraint to fishermen such as inadequate storage
facilities, processing facility and poor sale and Poor road linkages.

International Journal of Novel Research in Humanity and Social Sciences Vol. 2, Issue 1, pp: (72-83), Month: January - February 2015, Available at: www.noveltyjournals.com
Page | 76 Novelty Journals
4. DISCUSSION
The result of the study indicate that majority of the fishermen range between 41 – 48 years which have the highest
percentage (46.25%) followed by 33 – 40years and 49 -56years all with (16.25%), then followed 25 -32 years with
(11.25%), then 57 -64 years with (8.75%), and least percentage of 1.25% was registered on age range of between 65 -72
years. The implication of this finding is that middle aged people take part more in fishing activities than old aged and
younger ones in the study area. This has to do with the fact that young adult or middle aged people are more energetic and
may have better entrepreneurial drive in the society. It’s so because at these aged range people are more energetic and
healthier. This tally with the finding of Malgwi (2000) in his study of economics of fish production in Maiduguri
metropolitan area, where he revealed that most of the fishermen are in their middle aged .This is in line with finding of
Bello (2000) and George et.al.,(2010) that age had a positive correlation with Agricultural Productivity.
The result shown that 50.00% had household size of 1-6 members followed by 31.25% with household size of 7 – 12
members, then 12.5% have a household size of 13 – 18, thus majority of the respondents in the study area are having less
household because the business is more of middle aged who have less family size than the old ones. “Middle aged people
participate more in value addition chain analysis in freshwater fishery in Kano State. Theses result are similar to the
finding of Fabusoro et al.(2007) who reported that average house hold size in Africa was about 9 person.
Gender is an important socio-economic parameter, according to either male or female (Lahai et al., 2000). The study
revealed that both male and female were involved in all activities of fishing such as Fishing, processors marketing and
consumers with male having the majority (52.5%) , while female constitute (47.5%) of the respondents. The few size of
female processors participating in the activities may be due to religious and cultural barrier in the study area. These
findings are in accordance with the finding of Sule and Raji (2006) who pointed out that fishing business is an exclusive
business for male.
Education is very important in every aspect of life and it plays a fundamental role towards Aquaculture development,
because it enhances easy assimilation, awareness and receptivity to innovation of aquaculture practices. This education
gives a better awareness, persuasion and adoption of innovation hence better improvement in production (Adams,et.al.,
1987). The result indicated that educational status of the respondents with majority having secondary education (31.25%)
followed by Qur’anic education with (30.00%) This signifies that majority of the respondents had Qur’anic education due
to the dominance of Islamic religion in the study area. With those having tertiary education having the least percentage of
(7.5%). This findings is line with of Mele (2007), following his study of economic analysis of fresh fish marketing in
Dadinkowa, Gombe State in where he found that majority of the respondents had formal education.
Fishing experience is the number of years that the fishermen spent in fishing business. The longer the experience in the
business, the better the performances in fishing activities. The result indicated that most of the respondent (36.66%) had
fishing experience of 16 – 20 years, 26.66 % of the respondents had fishing experience of 11 – 15 years and 23.33% of the
respondents had fishing experience of 21 – 25 years, while 10.00% of the respondents had fishing experience of 6 – 10
years (least percentage). With this experience, it implies that the fishermen can manage their fishing activities and risk and
make sound decision to enhance their performance.
This result estimated the return for value addition or profit made by the fishermen in the value chain was obtained by
subtracting the total cost of any activity along the chain (supply) from the revenue generated from it. The result revealed
that return varies according to the role played by fishermen and the extent of level of participation along the value chain.
To estimate return, the mean value from the total cost incurred is subtracted from the mean value of the revenue from the
sale of the commodity. Gross Margin ratio is the ratio of gross of business to its revenue. It profitability profit measuring
what proportion profit (Ie revenue, less cost of goods sold).
Majority of the consumers preferred imported frozen fish which had 65.00% due to the neatness, capture fish had 20.00%
of the respondents followed by aquaculture fish with least percentage of 15.00% of the respondents in the study area. This
indicate that majority of the respondents sampled in the area preferred imported frozen fish, because of hygienic and safe
time.
Majority of the consumers in the study area (60.00%), preferred fish species of Cat Fish, which is more palatable and have
good taste in the study area. While the remaining respondent’s preferred Tilapia and Sardine with 20.00% each. The

International Journal of Novel Research in Humanity and Social Sciences Vol. 2, Issue 1, pp: (72-83), Month: January - February 2015, Available at: www.noveltyjournals.com
Page | 77 Novelty Journals
major constraints of the fishermen in the study area were found to be shrinking nature of the dams (63.33%) as they
witness gross reduction in catches over the years since they noticed that the catches are also reducing, 13.33% identified
high cost of fishing gears as their constraint, while 3.33% advanced loses due to deterioration as their problem; while
20.00% of the respondents identified lack of capital to the fishermen as the in major constraint.
The proffered solution of the aforementioned problems as suggested by the fishermen includes more water should be
allocated to the dam so as to increase its level, 50.00%, 13.3% want availability of fishing gears at cheaper price as the
solution to their problems. 3.33% demanded for provision of means of storage to avoid spoilage of catches. 33.33% wants
provision of loan by Government or Commercial banks at lower interest rate as their solution to inadequate capital.
5. SUMMARY AND CONCLUSION
The study examined the analysis of socio economic and profitability fisheries enterprises in Kano state, Nigeria.
Multistage sampling technique as employed to select a total of 80 stakeholders along the fisheries enterprises,30
fishermen, 30processors and 20 consumers. The sampling was based on purposive and simple random selection technique.
The collected data were subjected to both descriptive statistics mainly. The study further attempted to describe the socio –
economic characteristics of actors (Fishermen, processors and final consumers).And finally identified the major
constraints, as well as possible solution for all actors in the fish value chain. The results of the study disclosed that
majority of the respondents were within the range of 41 – 48 years, which had 46.25%, and majority of the respondents
(fishermen, processors and consumers) were male, which had 52.5%. The results show that female had participation value
chain especially in processing activities, which had 47.5% and also majority of the respondents were single, which had
80.00% most of the respondents have household size of 1-6 persons have 50.00%. However, majority 31.25% attends
secondary school, and 30.00% attend Qur’anic education only 7.5% attended tertiary institution. Based on the results
presented, it can be considered that fishermen, processors in the study area were operated small scale, because both have
low level of formal education to use modern techniques of catching fish and processing along the value chain. Fishermen
in the study area were found to be productive because they gave a mean gross margin return of #74350 at the period of
raining season. All the stakeholders were found to be relatively efficient to the business operation. Dwindling of the dams,
lack of effective processing and storage facilities, inadequate credit facilities, high cost of transportation, bad road
network were identified as the major problem prevailing among the actors in the fisheries enterprises in Kano state.
REFERENCES
[1] Adekoya, B.B. and Millers, J.I.R. (2004). “Fish cage culture potential in Nigeria”. An Overview National
Agriculture Magazine Published by Fandatom. Consultants Limited, Abuja.
[2] Bello MO (2000). “Categorization of Potential Adopters for Organic-Based Fertilizer Among Vegetable Farmers
in Ojo LGA State. B. Agric. Project University of Lagos Agriculture, Abeokuta.
[3] Food and Agriculture Organization (2002).The State of World Fisheries and Aqua culture.FAD Fisheries
Department, FAD Rome, Italy.
[4] Federal Department of Fisheries (2004).Fisheries Statistics of Nigeria.Federal Department of Fisheries. Federal
Ministry of Agriculture, Abuja.Federal Republic of Nigeria (2007). Official Gazette No. 24 volume 94 published
bythe Federal Government Printing Press, Lagos, Nigeria.
[5] Fabusoro E, Lawal-Adebowale OA, Akinloye AK (2007). A study of rural livestock farmers’ patronage of
veterinary services for healthcare of small farm animals in Ogun State. Nig. J. Anim. Prod., 34(1&2): 132-138.
[6] George FOA, Olaoye OJ, Akande OP, Oghobase RR (2010). Determinants of Aquaculture Fish Seed Production
and Development in Ogun State, Nig. J. of Sustainable Dev. in Africa 12(8):2010 ISSN: 1520-5509 Clarion
University of Pennsylvania, Clarion, And Pennsylvania.
[7] Investopedia (2011): http://www.investopedia.com/terms/v/valuechain.asp, Access date: May 16, 2011.
International Journal of Novel Research in Humanity and Social Sciences Vol. 2, Issue 1, pp: (72-83), Month: January - February 2015, Available at: www.noveltyjournals.com
Page | 78 Novelty Journals
[8] Jim, M. and Tunde, A.T. (2004).“Opportunities in Aquaculture and Fisheries”. Fisheries farming big industry in
the future. National Agriculture Focus. Vol. 1 No.4. Pp10. An Agricultural News Magazine Published by
Foundation. Constant Limited, Abuja, October Edited.
[9] Kaplinsky R, Morris M (2000). A Handbook for Value Chain Research, International Development Research
Center (IDRC), Canada
[10] Malgwi (2000). Economic Analysis of Fish Production in DadinkowaGombe State, unpublished MSC thesis
Department of Agricultural Economics and extension, Federal University of Technology Yola Adamawa State.
[11] Mele C. (2007) Economic Analysis of Fresh Fish Marketing InDadinkowa, Gombe State. Unpublished MSC thesis
University of Maiduguri, Maiduguri Nigeria.
[12] National Population Commission (2006). Population Census of the Federal Republic of Nigeria Report at the
National Level Census Report. Pp. 30 – 35.
[13] Rim, O. (1992).Nigeria National Livestock Resources Survey. (Vol. IV) Report by Resources Inventory and
Management Limited (RIM) to FDL and PCS. Abuja, Nigeria. Retrieve from http://www.fao.org/wairdoss/
ilri/*5548e/*5548e09.html#top of page. October 2012.
[14] Sule O.D and Raji, A. (2006) Socio economic survey of woman in Artisanal fisheries in lake chad area a case
study of kukawa.NIFFR.1998 Annual Report. 195 – 203.
[15] Taiwo, E. (2008). Market Integration and price Exogeneity in Dry Fish Marketing in Nigeria.Pp23-27.
[16] Tobor. J, L. (1991). A fishery Research Activities in Nigerian Institute for Oceanography Research for sufficiency
in fish production in Paper presented the fourth the Annual seminar of the committee of Directors of Research
Institutes (CODRI), NIOMR, Lagos Dec. 10.1991.
APPENDIX - A
Table: 1. Socio-economic characteristic of fisheries stakeholders in Kano State
Household size range Frequency Percentages
1 – 5 35 43.75
6 – 10 25 31.25
11 – 15 10 12.50
16 – 20 5 6.25
21 – 25 4 5.00
Total 80 100.0
Source: Field Survey (2014)
25 - 34 years 27%
35 - 44 years 46%
45 - 54years 16%
55 - 64years 10%
65 - 74years 1%
Figure 1: Age ranges of the Fisheries stakeholders in Kano state
International Journal of Novel Research in Humanity and Social Sciences Vol. 2, Issue 1, pp: (72-83), Month: January - February 2015, Available at: www.noveltyjournals.com
Page | 79 Novelty Journals
Table: 2. Gender and Educational Status of fisheries stakeholders in Kano state
Variables Category Frequency Percentage (%)
Gender Male 42 52.5
Female 38 47.5
Total 80 100
Educational Status Primary 15 18.75
Secondary 25 31.25
Tertiary 6 7.5
Qur’anic 24 30.00
Adult 10 12.5
Total 80 100
Source: Field Survey (2014)
Table 3: Membership of Fishing Organization by Fishermen in Kano state
Membership Frequency Percentage (%)
Yes 21 70.00
No 9 30.00
Total 30 100.00
Source: Field Survey (2014)
Table 4: Other Livelihood Activities Engaged by the Respondents
Other Livelihood Activities Frequency Percentage (%)
Farming 30 47.62
Civil service 7 11.12
Livestock rearing 22 34.92
Trading 4 6.34
Total 63 100.00
Source: Field Survey (2014).
0
2
4
6
8
10
12
1 – 5 6 – 10 11 – 15 16 – 20 21 – 25
Num
ber
of
Fis
her
men
Years of Experiences Figure 2: Variation in years of experiences of Fishermen in Kano
state

International Journal of Novel Research in Humanity and Social Sciences Vol. 2, Issue 1, pp: (72-83), Month: January - February 2015, Available at: www.noveltyjournals.com
Page | 80 Novelty Journals
Table 5: Processing of Fish after catches by Fishermen in Kano State
Preservation Frequency Percentage (%)
Yes 9 30.00
No 21 70.00
Total 30 100 .00
Source: Field Survey (2014)
Table 6: Method of Processing of unsold Fish by Fishermen in Kano State
Method Frequency Percentage (%)
Smoking 4 44.44
Sundry 2 22.22
Frying 3 33.33
Total 9 100.00
Source: Field Survey (2014)
Table 7: Profitability of Fish caught and value / week
Source: Field Survey (2014)
Table 8: Major Occupation of the Respondents (Fish Processors)
International Journal of Novel Research in Humanity and Social Sciences Vol. 2, Issue 1, pp: (72-83), Month: January - February 2015, Available at: www.noveltyjournals.com
Page | 81 Novelty Journals
Table 9: Membership of Cooperative Society of Fish processors in Kano State
Source: Field Survey (2014)
Table 10: Forms of Fish Processing by Fish Processors in Kano State
Source: Field Survey (2014)
Table 11: Sources of Fish used for Processing by Fish processors in Kano State
Source: Field Survey (2014)
Table 12: Categories of buyers from Fish processors in Kano state
Source: Field Survey (2014)
Table 13: Units of Measurement for purchase used by Fish processors in Kano state
Source: Field Survey (2014)
International Journal of Novel Research in Humanity and Social Sciences Vol. 2, Issue 1, pp: (72-83), Month: January - February 2015, Available at: www.noveltyjournals.com
Page | 82 Novelty Journals
Table 14: Sources of Market Information enjoyed by Fish processor
Source: Field Survey (2014).
Table 15: Preferences of Fish Type by Consumers in Kano state
Type Frequency Percentage (%)
Imported frozen fish 6 30.00
Capture fish 9 45.00
Aquaculture fish 5 25.00
Total 20 100.00
Source: Field Survey (2014)
Table 16: Preferences of Fish Species by Consumers in Kano state
Species Frequency Percentage (%)
Catfish 12 60.00
Tilapia fish 4 20.00
Sardine fish 4 20.00
Total 20 100 .00
Sources: Field Survey (2014)
Table 17: Fishermen Constraints in Kano state
Fishing Constraint Frequency Percentage (%)
Restrictions by the dam 10 33.33
Aquatic vegetation menace 4 13.33
Reduction in catches (sizes and numbers) 8 26.67
High cost of fishing gears 4 13.33
Losses due to deterioration 1 3.33
Inadequate capital 3 10.00
Total 30 100.00
Source: Field Survey (2014)
International Journal of Novel Research in Humanity and Social Sciences Vol. 2, Issue 1, pp: (72-83), Month: January - February 2015, Available at: www.noveltyjournals.com
Page | 83 Novelty Journals
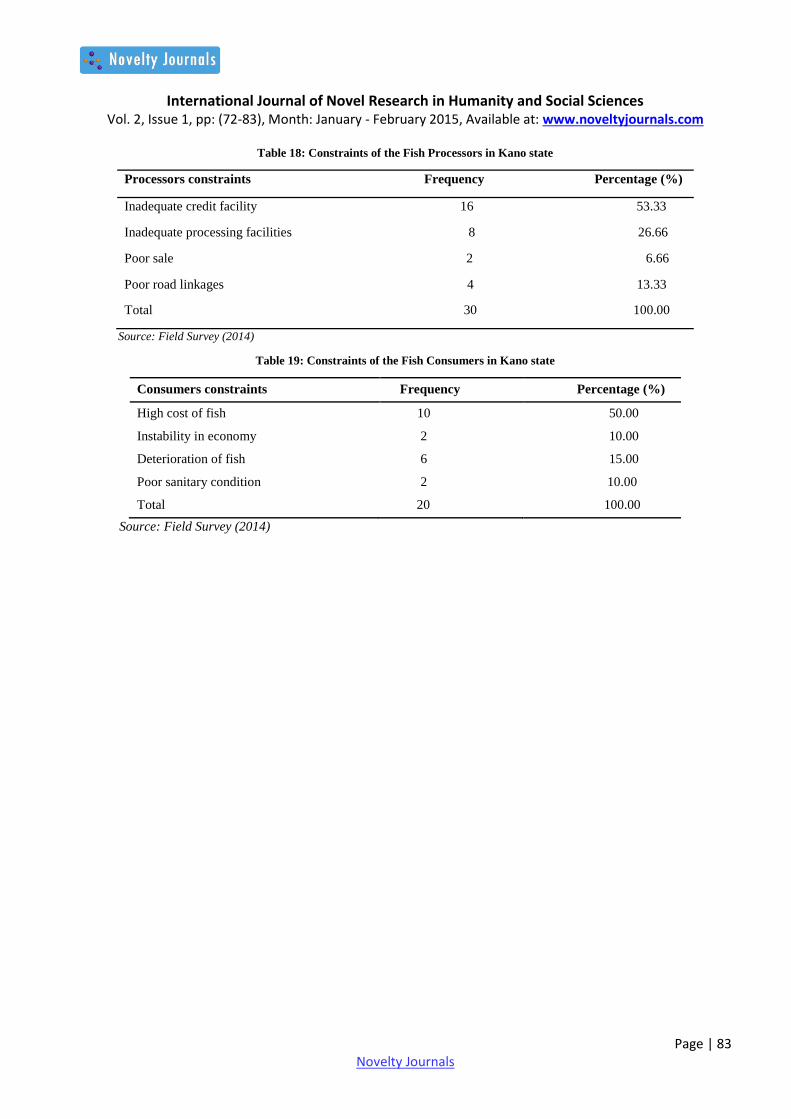
Table 18: Constraints of the Fish Processors in Kano state
Processors constraints Frequency Percentage (%)
Inadequate credit facility 16 53.33
Inadequate processing facilities 8 26.66
Poor sale 2 6.66
Poor road linkages 4 13.33
Total 30 100.00
Source: Field Survey (2014)
Table 19: Constraints of the Fish Consumers in Kano state
Consumers constraints Frequency Percentage (%)
High cost of fish 10 50.00
Instability in economy 2 10.00
Deterioration of fish 6 15.00
Poor sanitary condition 2 10.00
Total 20 100.00
Source: Field Survey (2014)