the selection and design of mill liners - · pdf filemines (wa) 36ft sag mill the number of...
TRANSCRIPT

Powell, M.S., Smit, I., Radziszewski, P., Cleary, P., Rattray, B., Eriksson, K., Schaeffer, L. 2006. The Selection and Design of Mill Liners. In Advances in Comminution, Ed. S.K. Kawatra. ISBN-13: 978-0-87335-246-8, Society for Mining, metallurgy, and exploration, Inc., Colorado, USA. pp. 331-376.
The Selection and Design of Mill Liners
Malcolm Powell*, Ian Smit#, Peter Radziszewski§, Paul Cleary†, Bruce Rattray+, Klas-Goran
Eriksson‡ and Leon Schaeffer٭
*Mineral Processing Research Unit, University of Cape Town, Cape Town, South Africa, [email protected] # Anglo Research, Johannesburg, South Africa § Department of Mechanical Engineering, McGill University, Montreal, Canada † CSIRO Mathematics and Information Sciences, Clayton, Victoria 3169, Australia + Castech Solutions, South Fremantle, Perth, Australia
‡ Mill Linings Systems/Technical Support, Metso Minerals, , SE-934 81 Ersmark, Sweden ٭ Mill linings, Weir Rubber Engineering, Salt Lake City, UT 84126, United States of America
ABSTRACT
Dramatic shortcomings of mill liner designs, especially of large SAG mills, - such as rapid failure and even mill shell damage arising from impacting of the charge directly on the liner, and unsuitable spacing of lifter bars yielding unfavourable compromises between lifter bar height and liner life - have highlighted the significance of correct mill liner selection. Liners protect the mill shell from wear and transfer energy to the grinding charge, and a careful balance is required to optimise these conflicting requirements. This review serves to highlight these problems and how they can be tackled in a logical and often inexpensive manner by considering charge trajectories and liner spacing criteria, in conjunction with liner wear monitoring.
An overview is given of the principal types and materials of construction of mill liners. Examples of good and bad liner design are given, followed by a rigorous approach to liner design based on the best technology available, combined with experience and logical engineering thinking.
Methods of monitoring the progressive wear of liners, and relating this to the performance of the mill are presented. The value of wear monitoring in ongoing liner optimisation and cost saving, through balancing the lives of the lifters and shell plates, and providing reliable comparative data for testing different liner materials and designs, is explained. Wear testing techniques and their drawbacks and limitations are discussed, along with new tests under development.
The contribution of advanced computation techniques, such as the Discrete Element Method (DEM), to predicting the wear profiles of liners, and integrating this information into optimising the overall performance of the mill from a production and cost perspective, are considered in some detail. This takes into account the change of the charge trajectories, energy transfer, and milling efficiency, as the mill liner wears and the profile changes.
It is hoped that this review will better arm mill operators to select suitable mill liners, with a view to decreasing production costs while maintaining mill performance near optimal levels.

INTRODUCTION
Poor liner design has a detrimental affect on milling performance and on liner life, (Powell 1991b). This results in a loss of revenue and increased operational costs. Reduced milling efficiency can result in excess power usage and decreased recovery of the valuable minerals. Excess liner wear results in exorbitant liner materials costs, and excessive downtime which reduces mill availability and impacts on plant throughput. For a plant with a number of mills this also entails the employment of extra mill relining staff and the risks and costs associated with frequent relining. Optimised liner design can be used to strike the best economic balance between liner life and mill grinding performance, thus enhancing the profitability of a mining operation.
Protection of the mill shell from the aggressive impacting and abrasive environment inside a mill is well known as the primary purpose of mill liners. Generally the liners fell under the Maintenance and Engineering Department, where the objective was to utilise a liner that lasted as long as possible, or was as cheap as possible, or of course preferably both. Liners were treated merely as a cost overhead, and a cause of downtime, and the maintenance approach has been to reduce the cost, while remaining within acceptable downtime constraints. Cost saving lead to the development of profile liners and lifter bars, as these dramatically increase the life of the liner. The downtime constraints and high stresses in large SAG mills helped to drive the development of greatly improved liner materials. However, this cost engineering approach ignored the mill performance and overlooked the other key function of mill liners.
The second primary function of a liner is to transfer rotary motion of the mill to the grinding media and charge. After all, it is the interface between the mill and the grinding charge. Although work on the grinding action in mills was published 100 years ago (White 1905 and Davis 1919), the first publication on the influence of liner design on the charge motion only appeared in 70 years later (McIvor 1983). With the advent in the eighties of larger and larger SAG mills running in single stream circuits, it became apparent to the operating staff that the liner was having a significant influence on mill performance. This had been hidden previously by the regular changing of liners over a number of mills in the older plants that had many mills in parallel. In fact this is generally still the case in the multi-stream plants, where mill liner design and selection is only tackled on a cost consumables basis. However, the gains to be had through good liner design and selection are just as great as on the large SAG mills.
This paper looks at recognising problems in liner design and selection in existing operations, and then at liner selection for new applications.
TYPES OF LINERS
Design and structure
The design of a liner is driven by the material of construction and the application, and limited by casting, moulding, and handling constraints. For large mills with wide inlet trunnions, in excess of 1.5m, liner handling machines are now in common use, and this has allowed the evolution of large integral liner blocks, weighing up to 1.5 t a piece, Figure 1. This holds great advantage for minimising relining time, as there are fewer blocks to handle. For example at the Kalgoorlie Consolidated Gold
2

Mines (WA) 36ft SAG mill the number of Outer Head Liners was reduced from 36 to 18 pieces and in doing so reduced the time to replace them by 9 hours at a cost downtime saving of about U$25,000 per hour. In this case the liners sections are 3.5 t each.
For smaller mills the liners have to be handled and installed manually, so smaller blocks with removable lifter bars are generally favoured, Figure 2. A list of the primary types of liners is given, with comments on their application, advantages and disadvantages:
1. Solid Liners - These have an integral lifter and liner, as shown in Figure 1. These have fewer pieces and are easier to install, but tend to have a high scrap weight as once the lifter section is worn down liner performance drops and necessitates change out.
2. Removable lifter – The lifter can be changed rather than the complete liner, Figure 2, thereby maximising liner life and assisting in manually relined mills. More pieces have to be installed and liners can move during relining and if not well secured against the backing liner the lifter can shift and work loose, this is especially a problem if the bolts begin to stretch.
3. Grid Liners A system that appears to be unique to Southern Africa, is pocketed grid liners, where the grinding media packs in the grid structure and forms an integral part of the liner, Figure 3. Often the liners have a flat profile, suited to the high speeds (85% to 90% of critical) that most of the older mills operate at. These liners have been demonstrated to be economically unbeatable for highly abrasive ores in small to medium size mills (Powell 1991b). They are light in weight and make use of the grinding media hardness to provide an effective wear material. They need to be manufactured in Manganese steel to wedge the steel balls, but the manganese steel spreads on impact and can make removal difficult. There is also the safety aspect to consider, of the risk of balls dislodging when the mill is entered for inspection or relining. The liners do require a thorough hosing down to prevent this.
4. Wedged liners – These were common in the first half of the last century, but are dangerous to install and no longer used. What is used now is liner blocks wedged in by bolted lifter bars, which allows simple castings of the liner blocks.
5. Integral wave blocks – These are commonly used in ball mills, and the profile of the liners has become sufficiently sophisticated to enable the liner profile to be maintained as the liner wears.
6. Uni-Direction Profiled Liners – The lifter has different leading and trailing profiles, Figure 4. The profile can be better customised to suit mill speed and filling and therefore optimise performance, and it allows more material in the lifter for a given base width, but the mill must only run in one direction.
7. High–low double wave ball mill liners – These are a refinement of the wave liner, Figure 5. This was applied to Cadia Hill Gold Mine through evaluation of their existing wear profile and wear rate, and provided a more consistent wear profile through the liners working life. The correct wave face angle needs to be calculated and applied as an incorrect angle could lead to ball segregation and loss of grind.
3

An indication of our limited ability to accurately ‘design’ liner profiles is that few liners are optimal at original installation or in the post-commissioning set, and it is imperative as a user to vigorously pursue the improvement of the design, to get the most out of the liners.
Figure 1. Solid steel liners with integral lifter bars
Figure 2. Removable lifter bars
4
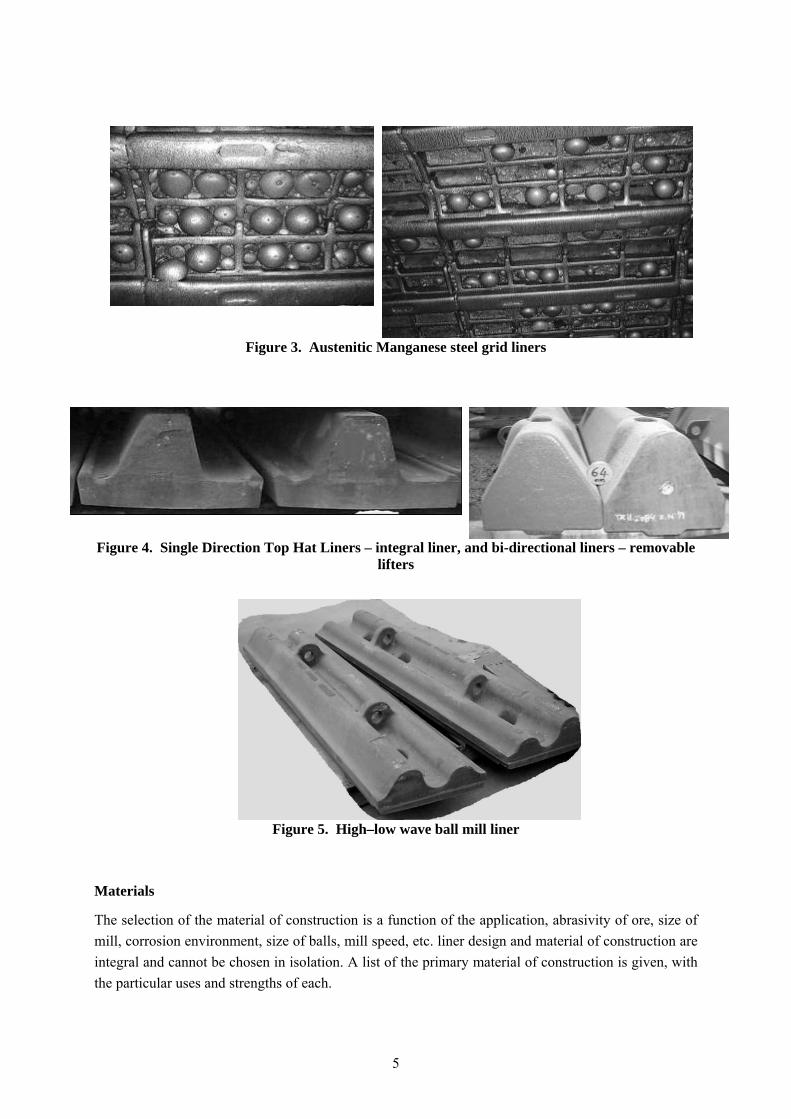
Figure 3. Austenitic Manganese steel grid liners
Figure 4. Single Direction Top Hat Liners – integral liner, and bi-directional liners – removable lifters
Figure 5. High–low wave ball mill liner
Materials
The selection of the material of construction is a function of the application, abrasivity of ore, size of mill, corrosion environment, size of balls, mill speed, etc. liner design and material of construction are integral and cannot be chosen in isolation. A list of the primary material of construction is given, with the particular uses and strengths of each.
5

1. Austenitic Manganese steel (AMS): This is used for grid liners, and generally smaller mills. Its great advantage is that it work hardens under stress, yet the substrate remains tough and can withstand extreme impacting without fracture. Its primary disadvantage is that it spreads with impact, so solid liners begin to squeeze together and become extremely difficult to remove, and can damage a mill shell if the stress is allowed to build up to an extreme level.
2. Low Carbon Chrome Moly Steel (300 to 370BHN): Was generally used for mill liners (AG, SAG and Ball) prior to the movement to higher carbon content steels. It has excellent wear characteristics with some impact resistance, generally now used for discharge grates where slightly better impact resistance is required compared to the higher carbon chrome moly steels or for thinner section liners.
3. High Carbon Chrome Moly Steel (325 to 380BHN): This steel is now considered the main material used for SAG mill liners. There are a number of variations with either different carbon or chrome contents. The variations tend to have a bearing on the size of the liner and its section thickness. There is ongoing development within this area as the size of the liners are outstripping the properties provided by the standard high chrome moly steels.
4. Nihard Iron (550BHN): The use of this type of material generally began with Rod Mills and Ball Mills, where impacts were considered low enough for this brittle yet highly abrasive resistant wear material to perform well. However, it is now considered obsolete in light of the use of high chrome irons and chrome moly white iron.
5. High Chrome Irons (+600BHN) Cr Iron: It is considered to have superior wear abrasion characteristics, and is generally used in rod and ball mills. It is more cost competitive but more brittle than chrome moly white irons.
6. Chrome Moly White Irons (600 to 700BHN) WI: This cast material is considered to be the ultimate developed and used to date for abrasion resistance in Milling. It is commonly used in cement mills and some of the largest Ball Mills in the world and where performance has not been bettered to date.
Rubber liners
As the interplay of material and configuration is especially significant in rubber liners they are addressed in some detail.
Over the last half century, rubber mill linings have been used successfully in secondary and regrind milling applications and are specified today for these new applications, Figure 6. However, now with improved materials and computer aided design programs they are being used more and more in primary grinding applications. In addition to its abrasion resistance it is also resistant to most chemicals (Elastomers 2002).
The more technical term for rubber is “elastomer”. A good elastomer or rubber for a mill liner would have a elongation of 500 to 600% which means it can be stretched from 5 to 6 times its length without any damage. To go along with this the tensile strength should be around 20.68 MPa (3000 psi). The third important physical characteristic is hardness, and this should be between 55 and 70 durometer on the A scale.
6

The material used for a rubber mill liner usually consists of a blend of a natural and synthetic rubber. In some applications the material may be all synthetic. The mixture of the rubber and synthetic materials plus various chemicals and fillers is called a ”compound.” Each rubber mill lining manufacturer has their own recipes for their compounds as well as their own designation.
In designing a rubber lining, the same computer tools as described elsewhere in this paper are used. Whether the lining material is metal or rubber the same type of comminution is required in the charge so the same simulation tools can be used with some adjustments for the lining material. For maximum life, rubber likes to have a 90 degree impact, so this is taken into consideration when designing. Many improvements in rubber compounds have been made over the years but current research and development is providing nanotechnology which should further improve wear life in the future.
Rubber /Steel Composites. Rubber and steel has been used successfully in many applications. In some cases the rubber and metal can be separate components, i.e. metal lifter bars and rubber plates. Over the last two decades more emphasis has been placed on metal capped rubber lifter bars, Figure 6 and Figure 7. The material used for a metal cap is similar to that used for a metal lining but hardened steel plate can also be used. The joining of the metal and rubber has to be with a chemical bond plus a mechanical type attachment to be assured of a positive fastening of the two materials for the life of the component.
With the use of computer simulations and careful inspection of the existing wear profile a greatly improved liner design can be generated. Thus all high, or high low, or lower sloped lifters, are recommended for different applications, as illustrated in Figure 7. Rubber is 1/7 the weight of metal and in many countries the cost is less so it very beneficial to utilize rubber wherever possible. By strategically placing the metal cap material with the minimal amount of metal, the best economy can be obtained. Some applications require a metal leading face only. Others require a metal face and top protection, Figure 7.
Figure 6. Rubber lining in a ball mill and feed head metal capped lifter
7

Figure 7. configurations of Metal-capped rubber liners
One of the features with combination linings for Ball Mills is the fact that the configuration of the lining, and thus the lifting action transferred to the charge, will remain constant throughout the life of the lining. With solid linings the lining will wear more on the lifting portion and become smoother with less lifting action as it wears down. The different wear characteristics of the two materials in Skega Poly-Met™ make it possible to design a lining that will maintain its profile throughout its life, as illustrated in Figure 8.
Figure 8. Designing steel-capped liners for even wear
Magnetic liners
The lining system consists of permanent magnets embedded in a rubber moulding. The powerful magnets keep the lining in place without liner bolts and ensure that the lining attracts magnetically susceptible material available in the mill, Figure 9. The particles attracted to the surface of the magnetic lining form a thin continuous layer in a wave profile.
8

Figure 9. Magnetic liner (Metso Orebed)
The total thickness of the lining including the wear layer is much less than that of a conventional lining. The mill will thus have a larger effective diameter. The lining configuration is ideal for fine grinding giving an efficient grinding performance in these applications. A combination of above described features have resulted in higher throughput (or lower energy consumption) and in several cases a lowering of media consumption by at least 10%.
Because of the complicated manufacturing process the magnetic liner elements are much more expensive than a conventional rubber lining, but in ideal application the wear on the lining is almost negligible and therefore can give years of trouble-free operation.
The limitation for this lining concept is that the magnets are not very resistant to impact as they are brittle. They are suitable in mills of 12 feet or more in diameter using maximum one inch balls and mills under 12 feet in diameter using maximum one and a half inch balls. Magnetic liners have been successfully utilised in vertical stirred mills.
An example of the application of the Metso Orebed lining is at the LKAB Kiruna Iron ore operation in Sweden (Tano 2005). A test on the primary ball mill showed that the conventional Poly-Met lining slightly outperformed the orebed lining in terms of a 0.5 tph higher throughput, so the plant remained with Poly-Met. However, they installed the orebed lining in all pebble mills, where they have successfully operated for over 10 years without any maintenance or replacement. Figure 10 shows the liner with the coating of magnetite ore and slurry. It was concluded at the site that the magnetic lining works well for secondary grinding, where abrasion is more important than impact.
9

Figure 10. Orebed liner in secondary ball mill, and a single panel
SO HOW GOOD IS CURRENT DESIGN?
Liner installations have resulted in variable performance, from outstanding to disastrous. This range indicates the potential of good design and application, and the potential in the case of poor installations. In this section a few case studies are given that highlight this range, what was identified as the cause, and the lessons learnt.
Good examples
A description is given of a few examples of successful liner design applications, that highlight key design aspects that lead to this success.
• Cadia Hill Gold Mine 40ft SAG Mill - Reduced Rows. The primary objective was to reduce the packing of material between the existing high/low liner design. A 2/3rds row design was installed which allowed for increased spacing between lifters and thus the use of a larger release angle. Packing was eliminated and mill was able to run at a higher speed, thereby increasing grinding performance and reducing ball breakage.
• Codelco Andina 20ft Ball Mill – High/Low Ball Mill Liners (WI). The objective was to increase liner life, thereby increasing plant availability and reducing running costs. The high-low wave profile liner developed at Cadia was installed in Cr Mo White iron. The mill operating performance was not hampered, yet liner life increased by more than 50% over the previous sets of double wave liners that had been in use.
Bad examples
Some disasters with the emphasis on cause, and the lessons learnt are presented.
10

• Large Diameter SAG Mill in South America – Pulp Lifter Design. The outer pulp lifter had not been designed correctly to allow for ease of removal without the need to remove the shell liners adjacent to it. This arose from a lack of knowledge of how relines are carried out and the importance of timely removal during shutdowns. This highlights the need to discuss liner design changes or new concepts with the maintenance crews and re-liners so as to detect design retailing flaws.
• Large Ball Mill – White Iron Liners. The existing liner design had always been constructed from high carbon chrome moly steel, however to increase liner life the move was made to use chrome moly white iron. However, during installation the liners cracked severely. Bolt Hole details had remained unchanged, but on close examination the bolt hole profile was found to not be a tight fit with the liner bolt. This allowed pin point loading to occur, which acted like a guillotine, cracking the liners down the bolt hole centre line, as illustrated in Figure 11. This demonstrates the need for a full re-evaluation of the liner design, with close attention to fit faces (curves, angles, etc.), clamping face, lifting lugs, and bolt hole shape when changing liner material.
Figure 11. bolt hole cracking
• Peened, dimpled, and cracked SAG liner. Liner in a 24ft SAG mill, illustrated in Figure 12.
Figure 12. Heavily dimpled, peened, and cracked liners
The mill was found to have the correct lifter profile and filling, but the feed was excessively diluted (to assist in flushing feed through a poorly designed feed chute). From listening carefully to the mill (in the absence of a proper microphone system) it was concluded that the angle of repose of the charge was abnormally steep, resulting in the toe being very low in the mill. The dilute charge also
11

significantly removed the padding influence of the charge contents. The feed chute had to first be reconstructed, before this problem could be resolved.
It is difficult to comprehend, given the number of SAG mills in operation globally, that the design of SAG mill liners is still largely troublesome. A number papers from the SAG 2001 conference papers (SAG’01 2001) refer:
• Candelaria: “Liner design progressed from 72 lifter rail type design, with aggressive face angle, to 36 lifter design with 35 degree face angle. Mill throughput increased by 15%.”
• Alumbrera: “Three years worth of trials have been conducted to optimise lifter geometry. Liner progression from 72 to 48 to 36 rows of lifter bars. Could originally not operate SAG mill at speeds in excess of 70% of critical because of impact on the shell. Operation at reduced speed resulted in low power draw and reduced throughput.”
• Los Pelambres: “SAG mill liner progression from 72 rows with 8 degree face angle to 36 rows with less aggressive 30 degree face angle. Changes allowed for the mills to be operated safely at higher steel loads without increased risk of liner damage. Increased power draw resulted in increased primary mill throughput.”
• Collahuasi: “The original SAG mill liner design, Hi-Hi with a 6 degree contact angle, was changed to a 17 degree angle and later to 30 degree angle. An 11% increase in mill throughput was achieved.”
It is common practice to rely on the mill vendor to supply the liner design. This is quite often a contractual requirement with respect to the vendor guaranteeing the performance of the mill. When the mill does not achieve the required throughout rate, because it has to be operated differently from that originally intended in order to prevent liner damage, most vendors appear to adopt a ‘trial and error’ approach leading to the iterations such as those referred to above. The net result is a lengthy ramp-up time and loss of production.
SYMPTOMS OF POOR LINER DESIGN
When liners are performing to expectation they are usually left as is. It is usually only when they suffer from premature failure, or come under the cost spotlight that they are assessed and the performance scrutinised. This section of the paper provides basic guidelines to assessing whether the liners may require re-evaluation, or identifying possible causes of problems in liners that are known to be problematic.
Noisy Mill
A distinct impact rattling indicates that the grinding media is impacting directly on the liner, rather than on the toe of the grinding charge.
Consequences of balls impacting on the liner:
1. Greatly accelerated liner wear due to high-energy impacts on the liner. For a 5m diameter mill these will be in excess of 8m.s-1, for a 10m diameter mill these exceed 12m.s-1. This causes high
12

chrome liners to spall and crack and they may even fracture. This can reduce liner life from a year to less than a few months. Rubber liners can split and tear under these excessive stresses, especially when worn to partial thickness.
2. Reduced milling efficiency arises from the highest impact collisions occurring against the liner instead of on the toe of the charge – where effective work can take place.
3. Lowered power draw from dilation of the mill charge and the balls returning energy to the mill shell rather than to the mill charge.
4. Ball fracture from the high velocity impacts directly onto steel – an impulse force which many balls cannot withstand. This results in a loss of top-size grinding media and reduced milling efficiency, plus increased ball addition costs.
5. Loosening of liner bolts arising from high stress on the liners stretching the bolts.
Consequences of rocks impacting on the liner: The damage consequences are essentially the same as for ball impact, but the impact forces are lower and less detrimental. Autogenous milling takes place from the larger rocks landing on smaller rocks and transferring their large energy to the smaller rocks, which can then be sufficient to fracture them (Napier-Munn et al 1996). As the high-energy collisions are occurring on the liner rather than on the rocks in the toe of the charge, the milling efficiency is reduced.
Mill listening devices. It is of great advantage to monitor the sound of impacts on the mill shell to warn of direct impacting. This has recently taken a step beyond simple decibel monitoring to full Fourier analysis of the frequency spectrum in research work conducted at the JKMRC (Pax 2001).
Broken Liners
This can arise from media impacting directly on the liner, and is particularly severe for large AG/SAG mills. A high incidence of fracture of lifter bars without corresponding evidence of porosity or casting faults, generally indicates impact breakage.
Excessive Liner Wear
If the liners have a low or flat profile this generally indicates excessive slip of the grinding media on the liner.
Consequences of excessive slip.
• Liner wear increases substantially, and can show evidence of circumferential grooving of the lining, as seen in Figure 35.
• A substantial loss of energy transfer to the mill. Although a small fraction of grinding may take place at the liner–ball interface, a 10% loss in energy due to slip results in about a 10% loss of energy transfer to the grinding media.
• Reduced mill throughput resulting from reduced milling efficiency.
13

Dramatic Change in Mill Throughput / Product During the Life of the Lining
It is often found that a lining wears through a favourable profile regime. This can occur in a number of different manners:
• Mill throughput drops markedly when new liners are installed. This can indicate an unfavourable new profile, or an excessively thick new lining – to counteract excessive wear from poor liner design.
• Mill throughput peaks during the liner life, usually at the end of the life of the liner. Often a symptom of over-sized lifter bars, or lifters with too vertical a face angle.
• Mill throughput decreases towards the end of the liner life and the liner has a flattened profile – a sign of excessive slip, and the liner should be replaced sooner.
Incorrect Mill Product Size
This can arise from the incorrect tumbling action within the mill.
• Primary mills require a vigorous action with high-energy impacts to fracture the ore. If the action is primarily gentle cascading then a fine product and low throughput would result.
• Regrind mills require a cascading action to maximise the frequency of abrasion interactions. High-energy impacting wastes energy, reduces the rate of abrasion interactions, and reduces the grinding pressure, thus reducing the ability of the mill to produce fines. This can result in a high recirculating load of over-sized particles and a reduced mill throughput, as limited by the required product size.
PILOT TESTS OF THE INFLUENCE OF LINER DESIGN
It is difficult in a production environment to assess the influence of liner design upon mill performance, as it tends to be a small influence superimposed upon a number of operational variations, especially in SAG milling. Standard pilot tests do not account for the liner design, they use a standard liner profile for all test work, generally designed to give adequate lift to the charge at standard mill operating conditions - 75% of critical speed and 25% filling for SAG/AG milling. In this section a test procedure is presented, that can be applied to batch pilot milling.
To assess the direct influence of liner design on mill efficiency a 1.8m diameter pilot mill was utilised (Powell and Vermeulen 1994). The use of batch milling meant that reasonable size samples (less than 2 tons) of the ore under consideration could be used to provide a rapid test (a few days) of a number of liner profiles.
The mill was operated in batch mode, and the rate of production of final product, minus 75μm in this instance, was measured when the charge size distribution was seasoned and the slurry percent solids was at the equilibrium conditions found in a continuous mill. The results showed a substantial influence of liner profile on the performance of the mill, as illustrated in Figure 13. Differences of up to 30% in the rate of production of fines were measured.
14

Rate of production of fines for different liner configurations at two mill speeds
0.57
0.64
0.71
0.55 0.56
0.78
0.64
0.60 0.60
0.40
0.45
0.50
0.55
0.60
0.65
0.70
0.75
0.80
smoo
th
grid
s
40m
m, 7
0deg
70m
m, 7
0deg
smoo
th
grid
s
40m
m, 5
0deg
70m
m, 5
0deg
70m
m, 9
0deg
rate
, kg/
min
80%90%
Figure 13. Influence of liner profile on mill performance
The test results were sensitive to when the sample was taken. The rate of production of fines dropped in time as a normal charge size distribution and slurry density was attained, and this was at a different time for each type of liner. In follow-on work, (Powell 1993), the technique was refined to sample over the period when a desired slurry density was reached. The particular exploratory technique described in the above work can be improved upon in a number of aspects, but never the less showed the clear influence of liner profile on milling efficiency. The test requires direct correlation studies with production mills to provide a quantitative correlation with the influence in a production mill.
TESTING LINER WEAR RATES
Tests used to predict the wear rate of production liners are notoriously inaccurate, to such an extent that they are misleading rather than informative. The fundamental problem besetting all these tests is reproducing the wear modes present in production mills. The contact pressure, rates of relative movement, and abrasive material properties all play a large role in determining the resultant wear rate. This is to such an extent that a poorly conceived test can easily be out by an order of magnitude and additionally will not rank a range of materials in the correct order. Considering an extreme, a low pressure sliding abrasion test can invert the ranking of tested materials relative to an application under high impact. A predictive wear test must be tuned to the application; a single standard test cannot possibly predict the liner (or ball) wear for a whole host of very different types and sizes of mills. This is a fundamental problem of the Bond wear test, also known as the Pennsylvania Abrasion Test. It was established for, and correlated to, a limited range of similar mills, yet is now expected to provide meaningful results for large SAG mills, well beyond its scope of application.
15

Near-Field-Condition Testing
In near-field-condition testing, it is endeavoured to reproduce the overall action and forces encountered in the application. A test developed by Powell (Powell and Cornelius 1992), utilised the same 1.8m batch mill as for liner profile testing. This could reasonably simulate the wear modes observed on liners in the 5m diameter mills being tested.
Small blocks of the material, 200 x 40 x 80 mm, were clamped onto the top of custom-built lifter bars, Figure 14. A limited, and accurately controlled, surface area was allowed to protrude and be exposed to wear. The rate of wear could then be precisely monitored by progressive mass loss over a period of a test lasting a few days, and requiring less than two tons of ore. The test was not designed to produce an absolute wear rate but rather a relative wear rate against a standard sample, usually the current production liner, used in the test. Once this sample had been calibrated in a production environment the results could be converted to absolute wear rates.
Advantages of this test are:
• Small samples of test material required, less than 1kg
• Up to six different materials can be tested simultaneously
• Short test period, a few days
• Simple sample geometry, rectangles
• Accurate wear rate figures
• Specific to the ore under consideration
• Ball load determines the degree and force of impact wear
0.00
0.50
1.00
1.50
2.00
2.50
3.00
Mild
Ste
el
Aus
teni
ticM
anga
nese
stee
l
High
Cr
Whi
te Ir
on
Mar
tens
itic
Man
gane
sest
eel
Bain
iticM
anga
nese
stee
l
Rela
tive
life
Figure 14. Wear testing mill and relative wear rates results
Laboratory Tests
As mentioned earlier, laboratory tests tend to give misleading results. However, a new test is being developed as part of the AMIRA P9 collaborative research project (Radziszewski 2001). The advance of this work over previous techniques lies in the investigator’s emphasis on duplicating the forces and wear modes found in a production mill. The measurement and isolation of the forces in a mill have long been a stumbling block to this approach, but with the advent of DEM techniques and their
16

application to milling (Rajamani and Mishra 1994a,b; Cleary 1998; Inoue and Okaya 1996; Radziszewski 1986, 1989, 1998; Herbst and Nordell 2001; and Zhang and Whiten 1998), the tools are now available to mathematically derive the required forces. Radziszewski has utilised this computational capability to guide the design of a comprehensive test that accounts for impact and abrasion, utilising the forces derived from computational mathematical derivations. He also incorporates corrosion, thus addressing the three main known causes of material wear (Rajagopal and Iwasaki 1992). This test is still in the developmental stage, and is currently being expanded from grinding media to liner wear testing. The first outcomes should be available from Radziszewski by the end of 2006.
Background. Charge motion models can also determine the forces acting on mill liners, Figure 15a, which can be used together with wear models to determine liner wear, Figure 15b (Radziszewski and Tarasiewicz 1993; Radziszewski 1997).
Figure 15. a) Ball charge forces acting on mill liner b) Bevelled liner profile wear simulation
In the case of liner wear, the main contribution comes from abrasion wear. Abrasive wear, or the volume of material removed, is a function of the applied force, F, and the distance slid, x, and is described using an abrasive grain represented by angle θ, as illustrated Figure 16. An abrasive wheel is used to simulate this mode of wear. The relationship between wear and energy, can be described by Equation 1. where mabr represents metal loss per liner, the energy Eabr is dissipated in grinding on one liner and Hr, ρ are metal hardness and density respectively, and θ is the abrasion grain angle, (Rabinowicz 1996).
17

Figure 16. Abrasion wear description (Rabinowicz 1996)
F
abrr
abr EHπθρ )tan(m = Equation 1
Coupling an abrasive wear model to the abrasive forces and energies acting on a mill liner is at the root of all DEM liner wear models. The model parameters are back-calculated from operating data of observed liner wear behaviour. These calibrated liner wear models can then be used to simulate the effect of wear on modified liner profiles where the liner material is of the same material as the original. The challenge is to determine these wear parameters from laboratory tests and correlate them to operating data. This will develop the capacity to predict the effect of changes of liner materials on liner wear as well as predict the liner wear in greenfield applications.
Abrasion test development. The standard abrasion wheel (Fig. 4) (Misra and Finnie 1980) has been extensively used to investigate abrasive wear under varying conditions, materials and abrasives.
a) General set-up(Misra, Finnie, 1980) b) Initial test apparatus
Figure 17. Abrasion wheel set-up
Gore and Gates (Gore and Gates 1997) first investigated the substitution of the rubber lined wheel with a steel wheel which used an abrasion force between 45 N and 130 N. Radziszewski (Radziszewski 1999, 2002) introduced the use of mineral ore as the abrasive. In these initial tests, it was shown that the abrasion grain angle was a function of the applied force. These tests led to the
18

development of a test capable of applying forces up to a 1000 N. The evolving design of the abrasion experiment has incorporated measurement of the torque acting on the abrasion wheel. The net power consumed by the abrasion wheel is the product of the torque acting on the abrasion wheel and the wheel rotation speed expressed in radians per second. The torque can be used to determine the friction coefficient μ.
Modifying the relationship of Equation 1 to include both the abrasion grain angle function and friction leads to Equation 2. The product μ F x describes the energy lost in abrasion or net energy consumed by the abrasion wheel.
( )( )xF
HF
rabrasion μ
πθ
ρtan
m = Equation 2
Initial test results confirm the need to generate forces applied in abrasion that approach those found in real mills. Figure 18 shows that for similar energies (force x sliding distance for given time) but a range of applied forces giving rise to different energy rates, the wear rate can be significantly different. As the objective is to predict the abrasive wear contributions to liner wear, it becomes important to apply forces representing those found in real mills, hence the critical importance of linking this to realistic DEM simulations of the forces in a mill.
00.10.20.30.40.50.60.70.80.9
1
0 500 1000 1500 2000
Energy Rate (J/s)
Mas
s W
orn
(mg/
s) a-ab-bc-cd-de-e
Figure 18. Mass worn differences for similar energy rates (1045 steel, Ottawa foundry sand).
Future Directions. With the evolution of the abrasion test, the results show promising results that contribute to a better understanding of the parameters affecting wear in tumbling mills. Future work aims to address the contribution of impact wear both to work hardening of mill liners and media as well as the effect of ore breakage on liner wear. The sophisticated outputs of DEM simulations, shown elsewhere in this paper, when linked with wear experiments that can reproduce the simulated wear modes, is undoubtedly the best available technique for development of a truly predictive wear testing methodology.
Plant Trials
These can be used to great effect to select the liner material, and design, most suited to an application. They do however suffer from a number of drawbacks:
19

• They take a long time, usually over a year, to yield results.
• The tests are expensive, the cost of a set of liners that may, or may not, perform well is no trivial matter.
• Downtime of installing and monitoring the liners.
• Results can be inconclusive as plant conditions vary with time.
Monitoring of the installation and removal masses and dates of individually marked and located liner blocks is the best approach to getting reliable results. Monitoring liner wear throughout the test is also a vital component to meaningful comparison. Monitoring two identical mills in parallel before and during the test is a useful technique, as used in assessing a mill with a new liner design, (Powell 1991b), in which a 5% change in throughput was measured.
An alternative method of conducting field trials is to test a number of materials simultaneously in one mill. This gives a direct comparison, but requires sensible test design and wear monitoring to provide useful data. Such a trial was conducted, (Powell 1991b) and provided conclusive data on the wear life, wear rate, and liner cost per ton milled for six very disparate materials – white iron, high chrome white iron, solid Manganese steel, Manganese grid liners, rubber, and mild steel.
Historic Data. In the absence of a reliable test production mill wear data from similar applications is possibly the most useful data to use for assessing the likely wear rates of liners in a new mill. A few points must be borne in mind when ‘looking over the fence’.
• The ore must be similar.
• Similar application: AG, SAG, total mill load, mill speed.
• Obtain data on new and fully-worn masses and thicknesses to obtain the actual wear rates, and compare different materials and sites, which have different fully-worn dimensions.
INFLUENCE OF LIFTER BAR HEIGHT ON LINER LIFE
It is well known that the height of the lifter bar directly influences the life of the liner block as a whole - the higher the lifter bar the lower the wear rate of the liner. The trade-off is in mill production, which drops as the lifter bar height is increased above an optimal height. In assessing the wear of a liner it is useful to monitor the wear of the backing block relative to the height of the lifter bar. This can be used to assess the useful operating height of the lifter bar. In work conducted on monitoring the wear of liners this measure provided a direct correlation between lifter height and liner wear, (Powell 1991b). This is illustrated in Figure 19 which shows a drop of over 40% in liner wear rate when the lifters were renewed from 35 mm to 80 mm in height. This dramatic change clearly showed that the lifters were being left in for too long, and the economy of extending the life of the lifter bars was imposing a more expensive penalty of accelerated wear of the backing liner. The data also show how different materials respond differently to the degree of protection.
The onset of accelerated liner wear can also be used to give a reliable indication of when slip of the charge on the liner begins to occur, with the resultant reduction in milling efficiency. For this test
20

work the wear rate had risen rapidly during the wear of the first set of lifter bars, levelling out when the lifters were about 50 mm high (0.17 Mt point).
Figure 19. liner wear rate after lifter bar renewal, (Powell 1991b)
A further output of thorough liner wear monitoring is being able to balance the life of the lifter bar with that of the backing liner. Whether the lifter bar is removable or integral to the liner, this is an essential piece of data in optimising the life and cost of liners. Ideally the lifter bar and backing plate should wear to minimum productivity height and safe thickness simultaneously. This prevents the scrapping of excess unworn liner and losses in mill throughput while the maintenance manager tries to maximise liner life. The technique can also be used to allow for uneven wear along a mill by designing lifters of different heights along the length of the mill, so as to enable a single change-out routine.
Monitoring the full profile of a liner as it wears is useful in providing the input for calculating the changing charge trajectories as the profile wears, as illustrated in Figure 21. This information can be used to change the operating window of a mill, such as minimum filling and maximum speed, as illustrated in Figure 23 and Figure 24. The monitoring techniques are presented in the mill liner management section.
OPTIMISING LINER DESIGN
It is not necessary to select either a good liner life or a high mill throughput, the two can be optimised simultaneously with suitable liner selection. There are a number of tools available for guiding the design of liners so as to help optimise the profile to suit a particular application. The benefits can be substantial, with dramatic changes in liner life, downtime, and liner cost. At the same time mill productivity can be held around the optimum if the interplay of liner design and mill operation is understood. Tuning liners to an application has many potential benefits:
1. SAG/AG maximise media drop height to maximise impact grinding.
2. Ensure a cascading action for regrind mills.
3. Avoid impact on the mill shell.
21

4. Maximise liner life by providing sufficient protection with lifter bars.
5. Prevent ball breakage by avoiding impacts directly onto the shell.
6. Maximise mill throughput with the correct spacing and height of lifter bars, an essential factor in liner design.
7. Balance liner life and mill throughput with a protective profile of the lining while retaining the correct charge motion of the grinding media.
Successful Applications of Improved Liner Design
There are many cases of successful changes to liner designs, that have greatly increased the liner life and economy. A few examples implemented by Powell follow. At Deelkraal Mine of Goldfields limited, (Powell 1991b), a wave profile liner in a primary single-stage run-of-mine mill had been modified by placing a 100mm lifer bar in the recess. This was a poor design option as the lifter protruded too little and left the main portion of the liner exposed to maximum wear. The author replaced the liners with simple flat profile grids, with 100mm lifter bars. This increased liner life seven-fold, equating to savings in liner costs of over R300 000 Rands and downtime of 100 hours per annum. At Kloof Gold mine liner monitoring (Powell 1991b) indicated that the shell backing plate thickness could be reduced to match one liner plate to two sets of lifter bars, and this yielded a 5% improvement in mill throughput. At Rustenburg Platinum Amandelbult Merensky section closely spaced rows of rectangular lifters in the primary SAG mills were resulting in a loss of mill throughput. The correct lifter face angle was calculated, and the spacing of the lifters corrected by installing alternating high and low lifters, this design is still in use since installation in 1993. Lifter bars with a low 50° face angle were installed over flat grid liners in a primary run-of-mine mill operating at 90% of critical speed at Lindum Reefs Gold mine, (Powell 1994). This increased liner life over five-fold, while maintaining mill production. At Freeport Indonesia, the new 34ft SAG mill suffered severe liner wear and obvious impact on the liners. Morrison (Morrison 2001) examined the problem by applying the MillTraj trajectory equations to verify the source of the problem - overly high lifters with almost no relief angle - and to assess a range of alternative configurations. In the short term, Freeport staff overcame the problem by fitting an available set of low/low lifters (Coleman and Veloo 1996).
In notable cases (generally unpublished) liner life and mill performance have been dramatically improved once inappropriate liner design has been corrected.
UTILISING OUTER CHARGE TRAJECTORIES TO DESIGN LINER PROFILES
A detailed study of the trajectories of the outermost layer of charge in a mill was conducted, and used to test a mathematical model of the trajectories relative to lifter bar height and angle, (Powell 1991a). Based on this validated theory a software program MillTraj (supplied by Liner Design Services) was developed for use in conducting design simulations, (Powell 2000). This predicts the trajectory of the outermost layer of charge, which forms the envelope within which the rest of the charge cascades or cataracts downwards. The primary design criterion is ensuring that the media impacts on the toe of the charge rather than on the mill lining. As discussed earlier, direct impacts on the liner are wasted energy and cause accelerated liner wear. By ensuring that the grinding media lands on the toe of the charge the drop height and energy transfer can be maximised, which is ideal for a SAG mill.
22

The MillTraj software predicts the likely position of the toe of the charge. It is not possible to predict this with great accuracy as it is heavily dependent upon the type of ore, slurry percent solids, ball filling, and other bulk media properties. So a 10 degree range is given that forms a safe area to impact upon. The position of the toe is most strongly dependent upon the mill filling, so selection of a suitable liner design must be according to the operating filling range of the mill.
The other important design criterion for mill liners is the spacing to height ratio (S/H) of the lifter bars. This is to ensure sufficient wear resistance, while at the same time not allowing packing of the charge into a dead area between lifters. This is applicable to SAG/AG mills and primary ball mills, it is less important for secondary ball mills and does not apply to wave linings. The S/H ratio is strongly dependent upon mill speed. Skega developed an empirical formula for this ratio, which they called A/B, which is still widely used (Moller and Brough 1989). The relationship of mill capacity and power draw to liner spacing is illustrated in Figure 20. The S/H ratio varies as the liner wears, so it should start with a low value and finish with a high value when the liner is replaced, a range of Ideal S/H ±1 is considered reasonable. If a suitable S/H ratio cannot be achieved with the number of rows of liners, it is sometimes necessary to resort to a high-low liner profile, so as to achieve a quasi wider lifter bar spacing.
Figure 20. The Skega A/B ratio related to mill capacity and throughput
Utilising Charge Trajectory Predictions
It has been found most informative to present the results in graphical form, as this best illustrates the influence of liner design. The trajectories are illustrated as a stream of ball positions at equal time intervals. The trajectories for a range of different liner designs can be simulated and shown as separate ball paths on one plot for direct comparison. The calculated toe position is used as a reference from which to select a suitable liner design.
23

Lifter bar face angle. This is a crucial aspect of liner design, and if neglected can lead to premature liner failure and loss of mill throughput. The angle is quoted form the base of the lifter, so a rectangular lifter has a face angle of 90°.
Figure 21 shows how trajectories vary with lifter face angle for an 8m diameter mill, with 30% charge filling, running at 75% of the critical speed. Each trajectory is for a progressively lower angle from 90° (rectangular) down to 60°. The impact point is sensitive to the lifter angle, indicating that this is an important liner design criterion. The position of the toe is shown, and trajectories that impact above this are considered unsuitable. For this application the ideal angle is 65°, shallower than may otherwise be selected.
Figure 21. Trajectories for different angled lifter bars
Lifter bar height. The ideal spacing to height ratio at this speed is 4.0, giving an ideal lifter height of 95 mm. For a ball size of 125 mm, the lifter should not be allowed to wear below 60 mm, otherwise slip and accelerated wear begin to take place. If a 170 mm lifter is chosen the midpoint of the lifter is about 115 mm. The lifter has an increasing rate of wear as it is worn down so the half life is likely to be above 120 mm. The 95 mm height will be reached after ¾ of the liner life. So for the first ½ of the liner life the lifters will be unsuitably high for this speed and spacing. This leads to packing between the lifters in the region from toe to shoulder of the charge, the degree of which is dependent upon the stickiness of the ore, resulting in reduced mill throughput. To span the ideal spacing range the new height of the lifter should be no more than 125 mm so alternating rows of high and low lifters would be recommended so as to ensure a lifter height for adequate liner life.
High-low lifters. In this example the new lifters could be 170 mm, and worn low lifters 90 mm. When the lifters have worn to about 120 mm and 60 mm the spacing will be in the ideal range. When the high lifters are worn down to the 90 mm the low ones will be down in the sub 40 mm range. If the lifters are removable then just the alternating rows of worn low lifters can be replaced with high lifters to repeat the cycle. Although this sounds attractive, it has been found by the author that relining teams generally opt for the easier routine of replacing all the lifters less frequently. For integral liners is it not
24

feasible to replace alternate rows, so a larger scrap mass will result from removing the higher liners that still have a lot of life left in them.
It is therefore the contention of the author that the use of high-low lifters is not ideal. Although necessary for many existing applications, new mills should not be designed to require this system, but rather even rows of lifters.
Mill drilling. Mill drilling is generally determined by the mill manufacturer on the conventional formula of: Rows of drill holes = mill diameter in ft x 2 or the Skega modification of subtracting 2 from the conventional formula. These relationships were developed over 20 years ago on much smaller mills than those being currently installed, and the Skega formula already indicated a non-linear relationship. As mill size has increased it has been found from practical experience that these formulae are no longer applicable. A far wider spacing is required to ensure optimal mill performance.
It is proposed that it is more rigorous to select mill bolt hole spacing based on liner requirements than upon a mill size formula. The following example illustrates this approach. A lifter bar height, and liner shell plate thickness are selected to yield a desired liner life. These height calculations are based on manufacturers data bases, plant data, or (in the future) proven pilot and laboratory tests. For the current example the liner supplier may recommend that a lifter wear thickness of 100 mm is required to last a year, with a backing plate wear of 50 mm being sufficient to last the same period. For a minimum lifter height of 70 mm, this yields a new height of 170 mm. The base width of the lifter may be recommended as 160 mm to support this height. The average half life height of the lifters may be about 125 mm, so this is used as the ideal height for calculating lifter spacing. Allowing for the sloping face of the lifter increasing the effective spacing, the ideal number of rows is 36. This is considerably less than the 52 rows that would be recommended by the conventional formula.
The issue of hole spacing has received considerable attention, and a number of mills have undergone dramatic changes in liner spacing over the past five years. For practical purposes, of installation without having to re-drill the mills, these have gone to fitting 2 lifters over 3 bolt holes, i.e. 2/3 of the original spacing. Thus at Cadia the spacing in this 40ft mill was reduced from 78 rows to 52, (Rattaray 2000), after simulation work that included the use of the MillTraj software (Radziszewski and Valery 1999). This has been operating successfully since December 1998, with two liner changes that have included adjustments to lifter bar angle, from 78° down to 60° (Hart et.al. 2001). These changes have eliminated packing and ball breakage, and allowed an increase in power draw and throughput. Similar stories hold for KCGM, Alcoa, and MIM operations, with all the liners successfully in place for a few years. At Alumbrera mine the spacing was increased to every second row, which resulted in a dramatic reduction in liner life, showing that this was too far apart. They then moved to the 2/3 configuration which has now been in since 2000. These instances illustrate that the simple conventional formula is inadequate. These mills now have a number of lifter rows given by 1.3 x diameter in feet. These were by force of circumstance and multipliers in the range of 1.4 to 1.6 seem to be a more appropriate guideline.
The wider spacing between lifter bars has given rise to a new problem in some installations. The backing plates have been suffering from peening and spreading, arising from less protection from the
25

lifters which leaves them exposed to increased impacting. Thus the materials of construction may have to advance with these design changes.
Mill speed. The Trajectory of the media is strongly influenced by the mill speed, Figure 22. If this mill had a variable speed drive then operating at speeds of above 75% of critical for the given load of 30% filling, would result in direct impacts on the mill liner. The liner profile can be selected to suit the mill speed, or provide the best compromise for a variable speed mill.
Figure 22 Influence of mill speed on ball trajectory
Final liner selection. The final liner profile and height selection can be based around the desired operating window of the mill. Figure 23 shows how this was used for a Gold Mine SAG mill. This shows how the mill operating speed can be increased from 70% up to 80% of critical as the lifter angle wears down from 72° to 55°.
Figure 23. Safe Operating Window of a mill as a function of speed, lifter angle, lifter height and mill filling
65
70
75
80
85
50 55 60 65 70 75lifter angle
mill
spe
ed, %
cri
tical
62mm, 30% fill62mm, 25% fill215mm, 30% fill215mm, 25% fill
Mill Control. Understanding the charge trajectories in a mill can provide control guidelines to mill operators, to keep the mill in the correct operating regime and, possibly more importantly, out of the undesirable regimes. A control window was set up for an open-pit Gold mine, Figure 24. This is especially useful in preventing liner damage in the early stages of mining if soft oxidised ore is
26

received, which results in low loading conditions. This control rule can ensure that the mill speed is lowered, feed rate pushed up, and if necessary the mill stopped to protect the liners. For these new high and aggressive liners it was determined that the maximum speed was 75% of critical for the maximum mill filling. Only once the liners were worn in could the speed be moved up, while remaining in a safe operating window. Such a control strategy if implemented at start-up of a SAG mill can prevent the severe liner pounding that the mill liners tend to receive with subsequent liner failures and even mill damage and major shut down and repair periods. As absolute load is a function of ball filling for a given mill filling the derived curves are subject to recalibration, which should be a standard function of mill maintenance.
Figure 24. Safe operating range as a function of mill speed and filling for an example mill with new high lifters with an aggressive face angle
67
68
69
70
71
72
73
74
75
76
200 220 240 260 280 300
Load ce ll, t
mill
spe
ed, %
cri
t
safe
maximum
Line calibrated at 2% ball charge.5385 kW , 267 t, 30.3% fillingupdate calibration if ball load changesindicated by power, loadcell, and filling correlation72deg lifter
Summary of Optimising Liner Design
Liners can be tuned to suit the application of each particular mill. A primary input to this is the profile of the liners. This can be selected to provide a suitable grinding action throughout the life of the liner and to enhance liner life. One does not have to select either a good liner life or a high mill throughput, the two can be optimised simultaneously with suitable liner selection. The direct influence of liner design on mill efficiency was studied in a 1.8m diameter pilot mill (Powell and Vermeulen 1994), in which a difference of up to 10% in the rate of production of fines was measured. Design guidelines are summarised below:
1. Maximise media drop height for primary AG and SAG grinding to maximise impact grinding.
2. Ensure a cascading action for regrind mills.
3. Avoid impact on the mill shell by ensuring that the balls and rocks land on the toe of the grinding media.
4. Maximise liner life by providing sufficient protection with lifter bars or an integral liner profile.
5. Prevent ball breakage by promoting the correct cascading action and avoiding impacts directly onto the shell.
27

6. Maximise mill throughput with the correct spacing and height of lifter bars, an essential factor in liner design.
7. Balance liner life and mill throughput by maximising the protective profile of the lining while retaining the correct charge motion of the grinding media.
FULL CHARGE TRAJECTORIES - DEM MODELLING
The Discrete Element Method (DEM) is a numerical tool for modelling the behaviour of discontinuous and particulate systems. The recent advent of affordable high speed desktop computers has made the simulation of complex systems feasible, and hence the increased interest shown by the mining industry to simulate various applications. The general DEM methodology and its variants are well established and are described in review articles (Campbell 1990; Barker 1994; and Walton 1994), and its uses in mineral processing described by a number of authors (Cleary 1998a; Inoue and Okaya 1996; Mishra and Rajamani 1994b; and Powell, McBride, and Govender 2003). The behaviour of the rock and ball charge within a tumbling mill is of express interest as a fundamental understanding of these systems is hard to gain purely from operational experience and small scale laboratory experiments. An important aspect of this is the prediction of equipment wear and its effect on process performance. In this section we describe the process of prediction of liner wear using DEM.
Of particular interest for the holistic design of mills is the effect of lifter wear on the performance of a mill, and the rate at which this wear occurs. Lifter wear results in the charge motion changing over time. The lifter design needs to take the wear factor into account to ensure that the worn lifter profile produces a reasonable charge motion for the purpose of grinding whilst still minimising damage to the shell over the lifetime of the lifter. This effect of wear on charge motion can be directly observed using DEM simulations. Consider the series of DEM simulations of a laboratory mill shown in Figure 25; the first three images show the effect of increasing the mill speed on the charge motion. The last two images show the dramatic effect of varying the face angle of the lifter on the charge motion.
Figure 25. Example of DEM charge motion predictions
A 0.5m slice of a full size industrial mill is simulated next to demonstrate the capability of DEM in contributing to greatly improved liner design. An example of a full mill simulation has been published by Cleary (Cleary 2004). The mill modelled here is a traditional 36’ SAG mill running at 78% of critical speed with 72 rows of symmetric close packed steep face angle lifters (7° from the face),
28

loaded to 30% by volume with a 10% ball charge. Representative SAG mill ball and rock size distributions are used, they are modelled as spheres, and total 185 000 particles of plus 25 mm.1
Charge motion
Figure 26 shows two snapshots of this SAG mill, with the particles shaded by diameter and velocity. The particles near the mill shell rotate with the liner rotation and at moderate speed from the toe position around and up to the shoulder position. The particles between the lifters are thrown in a high dilute cataracting stream which impacts on the liner at around the 3 o’clock position. The cataracting particles accelerate to more than 13 m/s. The impact region of the cataracting stream is well above the toe, even though the mill speed is only 78% of critical. This occurs because the lifters have steep face angles. The majority of the charge avalanches down the steep free surface. The effects of radial segregation are clear with a concentration of fine particles against the mill shell and in the upper part of the cataracting stream. The bulk of the lower part of the cataracting stream consists of larger rocks and balls. Segregation happens to be useful in this scenario as the balls in the cataracting stream are at least on the shallower trajectories and lead to less damaging impacts with the liner. It should be noted that mill speed is a strong driver in determining the type and severity of segregation.
a) particle sizes (dark = fines, light = coarse) b) particle velocity (dark = fast, light = slow)
Figure 26. Slice model of a 36’ SAG mill.
1 The coefficient of restitution used 0.3 for rock-rock collisions, 0.5 for rock-steel collisions and 0.8 for steel-steel collisions. The friction coefficient used was 0.5 for all materials. Using a standard spring stiffness of 106 gives a timestep of 3.4x10⁻⁵ s
29

Liner stresses
Stress and wear data is collected on a high resolution triangular mesh that covers the mill liner. The average element edge length is 20 mm, which is half the size of the smallest particles in the simulation, giving good spatial information about the stress and wear distributions. The contribution of every particle collision with the mill liner is accumulated in the triangular elements in which the collisions occur. This raw data is then aggregated across the depth of the mill slice and spatially smoothed to remove noise on the scale of the particle size. Figure 27 shows a section of the liner shaded by the stress components. These distributions are easier to analyse when presented as a line plot following the surface of the lifter/liner starting from the bottom of the front face, moving up across the top surface and down the back of the lifter and then finally across the liner plate. Figure 28 shows the normal and shear stress distributions along the liner for the SAG mill simulated in Figure 27. In the plot, each section of the lifter/liner stress is separated by a vertical line.
The normal and shear stresses have very similar spatial distributions, but the normal stress is around three times higher than the shear stress. The stress is zero at the base of the lifter (since no particles can make contact with this part of the lifter) and rises steadily with distance up the front of the lifter to a peak occurring near the top corner. This reflects the force transmitted to the front of the lifter as they push into and then lift up the charge. The highest stresses for this new liner actually occur exactly at the corners, but these are not shown in Figure 28 since the magnitudes are much higher and any amount of rounding of the corner by wear will substantially reduce these peaks. The stress along the top of the lifter is relatively constant and about half the level of that at the top of the face. The stress on the back of the lifter is low at about half the level of the top of the lifter. This reflects the fact that only a small proportion of the charge is supported by the backs of the lifters. The stress on the liner plate is higher and increases as the front of the next lifter is approached. Note that there are small well defined peaks near the front and back of each lifter. These occur 18 mm from the corners and correspond closely to the average radius of the particle when trapped against the lifter. The ability to capture such features demonstrates the spatial accuracy that it is now possible to obtain using DEM simulation.
a) normal stress b) shear stress
Figure 27. Stress distributions on the SAG liner. Dark = high magnitudes, light = low.
30

Normal stress (newton/metre^2)
Distance along surface (mm)0 200 400 600 800
0
10000
20000
30000
40000
50000
60000
Shear stress (newton/metre^2)
Distance along surface (mm)0 200 400 600 800
0
5000
10000
15000
20000
Figure 28. Normal and shear stresses along the lifter and liner plate. The distance is measured from the base of the lifter front. Each region (lifter front, top and rear and finally the liner plate)
is separated by a vertical line.
Liner wear distributions
To predict the impact damage on the liner we use two different measures (Cleary 1998a and b). The first is the energy dissipated in the normal direction during collisions between the particles and the liner. The second is a measure of excess kinetic energy of impact. Low speed collisions ( < 0.1 m/s) which are large in number but of limited importance for damage make no contribution to the damage estimate, but high speed collisions do much more damage because of the quadratic dependence on speed. The impact damage measure is shown on the surface of the liner in Figure 29a, and as a line plot in Figure 30 for both impact measures. The distributions are quite different to those of the normal stress distributions. In particular, the wear is substantially higher across the entire top of the lifter with peaks near the corners. There is little impact damage on either front or back faces since they are protected from the cataracting stream by the steep face angles and close lifter spacing. There is some moderately higher wear on the upper part of the leading face that is produced when the lifters crash into the charge in the toe region. The wear on the liner plate is peaked in the middle in the plate. This damage is produced by the penetration of the cataracting stream (and particularly balls) between the lifters where they impact the middle of the liner which is clearly more exposed to impact and so has the highest predicted impact wear rate.
The abrasive wear is also estimated using two measures (Cleary 1998a and b). The first is the shear work which is the energy dissipated by sliding (tangential) interactions between particles and the liner. The second uses the kinetic energy of each collision with the inclusion of a strong angular
31

dependence. This takes account of the fact that collisions at around 22° produce significantly more scouring/abrasion damage than particles sliding directly along the boundary or impacting in the normal direction. Figure 29b shows the abrasion damage prediction on the surface of the liner whilst Figure 31 shows both the abrasive wear distributions as line plots. These are again both quite different to the stress and impact damage distributions shown above. The highest abrasive wear occurs on the front face of the lifter with the wear rate increasing with height up the lifter. This wear will lead to steadily increasing lifter face angle (as one would expect). There is also significant abrasive erosion from the top surface of the lifter which one would expect to lead to steadily decreasing lifter height. The abrasion on the back of the lifter and the liner plate predicted by the shear work is relatively even and around one third of the magnitude on the lifter top. The second abrasion measure gives similar predictions to the shear work for the front and top faces but predicts much lower wear on the liner and the rear face. This lower prediction arises from the much lower weighting given to the many low speed contacts sliding directly along these surfaces. They dissipate a reasonable amount of energy, but this is likely to be an over-estimate, as shown by the second measure. The second measure suggests that the wear will decrease with height down the back face which is reasonable since most oblique impacts will occur during the filling of the space between lifters as they pass through the toe region. There is a in the peak abrasion in the middle of the liner for similar reasons.
a) impact damage b) abrasion damage.
Figure 29. Wear distributions on the SAG liner. Dark = high magnitudes, light = low.
The rate of normal work is around double the rate of shear work. This might cause one to conclude that the dominant erosion mechanism is from impact rather than abrasion. The actual erosion rates, however, must also be dependent on the material properties of the liner and its resistance to impact and abrasion damage. A high quality steel might be expected to be very resistant to impact and erode predominantly by abrasion. The Cleary CSIRO DEM code currently has the capability to evolve the shape of the liner in accordance with the wear rates predicted. However, it is not clear which of these wear rates or which combinations one should use in order to obtain the best quantitative predictions of the wear behaviour. Ultimately, it will be a combination of an impact and an abrasion measure weighted by the resistance of the liner material to each damage mechanism.
32

Normal work (joules)
Distance along surface (mm)0 200 400 600 800
0
500
1000
1500
Impact damage
Distance along surface (mm)0 200 400 600 800
0
100
200
300
400
Figure 30. Impact wear rate along the lifter and liner plate as given by the normal work and an impact damage measure.
Shear work (joules)
Distance along surface (mm)0 200 400 600 800
0
200
400
600
800
Abrasion
Distance along surface (mm)0 200 400 600 800
020406080
100120140
Figure 31. Abrasive wear rate along the lifter and liner plate as given by the shear work and an angular dependent abrasion measure.
33

Effect of liner height on abrasive wear
Figure 32 shows the rate of abrasive wear (using the shear energy absorption) on the liner of this 36’ SAG mill as the lifter height is decreased in 50 mm increments. Initially, (for the original 200 mm lifter shown in Figure 32a) the wear is high across the top surface of the lifter with the peak abrasion occurring on the outer parts of the top surface. There is reasonable abrasion on the front face which decreases with distance down the front face. There is little sign of abrasion on the liner plate as this is protected by the lifter. This distribution is consistent with the line plot shown in Figure 31.
When the lifter height is decreased to 150 mm (Figure 32b), (either as a design change or as a crude representation of the liner wear) there is a significant reduction in the abrasive wear rate on its top surface. The wear is now more concentrated on the front half of the top surface and the peak abrasion rate is reduced by around 25%. There is also a marked reduction in the rate of wear on the front face. The distribution along the front face though remains similar with decreasing magnitude as the liner plate is approached. There is little change to the wear on the liner plate. This indicates that the wear rate of the lifters are higher for new 200 mm lifters and decrease once their height has been reduced.
When the lifter height is decreased to 100 mm (Figure 32c), there is little change to the abrasive wear pattern or the magnitudes compared to the 150 mm case. The wear on the top surface is still weighted towards the front corner of the lifter and the magnitude is similar or perhaps slightly lower than for the 150 mm lifter. There is now a small amount of wear observed on the liner plate, with the higher wear concentrated on the right side just in front of the next lifter. The similarity of the wear for the 100 and 150 mm case indicates that the wear behaviour of a liner can be fairly constant throughout the middle parts of the lifter lifespan.
If the lifter height is decreased further to 50 mm (Figure 32d), then there is a sharp change in the wear abrasive wear patterns and the rate of wear. The abrasion remains highest on the top surface of the lifter and is strongest on the front half of the top surface. The magnitude of the peak wear has risen back to the original level observed for the original 200 mm liner. The wear on the liner plate has also increased sharply, with the peak values found immediately before the next advancing lifter at around 40% of the overall maximum wear on the top surface. This means that the 50 mm lifter experiences significantly higher wear than the 100 and 150 mm lifters. This can be understood geometrically since the median size of the rocks in the mill is 50 mm, meaning that half the rocks are now taller than the lifter and the lifter is no longer able to properly lock into and lift the charge, which now slides much more readily over the liner leading to much enhanced abrasive wear on the front face and the front half of the top of the lifter. This behaviour of accelerating wear near the end of the lifter lifespan is a commonly anecdotally reported phenomena and is demonstrated in Figure 19 of this paper, and this effect is both reproducible and explainable using DEM simulation.
34

a) 200 mm b) 150 mm
c) 100 mm d) 50 mm
Figure 32. Rate of shear energy (abrasive wear) on the liner as the lifter height is decreased in 50
mm increments.
Summary of DEM potential
DEM can be used to predict the charge behaviour and performance of the mill over the lifespan of the lifter. This will allow the liner profile and material to optimised in a more holistic manner, by taking into consideration mill performance and liner cost as an integrated objective function. When linked with a meaningful wear testing technique that can reproduce the wear modes found in the mill, DEM can be used to predict liner wear and profile evolution. This can be used for fast tracking liner selection, assessing new designs and materials, and deriving an optimal balance of liner life and mill performance. Additionally, the time between relining can be calculated.
MILL LINER MANAGEMENT
The lining in a mill serves a dual purpose. It not only protects the shell of the mill from impact and abrasive related wear, but it also transfers the energy to the charge where it is required for breakage.
35

The performance and the cost effectiveness of a mill are thus largely dependant on both the design and care of the mill lining.
Given that the lining normally constitutes a large portion of the operating cost of the mill, it is not commonplace to keep a spare set of liners on site as these are seen as a form of ‘dead capital’. The lead time on procuring a set of liners is also normally in the order of months. Damaging a set of liners can thus be a very expensive exercise when the downtime that could result is taken into consideration.
Despite these risks, the importance of proper liner management is often underestimated. The lining in a mill can be damaged severely in the time period between even weekly liner inspections. Most operations only conduct liner inspections on a two weekly to monthly cycle. It is thus very important that mill operators understand and manage these risks by conducting proper mill liner inspections and by placing sufficient emphasis on the safe operation of the mill.
Liner Wear Measurement
As with most processes, optimisation does not come without measurement. By monitoring the change in the liner profile with time, valuable information regarding the wear rates of the different facets of the lining allow for the refinement of the liner design. Given that the lining in a SAG mill could last for 12 to 18 months, the optimisation of the liner profile for a particular mill could take a number of years. A dedicated and ongoing measurement effort is thus required in order to achieve success in this regard.
The challenge of obtaining a measure of the profile of a liner is easily overcome with the use of the simple yet highly effective mechanical gauge, Figure 33. By measuring the length of the rods that are displaced when an imprint of the liner profile is taken, it is possible to present the liner wear data graphically. The change to the profile of a lifter bar with time, in a large SAG mill, is shown in Figure 34.
Figure 33. Mill liner profile measurement
An electronic gauge has been developed at the University of Cape Town, with the objective of being able to measure 6 positions along 3 liners in less than 10 minutes. The data is automatically logged
36

and transferred to a liner profile and wear monitoring program. PERI Associates supply an automated electronic gauge driven by a worm gear motor. Metso have a full mill liner profile gauge, which is inserted down the centre of the mill and in a couple of hours can collect a detailed profile along the entire length of the mill. Tools of this nature can be used to collect accurate, reproducible, and reliable data on a regular basis, so as to build up an accurate history of the wear profile of liners.
A critical measurement in addition to the profile is the liner thickness at each end of the profile, which is used to calculate the absolute liner thickness along the profiles. The measurement of the thickness of the liner plate can present considerable difficulties. The author has been on site where the mill reliners over-predicted the liner life by months, based on incorrect liner thickness estimates. This mistake led to catastrophic failure, and extensive mill downtime. For rubber liners the accepted technique is to hammer a nail through the liner and measure the length of the protruding section. This can be done at the joint between steel liners but is slow as it is difficult to find a clear spot in the joints, that are packed with steel slivers and slurry, through with the nail must penetrate. It is all too easy to take incorrect readings, as it is not obvious whether the nail has penetrated to the mill shell. It has been found that even careful measurement of internal mill diameter leads to inaccurate liner thickness calculations, as a small number is being calculated form the difference between two large numbers (diameter inside the shell and inside the liner). An ultrasonic thickness gauge can be used, but its effectiveness is dependent upon the structure of the steel. The signal is seriously attenuated by any porosity, which can result in plausible but incorrect readings, and an expensive high penetration gauge is required to penetrate 100 mm of steel. Based on the expense and unreliability of this route it has been deemed unsuitable. In response to this a measurement indicator that is installed with the liners, and is accurate to 1 mm, is being developed at the University of Cape Town.
It is best to collect data from a consistent set of liners, and in the same place each time, so as to obtain accurate and consistent wear data. Selecting three rows of liners and taking 5 to 6 profiles along each row should be sufficient.
Figure 34. The changing profile of a lifter bar in a 24ft diameter SAG mill
37

Observing the change in the lifter profile with time not only provides an indication as to when to change the direction of rotation of the mill, in the case of a bidirectional mill, but also provides information as to the relative wear rates of the different liner components. It can be seen in Figure 34 for example, that the base section of this liner is wearing at a much lower rate than that of the lifter bar itself. It may thus be possible to design the next set of liners with a slightly thinner base section that would effectively lead to an increase in mill diameter which would possibly have a positive effect on mill throughput. Also, by optimising the distribution of the steel across the profile of a liner, by making observations such as that above, it is possible to derive the maximum wear benefit out of a casting and to minimise scrap at the end of the life of the lining. This can only be made possible through the implementation of a liner wear measurement program.
Mill Liner Inspections
It is good practice to schedule mill liner inspections rather than to conduct them on an ad-hoc basis as and when the opportunity arises. Other routine mill maintenance, such as cyclone maintenance for example, can also be conducted during this period. When conducting mill liner inspections it is also important to look for the following:
• Signs of cracks in the castings resulting from ball impacts
• Raceways or abnormal wear patterns
• Signs of damage around liner bolt holes
• Edge spreading as a result of impact
• Pegging of the discharge grates
• Presence of freshly broken steel balls
• Smallest surviving ball diameter
• Shape of the grinding media
• Presence of excess steel scats
• Loose discharge grates
• Loose liner bolts
Cracks in the castings, dimpled impact marks, and peening of liner edges indicate excessive impacting on the liner, as illustrated in Figure 12. Freshly broken balls are normally indicative of severe ball on liner impact. If any of these conditions are observed it is imperative that the operation of the mill be addressed so as to prevent any further liner damage. Loose liner bolts, normally identified by wet patches on the shell of the mill whilst it is in operation are also indicative of shell impacts.
Abnormal wear patterns in liners normally suggest abnormal mill operating conditions. The operation of a mill with too dilute a slurry charge for example can result in severe slip between the charge and the lining and lead to accelerated wear. An example of this phenomenon is shown for a wave type liner design in a 6MW ball mill in Figure 35. This mill had been in operation for only a number of weeks.
It is good practice during liner inspections to inch the mill periodically in order to obtain a view of all of the liners in the mill. It is not necessary to inspect each liner with a great deal of detail but important
38

to glance over each casting to identify any obvious defects. When measuring liner wear profiles it is important that the same liners are measured each time that the mill is stopped.
Figure 35. Raceways and accelerated ‘pocketing’ resulting from the operation of a ball mill with too dilute a slurry charge
LINER DESIGN DETAILING
There are many practical issues that should be taken into consideration when detailing liner design. Seemingly small details in design can be the make or break between a good life and reliability, and a disastrous liner. Some guidelines are given for consideration in liner detailing.
1. Understand clearly what the mill operator wants from the mill performance, life versus performance considerations, downtime intervals and extent, variability in ore, mill filling, mill speed, ball loading, etc.
2. It is wise to discuss potential liner designs with the relining and maintenance crews. Their input and buy-in can make a significant difference to the performance of a liner.
3. The liner designs must be tailored to the materials liners from which they are to be manufactured. For example a high carbon chrome moly steel has different liner design requirements to those of a chrome moly white iron.
4. Proper calculation of lifter wear height versus liner plate thickness is required. This wear ratio needs to be either known or estimated so as to prevent premature failure of either the lifter of the backing plate, which leaves a lot of expensive scrap and a reduced liner life.
5. Liner handler capacity and clamping capability must be taken into account. This controls maximum liner mass, size, and the positioning of handling lugs.
6. Some suppliers are favouring designing the mill drill pattern to be flexible so as to allow the row spacing to be varied over a limited range, so that the optimal row spacing can be selected.
7. It is advisable to allow sufficient (if not more) pulp lifter depth in the liner assembly of SAG/AG mills. Many of these mills have been found to have inadequate discharge capacity over their full range of operation, especially as throughput is forced up over the years.
8. Design in ease of removal of worn liners. It should be assumed that liners could flow together if not protected, and this should be taken into account.
39

9. It is generally prudent to base designs and materials on known current working trends. Although it is not necessary to be too conservative, any changes should be properly assessed in light of current experience with operational liner designs and materials.
Further insights into design detailing are given by Rattray (Rattray 2000).
COMMISSIONING
The commissioning period of a liner often present abnormal operating conditions for a liner, and this should be taken into account when designing the first set of liners for a new mill, especially a SAG mill. It is often not appreciated by the mill operators that the mill should be kept within a certain window of reasonably normal operation during the commissioning period, so as to prevent damage to, and possible premature failure, of the liners.
The challenges facing the commissioning metallurgist often include softer than normal run-of-mine ores, aggressive mill liner profiles, uncalibrated instrumentation/ control systems, and inexperienced operators. In addition to this, the time frame allowed to overcome some of these issues is normally limited owing to an eagerness / pressure to start producing. The commissioning of SAG mills is thus not without risk but with proper planning and preparation the risk can be managed.
Feed Preparation
The early stages of the life of an open cast mine are normally characterised by large volumes of soft overburden or oxide ore. This material is often grade bearing and cannot be discarded. It is important that this is taken into consideration during the design phase of the milling circuit. If it is not possible during the commissioning of the operation to obtain material that is competent enough to establish a load in the SAG mill, it may be necessary to bypass the SAG mill altogether and process this material in the ball mill until such time that the ore competency increases.
AngloGold Ashanti’s Morila circuit was started-up in this manner with the feed diverted from the SAG mill feed conveyor head pulley to a temporary ball mill feed hopper located some short distance away. Converting back to a two-stage circuit required a few chute changes and was completed in a matter of hours. The circuit was operated in this manner for a number of weeks until the competency of the ore increased sufficiently in order to warrant SAG milling. This approach is considered to be good practice in terms of reducing the risk of SAG mill liner damage during commissioning.
Safe Operating Window
Identifying the safe operating window with respect to mill filling and speed is a vital part of the commissioning of large diameter SAG mills. The same applies to the operation of any SAG mill with a new liner profile.
It is often assumed that the newly installed liner is capable of catering for the entire speed range of the mill. Experience has shown that often this is not the case, particularly since it is difficult to design a liner profile to cater for wide speed ranges. Most SAG mills, on commissioning, need to be operated at reduced speeds and higher volumetric fillings than that stipulated in the design specification. From a
40

charge motion point of view mill liners are at their most aggressive when newly installed. In most cases it is not possible to operate the mill within the upper speed region of the mill speed range until such time that the lifters have been subjected to a certain amount of wear. Trajectory studies are very useful in defining the safe operating region of a SAG/AG mill with respect to mill filling and volumetric loading.
For example, one such study demonstrated that the speed of a particular 6.0m diameter SAG mill should initially be limited to the 65-70% of critical speed range and that the mill filling should be in the range 30% to33%. It was predicted that the operation of the mill at fillings of below 25%, even at the lowest speed setting, would result in direct impact of the charge on the mill shell. This was converted into chord measurement figures, so that the operating staff could relate the operating window directly to their raw measured data, Figure 36.
SAG Mill : Safe Operating Load VolumesNew Liner Scenario
650
660
670
680
690
700
710
720
730
740
750
760
770
780
790
20 21 22 23 24 25 26 27 28 29 30 31 32 33 34 35 36 37 38 39 40
Volumetric Filling (%)
S (c
m)
S
Chord Widthalong chargesurface (S)
SAFE OPERATING
RANGE65-70 % NcSAFE
OPERATINGSPEED65 % Nc
LINER DAMAGE EVEN
AT LOWEST SPEED
SAFE70-75 %
Nc
LOAD RUNNING IN TRUNNION
``````````````
Figure 36. Example of defined safe operating window for a 6m SAG mill with new liners
Load Calibration
In order to control the load in a SAG mill to a known volumetric filling, it is necessary to calibrate some measure of the load mass to that of volumetric filling. The majority of mills are either mounted on load cells or have some measure of slipper pad hydraulic pressure which can be related to the mass of the charge in the mill.
The volumetric filling in the mill is measured by ‘crash-stopping’ the mill, locking it out, and measuring the width of the chord along the charge surface, or the height from the charge surface to the ‘roof’ of the mill. The height measurement is a more accurate method of determining the mill filling, and it has been found that an industrial surveying laser distance meter with a rugged water resistant casing and 100 m range accurate to 1 mm, is eminently suited to this, allowing quick and accurate height measurements to be taken in any size mill, Figure 37.
41

By observing the indicated load cell reading, or bearing back pressure, it is possible to determine a relationship between mill volumetric filling and mass or pressure. This relationship is obviously dependant on the bulk density of the material in the mill. As the steel loading in the mill fluctuates with time it is necessary to calibrate the mass / volume relationship fairly frequently by recording the indicated mass reading and measuring the charge volume during routine mill stoppages.
Laser tape measure
Support pole resting on charge
Figure 37. Measuring the mill filling with a laser tape measure
The load calibration curves measured during the commissioning of a 30ft mill operating without a steel load are shown in Figure 38. The shaded rectangular area indicates the safe operating window for the operation of the mill at a speed of 68% of critical.
42

Figure 38. Relating load cell and pad back pressure to mill volumetric filling.
The trends shown in Figure 38a contain many data points. It is normally not necessary to obtain as many points in determining the mass/pressure versus volumetric filling relationship. In this particular example a great deal of signal noise was observed and hence many points were obtained in order to determine a better average. Graph b shows the relationship for a non-linear bearing pressure response, and graph c shows the linear relationship between a load cell reading and mill filling. Once the mass/pressure versus filling relationship has been obtained limits should be placed on these to define the safe operating region of the mill. It is important that mill operators gain an understanding of this process as they will be relied on to conduct the necessary calibration in the future.
A set-point for the mill mass is normally then chosen for the operation of the mill. It is good practice to vary the feed rate in accordance with the indicted mill mass in order to maintain this mass set-point. This can be accomplished with the use of a properly tuned proportional/integral/derivative (PID) controller, or a system if it is already operational. Operator vigilance is still required to ensure that the mill load is maintained within the safe operating window. It is good practice to define a lower mass limit and to incorporate this into an alarm function in the control software. Some operators apply a rule / interlock in the software that automatically stops the mill should the lower load limit be breached for a certain period of time. This prevents liner damage in the case of there being problems associated with the delivery of feed to the mill, as in the case of a blocked feed chute for example.
Using a Power Model
At the time of commissioning a SAG mill the steel consumption rate is largely an unknown. The equilibrium steel addition rate or the rate that results in an essentially constant steel loading in the mill is normally found through trial and error. The initial steel load is normally known as this is usually measured out in terms of the numbers of drums of steel required for the intended start-up steel load. After only a few hours of operation the steel load in the mill is likely to change as the initial steel addition rate is seldom that of the desired equilibrium rate.
Load Calibration Curves
230
240
250
260
270
280
290
300
310
320
330
340
350
360
370
380
390
400
22020 21 22 23 24 25 26 27 28 29 30 31 32 33 34 35 36 37 38 39 40 41 42 43 44 45 46 47 48 49 50
Volumetric Filling %
Mas
s (to
ns) o
r Pre
ssur
e (b
ar)
Scada Mass
Scada Press
Linear (Scada Press)
Linear (Scada Mass)
mass filling relationship
y = -0.0102x2 + 0.8732x + 13.023
2022242628303234
10.0 15.0 20.0 25.0 30.0 35.0 40.0 45.0% filling
"mass"
calibration points
mas
s
b
AG m ill - Load vs filling
y = 13.549x + 43.284
300.0
400.0
500.0
600.0
700.0
800.0
load
, t
200.025.0 30.0 35.0 40.0 45.0 50.0
filling, %a c
43

The main challenge facing the operator is determining what the ongoing steel load in the mill is in order to make decisions regarding the addition rate. This is quite often determined by conducting grind-outs, by stopping the feed and allowing the rock charge to grind out until only the steel load remains. This practice accelerates liner wear and in the case of large diameter SAG mills the chance of damaging the lining is always a concern.
A SAG mill power model can be used in the determination of the volumetric steel loading in a mill. By observing the power draw of the mill, prior to crash stopping the mill to measure the charge volume, the steel content can be back-calculated from a model. An example of the relationship between mill power and the steel content of a 30ft SAG mill, at a total mill volumetric filling of 30%, is shown in Figure 39, derived from the Morrell SAG power model. Separate lines are given for a set of mill speeds.
Figure 39. Mill power versus steel loading for a 30ft mill at 30% total volumetric filling
Power vs Steel Load (30 % Mill Filling)
4500
4750
5000
5250
5500
5750
6000
6250
6500
6750
7000
7250
7500
7750
8000
8250
0 1 2 3 4 5 6 7 8 9 10 11 12 13 14
Steel Load (%)
Gro
ss P
ower
(kW
)
68 % Critical70 % Critical72 % Critical74 % Critical75 % Critical
Increasing speed
Mill power draw is a strong function of both mill speed and filling. A SAG mill power model can be used to estimate mill filling at a certain speed by comparison of the indicated mill power draw and the prediction of mill power by the model. This is particularly useful when the steel loading in the mill is known, or has already been determined, and is often used during commissioning to verify the load calibration relationship. The estimated filling for the 30ft SAG mill used in the example, operating with an observed power draw of 5000kW and at 74% of critical speed is slightly more than 30% according to the model prediction.
Start-up SAG Mill Steel Load
Many operators choose to commission their SAG mills without an initial steel charge in order to allow for the commissioning and calibration of the necessary systems that are required to control the mill load. This also provides the operators with an opportunity to familiarise themselves with the systems and operation of the mill without the threat of liner damage.
44

The throughput of the mill is then ramped up with the addition of the first steel charge and by knowing the mass of steel being added to the mill it is possible to calculate the new mass set-point that would correspond to the desired total volumetric filling. This set-point is then verified by measuring the charge volume in the manner described previously and the safe operating limits must be adjusted accordingly.
Ball Mill Steel Load
Given that the commissioning of the SAG mill may be an incremental affair with respect to the addition of steel to the mill, charging the ball mill to that of the maximum or even design operating steel load may initially lead to over-grinding and high steel / liner wear rates.
The start-up steel load in a ball mill should be at least 20% and should be ramped up fairly rapidly in accordance with the observed circulating load. It is easier to add steel to a ball mill than to remove steel. Observation of the sand load in the mill on ‘crash stopping’ the ball mill is also a means of determining whether the optimum steel load has been achieved or not. By dipping a hand or stick through the water layer down to the surface of the balls, the solids level above the balls can be determined. A small sands solids sand layer of less than 100 mm above the level of the grinding media should be observed. ‘Islands’ of sand in the mill indicate too low a steel charge and will normally be accompanied by a high circulating load and a coarse product grind when the mill is in operation. The steel load in a ball mill should be adjusted to typically maintain a circulating load of between 200 and 300%.
Summary of commissioning guidelines
A new mill in a new operation with unreliable delivery and often soft oxide ore is at extremely high risk of liner damage, especially cracking and peening, leading to reduced liner life and possible mill damage. More than one mill has been literally split open by heavily peened liners inexorably spreading and forcing the shell apart. This is clearly catastrophic and must be guarded against at all costs.
It is therefore necessary to take this into account in the design and material specifications of the first set of liners. Thus this initial set can seldom be the final optimised material and design, they need to be tougher, and consequently less wear resistant, and have a conservative liner profile, which also reduces liner life. It is important that the supplier, plant metallurgist, and purchasing department are aware of this, otherwise the plant can continue to order sub-optimal liners. The author has witnessed this on a site where the Management used an inferior supplier to provide replacement liners, and this supplier mimicked the commissioning set of liners, at a high eventual cost to the Plant.
The operators need to also be acutely aware of the risk that they expose the liner and mill to if they allow the mill charge to run down. Strict lower limits must be placed on mill load, and the mill must be stopped if feed rate or ore incompetence lead to the mill charge grinding out and exposing the liners to direct impact. Charge trajectory simulations linked to calibration of the load measurement and power draw with mill filling and ball load can provide an effective safe operating window within which the operator can run the mill.
45

DESIGN TRENDS
This section picks out a few thoughts of the authors on where design is heading, how liners are likely to evolve, and what the drivers are.
Customised design that is optimised for the individual site, operation, and ore types will be the emphasis for the future. These will be driven by new techniques (such as rapid laser scanning) used in the measurement of the liner wear pattern and rates. By using the data from these scans and combining this with the power of DEM simulations and realistic wear testing techniques, liner profiles can be optimised more expertly, to provide a more effective and efficient liner profile throughout the life of liner.
There will be a continued shift to the use of larger liner pieces. This will only be limited or directed by the speed and safe installation with the type of liner handler being designed and implemented.
CONCLUSIONS
There are many instances of marked improvements in liner life and/or mill performance from changing liner configurations. In most instances these appear to be found by trial and error, or in response to a successful change down the road. That such substantial improvements can be gained indicates a deficiency in design and selection of liners, most likely based on an inadequate understanding of their action in the mill. It is considered inadequate to rely on the rule of thumb relationships used by suppliers to select lifter bar heights, angles, and spacing. There are sufficient decisive examples in the industry to show that these do not hold out, especially for large SAG mills.
It is proposed that the heights of lifter bars should be determined by the size of the grinding media and the desired wear life, balanced against the spacing that gives optimal mill performance. The face angles of the lifters can be determined by simulation to give the desired point of impact on the toe of the charge. The final selection of liner profile can be determined to give the widest operating window for the load and speed conditions the mill is expected to run under. This safe operating window can then be used as an operator guide, and fine tuned once the mill is in operation. Sensible and controlled management of new liners, using straightforward techniques that are currently available, when commissioning mills has been demonstrated to protect them from damage that can be catastrophic.
The sophisticated outputs of DEM simulations, such as charge behaviour, and stresses and forces imparted on liners, when linked with wear experiments that can reproduce the simulated wear modes, is undoubtedly the best available technique for development of a truly predictive wear testing methodology. DEM can be used to predict the charge behaviour and performance of the mill over the lifespan of the lifter. This will allow the liner profile and material to optimised in a more holistic manner, by taking into consideration mill performance and liner cost as an integrated objective function.
REFERENCES
Barker, G.C., 1994. Computer simulations of granular materials, Granular Matter: An interdisciplinary approach, Ed. Anita Mehta, Springer-Verlag, NY.
46

Bird, S., A.E. Lamb, W. Lamb, and D.W. Partridge, 2001. Evolution of SAG Mill Shell Liner Design at Kennecott Utah Copper’s Copperton Concentrator. Pages 256-269 in vol. III of Proceedings International autogenous and semiautogenous grinding technology 2001, Sep. 30 - Oct. 3, Ed. Barratt et al, Published CIM,.
Campbell, C.S. 1990. Rapid Granular Flows, Annual Rev. Fluid Mech. 22: 57-92.
Cleary, P.W. 1998a. Predicting charge motion, power draft, segration, wear and particle breakage in tumbling mills using discrete element methods, Minerals Engineering, 11: 1061-1080.
Cleary, P.W. 1998b. Discrete Element Modelling of Industrial Granular Flow Applications, TASK. Quarterly - Scientific Bulletin, 2: 385-416.
Cleary, P.W. 2001a. Modelling Comminution Devices using DEM, International Journal for Numerical and Analytical Methods in Geomechanics. 25: 83-105.
Cleary, P.W. 2001b. Charge behaviour and power consumption in ball mills: Sensitivity to mill operating conditions, liner geometry and charge composition, International Journal Mineral Processing, 63: 79-114.
Cleary, P.W., 2004. Large scale industrial DEM modelling, Engineering Computations 21: 169-204.
Cleary, P.W., R. Morrison, S. Morrell, 2003. Comparison of DEM and experiment for a scale model SAG mill, International Journal Mineral Processing. 68: 129-165.
Coleman, R., and C. Veloo, 1996. Freeport Indonesia Concentrator expansion. Preprint 96-161 in Proceedings SME Annual Meeting, Phoenix, Arizona, March 11-14.
Davis, E.W., 1919. Fine crushing in ball mills. AIME Trans. 61: 250-296.
Elastomers 2002, Elastomers in the Minerals Processing Industry. Chapter 16 in Mineral Processing Plant Design, Practice and Control Proceedings. Construction Materials for Equipment, Published SME.
Hart, S., W. Valery, B. Clements, M. Reed, Ming Song, and R. Dunne, 2001. Optimisation of the Cadia hill SAG mill circuit. Pages 11-30 in vol. I of Proceedings International autogenous and semiautogenous grinding technology 2001, Sep. 30 - Oct. 3, Ed. Barratt et al, Published CIM.
Herbst, J.A., L.K. Nordell, 2001. Optimization of the Design of SAG Mill Internals Using High Fidelity Simulation. Pages 150-164 in vol. IV of Proceedings International autogenous and semiautogenous grinding technology 2001, Sep. 30 - Oct. 3, Ed. Barratt et al, Published CIM.
Inoue, T., K. Okaya, 1996. Grinding mechanism of centrifugal mills - A batch ball mill simulator, International Journal of Mineral Processing, 44-45: 425-435.
Kendrick, M.J., and J.O. Marsden, 2001. Candelaria post expansion evolution of sag mill liner design and milling performance, 1998 to 2001. Pages 270-287 in vol. III of Proceedings International autogenous and semiautogenous grinding technology 2001, Sep. 30 - Oct. 3, Ed. Barratt et al, Published CIM.
McIvor, R.E., 1983. Effects of speed and liner configuration on ball mill performance. Mining Engineering, Jun.: 617-622.
47

Meekell, W., A. Adams, and K. Hanna. Mill liner development at Highland Valley Copper. Pages 224-239 in vol. III of Proceedings International autogenous and semiautogenous grinding technology 2001, Sep. 30 - Oct. 3, Ed. Barratt et al, Published CIM.
Mishra, B.K., R.K. Rajamani, 1994a. Simulation of charge motion in ball mills, Part 1: experimental verifications, International Journal of Mineral Processing 40: 171-186.
Mishra, B.K., R.K. Rajamani. 1994b. Simulation of charge motion in ball mills, Part 2: numerical simulations, International Journal of Mineral Processing 40:187-197.
Moller, T. K., and R. Brough, 1989, Optimising the performance of a rubber-lined mill. Mining Engineering, Aug.: 849 – 853.
Morrison, R.D., 2001. JKMRC, Brisbane, Australia, private communication.
Napier-Munn, T.J., S. Morrell, R.D. Morrison, and T. Kojovic. 1996. Mineral Comminution Circuits - Their operation and optimisation. Julius Kruttschnitt Mineral research Centre, University of Queensland, Australia.
Nesbit, P.Q, H.M. Moys, 1998. Load behaviour in the HiCom nutating mill, Minerals Engineering 10: 979-988.
Pax, R.A., 2001. Non-contact acoustic measurement of in-mill variables of a SAG mill. Pages 386-393 in vol. II of Proceedings International autogenous and semiautogenous grinding technology 2001, Sep. 30 - Oct. 3, Ed. Barratt et al, Published CIM.
Powell, M.S., A.T. McBride, and I. Govender. 2003, Application of DEM outputs to refining applied SAG mill models. Pages 307-316 in Proceedings of the IMPC 2003 conference, 28 Sep. – 3 Oct. Cape Town. South Africa.
Powell, M.S. 2001. Liner selection – a key issue for large SAG mills. Pages 307-322 in vol.III of Proceedings International autogenous and semiautogenous grinding technology 2001, Sep. 30 - Oct. 3, Ed. Barratt et al, Published CIM.
Powell, M.S., 2000. MillTraj – Liner Design Software. JKTech application papers, Published by JKMRC, University of Queensland.
Powell, M.S., and G.N. Nurick, 1996. A Study of charge motion in Rotary Mills. Part 1 - Extension of the theory. Minerals Engineering 9(2): 259 - 268.
Powell, M.S., G.N. Nurick, 1996. A Study of charge motion in Rotary Mills. Part 2 - Experimental Work” Minerals Engineering 9(3): 343 - 350.
Powell, M.S., G.N. Nurick, 1996. A Study of charge motion in Rotary Mills. Part 3 - Analysis of Results” Minerals Engineering 9(4): 399 - 418.
Powell, M.S., and L.A. Vermeulen, 1994. The influence of liner design on the rate of production of fines in a rotary mill. Minerals Engineering 7(2/3): 169-183.
Powell, M.S. 1994. Lifter bars save costs for Lindum. Mintek Bulletin, No. 77, Oct. Mintek, Randburg, South Africa..
Powell, M.S. 1993. A study of charge motion in rotary mills, with particular reference to the grinding action. PhD dissertation: University of Cape Town, Cape Town, South Africa.
48

49
Powell, M.S. and F.S. Cornelius, 1992. A test for the realistic simulation of coarse abrasive wear. Prep. Tribology '92, SAIT, Pretoria. 15-17 Sept.
Powell, M.S. 1991a. The effect of liner design on the motion of the outer grinding media in a rotary mill. International Journal Mineral Processing 31: 163-193.
Powell, M.S. 1991b. The design of rotary-mill liners, and their backing materials. Journal of the South African Institute of mining and Metallurgy. 91(2): 63-75.
Radziszewski, P. 2001. Determining Impact, abrasive, and corrosive contributions to total media wear. Pages 252-259 in vol. IV of Proceedings International autogenous and semiautogenous grinding technology 2001, Sep. 30 - Oct. 3, Ed. Barratt et al, Published CIM.
Radziszewski, P. and W. Valery, 1999. Cadia SAG Mill Simulated Charge Behaviour. Pages 267-283 in Proceedings 31st Annual Meeting of the Canadian Mineral Processors, Jan., Ottawa.
Radziszewski, P. 1997. Predictive Model for Ball Mill Wear. Can. Metall. Quaterly, 36(2): 87-93.
Radziszewski, P.and Tarasiewicz, S. 1993. Simulation of Ball Charge and Liner Wear. International Journal on Wear, Friction and Lubrication., 169: 77-85.
Radziszewski, P. 1986. Modeling Comminution as a Function of Crushing, Tumbling and Grinding in a Ball Mill (in french), MSc Thesis: U. Laval.
Radziszewski, P., S. Tarasiewicz, 1989. Ball mill Simulation: Part II -- Numerical Solution to Ballcharge Model. Transaction of the Society of Computer Simulations, 6(2): 75-88.
Radziszewski, P., S. Morrell, 1998. Fundamental Discrete Element Charge Motion Model Validation, Minerals Engineering 11(12): 1161-1178.
Rajagopal, V., I. et Iwasaki, 1992. Grinding media selection criteria for wear resistance and flotation performance. Comminution - Theory and practice, Littleton, 181-200.
Rattaray, B. 2000. Mill liner evolutions in recent times. Pages 57-62 in Proceedings of Seventh Mill Operators Conference, Kalgoorlie, Australia,12-14 Oct., Pub AusIMM.
SAG’01. 2001. Proceedings International autogenous and semiautogenous grinding technology 2001, Sep. 30 - Oct. 3, 2001, Ed. Barratt et al, Published CIM.
Schäfer, J., Dippel, S., and Wolf, D. E. 1996. Force schemes in simulation of granular material, J. Physique I France 6(5).
Tano, K. 2005. LKAB, Research and Development, SE-983 81 Malmberget, Sweden. Private communication.
Walton, O.R. 1994. Numerical simulation of inelastic frictional particle-particle interaction, Particulate two-phase flow, ed. M. C. Roco, Chapter 25: 884-911.
White, H.A. 1905. The theory of the tube mill. The Journal of the Chemical, Metallurgical, and Mining society of South Africa. May: 290-305.
Zhang, D., Whiten, B. 1998. An Efficient Calculation Method for Particle Motion in Discrete Element Simulations. Powder Technology, 98(3), 223-230.