the scottish renewable resource assessment and implications … · the scottish renewable resource...
TRANSCRIPT

Page 1
EPRG seminar:
The Scottish renewable resource
assessment and
implications for the grid
16 May 2008
The Scottish renewable resourceassessment and implications for
the grid
Thomas Boehme, Jamie Taylor, Robin
Wallace, and Janusz Bialek
Institute for Energy Systems
The University of Edinburgh, UK

Page 2
EPRG seminar:
The Scottish renewable resource
assessment and
implications for the grid
16 May 2008
Background
• Scottish renewable target: 40% by 2020, recently upgraded to 50%, interim milestone of 31% by 2011
• In 2004, the (then) Scottish Executive commissioned a report to appraise of the extent to which Scotland could meet the 40% target
• The aim: realistic assessment of Scotland’s renewable potential (wind on- and off-shore, tidal and wave resource)
• The Scottish target is now 50% but the assessment of the resource still stands
Page 3
EPRG seminar:
The Scottish renewable resource
assessment and
implications for the grid
16 May 2008
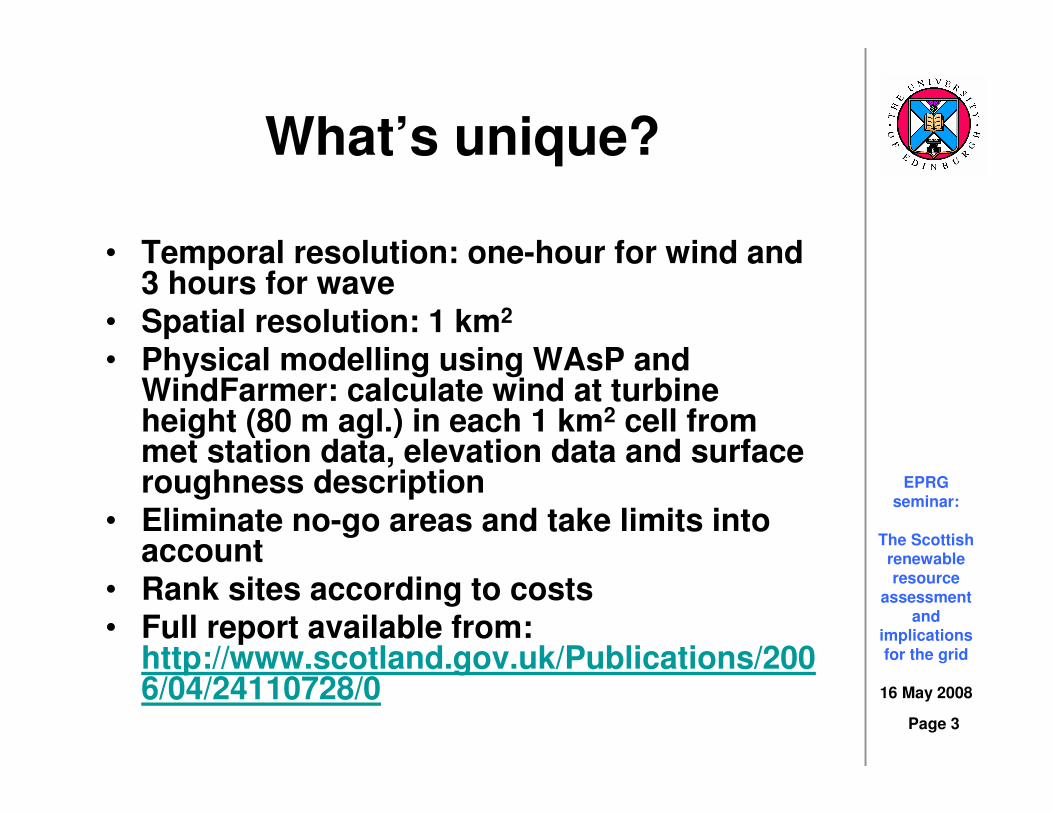
• Temporal resolution: one-hour for wind and 3 hours for wave
• Spatial resolution: 1 km2
• Physical modelling using WAsP and WindFarmer: calculate wind at turbine height (80 m agl.) in each 1 km2 cell from met station data, elevation data and surface roughness description
• Eliminate no-go areas and take limits into account
• Rank sites according to costs• Full report available from:
http://www.scotland.gov.uk/Publications/2006/04/24110728/0
What’s unique?
Page 4
EPRG seminar:
The Scottish renewable resource
assessment and
implications for the grid
16 May 2008
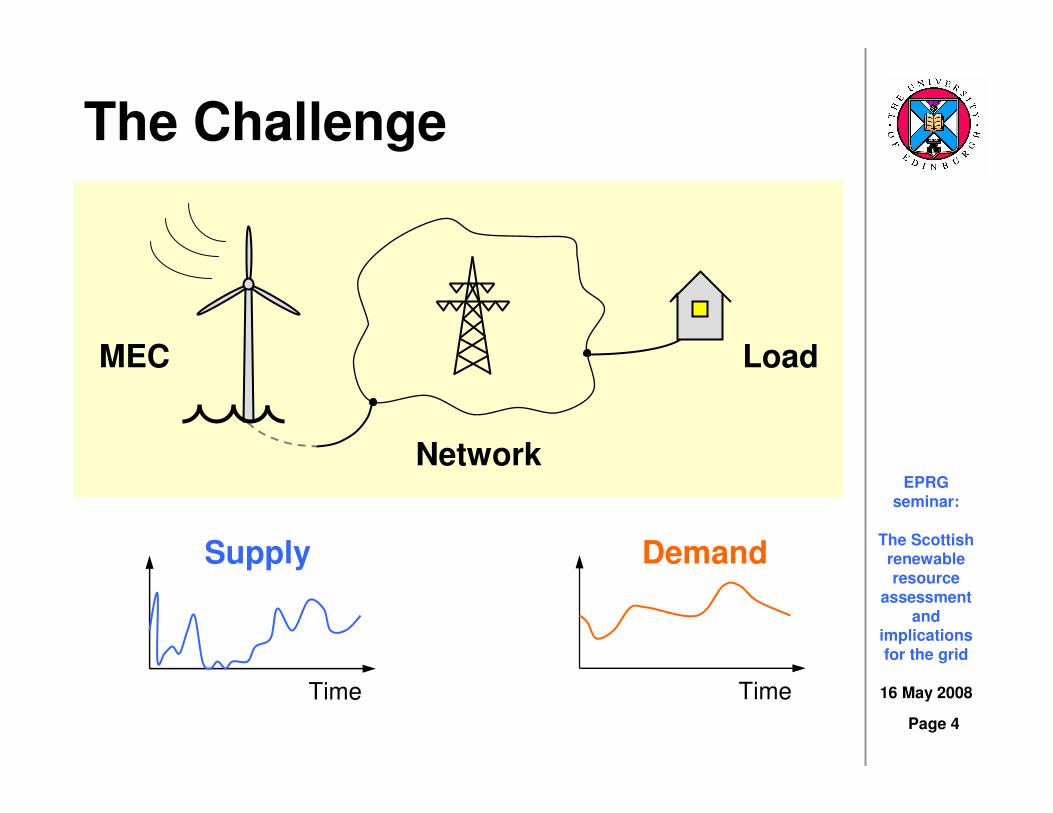
The Challenge
Network
Demand
Time
Supply
Time
MEC Load

Page 5
EPRG seminar:
The Scottish renewable resource
assessment and
implications for the grid
16 May 2008
Constraints GIS Mapped
Resourcetime series
Long-termresource
Generatorlocations
Converter
Constraints
Macro
Renewable
generation
GIS
Projectcosts
Selectioncriteria
Macro
Scenarios
Demand
Contents
Net
work
Keyfigures
Results

Page 6
EPRG seminar:
The Scottish renewable resource
assessment and
implications for the grid
16 May 2008
StudyArea
N = 500 kmE = 0 km
N = 500 kmE = 500 km
500 km
750 km
Source: Ordnance Survey
• Spatial resolution: 1 km2
• Use of British National Grid coordinates
N = 1250 kmE = 500 km

Page 7
EPRG seminar:
The Scottish renewable resource
assessment and
implications for the grid
16 May 2008
Political
• International limit (200 nmi, 12 nmi)
• National limit
• Fishing limit (6 nmi)
• Planning authorities
• Local regulations
Sources: OS, UKHO

Page 8
EPRG seminar:
The Scottish renewable resource
assessment and
implications for the grid
16 May 2008
Physical
• Water depth
• Slope
• Lakes
• Rivers
• etc.
Sources: OS, BGS, BODC, SRTM
Example:
Average slope > 15% in
a 1 km by 1 km square.

Page 9
EPRG seminar:
The Scottish renewable resource
assessment and
implications for the grid
16 May 2008
• Recreation interests (high sensitivity)
• Biodiversity interests (high sensitivity)
• Medium sensitivity areas
Sources: OS, SNH, SEGIS
National Scenic Area
National Park
Regional park
AGLV, LNR, ...
Natura 2000, SSSI, ...
Environment

Page 10
EPRG seminar:
The Scottish renewable resource
assessment and
implications for the grid
16 May 2008
Aviation Interests
• Civil radars
• Military radars
• Met Office radars
• Low Flying System
Sources: OS, DTI, CAA, BWEA
15 km exclusion zone
30 km consultation zone
NATS high impact
NATS lower impact
Tactical Training Area

Page 11
EPRG seminar:
The Scottish renewable resource
assessment and
implications for the grid
16 May 2008
• Urban areas
• Navigational risk
• Seismological measurements
• Ammunition dumping
• Distances, etc.
Sources: OS, DTI, CAA, BWEA
Cities, towns, villages
Eskdalemuir
Further Constraints
very high
medium
very low

Page 12
EPRG seminar:
The Scottish renewable resource
assessment and
implications for the grid
16 May 2008
Long-Term Resource
Resourcetime series
Long-termresource
Generatorlocations
Converter
Constraints
Macro
Renewable
generation
GIS
Projectcosts
Selectioncriteria
Macro
Scenarios
Demand
Contents
Net
work
Keyfigures
Results

Page 13
EPRG seminar:
The Scottish renewable resource
assessment and
implications for the grid
16 May 2008
Average wind speed
in each 1 km2 cell at
80 m height agl.
calculated from met
station data using
WAsP and
WindFarmer
10 years data (1994-
2003)
Kirkwall
Wick
Lerwick
Sella Ness
Dyce
Leuchars
Charterhall
Eskdalemuir
West Freugh
Tiree Airport
Port Ellen
South Uist
Stornoway
Dundrennan
Machrihanish
Altnaharra
AvSk
StD
Sa
Au
K
T
OnshoreWindResource
Meteorological
station (21 + 3)
4 10 16 m/s
Sources: OS, Met Office

Page 14
EPRG seminar:
The Scottish renewable resource
assessment and
implications for the grid
16 May 2008
Average wind speed
at 80 m height asl.
OffshoreWindResource
4 10 16 m/s
Sources: OS, DTI, Met Office
Met Office
Simulation Point
(11)
Water depth, 5 km
offshore
0 ... 30 m
30 ... 40 m
40 ... 50 m

Page 15
EPRG seminar:
The Scottish renewable resource
assessment and
implications for the grid
16 May 2008
Wave power per
metre crest length
WaveResource
5 30 55 kW/m
Sources: OS, DTI, Met Office
Met Office
Simulation Point
(84 + 11)
Water depth, 5 km
offshore
50 ... 100 m
3 hour data: March
2000 – Nov 2004

Page 16
EPRG seminar:
The Scottish renewable resource
assessment and
implications for the grid
16 May 2008
Tidal CurrentResource
Sources: OS, DTI, Robert Gordon Univ.
Average spring tide
velocity (surface)
0.5 1.5 2.5 m/s
Water depth
30 ... 50 m
South-West
Orkney
Islands
Pentland Firth
Shetland
Mull of Galloway
Variable but
deterministic

Page 17
EPRG seminar:
The Scottish renewable resource
assessment and
implications for the grid
16 May 2008
Future Generator Locations
Resourcetime series
Long-termresource
Generatorlocations
Converter
Constraints
Macro
Renewable
generation
GIS
Projectcosts
Selectioncriteria
Macro
Scenarios
Demand
Contents
Net
work
Keyfigures
Results

Page 18
EPRG seminar:
The Scottish renewable resource
assessment and
implications for the grid
16 May 2008
Cost Calculation
Step Remark
Remove “no go” cells
500 x 750
Check capacity limit in
consultation areas
Select cells
Calculate annual energy output
Calculate (initial) levelisedproject cost (LPC) per cell
Remove “expensive” cells
Calculate (final) LPC per cell
Cluster to projects (for cost sharing)
Excluding grid
connection costs
e.g. by 100 km2 area,
remove more cells
e.g. > 10 p/kWh
e.g. cities, NSAs
neighbouring cells,
total capacity limit
Including grid
connection costs
per area; capacity or
cost limit

Page 19
EPRG seminar:
The Scottish renewable resource
assessment and
implications for the grid
16 May 2008
Estimated onshore
wind project costs
excluding connection
to existing network
low cost
medium cost
high cost
Example:
“no go” zone
• 3 x 2.5 MW per km2
• 80 m hub height• 20 years, 8 % discount rate
Assumptions:
including
Project Costs

Page 20
EPRG seminar:
The Scottish renewable resource
assessment and
implications for the grid
16 May 2008
Creating Power Time Series
Resourcetime series
Long-termresource
Generatorlocations
Converter
Constraints
Macro
Renewable
generation
GIS
Projectcosts
Selectioncriteria
Macro
Scenarios
Demand
Contents
Net
work
Keyfigures
Results

Page 21
EPRG seminar:
The Scottish renewable resource
assessment and
implications for the grid
16 May 2008
Energy Converters
On/Offshore Wind Waves Tidal Currents
Source: Nordex, OPD, MCT
• 3-bladed horizontal axis turbine with pitchableblades
• 80 / 120 m diameter
• 2.5 / 5 MW
• 80 m hub height
• Offshore: < 40 m water depth
• Semi-submerged articulated structure
• 180 m long
• 1.5 MW
• 50 ... 150 m water depth
• Twin-rotor horizontal axis turbine with pitchable blades
• 20 m rotor diameter
• 2 x 500 kW
• 30 ... 50 m water depth
Poweroutput
Wind speed
cut-outcut-in
nominal

Page 22
EPRG seminar:
The Scottish renewable resource
assessment and
implications for the grid
16 May 2008
Generation vs. Demand
Resourcetime series
Long-termresource
Generatorlocations
Converter
Constraints
Macro
Renewable
generation
GIS
Projectcosts
Selectioncriteria
Macro
Scenarios
Demand
Contents
Net
work
Keyfigures
Results

Page 23
EPRG seminar:
The Scottish renewable resource
assessment and
implications for the grid
16 May 2008
0
1,000
2,000
3,000
4,000
5,000
0 h 4 h 8 h 12 h 16 h 20 h 0 h
Demand - DailyS
yste
m D
em
an
d (
MW
)
Time
ScottishPower
Scottishand
SouthernEnergy
max.
min.
avg.
Source: SP and SSE 2003 Seven Year Statements
24 h
Example:2002/03

Page 24
EPRG seminar:
The Scottish renewable resource
assessment and
implications for the grid
16 May 2008
0
1,000
2,000
3,000
4,000
5,000
Demand - AnnualS
yste
m D
em
an
d (
MW
)
Time
ScottishPower
weekly max.
weekly min.
weekly avg.
Source: SP 2002 and 2003 Seven Year Statements
J F M A M J J A S O N D
Example:2002

Page 25
EPRG seminar:
The Scottish renewable resource
assessment and
implications for the grid
16 May 20080
40
80
120
Jul-21 Jul-22 Jul-23 Jul-24 Jul-25 Jul-26 Jul-27 Jul-28
0
40
80
120
Jan-20 Jan-21 Jan-22 Jan-23 Jan-24 Jan-25 Jan-26 Jan-27
Sample Area
Demand Matching January, July 2003
(MW)
(MW)
Offshore windOnshore wind
(a) Orkney(b) Mainland
Tidal currents
Waves
40
%,
100
% d
em
an
d

Page 26
EPRG seminar:
The Scottish renewable resource
assessment and
implications for the grid
16 May 2008
Key Figures and Results
Resourcetime series
Long-termresource
Generatorlocations
Converter
Constraints
Macro
Renewable
generation
GIS
Projectcosts
Selectioncriteria
Macro
Scenarios
Demand
Contents
Net
work
Keyfigures
Results

Page 27
EPRG seminar:
The Scottish renewable resource
assessment and
implications for the grid
16 May 2008
Results
After application of geographical constraints
it could be possible to develop at least
– 6 GW of onshore wind
– 3 GW of offshore wind
– 3 GW of wave and
– 1 GW for tidal current
or any combination of these technologies.

Page 28
EPRG seminar:
The Scottish renewable resource
assessment and
implications for the grid
16 May 2008
Results
Annual plant capacity factors derived from production time-series all exceed 30% – They reduce as the
capacity increases by adding less energetic higher cost sites.
– Seasonal values for wind and wave power are significantly higher in winter than in summer.
60%
30%
0 6 GW
Winter
Summer

Page 29
EPRG seminar:
The Scottish renewable resource
assessment and
implications for the grid
16 May 2008
Results
Onshore wind or the mixed technology
portfolio of 6 GW
would on average meet at least 40% of
the electricity demand in 2020
Potential to increase the penetration to
50% or more
60%
40%
0 6 GW
Winter
Summer20%

Page 30
EPRG seminar:
The Scottish renewable resource
assessment and
implications for the grid
16 May 2008
Results
Coincident hours best describe ongoing hourly match as a histogram
There is about 29 hours/ year when the demand > 90% of the peak while on-shore wind provides less than 10% of its capacity
Diversification by using a portfolio of renewable generation reduces that number to 20 hours/year
Coincident hours for demand > 90% and
production < 10% (h/year)
3 GW 6 GW
Onshore-wind
75-10-10-5% mix
Tidal-current (750 MW)
Wave
Offshore-wind
29
-(22)
-19
-14
29
2018
Demand
Gen
erat
ion
Page 31
EPRG seminar:
The Scottish renewable resource
assessment and
implications for the grid
16 May 2008
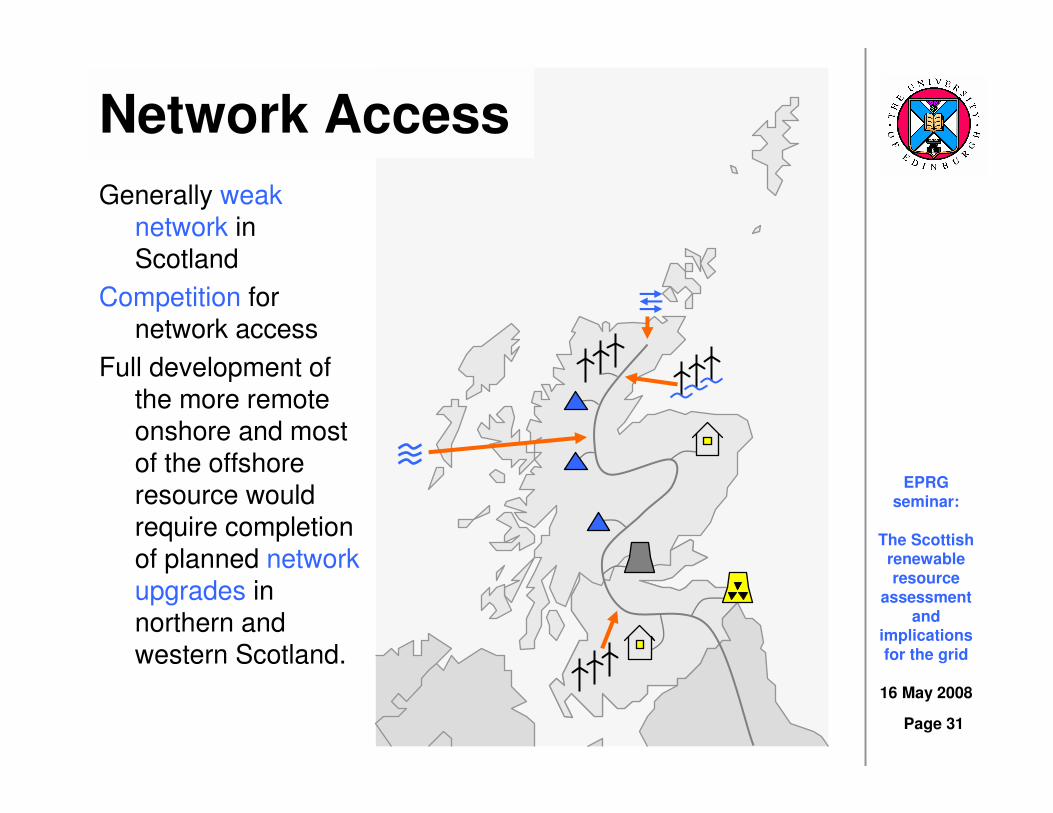
Network Access
Generally weak network in Scotland
Competition for network access
Full development of the more remote onshore and most of the offshore resource would require completion of planned network upgrades in northern and western Scotland.

Page 32
EPRG seminar:
The Scottish renewable resource
assessment and
implications for the grid
16 May 2008
Need for network upgrades
Current developments: review of GB Security and Quality of Supply Standard (SQSS) and
Transmission Access Review (TAR)
Controversy regarding scaling factor for wind for
network planning purposes (currently 60%)
Need for upgrades could be reduced if control schemes were more widely used (quad
boosters, intertrips)

Page 33
EPRG seminar:
The Scottish renewable resource
assessment and
implications for the grid
16 May 2008
Summary
The study has refined understanding of characteristics and availability of renewable resource in Scotland through detailed physical modelling using geographical and surface roughness data
Realistic assessment by eliminating no-go areas and including limits tp renewable generation
Diversification of renewable energy sources helps to manage variability of renewable input but a strong interconnected transmission system is required
SuperGen FlexNet projects will extend the study to the whole GB although in less detail