the rules of engagement wp ue - collab8.com€¦ · engagement. ˝is white paper describes in...
TRANSCRIPT
Online meetings and webinars can be as e�ective as physical meetings at holding the audiences a�ention and communicating a message e�ectively.Adobe Connect provides a wealth of features that presenters can use to encourage audiences to participate , keeping the discussions lively. However, physical meetings have one signi�cant advantage- a view of the audience. It is easier for presenters to monitor audience a�entiveness by observing their reactions and expressions. Knowing your audience’s a�entiveness is important in adjusting the pace of the session, ensuring proper delivery of your message. So with Adobe Connect 9 we introduced a new metric to measure audience engagement and a�entiveness, the engagement index.
�e engagement index can now be visible to presenters during seminars, events, and virtual classrooms in the new Engagement Dashboard Pod.
Also, when using the Adobe Connect Events module, a chart showing minute-by-minute engagement scores is available a�er the meeting. Presenters can go back and look at the sections of the meeting that were more or less engaging than others to improve their future presentations.
For privacy, Adobe Connect provides options for hosts to allow meeting participants to opt-out of being tracked for engagement. �is white paper describes in detail how the engagement index is calculated in Adobe Connect and o�ers ideas on how to keep participants engaged.
Table of contents
Adobe Connect
�e rules of engagement
�e rules of engagementWhitepaper
1 Engagement Dashboard
2 Engagement index calculation
3 Decay factor
4 Using the engagement index
5 Monitoring individual engagement
6 O�ering participants the option to opt-out
7 Keeping participants engaged
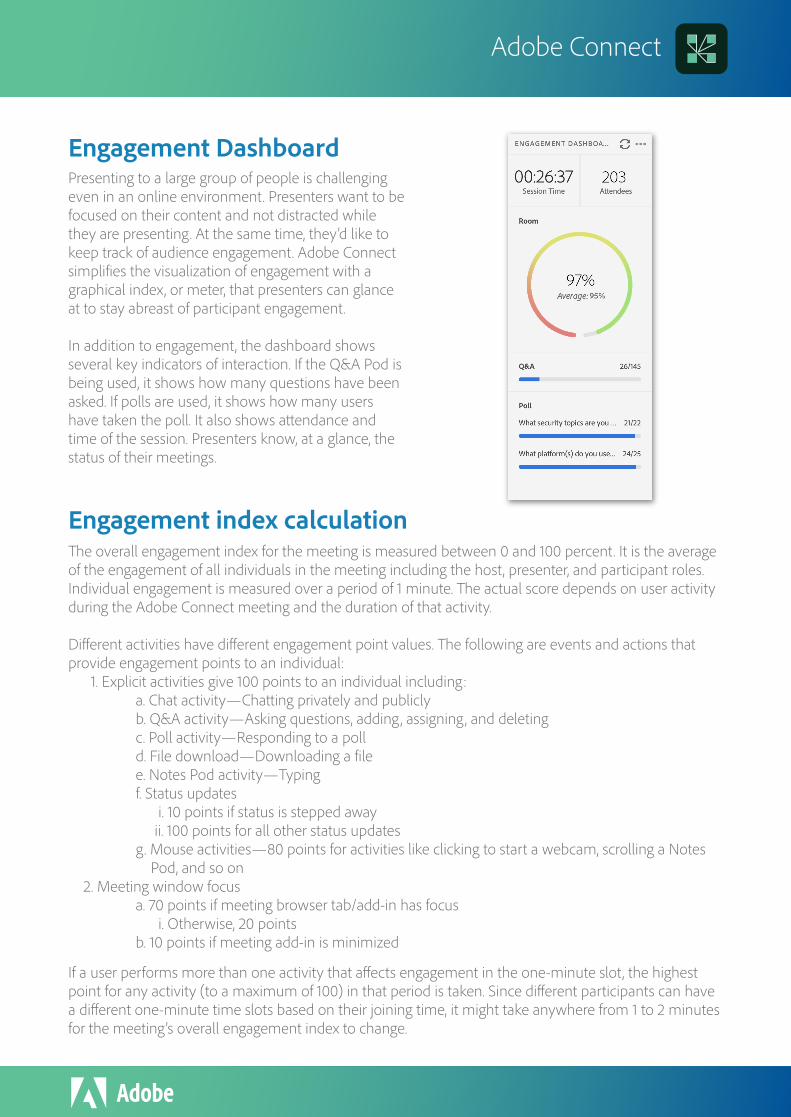
Engagement DashboardPresenting to a large group of people is challenging even in an online environment. Presenters want to be focused on their content and not distracted while they are presenting. At the same time, they’d like to keep track of audience engagement. Adobe Connect simpli�es the visualization of engagement with a graphical index, or meter, that presenters can glance at to stay abreast of participant engagement.
In addition to engagement, the dashboard shows several key indicators of interaction. If the Q&A Pod is being used, it shows how many questions have been asked. If polls are used, it shows how many users have taken the poll. It also shows a�endance and time of the session. Presenters know, at a glance, the status of their meetings.
Engagement index calculation�e overall engagement index for the meeting is measured between 0 and 100 percent. It is the average of the engagement of all individuals in the meeting including the host, presenter, and participant roles. Individual engagement is measured over a period of 1 minute. �e actual score depends on user activity during the Adobe Connect meeting and the duration of that activity.
Di�erent activities have di�erent engagement point values. �e following are events and actions that provide engagement points to an individual: 1. Explicit activities give 100 points to an individual including: a. Chat activity—Cha�ing privately and publicly b. Q&A activity—Asking questions, adding, assigning, and deleting c. Poll activity—Responding to a poll d. File download—Downloading a �le e. Notes Pod activity—Typing f. Status updates i. 10 points if status is stepped away ii. 100 points for all other status updates g. Mouse activities—80 points for activities like clicking to start a webcam, scrolling a Notes Pod, and so on 2. Meeting window focus a. 70 points if meeting browser tab/add-in has focus i. Otherwise, 20 points b. 10 points if meeting add-in is minimized
If a user performs more than one activity that a�ects engagement in the one-minute slot, the highest point for any activity (to a maximum of 100) in that period is taken. Since di�erent participants can have a di�erent one-minute time slots based on their joining time, it might take anywhere from 1 to 2 minutes for the meeting’s overall engagement index to change.
Adobe Connect
Adobe Connect
�anks to the �exible layout, presenters can position the Engagement Dashboard where it is convenient for them to glance at once in a while.
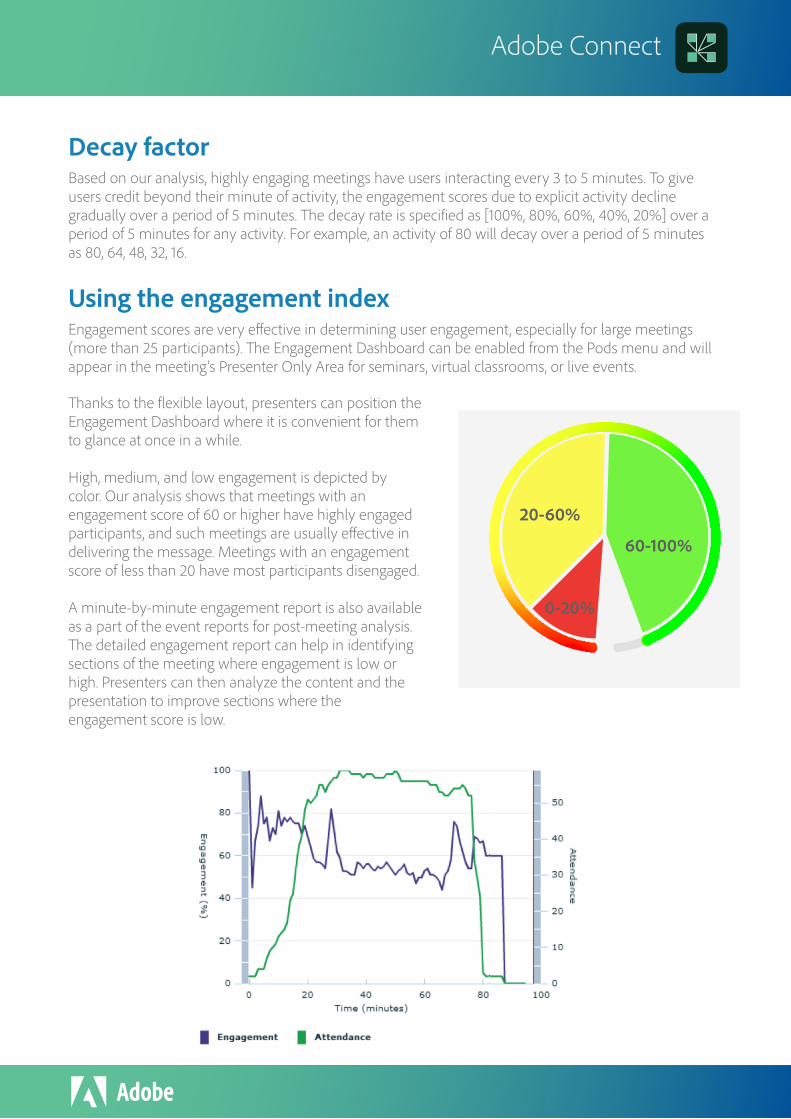
High, medium, and low engagement is depicted by color. Our analysis shows that meetings with an engagement score of 60 or higher have highly engaged participants, and such meetings are usually e�ective in delivering the message. Meetings with an engagement score of less than 20 have most participants disengaged.
A minute-by-minute engagement report is also available as a part of the event reports for post-meeting analysis. �e detailed engagement report can help in identifying sections of the meeting where engagement is low or high. Presenters can then analyze the content and the presentation to improve sections where the engagement score is low.
Decay factorBased on our analysis, highly engaging meetings have users interacting every 3 to 5 minutes. To give users credit beyond their minute of activity, the engagement scores due to explicit activity decline gradually over a period of 5 minutes. �e decay rate is speci�ed as [100%, 80%, 60%, 40%, 20%] over a period of 5 minutes for any activity. For example, an activity of 80 will decay over a period of 5 minutes as 80, 64, 48, 32, 16.
Using the engagement indexEngagement scores are very e�ective in determining user engagement, especially for large meetings (more than 25 participants). �e Engagement Dashboard can be enabled from the Pods menu and will appear in the meeting’s Presenter Only Area for seminars, virtual classrooms, or live events.
20-60%
0-20%
60-100%

Adobe Connect
Monitoring individual engagement�e engagement score works best as an aggregate metric for medium to large meetings. However, there are scenarios like training sessions where the trainer may want to monitor the engagement of speci�c participants. Adobe Connect provides an option in the A�endee Pod called “show individual engagement” that enables meeting hosts to see individual engagement. �e individual engagement is shown as three di�erent levels.
O�ering participants the option to opt-outWhile engagement information is useful for meeting presenters, individual participants may not want to have their engagement tracked for privacy reasons.
Adobe Connect o�ers event administrators a choice in the Analytics Administration section of EventManagement to enable an opt-out option for participants. Enabling opt-out lets participants choose not to be tracked for engagement information when they log in to the meeting. Event administrators can also display an additional opt-out noti�cation at the start of the meeting.
Adobe Connect also provides a higher level of control to account administrators. With the compliance and control se�ings, they can disable the Engagement Dashboard for all meetings in their accounts.
Green: High engagementYellow: Average engagementRed: Low engagement
Keeping participants engagedKeeping participants engaged is a combination of the message as well as its delivery. Adobe Connect provides a number of tools to deliver engaging webinars easily and e�ectively. Here are some ideas that you can adapt for your situation:
AT TENDEES (203)
Hosts (1)
Neil
Presenters (2)
Jessica
Bob
Jayson
Sophia
William
Amelia
Participants (200)
Emma
Liam
Robert
David
Hide
List View
Breakout Room View
Status View
Edit My Info
Show Active Speakers
Show Individual Engagement
Clear Everyone’s Status
Mute All A�endees
Unmute All A�endees
Preferences
Help

• Judiciously use a lobby layout and the waiting time before the start of the meeting to gather feedback. Example: Poll the participants on their expectations for the webinar; ask them to share their location(there are Adobe Connect extensions available that show participant locations in a map), or ask participants to share their most pressing problems related to a topic in the Chat Pod.
• Have a panel of experts answering questions through the moderated Q&A. Introduce the panel and encourage participants to ask questions. The panel can answer the questions from the Presenter Only Area even while the presenter is presenting. Answering a few appropriate questions publically to all, rather than privately to the question asker, will encourage even more question asking and interaction.
• Use frequent polls to gather useful information and also plan to share that information with the other participants using the broadcast results option. Remember to give value to participants while you demand value. Do not limit polls to just multiple choice questions, but also ask open-ended questions as well using the short answer option. Broadcasting results of open-ended questions provides encouragement for more participation.
• Take live feedback in a manner similar to how you would do it in a physical meeting using theattendee status option of agree or disagree. You can then look at the aggregate responses in the“attendee status view” of the Attendee Pod E.g.: You can ask “Give me a virtual ‘yea’ or ‘nay’ for this quick poll, ‘Is this meeting a good use of your time?’—notice the little button at the top of your meeting window with a raised hand image, that’s what you want to click and select either agree or disagree to share your response”.
• Use weblinks and file share Pods to share important information like whitepapers or product information brochures. Encourage participants to download files.
• Use an additional Chat Pod for “fun” chat contributions at various times during your webinar. Example: Ask audience members to type their location while they are waiting for the webinar to begin. Or ask them if they can identify an actor or place referenced in a slide graphic.
• Initiating interactions in real time with a live audience is challenging. Minimize the switchover time by using carefully prepared Layouts with pre-existing interactions and label the them Layouts appropriately. During the live meeting adding the interaction would then be just a single click to switch to an appropriate Layout.
Adobe Connect
For more information www.adobe.com/products/adobeconnectAdobe, the Adobe logo, Adobe Connect, Flash, and Flex are either registered trademarks or trademarks of Adobe Systems Incorporated in the United States and/or other countries.All other trademarks are the property of their respective owners.
© 2020 Adobe. All rights reserved. Adobe, the Adobe logo, Adobe Connect, are either registered trademarks or trademarks of Adobe in the United States and/or other countries09/20, 1.0
Adobe System Incorporated345 Part AvenueSan Jose, CA 95110-2704www.adobe.com