the role of socio-economic status in determining voting
TRANSCRIPT

University of RichmondUR Scholarship Repository
Master's Theses Student Research
1979
The role of socio-economic status in determiningvoting behavior in Richmond, VirginiaArthur Henry Verburg
Follow this and additional works at: http://scholarship.richmond.edu/masters-theses
Part of the Political Science Commons
This Thesis is brought to you for free and open access by the Student Research at UR Scholarship Repository. It has been accepted for inclusion inMaster's Theses by an authorized administrator of UR Scholarship Repository. For more information, please [email protected].
Recommended CitationVerburg, Arthur Henry, "The role of socio-economic status in determining voting behavior in Richmond, Virginia" (1979). Master'sTheses. Paper 1129.

THE ROLE OF SOCIO-ECONOMIC STATUS IN DETERMINING VOTING BEHAVIOR
IN RICHMOND, VIRGINIA
BY
ARTHUR HENRY VERBURG
A THESIS SUBMITTED TO THE GRADUATE FACULTY
OF THE UNIVERSITY OF RICHMOND IN CANO IDA CY
FOR THE DEGREE OF MASTER OF ARTS
IN POLITICAL SCIENCE
MAY, 1979
THE ROLE OF SOCIO-ECONOMIC STATUS IN DETERMINING
VOTING BEHAVIOR IN RICHMOND, VIRGINIA
BY
ARTHUR HENRY VERBURG
APPROVED BY:
Th~ector
Committee Member

ACKNOWLEDGEMENTS
The author wishes to express his thanks to Dr. Arthur
Gunlicks and Dr. John Whelan of the Department of Political
Science of the University of Richmond for their constant help
and guidance during the preparation of this paper. Special
thanks must also be extended to Professor Robert Hodges and
Mr. Hank Freeman, also of the University of Richmond, for
their help with the computer programming. Finally, I wish
to thank Dr. Donald P. Lacy of the Department of Political
Science of Virginia Polytechnic Institute and State University
for planting the seed and framework for this project during
my undergraduate study.
Richmond, Virginia
May, 1979.
Arthur H. Verburg

INTRODUCTION
CHAPTER I.
TABLE OF CONTENTS
.......................................
REVIEW OF LITERATURE ............................ The Sociological School Of Thought
The Psychological School Of Thought
CHAPTER II.
METHODOLOGY
CHAPTER II I.
.....................................
1
3
21
RES UL TS . . . . . . . . . . . . . . . . . . . . . . . . . . . . . . . . . . . . . . . . . 26
CHAPTER IV.
CONCLUSIONS ..................................... APPENDIX ...............•...••..•...................
BIBLIOGRAPHY ...................................... .
iii
49
52
53
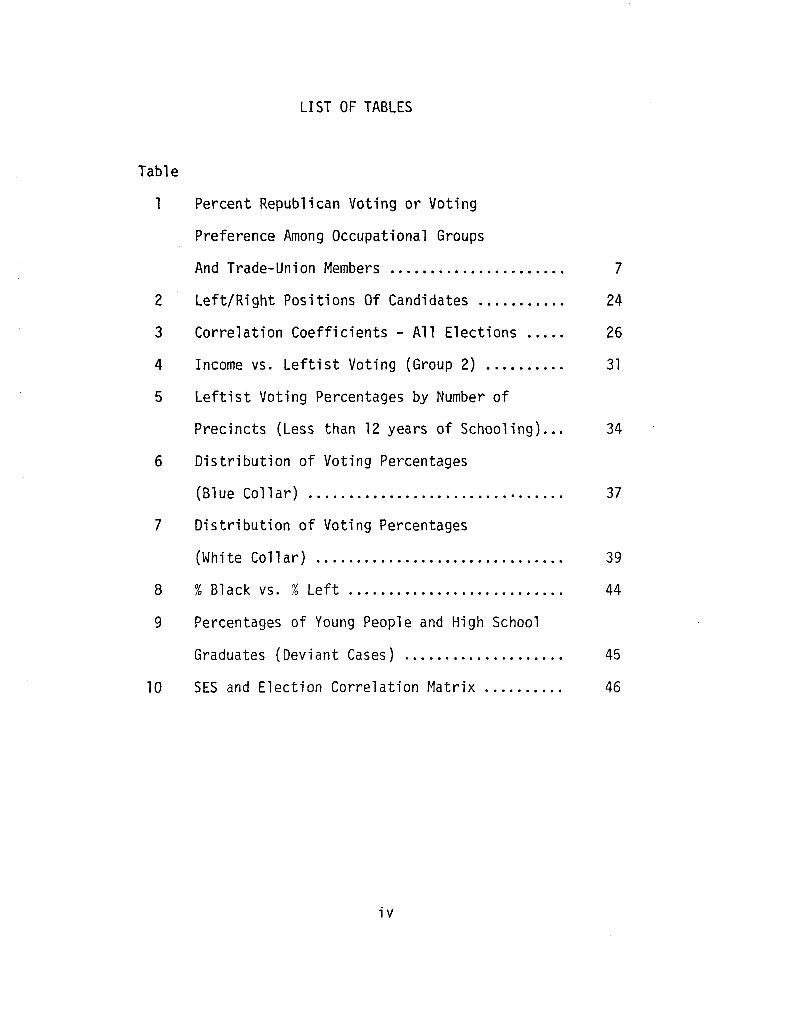
LIST OF TABLES
Table
1 Percent Republican Voting or Voting
Preference Among Occupational Groups
2
3
4
5
6
7
8
9
And Trade-Union Members ........•.............
Left/Right Positions Of Candidates .......... .
Correlation Coefficients - All Elections .....
Income vs. Leftist Voting (Group 2) •..•......
Leftist Voting Percentages by Number of
Precincts (Less than 12 years of Schooling) ...
Distribution of Voting Percentages
(Blue Collar) ............................... .
Distribution of Voting Percentages
(White Collar) .............................. .
% Black vs. % Left .......................... .
Percentages of Young People and High School
7
24
26
31
34
37
39
44
Graduates (Deviant Cases} .............. .... .. 45
10 SES and Election Correlation Matrix ......... . 46
iv

LIST OF ILLUSTRATIONS
Figure
1 Relationship Of Education To
Economic-Liberalism/Conservatism
2
3
4
5
6
7
8
Income Distribution ....................... .
Leftist Voting Percentages
(Income Related) .......................... .
Education Di stri bu ti on .................... .
Precincts By Leftist Voting Percentages
(Less than 12 years of Schooling) ......... .
Distribution Of Blue Collar Workers ....... .
Distribution Of White Collar Workers ...... .
Distribution Of Black Population .......... .
v
11
28
30
32
33
36
40
43

INTRODUCTION
The question as to why an individual votes as he does
has been a much-researched and frequently debated source of
inquiry. Many scholars over the years have examined the ques
tion from different approaches, utilizing a variety of data,
and have arrived at several different answers. In this paper
I will explore one such answer: the role of socio-economic
status (SES). The area of study will be the City of Richmond,
Virginia, during the years 1968-1973.
Chapter I, Review of Literature, summarizes the major
schools of thought surrounding the 11 why 11 of voting behavior.
The first school is the Sociological School, often referred to
as the Columbia School. It is so called because its most notable
advocates came from Columbia University. This school contends
that an individual's socio-economic status determines his or her
voting response. Put simply, if one is a member of the lower
status, he votes a certain way.
status, he votes a different way.
If one is a member of the upper
The second school is the
Psychological School, sometimes referred to as the Michigan
School. This school is so called because its major advocates
came from the Michigan faculty. The people that embrace this
line of thought contend that a person's vote is the result, not
of his class, but of his psychological evaluation of the election
forces surrounding him, i.e., political parties, issues, candidates.
1
Chapter II, Methodology, provides the framework for
this study. Contained in it are the actual hypotheses to be
tested, the definitions and assumptions used, the types of
data employed, and the procedures for analysis. Chapter III,
Results, presents the apparent answers to the questions posed
in Chapter II. The final Chapter, Conclusions, will surrmarize
all findings and place this study in its proper perspective.
2

CHAPTER I
REVIEW OF LITERATURE
As was noted in the Introduction, voting behavior
research can be categorized into two prominent schools of
thought, the Sociological School and the Psychological School.
These emerged at different times in history and took quite
different approaches as to the 11 why11 of voting behavior. In
this chapter we will discuss the major ideas of each school
and cite several representative works.
The Sociological School
The sociological school was the first to emerge. It
appeared at a time when the New Deal Coalition between the
Democratic Party and the poor, minorities, and the laborers
was still pronounced. Franklin Roosevelt had championed their
cause in the 1930's and the bond was still quite strong. The
supporters of this school contended that one's socio-economic
status detennined his or her voting behavior. They cited many
components of SES which they felt accounted for a large per
centage of the variance of voting behavior. The components
included such items as race, ethnic background, age, occupation,
income, religion, and residence (inner city, suburban, rural).
Also studied was the relationship of education to voting be
havior. While it may not be a direct component of SES, it is
3
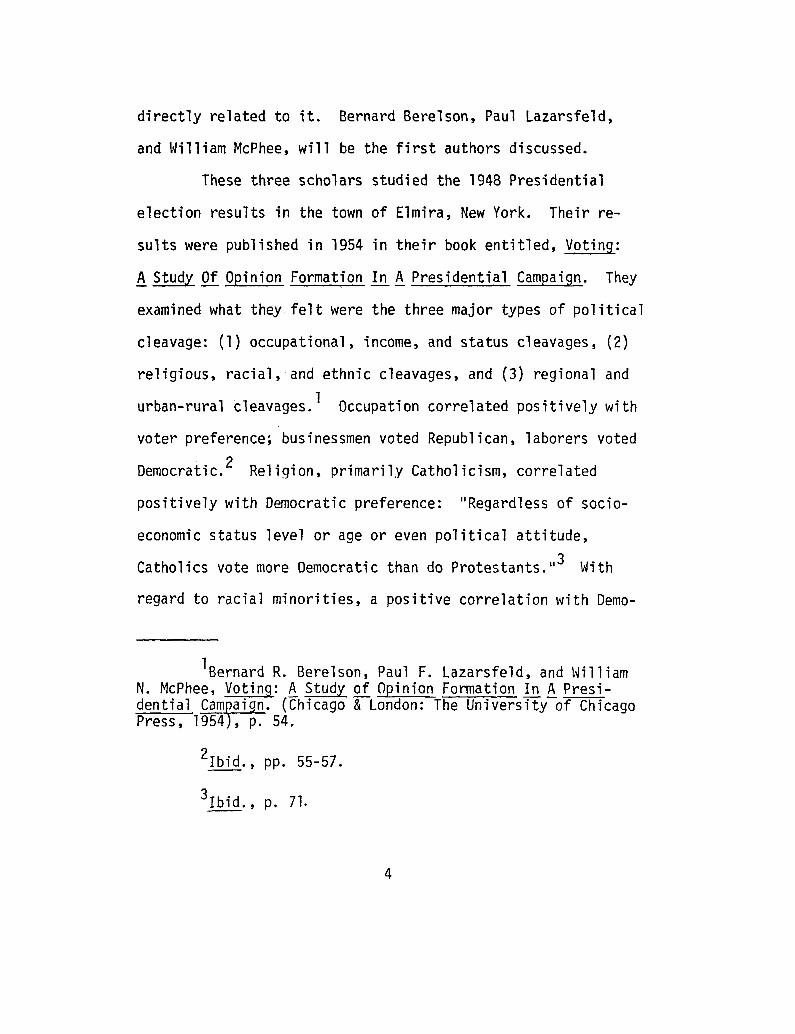
directly related to it. Bernard Berelson, Paul Lazarsfeld,
and William McPhee, will be the first authors discussed.
These three scholars studied the 1948 Presidential
election results in the town of Elmira, New York. Their re-
sults were published in 1954 in their book entitled, Voting:
A Study Of Opinion Formation l!!_ A Presidential Campaign. They
examined what they felt were the three major types of political
cleavage: (1) occupational, income, and status cleavages, (2)
religious, racial, and ethnic cleavages, and (3) regional and
urban-rural cleavages. 1 Occupation correlated positively with
voter preference; businessmen voted Republican, laborers voted
Democratic. 2 Religion, primarily Catholicism, correlated
positively with Democratic preference: "Regardless of socio
economic status level or age or even political attitude,
Catholics vote more Democratic than do Protestants. 113 With
regard to racial minorities, a positive correlation with Demo-
1Bernard R. Berelson, Paul F. Lazarsfeld, and William N. McPhee, Voting: fl Study of Opinion Formation l!l A Presidential Cam~aign. (Chicago & London: The University of Chicago Press, 1954 , p. 54.
2Ibid., pp. 55-57.
3Ibid., p. 71.
4

cratic preference was obtained and became even stronger as the
ties to the minority group become stronger. 4
Nicholas Masters and Deil Wright studied voting trends
in Michigan in the late 1950's and found a similar connection
between socio-economic status and voting behavior. Their linear
correlations revealed that within the cities, occupational
classifications accounted for a substantial amount of variance;
Democratic vote and percent of laborers correlated +0.68, whereas
Republica~ vote and percent of managers correlated +0.77. 5 Such
correlation coefficients do suggest some rather strong relation
ships. Indeed, their studies revealed a close and open associ
ation of organized labor with the Democratic Party. 6
Another study of the social processes which underly
voting behavior was done by R. Duncan Luce in the late 1950's.
He contended that interactions with members of primary groups are
the basic social mechanisms for developing political decisions. 7
4Ibid., pp. 70-72.
5Nicholas A. Masters and Deil S. Wright, "Trends and Variations In The Two-Party Vote: The Case of Michigan", American Political Science Review, LII (December, 1958), 1087.
6Ibid., 1085.
7R. Duncan Luce, "Analyzing The Social Process Underlying Group Voting Patterns", American Voting Behavior, ed. by Eugene Burdick and Arthur Brodbeck (Westport, Connecticut: Greenwood Press, Inc., 1959), p. 333.
5

Therefore, since socio-economic status is a basis for member-
ship in certain primary groups, it will affect voting behavior.
According to Luce, 11 ••• social classification should be a part
of the input data which, with whatever other data appear rele
vant, lead to a prediction of voting behavior. 118
The year 1960 saw the publication of another attempt
to link SES and voting behavior. The book was Political Man:
The Social Bases Of Politics, by Seymour Martin Lipset. His is
a study of the sociology of politics. He concluded that 11 in
every modern democracy conflict among different groups is ex
pressed through political parties which basically represent a
'democratic translation of the class struggle! ;119 11 More than
anything else the party struggle is a conflict among classes. 1110
He cites polling studies since 1936 which show that the percent
of people voting Democratic increases sharply as one moves down
the occupational/income ladder. His figures are reproduced in
the table below. 11
8rbid., p. 332.
9seymour Martin Lipset, Political Man: The Social Bases Of Politics (Garden City, New York: Doubleday & Company, Inc., 1960)' p. 230.
lOibid., p. 234.
11 Ibid., p. 303.
6

Table 1
Percent Republican Voting or Voting Preference Among Occupational Groups and Trade-Union Members
1940 1948 1952 1954
Business and Professional 64 77 64 61
White-collar Workers 52 48 60 52
Manual Workers 35 22 45 35 (skilled & unskilled)
Farmers 46 32 67 56
Trade-Union Members 28 13 39 27
Further support for the view that SES is related to
1956
68
63
50
54
43
voting
behavior came from the results of a Gallup Poll conducted just
prior to the 1958 congressional elections. Respondents constructed
images of typical party support. Democrats were pictured as middle
class, common people, a friend, an ordinary person, someone who
works for his wages, an average person. Republicans were pictured
as well-to-do, big businessmen, wealthy, a money voter, higher
class. 12 For Lipset, 11 ••• the most impressive single fact about
political party support is that in virtually every economically
developed country the lower-income groups vote mainly for parties
of the left, while the higher-income groups vote mainly for parties
Of the rl. ght" . 13 B 1 f h . f y e t, e 1s re erring to parties which represent
12 rbid., p. 305.
13Ibid., p. 234.
7

,themselves as advocating social change in the direction of
equa 1 i ty. 14
He does, however, point out one major exception.
11 Regionalism--the Democratic control of the South and the
traditional Republican domination of many northern states--
represents one important deviation, but a disappearing one, from
the class basis of American politics. 1115 This continual domin-
ation of one party reduces the spirit and enthusiasm of the
opposition minority party. In fact, because 11 ••• the sole road
to an effective political career lies in the Republican Party in
a number of northern states, and the Democratic party in the
South, many ambitious liberals in states like North Dakota or
Vermont become active Republicans, while in the South right-wing
conservatives choose the Democratic road to office. 1116 Since
Richmond, Virginia was the capital of the South during the Civil
War, it will be interesting to see if this situation exists during
the time period and the elections under study.
Two other authors who embrace the sociological school of
thought are David Segal and Marshall Meyer. They conclude that
man is a social animal for which 11 between the individual and the
society of which he is a member, there exists a multitude of
primary and social groupings that define his place in the social
14Ibid., p. 239.
15Ibid., p. 322.
16Ibid., p. 324.
8

order and demand certain behaviors of him. 1117 The pressures
of these groupings are translated into part1cular votes. Segal
and Meyer contend that "surveys of national samples of the
electorate have consistently shown that, although there were
regional differences, people of high socio-economic status tend
to support the Republican party, and persons of low socio-economic
status tend to support the Democratic party. 1118
Another study supporting the importance of SES appeared
in 1968 in The People's Choice, by Paul F. Lazarsfeld, Bernard
Berelson, and Hazel Gaudet. The theme of their book was presented
at the very beginning:
,Any practical politician worth his salt knows a great deal about the stratification of the American electorate. It is part of his every day working equipment to know what kinds of people are likely to be dyed-in-wool Republicans or traditional Democrats.19
Thus to a politician, different social characteristics should mean
different votes. 20
17oavid R. Segal and Marshall W. Meyer, "The Social Contex Of Political Partianship11 , Quantitative Ecological Analysis l!!. The Social Sciences_, ed. by Mattei Dogan and Stein Rokkan (Cambridge, Massachusetts: The M.I.T. Press, 1969), p. 217.
18Ibid., p. 219.
19Paul F. Lazarsfeld, Bernard Berelson, and Hazel Gaudet, The People's Choice (New York and London: Columbia University Press, 1968}, p. 16.
20 rbid., p. 21.
9

The analysis in the above book of election results produced
a multiple correlation coefficient of +0.5 between voting behavior
and social factors. Of those factors, social class, religion, and
residence produced the greatest predictive values. 21 The authors
constructed an Index of Party Predisposition which incorporated
significant characteristics of both Republican and Democrats.
According to the authors' results, 11 the features by which the poli
tician differentiates a Republican and a Democrat, then, seem to
be economic status, religion, residence, and occupation. 1122
The effect of education on voting behavior was the subject
of an article by William N. Stevens and Stephen C. Long, published
in 1970. According to their results, the better educated tend to
b . t" 23 e economic conserva ives. 11 Across the nation, the pas it i ve
correlation between years of schooling and economic conservatism
undoubtedly exists. 1124 On the other hand, Bo Anderson, Zelditch
Morris, Paul.Takagi, and Don Whiteside reported in an article in
21 Ibid., pp. 25-26.
22 Ibi d., p. 16.
23william N. Stephens and Stephen C. Long, 11 Education And Political Behavior11
, Political Science Annual, 1969-1970, ed. by James A. Robinson (New York: The Bobbs-Merrill Company, Inc., 1970), p. 11.
24Ibid., p. 12.
10

in Acta Sociologica in 1965 a curvilinear correlation between
years of schooling and economic liberalism. Their findings are
depicted in the following graph:
>c.!J 0 -I 0 I.LI Cl ...... (....) ...... :::E: 0 z 0 (....) I.LI
Figure l
Relationship of Education to Economic Liberalism/Conservatism
Conservative
Liberal ---------------------------------------- -------Little Schooling
Some College Schooling
Graduate School
They conclude that those with little schooling tend to be econ-
omically liberal. As one moves into college one tends to become
conservative. At the post-graduate level, one becomes liberal again. 25
25so Anderson, Zelditch Morris, Paul Takagi, and Don Whiteside, "On Conservative Attitudes", Acta Sociologica, VIII (1965), 194.
11
UBR,t. ,,.y
UNlVI: · .. · ·.::·.:_tiMOND
VIUG!NIA
The Psychological School
In opposition to this sociological thinking, there emerged
a new school of thought which suggests that the secret of voting
behavior lies within one's own mind, and not simply within his or
her socio-economic class. The scholars embracing this new thinking
argued against, not the actual existence of a class structure, but
the consciousness of that structure. According to the authors of
The American Voter, 11 the social class per se rarely becomes formal
ized as an organization. There is no official class leadership and
no official class policy. 1126 Gerald M. Pamper described it this
way:
Sociological groups do not determine the vote, because they are often no more than artificial categories created by researchers for their own purpose of analysis. An individual may be classified as a worker, but unless he subjectively identifies with the working class, this classification will have little meaning.27
The secret, then, lies within the mind: 11 by casting a vote the
individual acts toward a political world whose objects he perceives
and evaluates in some fashion ...• 11• 28
26Angus Campbell, Phillip E. Converse, Warren E. Miller, and Donald E. Stokes, The American Voter (New York, London, Sydney: John Wiley & Sons, Inc~. ,~1964), p. 186.
27Gerald M. Pamper, Elections In America (New York/Toronto: Dodd, Mead and Company, 1968), p. 81. ~
28campbell, Converse, Miller, and Stokes, The American Voter, p. 13.
12

Within this framework, three major "objects" have been
identified: political parties, political issues, and the poli
tical candidates themselves. It is these objects which the
voter perceives, evaluates, and reacts to. The result is his
or her choice at the polls.
The influence of partisanship begins early in life and
is greatly influenced by one's parents. Dr. Richard E. Renneker,
M.D., studied forty-two of his patients during the Presidential
elections of 1948, 1952, and 1956, and concluded that "party
choices seem transmitted more by identification with the parents. 1129
He further concluded that there " ... was always some sort of mean
ingful relationship between the voting history of the patient
and of the dominant parent. 1130
Gerald M. Pamper also noted the early influence of parti-
sanship but went further to state that of " ... the various groups
which affect political man, the most important is the political
party itself. 1131 For Pamper, party identification 11 ••• is clearly
29Richard E. Renneker, M.D., 11 Some Psychodynamic Aspects of Voting Behavior11
, American Voting Behavior, ed. by Eugene Burdick and Arthur Brodbeck (Westport, Connecticut: Greenwood Press, Inc., 1959), p. 399.
30Ibid.
31 Pomper, Elections l..!!. America, p. 71.
13

related to individual perceptions and to political events. Its
relationship to the vote itself is, therefore, more obvious and
more consistent. 1132
Further support for the role of party can be found in an
article published in 1959, by Angus Campbell and Donald E. Stokes. 33
Their comparative study of SES and party lead to a conclusion that
" •.. traditional allegiance to party, whether Democratic or Repub
lican, continues to be the major correlate of voting behavior. 1134
They went on to conclude that this 11 ••• identification with party
accounts (also) for a larger portion of variance in preference than
do attitudes toward the candidates and issues. 1135
This dominance of party is again reflected and reinforced
by The American Voter. In this book, the authors (Angus Campbell,
Phillip Converse, Warren Miller, and Donald Stokes) note that in
addition to the influence of party, partisan preferences show great
stability between elections. Fluctuations that do occur are due
32 Ibid., p. 83.
33Angus Campbell and Donald E. Stokes, 11 Partisan Attitudes And The Presidential Vote", American Voting Behavior, ed. Eugene Burdick and Arthur J. Brodbeck (Westport Connecticut: Greenwood Press, Inc., 1959).
34Ibid., p. 360.
35 rbid., p. 368.
14

to conflicts between one's personal forces {personal relation
ships) and his social forces. 36 Campbell, et . .!l_., su1T111arize
their findings in the following statement: "Often a change of
candidates and a broad alteration in the nature of issues dis-
turb very little the relative partisanship of a set of electoral
units. 1137 Latter studies, however, attempt to refute this dom
inance of party and its stability over time.
Advocates of an increased role of issue orientation point
to wi1at Uey fee1 is a disintegration of the traditional party
structure. The emerging "independent voter" is often cited as sup-
porting this view. Gerald Pomper, for example, suggests that over
the years the candidates during the campaigns, especially Barry
Goldwater, have emphasized the issues and their party's position on
th . 38 ose issues. Pamper sees an increasing Jdeological identifica-
tion, and awareness by the electorate, of the political parties. It
is this increased awareness, he believes, that has valuted issue
position to the forefront in determining voting behavior. 39 This line
of thinking is carried further by Henry Plotkin in an essay published
36campbell, Converse,- Miller, and Stokes, The American Voter, pp. 67-68.
37 Ibid.
38Gerald M. Pamper, 11 From Confusion to Clarity: Issues And American Voters, 1956-1958 11
, American Political Science Review, LXVI (June, 1972, No. 2), pp. 422-423.
39Ibid., pp. 422-426.
15
in 1977. In that essay he contends that inflation, unemployment,
and tax policy were the crucial elements of the '76 election. 40
The American voter is becoming " ... increasingly ideological in
his or her partisanship, with the Democrats becoming a predominantly
liberal party, the Republicans predominantly conservative. 1141 Con
sequently, if one sees himself as a liberal, then he will vote for
the party which takes a liberal position on the issues.
Michael Margolis, in an article published in 1977, takes
issue with this issue orientation. 42 Margolis examined three of
the issues utilized by Gerald Pamper and the National Survey Re
search Center, and found that 48% of those interviewed saw no
differences between the parties on the question of school integra-
tion. By adding a "no opinion" response, only 34% saw any differ-
ences and thus could have voted on the basis of this issue. On
the issue of Vietnam, however, 48% to 51% did perceive a difference
between the parties. 43 The key for Margolis is issue saliency:
40Henry A. Plotkin, "Issues in the 1976 Presidential Campaign," The Election of 1976, ed. by Marlene M. Pamper (New York: David McKay Company, Inc., 1977), p. 42.
41 Gerald M. Pamper, "The Presidential Election", ibid., p. 74.
42Michael Margolis, "From Confusion to Confusion: Issues And The American Voter (1956-1972)", American Political Science Review, LXXI (March, 1977, No. l).
43Ibid., pp. 35-36.
16

the voters must know about the issues, they must know each party's
position on the issues, and they must care about the issues.
These are the main ingredients of issue voting. 44 If the above
ingredients are present, then issue orientation will be a factor
in the voting decision. Thus issue would be a short term force
which may appear for a period of time and then disappear. Such
thinking is strikingly similar to that advanced in The American
Voter some seventeen years earlier.
In that book, Campbell, Converse, Miller, and Stokes
advanced the idea that in order for an issue to have any influence,
three conditions had to be met. They were: 45
1. The Issue must be cognized in some f onn.
2. The Issue must arouse minimal feeling.
3. The Issue must be accompan1ed by some perception that one party represents the person's own position better than other parties.
The amount of influence exerted by an issue will depend on the de
gree to which these conditions are fulfilled. Campbell, et. al.,
note that "only rarely does a single policy belief comprise the sole
force in the psychological field as the voting decision is made. 1146
44Ibid., p. 38.
45campbell, Converse, Miller, and Stokes, The American Voter, p. 98.
46 Ib1'd., 97 98 pp. - .
17
The third and final 11 object11 for the Psychological
school is the political candidate himself. Stanley Kelley and
Thad Miner explored this "object" in an article presented in
the American Political Science Review in June of 1974. They
concluded, from their study of the 1952, 1956, 1960, and 1964
Presidential elections, that results found in The American
Voter were simply 11 ... an accounting after the fact. 1147 Kelley
and Miner contend that " ... the authors of The American Voter
(did) identify the ingredients that go into voting decisions,
but not the recipe for mixing the ingredients'' ... 48 It is this
"recipe" that is the key.
Kelley and Miner developed what they refer to as the
"Decision Rule." It is the means for translating attitudes to
wards the political "objects" into a decision of how to vote.
The voter canvasses his likes and dislikes of the leading candidates and major parties involved in an election. Weighing each like and dislike equally, he votes for the candidate toward whom he has the greatest net number of favorable attitudes, if there is such a candidate. If no candidate has such
47stanley Kelley, Jr. and Thad W. Miner, "The Simple Act of Voting", American Political Science Review (June, 1974, No. 2), p. 573.
48Ibid.
18
advantage, the voter votes consistently with his party a_ffiliation, if he has one. If his attitudes do not incline him toward one candidate more than toward another, and if he does not identify with one of the major parties, the voter reaches a null decision. 49
It should be noted that candidate orientation is considered
first. If there is nothing noteworthy there, then partisanship
takes control. Partisanship is the governing or long-term force,
subject to interruptions by attractive candidates.
Essentially, then, what we have is political party allegi
ance as the basis of voting decisions within the Psychological
School. This is the long-term governing force. From time to time,
though, either prominent issues (Vietnam) and/or candidates (Eisen
hower) may rise up and challenge traditional party allegiance.
Issues and candidates represent the short-term forces that operate
in the political environment. It must be further noted, however,
that the long term erosion of traditional party loyalty has greatly
increased the opportunity for issues and/or candidates to influence
voting behavior.
Discussion
In conclusion, two major schools dominate voting behavior
theory. The Sociological School contends that one's socio-economic
status determines his or her voting behavior. Supporters of this
school offer considerable amounts of data which they feel link SES
and voting behavior. The Psychological School, however, offers a
49Ibid., p. 574.
19

different line of reasoning. Its supporters contend that the
individual's perception, evaluation, and reaction to the poli
tical environment is the answer. Just because one is poor, or
black, or Catholic does not mean he will vote Democratic.
Likewise, if one is wealthy, he may not vote Republican.
I have not attempted here to make a case for or against
either school. Rather, I have simply tried to acquaint the
reader with some of the ideas that dominate the field of voting
behavior. This study is concerned predominately with the role
of socio-economic status in determining voting behavior. Further
more, the use of aggregate data precludes any analysis of the
Psychological School. The following chapters will, therefore,
focus only on the Sociological School.
20
CHAPTER II
METHODOLOGY
This study, as was noted previously, will focus only on
the Sociological School. We will be examining only the role,
if any, of socio-economic status in determining voting behavior
in the City of Richmond, Virginia. We will attempt to detennine
if the findings of Berelson, Lazarsfeld, McPhee, Lipset, etc.
are applicable to Richmond; that is, is there a class basis for
politics in Richmond, Virginia? Specifically, we will seek the
answers to five major questions. They are:
l. Can support for the Sociological School be found in Richmond, Virginia?
2. If so, how do the results compare with previous studies?
3. Do the lower socio-economic classes actually vote consistently for leftist candidates?
4. Do the upper socio-economic classes actually vote consistently for rightist candidates?
5. Are there any variations among the different types of elections (Presidential, Congressional, etc.)?
Election results and demographic data for each voting pre
cinct in the City of Richmond will be correlated and analysed.
Pearson's Product Moment Correlation will be utilized to measure
the linear relationship, if any, between SES (the independent
variable) and voting behavior (the dependent variable). We will
21 ., !

be provided the strength of any relationship as well as the
direction. For example, if income is found to be related to
voting behavior, the correlation coefficient will tell us how
strong the relationship is and what happens to that voting be-
havior as income increases or decreases. It must be noted,
however, that by using linear measurement control for other
outside variables is limited. The actual correlation coefficient
will tend to be somewhat inflated. Only factor analysis can
supply complete control, and that procedure is beyond the capa
bilities of this author. This inflation of correlation must be
taken into consideration when formulating any conclusions.
For the purposes of this study, four variables will con-
stitute our definition of socio-economic status:
1. Income 2. Education 3. Occupation 4. Race
They are found throughout previous studies and data for them is
easily obtained. More importantly, though, they are sufficient to
construct a general picture of the socio-economic status of the
areas under study. They may not tell us exactly how high or low
the status is, but they will enable us to differentiate between
high and low. Income, as used in this paper, is defined as mean
income as reported in the 1970 census. Education is defined as
the average number of years of schooling as reported in the 1970
census. Occupation will be divided into two major groups, blue
collar and white collar. Blue collar is defined as the percentage
22
of the labor force·employed as laborers, craftsmen, and foremen.
White collar is defined as the percentage of the labor force
employed as professionals, managers, and administrators. Within
Richmond, Virginia, there is only one minority race or ethnic
group of any significant size and that is the Negro. Therefore,
race is defined as the percentage of the population being black.
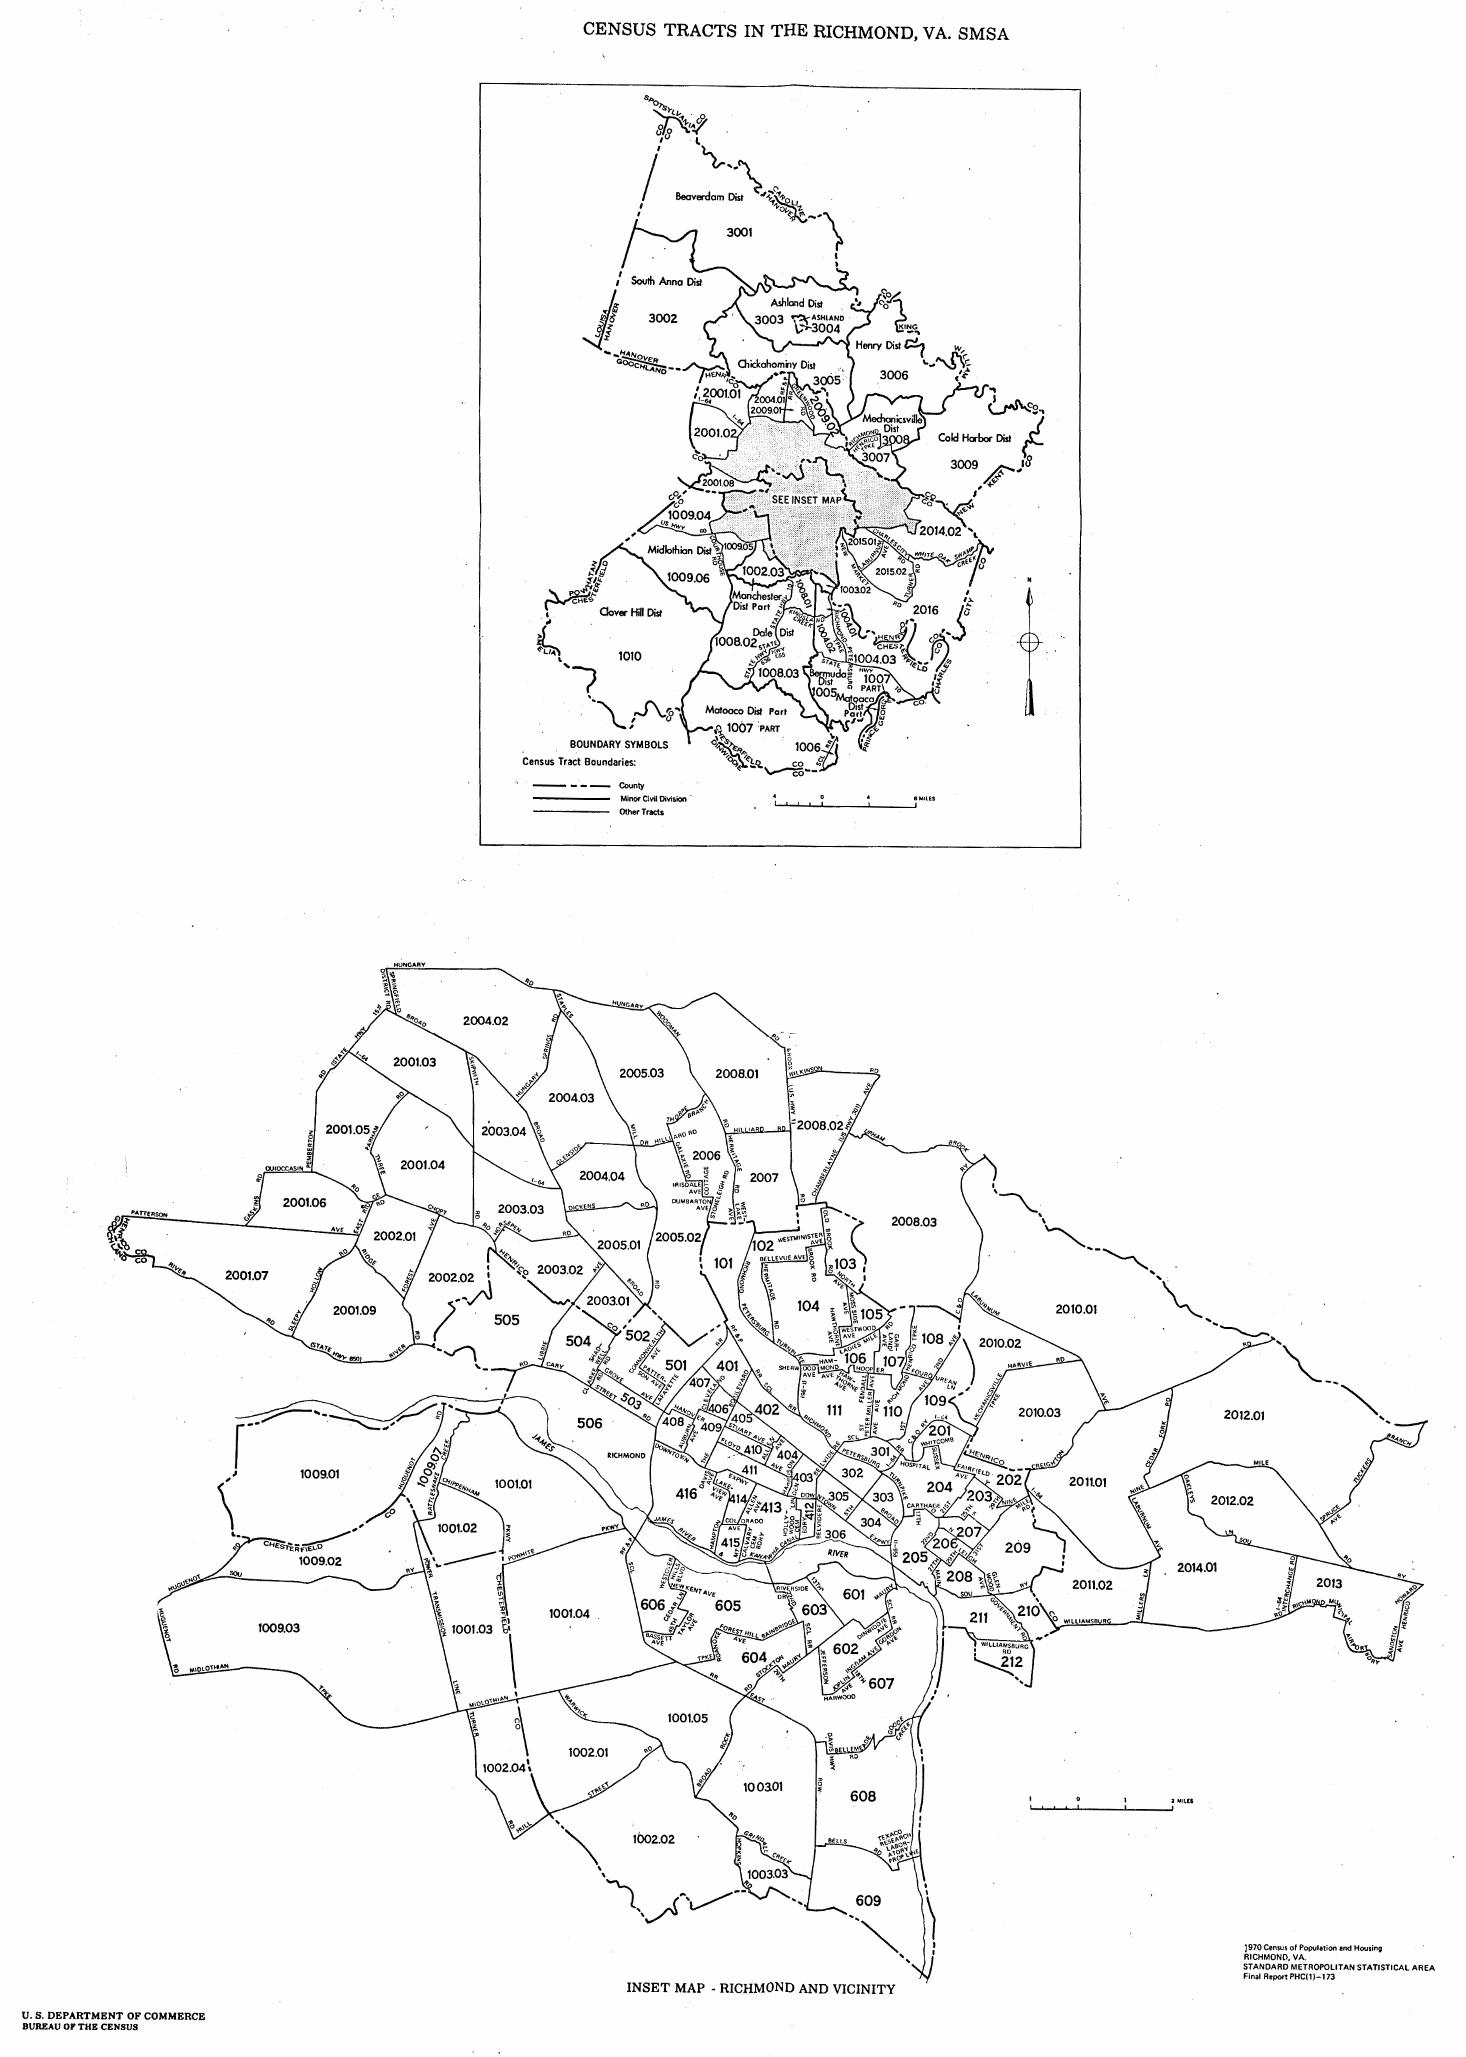
A study of the maps of the census tracts and the voting
precincts, provided in Appendix A and B, reveals striking similar
ities. Voting precincts correspond very closely to the various
census tracts. By aligning the precincts with their appropriate
or closest census tracts, one can construct a general socio-
economic picture of each precinct. Once this is accomplished, it
is rather easy to secure the voting results of each precinct and
compare these to the socio-economic census tracts. Maps of the
voting precincts as they existed in 1971, and the census tracts
as they existed in 1970 are included as Appendix A and B to this
report.
The last item to be discussed here is the types and dates
of the elections to be studied. Since the precinct map is dated
1971 and the census tract map is dated 1970, in the interest of
consistency, the election years must be close to those dates.
With this in mind, the following six elections have been selected:
1. 1968 Presidential 2. 1969 Gubernatorial 3. 1970 Senatorial 4. 1971 Lt. Governor 5. 1972 President i a 1 6. 1973 Gubernatorial
23
It was the decision of this author that only the more prominent
elections would be incorporated; therefore, nothing below a
statewide election will be considered. Statewide elections
attract considerably more publicity and attention than do local
elections and, therefore, result in greater awareness on the part
of the voter. The above elections satisfy the time requirement,
the type of election requirement, and yet provide a good variety.
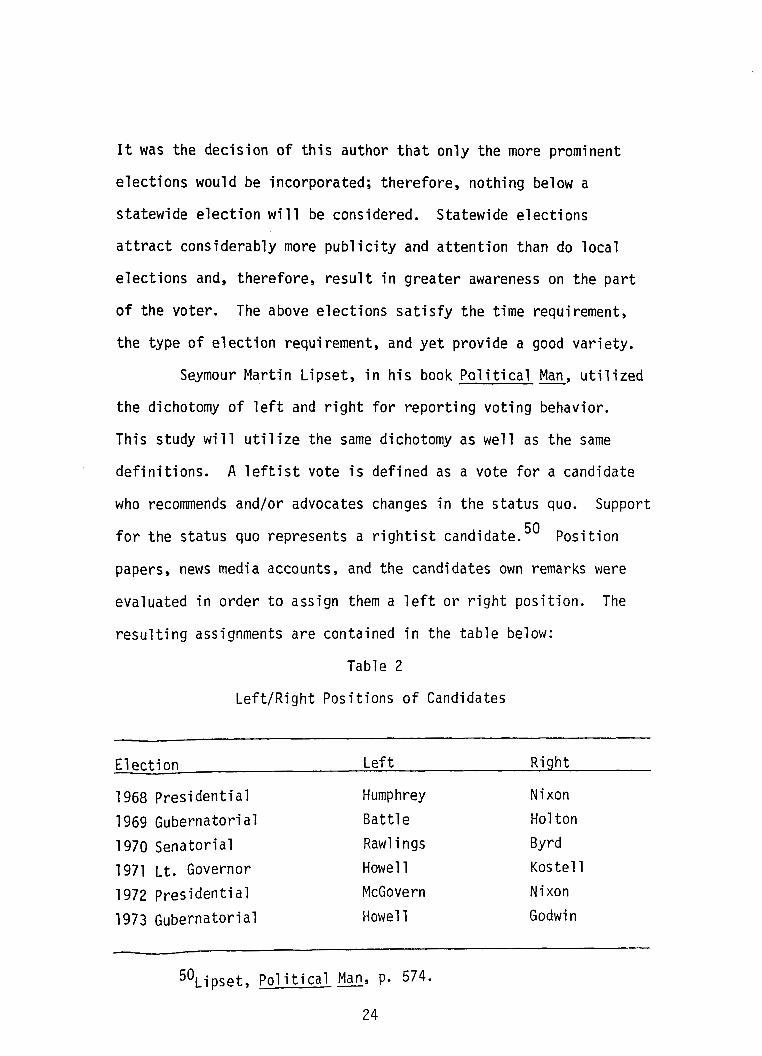
Seymour Martin Lipset, in his book Political Man, utilized
the dichotomy of left and right for reporting voting behavior.
This study will utilize the same dichotomy as well as the same
definitions. A leftist vote is defined as a vote for a candidate
who recommends and/or advocates changes in the status quo. Support
for the status quo represents a rightist candidate. 50 Position
papers, news media accounts, and the candidates own remarks were
evaluated in order to assign them a left or right position. The
resulting assignments are contained in the table below:
Table 2
Left/Right Positions of Candidates
Election Left Right
1968 Presidential Humphrey Nixon
1969 Gubernatorial Battle Holton
1970 Senatorial Rawlings Byrd
1971 Lt. Governor Howell Kos tell
1972 Presidential McGovern Nixon
1973 Gubernatorial Howell Godwin
50Lipset, Political Man, p. 574.
24
It must be emphasized at this point that the above assign
ments are only my interpretations of the candidates, in the light
of the definitions of left and right. It is admitted that some
of them are extremely close in their positions, particularly
Battle and Holton in 1969. Also, the influence of consumer issues
and Henry Howell's populist appeal in 1973 is acknowledged. During
that election, he did enjoy much of the Wallace vote. In fact, he
and Senator Byrd share some support. A close examination, however,
reveals that " •.. Howell does gain greater support as we travel
leftward on the ideological continuum11•
51
At this point, we are prepared to begin our analysis. We
will examine each of the four variables to see if there is any
relationship to the recorded voting behavior. Precincts will be
treated as individual respondents, with voting results recorded
as a percentage of the total vote.
51 Larry Sabata, Aftermath Of 'Arma eddon': An Analysis Of The 1973 Virginia Gubernatorial Election Charlottesville, Virginia: University of Virginia Printing Office, 1975), p. 76.
25

CHAPTER III
RESULTS
This section represents the heart of this project. It
is here that our findings are presented. The discussion will
begin with an over-all view of all the correlation coefficients
achieved, and then will move to an individual and more detailed
analysis of SES components (income, education, occupation,
race).
Initially, a correlation analysis was made between each
independent variable and the average percent of leftist voting for
all six elections combined. The results are contained below:
Table 3
Correlation Coefficients - All Elections
SES Component % Left - All Elections
1. Income -.5405
2. Education -.6569
3. % Blue Collar .2886
4. % White Collar -.7286
5. % Black . 9316
According to accepted statistical theory, only correlation coeffi
cients of± .3 or more, can be considered statistically significant.
Five of the variables satisfy this requirement. Only the percent
26
of blue collar workers failed, but the value of .2886 is very
close. One must keep in mind, however, the inflation aspect of
linear analysis discussed in Chapter II. The relationships may
in fact be substantially less than at first glance. A later
examination of each separate variable will attempt to adjust and
place the relationships into proper perspective. We must note at
this point, though, the direction of the relationships.
A positive correlation coefficient means that as the in
dependent variable increases, so does the dependent variable, and
vice versa. A negative coefficient reflects an inverse relation
ship; as the independent variable increases, the dependent variable
decreases, and vice versa. Percent blue collar workers and percent
black correlated positively. Therefore, as they increase, so does
leftist voting. Income, education, and percent white collar corre
lated negatively. As they increase, the percentage of leftist
voting decreases. An examination of the precincts themselves will
confirm or deny these findings.
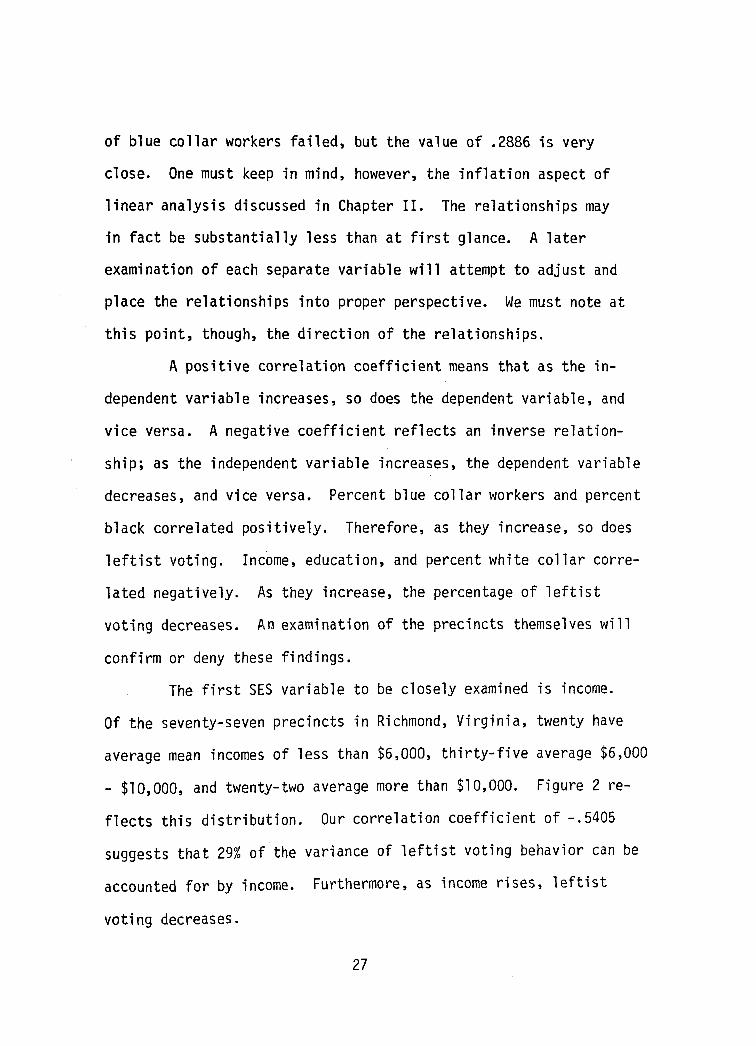
The first SES variable to be closely examined is income.
Of the seventy-seven precincts in Richmond, Virginia, twenty have
average mean incomes of less than $6,000, thirty-five average $6,000
- $10,000, and twenty-two average more than $10,000. Figure 2 re
flects this distribution. Our correlation coefficient of -.5405
suggests that 29% of the variance of leftist voting behavior can be
accounted for by income. Furthermore, as income rises, leftist
voting decreases.
27

I . I .....
...
- )i i J ·~·· • ·~ ,~· .. ; ~ ~.
. ! 1 t:·-
... :• .. j~··· .- "·· . '· .. : ~-·; ... ·'
"/. \,, ·: .
28
1 r'w .,. ), J~i
'l I
,,'
\ I ; .I
, .
' ·- 1 .:-···· :t
I '; ! ~. " ... , .. . .
. ~'S~~'I y~" .-;~;~;;:: ) '\.
~,,d
j . . '/. ~ ~
.....
• !
I,
:.:
/I. . ' .}
• -· ,<:'
! l..;p
' .... ,
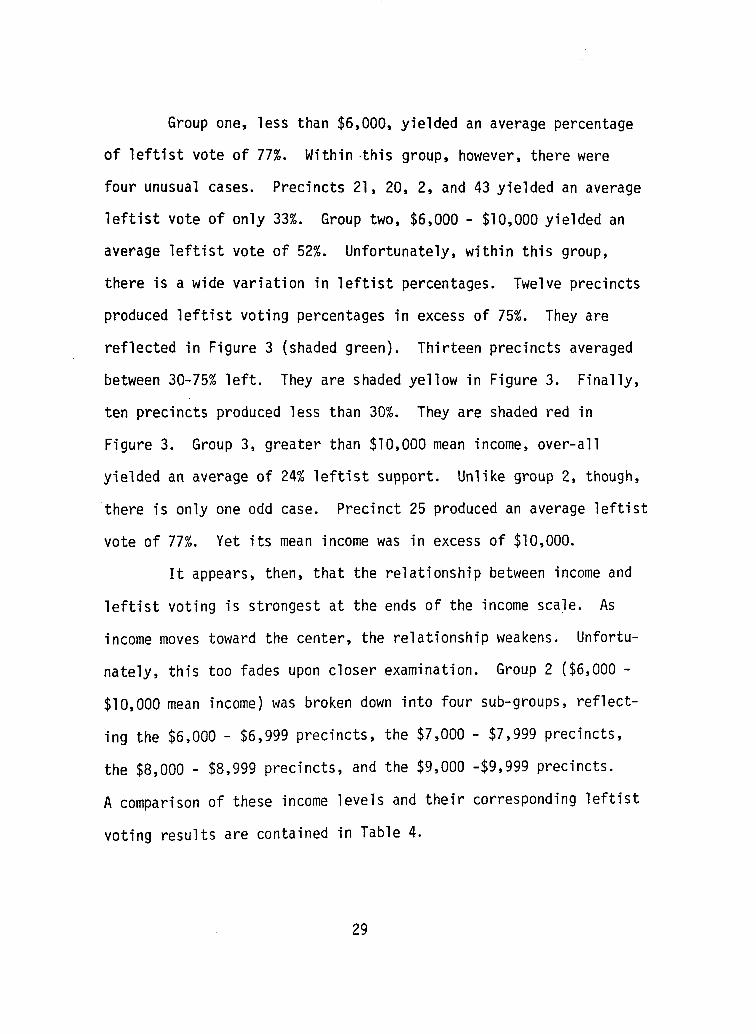
Group one, less than $6,000, yielded an average percentage
of leftist vote of 77%. Within this group, however, there were
four unusual cases. Precincts 21, 20, 2, and 43 yielded an average
leftist vote of only 33%. Group two, $6,000 - $10,000 yielded an
average leftist vote of 52%. Unfortunately, within this group,
there is a wide variation in leftist percentages. Twelve precincts
produced leftist voting percentages in excess of 75%. They are
reflected in Figure 3 {shaded green). Thirteen precincts averaged
between 30-75% left. They are shaded yellow in Figure 3. Finally,
ten precincts produced less than 30%. They are shaded red in
Figure 3. Group 3, greater than $10,000 mean income, over-all
yielded an average of 24% leftist support. Unlike group 2, though,
there is only one odd case. Precinct 25 produced an average leftist
vote of 77%. Yet its mean income was in excess of $10,000.
It appears, then, that the relationship between income and
leftist voting is strongest at the ends of the income scale. As
income moves toward the center, the relationship weakens. Unfortu
nately, this too fades upon closer examination. Group 2 ($6,000 -
$10,000 mean income) was broken down into four sub-groups, reflect
ing the $6,000 - $6,999 precincts, the $7,000 - $7,999 precincts,
the $8,000 - $8,999 precincts, and the $9,000 -$9,999 precincts.
A comparison of these income levels and their corresponding leftist
voting results are contained in Table 4.
29
. ··· '-·
JO
I - I
·-.. ,
/
..
,.
. :·'·, /
\.'
'' ','' :' .. , ... 1
" --.\ F,·;::: ........ '
... ' \,
\
I
!
I,
. · 'f. ' .. • l
'.
_I ......
'' :(/) . ci
~\·-"r; :z r,-:,1· ..... < "'
~oOz z ~! t!...
u "<::' -·· 0 ~·1 ',1·· ..._ ,\... r .£. ,, ~ ~ -~: I .J
'
UJ 1- - ·> .... 0 a:::--"I E z p-- .:_, Q.. U()> w,._-~ ,11 •
- - -· ~ :1. (.!) ct. "... -T z .r ·o >
> \ 75%
30.% ,.. 75%
l '\...,::J
1-. • -..1

Table 4
Income vs Leftist Voting (Group 2)
No. Precincts No. Precincts Income Level <50% Left > 50% Left
$6,000 - $6,999 5 7
$7,000 - $7,999 6 6
$8,000 - $8,999 4 1
$9,000 - $9,999 4 2
The relationship between income and voting behavior appears weak
at best. At the lower income levels, one might just as well find
either a low or a high percentage of leftist voting.
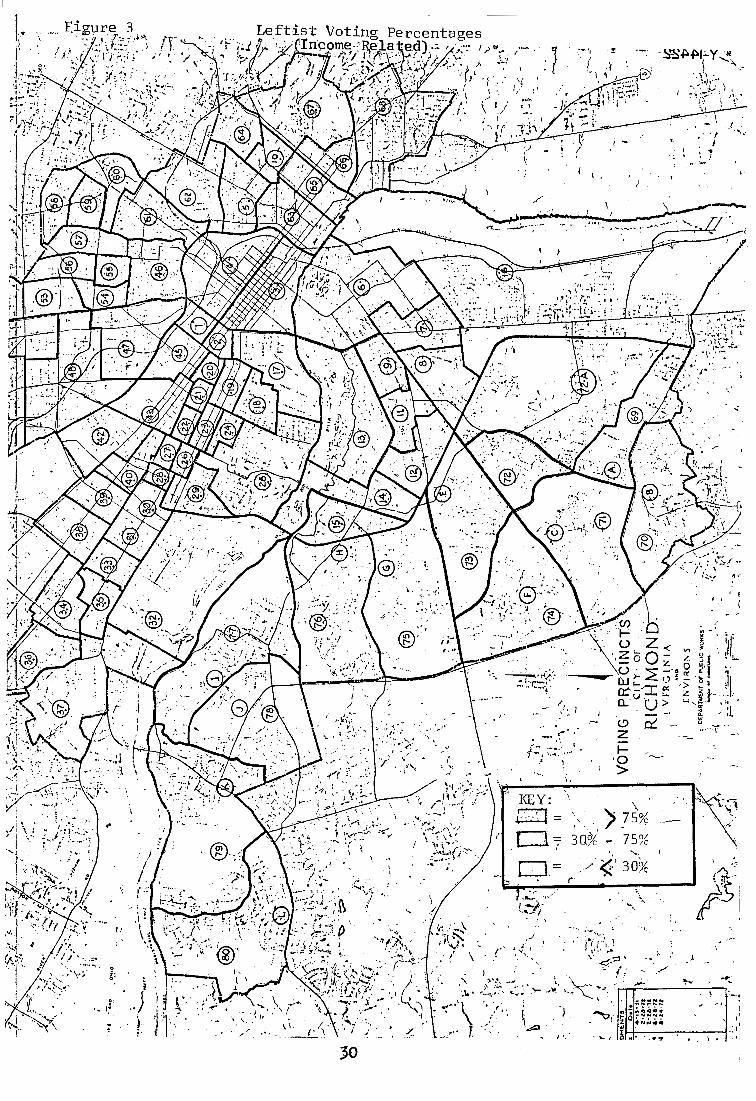
Education is the second SES variable to be explored. The
computer produced a negative correlation coefficient of -.06569
between median school years and leftist voting. This translates
into an apparent 43% accountability of leftist voting variance.
Also, because of the negative sign of the coefficient, leftist
voting should decrease as median school years increase, and vice
versa. Within Richmond's seventy-seven precincts, forty-three
averaged less than 12 years of schooling, seventeen averaged 12
years, and seventeen averaged more than 12 years. Figure 4 depicts
this distribution.
Group one, less than 12 years, produced a wide distribution
of leftist voting. Percentages of leftist voting ranged from a low
of 16% to a high of 96%. Table 5 outlines these findings, and
31
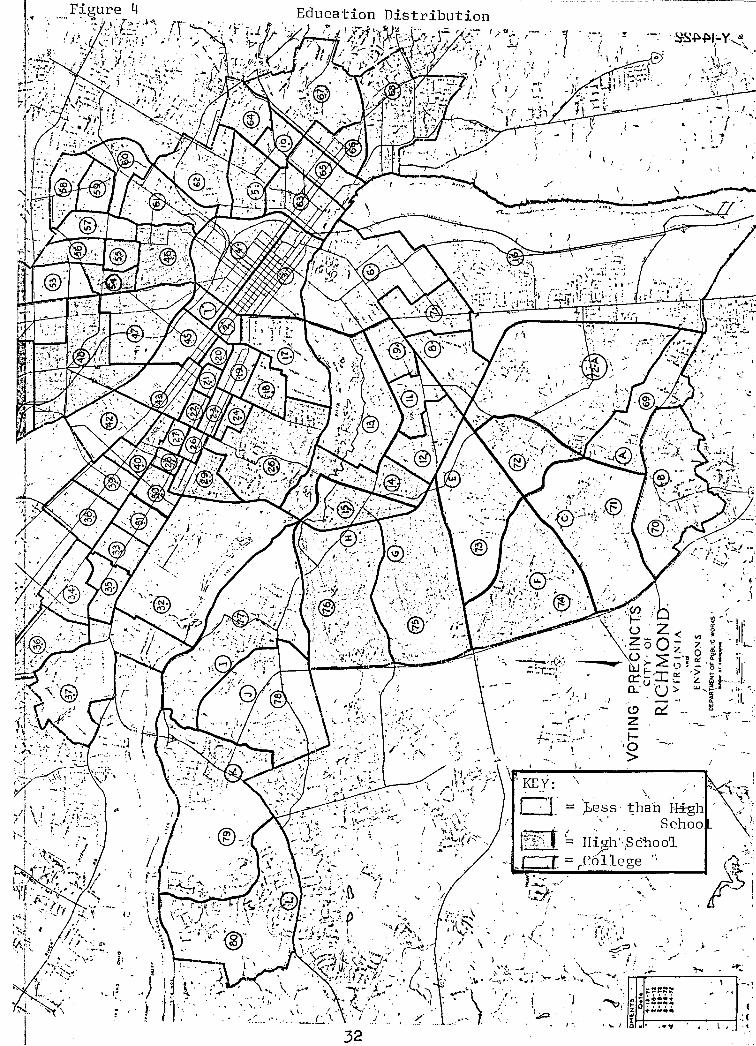
Figure 4
'•
j
32
,.
1 \.'
I> I,.. ~ '
-· (" . •'
f.:.; ~-::: ,• .... . •
I I
; .
., -.. -.... ~·
.}
··--
.. -A1<?i·:' \ KEY:
i .
' \ \ ' I i · ... _,
.. , ,/
: : r,-:·.:: \ "''l~-;ly,
/ \
"'·
D. =
tifi;J ~ ··-_c:r =
............. ·c~/
, ..... .11, -... Ji
,.
';Les.s i;ha·n High Schoo
High\S c'hoo'l rccillege "
._l .....
:,:

5 ...
'· ...
. t:
-. '.:.
i . .) ) ,.
....
I~ \ ·.-
1l:~.
'•
}3
' ., ./
._I . ~ .. ·
I' / .
l'J, ,. '" ,}
,. - .. +:.:; ·; ::·'· ·' .... ..
'rJ KEY:
11r·~1 = Ii!:] = l I = q=
r
.. , .. ~.. ,
} :.::: .,/ 1-.l\· •.s././
. '
,~
~ ..;· f
. '· ...
_\
\ \,
25% I
26 ;. ,50% 51 -; t ~%'·; 7fr< .. 100%"· ·,..
. '
...... .. :
..... ,
!~f~~; ~ o~zzzz • ~U.---....,...--.,--1·: c 0 .. ' . ,•'JI •. ·• 1-.·
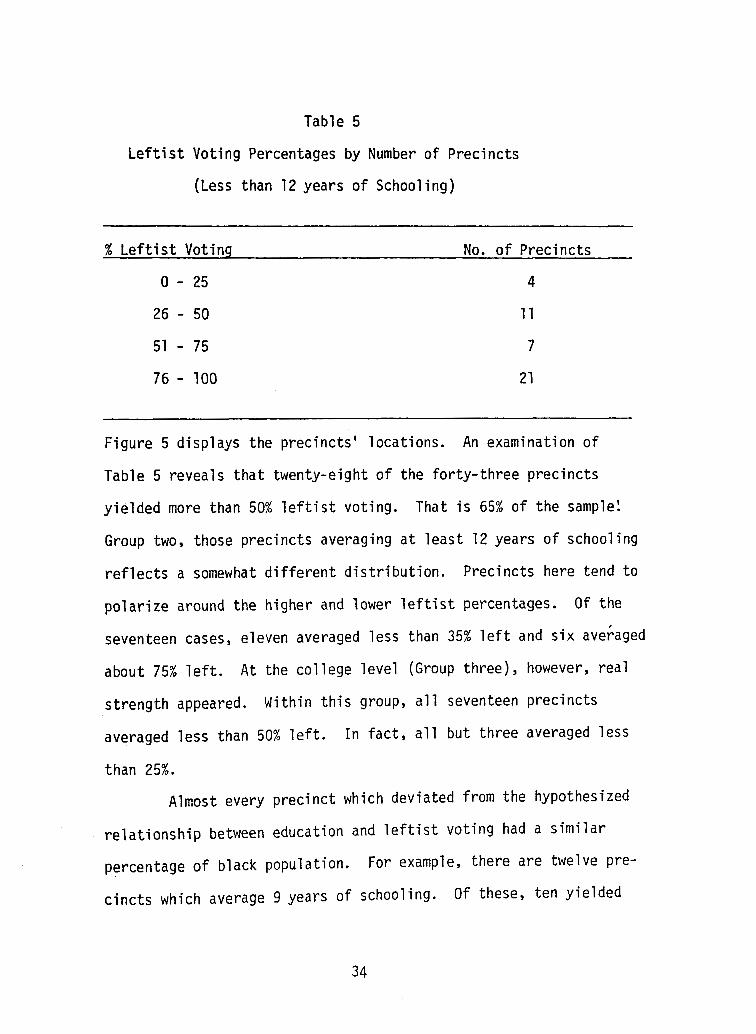
Table 5
Leftist Voting Percentages by Number of Precincts
(Less than 12 years of Schooling)
% Leftist Voting No. of Precincts
0 - 25 4
26 - 50 11
51 - 75 7
76 - 100 21
Figure 5 displays the precincts' locations. An examination of
Table 5 reveals that twenty-eight of the forty-three precincts
yielded more than 50% leftist voting. That is 65% of the sample~
Group two, those precincts averaging at least 12 years of schooling
reflects a somewhat different distribution. Precincts here tend to
polarize around the higher and lower leftist percentages. Of the
seventeen cases, eleven averaged less than 35% left and six averaged
about 75% left. At the college level (Group three), however, real
strength appeared. Within this group, all seventeen precincts
averaged less than 50% left. In fact, all but three averaged less
than 25%.
Almost every precinct which deviated from the hypothesized
relationship between education and leftist voting had a similar
percentage of black population. For example, there are twelve pre
cincts which average 9 years of schooling. Of these, ten yielded
34

leftist voting percentages in excess of 75%. They also yielded
black population percentages in excess of 67%. On the other
hand, two of these twelve produced leftist percentages of only
34% and 47%. Their corresponding black percentages were 11%
and 25%. Other levels of schooling revealed similar results.
In conclusion, then, the relationship between education and
leftist voting appears weak. At the less than high school level
there is some support, while at the high school level there is
little support. At the college level support returns. It may
well be, however, that the percentage of blacks is the real
relationship. We will hold further discussion of this until
later.
The third SES variable examined was occupation. As was
noted in Chapter II, this variable has been divided into two
components, percent of blue collar workers and percent of white
collar workers. Previous research suggests that leftist support
should be found among the blue collar workers. Also, as the
percent of blue collar workers increases, so should the percent
of leftist voting. Likewise, we should expect to see an inverse
relationship with the percent of white collar workers. As they
increase, leftist voting should decrease.
The variable of blue collar did indeed correlate positive
ly with leftist voting. The correlation coefficient, however, was
only +0.2886. This translates into an 8% accountability of the
35

•./.
FigU~f3 6 .. 1/}(·;·
/
/
; )
. i ··- . .f
} 13c·:· .. , Ji':~ ... ~ . '· ...
/'. '""""~ .......
I
,. :. _: ;:~ ... ·. :
.. . : :·.: .-·~·-·· . '
. ' . _,,. ,
f. ;;..
" . \
., ,/
" '
}
I •
/
. w ·a
~~~~l,'-Y~· )
\~·; . .'-· .,. •: .._:~'.. I
.. ( I
,..
' .
~\:··· ·· ·~ __ , z0
< ~ r · "0 ° ~~-.~JI w >- £.. ,_, : - 0 •
_;..._..,...°'-> :;:· crc;..i....,_ z \lit
":. . ' r6. ' - '
f:., ·;::: ...... ·'
·~- ..
1:.:: ... ,_,. ...... , • ! ..
,I
I l...,:s
('
a.. () > ~T .. - -· ~ l9 o::'. " z I
.I
1-·o >
',
'.._I
variance of leftist voting behavior. As was noted in Chapter II,
only ±0.3 or more can be considered statistically significant.
On the surface, therefore, the relationship between blue collar
and leftist voting appears rather weak, especially given the in
flationary tendency of linear analysis.
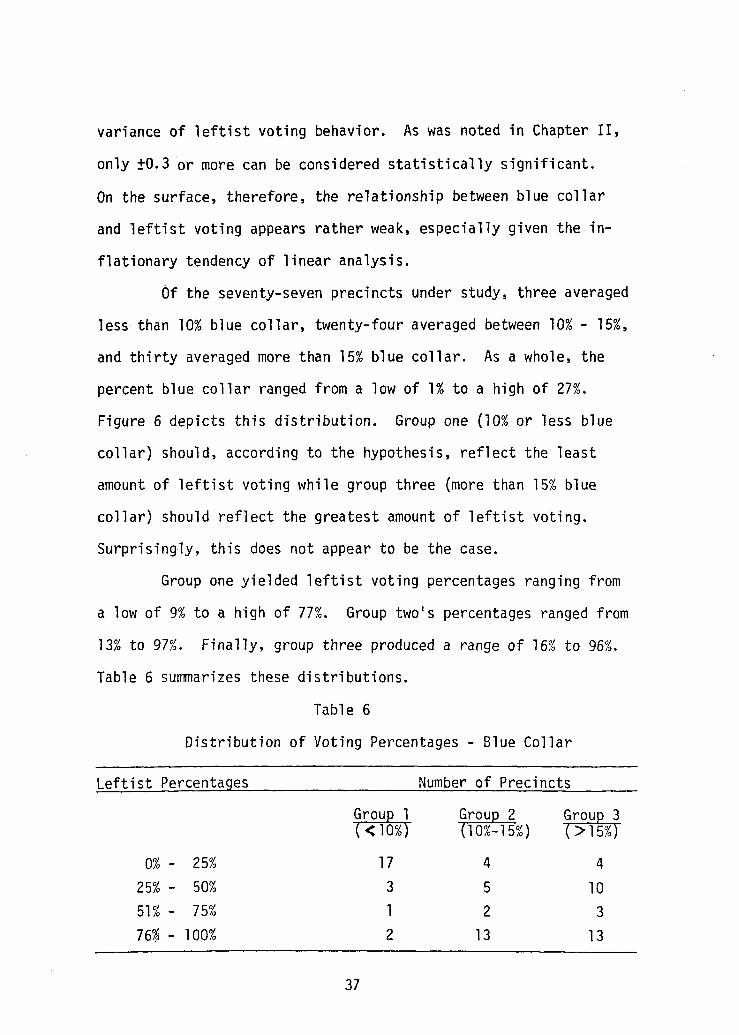
Of the seventy-seven precincts under study, three averaged
less than 10% blue collar, twenty-four averaged between 10% - 15%,
and thirty averaged more than 15% blue collar. As a whole, the
percent blue collar ranged from a low of 1% to a high of 27%.
Figure 6 depicts this distribution. Group one (10% or less blue
collar) should, according to the hypothesis, reflect the least
amount of leftist voting while group three (more than 15% blue
collar) should reflect the greatest amount of leftist voting.
Surprisingly, this does not appear to be the case.
Group one yielded leftist voting percentages ranging from
a low of 9% to a high of 77%. Group two's percentages ranged from
13% to 97%. Finally, group three produced a range of 16% to 96%.
Table 6 summarizes these distributions.
Table 6
Distribution of Voting Percentages - Blue Collar
Leftist Percentages
0% - 25% 25% - 50% 51% - 75%
76% - 100%
Grau l <10%
17 3 l 2
37
Number of Precincts
Grau 2 Grau 10%-15%) >15%
4 4
5 10 2 3
13 13
3

One can see that groups two and three do not support the
original hypothesis concerning leftist voting and blue collar.
The distributions of leftist support is somewhat balanced. Group
one, though, presents a somewhat different picture. As one can see,
the great majority of the precincts within this group averaged 25%
or less of leftist voting. Now one might conclude that these
figures tend to support the original hypothesis. There appears,
however, to be another variable at work here.
Of the seventeen precincts registering 25% or less leftist
vote, only two contain more than 5% blacks. On the other hand,
the two precincts averaging more than 75% left produced black per
centages of 58% and 69%. The four precincts in the other two
brackets also yielded progressively higher black percentages.
Perhaps then, as in the case of education, the black percentage is
more important. We will examine this in greater detail later.
We turn now to the other half of the occupation variable,
percent white collar. The computer generated a negative correlation
coefficient of -0.7286. That translates into an accountability of
53% of the variance of leftist voting behavior. Such coefficients
are highly unusual in statistical analysis. Undoubtedly, the infla
tion aspect of linear analysis is partly responsible. Nevertheless,
a strong inverse relationship is indicated. We should expect to
find the percent of leftist voting decreasing as the percent of white
collar workers increases.
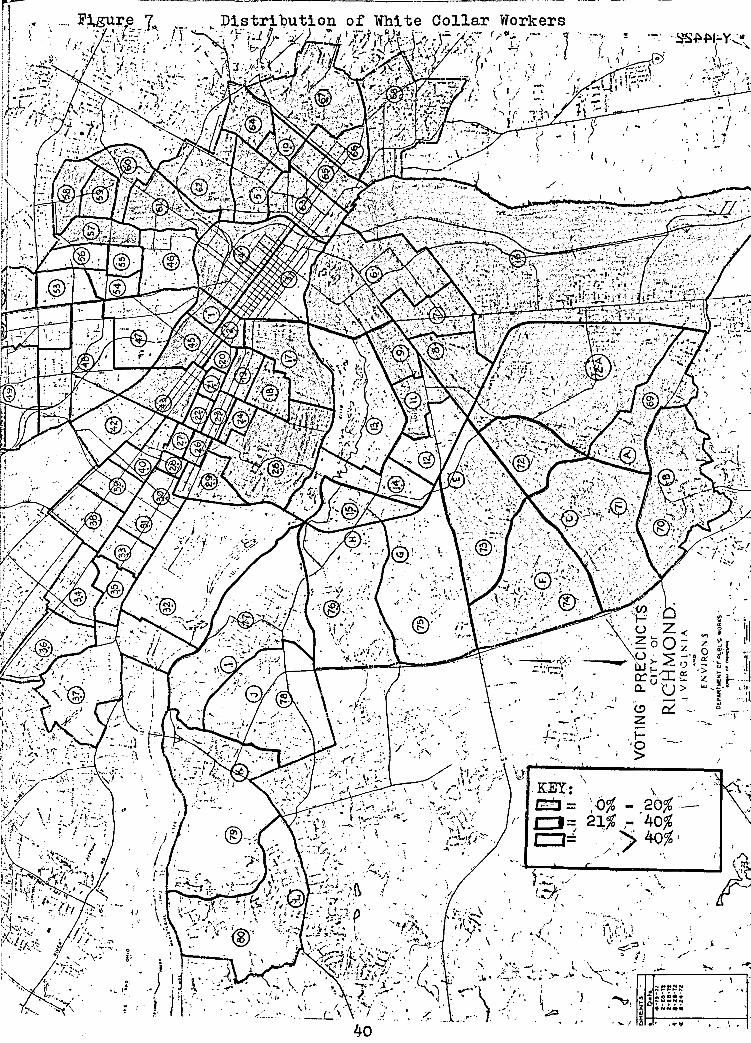
White collar percentages varied within Richmond from a low
of 5% to a high of 60%. Of the seventy-seven precincts, thirty-nine
38

averaged 0% - 20% white collar, twenty-five averaged 21% - 40%,
and thirteen averaged greater than 40% white collar. Figure 7
depicts this distribution. Group one (0% - 20% white collar), if
the hypothesis is correct, should reflect the highest percentage
of leftist voting and group three (greater than 40% white collar)
should reflect the lowest percentage. Table 7 sunmarizes the dis
tribution of leftist voting within these three groups.
Table 7
Distribution of Voting Percentages
(White Collar)
Leftist Percentages Number of Precincts
Grau~ 1 Grau~ 2 Grou~ 3
(0%-20%) (21%-40%) ( > 40%)
0 - 25% 2 10 13
26 - 50% 11 7 0
51 - 75% 5 4 0
76 - 100% 21 4 0
An examination of this table does suggest support for the hypothesis.
As we progress from a low percentage of white collar workers (group
one) to a higher percentage (group three), the number of precincts
with a low leftist voting percentage increases. Likewise, the re
verse happens. For example, there are more precincts in the 0% -
25% leftist voting bracket in group three than there is in group one.
39
of White
<..~,/ :f
40
I . I
/ ... •·
Collar
.. , ,/.
: : ~-:.::..~ .. ,(~. ''V· : / \
,.,.-···\ - '
•• !"""·
Workers
l .. -- .. ,. ! -$~.f)li;. y~
•J', I' / .
\ './
I'
\I ' . I>' ~ I ..
....... . -. [.:.; ·;:=:·~ .. .... ' •
,• ' \"!1· \
.. KEY:
, ..
r
f,_,; I = Cl~ c::i=
'. -~ i ........... ·~··/ , -.t'·S./.f
• I
,.J
~ . .f f . '•
,.
. I "' .. ·\~),:~
I I
. 1
(.!)
z 1-·o >
_ .. """"" . ~';"':'':':" ~~?~~;; ~ ,..,,,.., ...
'..._I ~ . . . ....
\f'· )'\ ..I
.· I ; .. • !
' .
...

Conversely, there are fewer precincts in the 76~ - 100% voting
bracket in group three than there are in group one. As the per
centage of white collar workers increases, the percentage of
leftist voting decreases. But what about the black influence?
The two precincts in group one which fall into the 0% -
25% voting bracket yield leftist voting percentages of 24% and
25%. Their corresponding black percentages are 1% and 19%
respectively. The twenty-one precincts in group one which fall
into the 76% - 100% voting bracket all average in excess of 58%
black. In fact, fourteen of the twenty-one average in excess of
75% black. Furthermore, all of the thirteen precincts in group
three average less than 12% black. Eleven of them even average
less than 5%. The pattern is obvious. Precincts with lower per
centages of black inhabitants tend to yield lower percentages
of leftist voting.
In summation, then, the relationship between occupation
and leftist voting appears moderate. The relationship to blue
collar workers is somewhat weak, but present. The extreme lower
percentages of blue collar workers reflect low percentages of
leftist voting. White collar workers on the other hand suggest
a strong relationship. The correlation coefficient was large and
the precinct data corroborate it. There is, however, that one
cloud of uncertainity, the role of race. A pattern emerged here
which suggests that the role of race may well be the primary
component. We will now examine this in greater detail.
41

Race is the final SES variable examined. As was noted
in Chapter II, race is defined as the percentage of population
being black. The computer produced a correlation coefficient of
+0.9316 between percent black and leftist voting. This means that
87% of the variance of leftist voting can be accounted for by the
percentage of black population. Coupled with a level of signi
ficance of .001 (only one change out of a thousand that the results
are due to chance), this easily becomes our strongest relationship.
Furthermore, since the coefficient is positive, we expect the per
cent of leftist voting to increase as the percent of blacks
increases.
Earlier, we suggested this relationship as an explanation
for the deviant results obtained for education and occupation.
In those odd cases high and low percentages of leftist voting were
associated with corresponding high and low black percentages. An
examination of all the precincts, with respect to percent black,
reinforces this.
Within the City of Richmond, thirty-eight precincts averaged
0% - 25% black, seven averaged 26% - 50%, fifteen averaged 51% - 75%,
and seventeen averaged greater than 75% black. This distribution
is depcited in Figure 8. Group one (0% - 25%), according to the
correlation coefficient, should reflect the lowest amount of leftist
voting and group four (greater than 75%) should reflect the highest.
Groups two and three should fall in between. Table 8 illustrates
the breakdown.
42
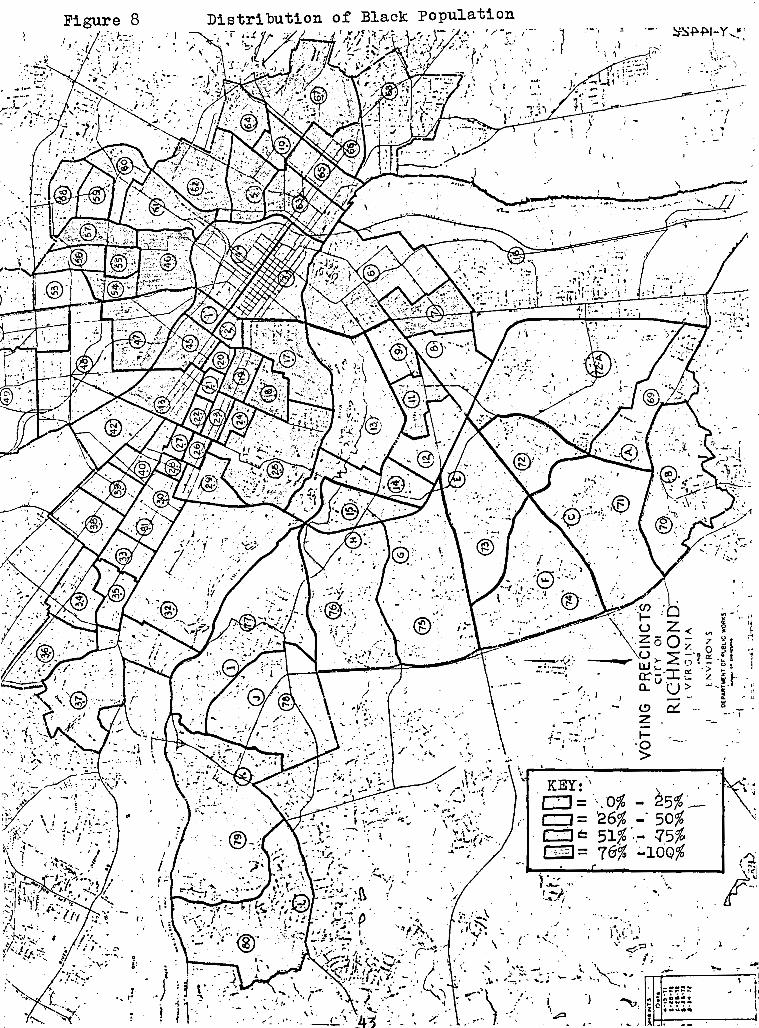
Figure 8
· ..
Distribution of Black Population
i ' ··-
. .) '.: 3 r 11· ..... ( .
.'.
\ I .•
,.
r
: } ·-·,
''
~J.
,- . ' . - .. +:-,:::·.-· .......
I
4 -i , . '•
.}
(.!)
z . 1-·o >
....... ·.lo·
. '"° .. ;.. I ·,
... ... ._.. ~ ..... ·- ....... ~-···· ', . '·-..... "~ ~ - - .. " ~ --... ·' · .. .,
~'S~~l.-Y-.!!: l ., .
. ~\:.· ..• \
- •• ;--;':·' I
••• ,f
I ...
, ..
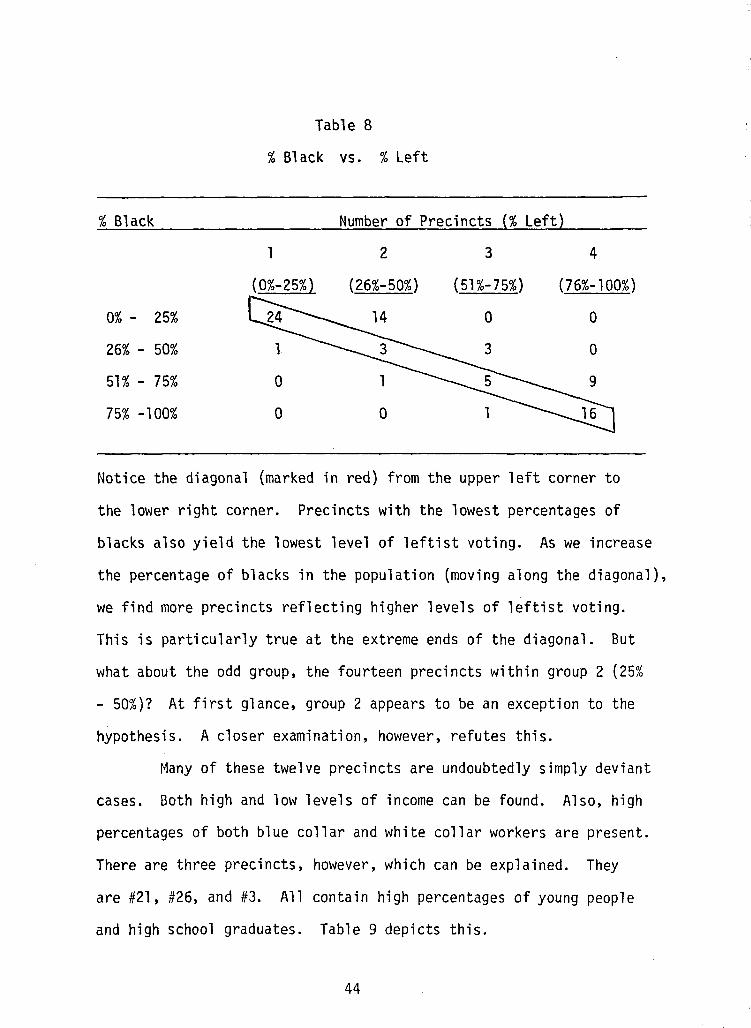
Table 8
% Black vs. % Left
% Black Number of Precincts {% Left}
1 2 3 4
(26%-50%} (51%-75%} (76%-100%}
0% - 25% 0 0
26% - 50% l 0
51% - 75% 0 9
75% -100% 0 0
Notice the diagonal (marked in red} from the upper left corner to
the lower right corner. Precincts with the lowest percentages of
blacks also yield the lowest level of leftist voting. As we increase
the percentage of blacks in the population (moving along the diagonal),
we find more precincts reflecting higher levels of leftist voting.
This is particularly true at the extreme ends of the diagonal. But
what about the odd group, the fourteen precincts within group 2 (25%
- 50%}? At first glance, group 2 appears to be an exception to the
hypothesis. A closer examination, however, refutes this.
Many of these twelve precincts are undoubtedly simply deviant
cases. Both high and low levels of income can be found. Also, high
percentages of both blue collar and white collar workers are present.
There are three precincts, however, which can be explained. They
are #21, #26, and #3. All contain high percentages of young people
and high school graduates. Table 9 depicts this.
44

Table 9
Percentages of Young People and High School Graduates
(Deviant Cases)
Precincts
Avg. for City #21 #26 #3 1. % of Population under
44 years of age
2. % High School Graduates
35%
36%
46% 38% 49%
58% 39% 42%
As a matter of fact, these areas are inhabited by large numbers
of Virginia Coll111onwealth University students. This is in line
with the findings on education noted earlier. The strongest re
lationship between education and leftist voting occurred at the
college level. Within these three precincts, #21, #26, #3, we
find many college students. Therefore, the apparent relationship
between race and leftist voting is not diminished by these
deviant cases.
At this point, we turn our attention to the effect, if
any, of the type of election. F9ur specific types have been
examined: Presidential (2), Senatorial, Gubernatorial (2), and
Lt. Governor. Correlation coefficients were generated for each
election and cross referenced with the SES variables. The result-
ing matrix is reproduced.
45

Table 10
SES & Election Correlation Matrix
V7 VB
Vl -.S077 -.S063
V2 -.6202 -.6183
V3 +.212S +. 2107
V4 -.6704 -.6700
vs +.9136 +.912S
NOTES:
Vl = Mean Income
V2 = School Years
V3 = % Blue Collar
V4 = % White Collar
VS = % Black
V?. = 1968 Presidential
V9 VlO Vll
-.S282 -.S612 -.SS73
-.6S23 -.6677 -.6639
+.2818 +.3063 +.3290
- . 7104 -.7S20 -.7S8S
+.9212 +.9377 +.9200
VB = 1969 Gubernatorial
V9 = 1971 Lt. Governor
VlO = 1970 Senatorial
Vll = 1972 Presidential
V12 = 1973 Gubernatorial
Vl2
-.S730
-.6813
+.3SS7
-.7667
+.9366
As one can see, there are variations in the correlation coefficients
from election to election. Of the five SES variables, four produced
the highest coefficients in the 1973 Gubernatorial election. The
fifth variable, race, saw its highest coefficient in the 1970 Sena
torial race. On the other side, all five variables produced their
lowest coefficients in the 1969 Gubernatorial election. Does this
mean that SES is more viable in Gubernatorial elections, as opposed
46

to Presidential and Senatorial elections? I think not for two
reasons. First of all, the changes in the coefficients are
simply not large enough to support that generalization. Secondly,
1973 was a volitile year. Watergate, inflation, recession, bus-
ing, etc. all helped to increase the importance of elections.
An examination of the 1973 election reveals strong
ideological overtones. For example, note the headlines of The
Richmond Times Dispatch on Sunday, October 28, 1973:
GODWIN vs. Hm~ELL ... leading mighty ideological armies toward a Virginia 52 Armageddon at the polls on November 6.
In contrast the climate surrounding the 1969 election was much
less ideological. Now recall Gerald Pomper's idea that the
political parties and the voters are becoming more ideological.
If one accepts this, then it follows that the more pronounced
and dramatized the ideological differences between the candidates,
the easier it is for the voter to choose accurately. In 1973 the
choice was clear and the vote more accurate. The lower coefficients
found in 1969 might well be due to a confusion on the part of the
voter. Ideological differences were unclear.
In conclusion, within the Sociological framework the type
of election does not appear to have any effect. Within the Psych
ological framework, however, the increased exposure of candidates
52James Latimer, "Godwin vs. Howell.", Richmond Times Dispatch, October 28, 1973, Sec. F, p. l.
47

and the increased media coverage of the more prominent elections
(Presidential, Senatorial, etc.) may well cause the type of
election to be a factor.
A great variety of numbers and percentages have been
presented in this chapter in an attempt to evaluate the relation
ship between SES and voting behavior in Richmond, Virginia. The
next chapter, Conclusions, will summarize the findings and present
the answers to the questions posed in Chapter II.
48
CHAPTER IV
CONCLUSIONS
Voting behavior theory is dominated by two major schools
of thought: the Sociological school and the Psychological school.
The Sociological school emphasizes the role of socio-economic
status, while the Psychological school emphasizes the role of the
individual mind. The question under study here was the role, if
any, of socio-economic status (the Sociological school) in deter
mining voting behavior in Richmond, Virginia.
Four variables, or components of SES, were extracted from
previous studies for examination. They were: income, education,
occupation, and race. The only real support for income came at
the extreme upper and lower ends of the income scale. With regards
to education, only at the college level did any real strength
appear. Occupation yielded a somewhat weak relationship with
respect to blue collar workers, but a rather strong relationship
with respect to white collar workers. Race, on the other hand,
turned out to be by far the dominant of the four variables examined.
The findings clearly point to a strong relationship between leftist
voting and being black. While there may not be a class basis for
politics in Richmond, there most certainly is a racial one. The
above surrmarized findings suggest little support for the Sociological
school in Richmond, Virginia. Indeed, on the surface, the data pre
sented in Chapter III does seem to point in that direction. There
49
are several factors, however, which must be acknowledged.
First of all, union control of blue collar workers in
Richmond is somewhat weak. This lack of tight control may well
have contributed to the low correlation coefficients found for
blue collar workers. Secondly, there is a noted absence of a
great variety of ethnic and religious groups in Richmond. Per
haps our sample is not broad enough to adequately evaulate this
relationship. Finally, one must note that historically race
has been used in the South to weaken traditional class associa
tions. Racial prejudice has set the Negro apart from the rest
of the population. Poor, uneducated blacks had little in common
with poor, uneducated whites, in tenns of their political asso
ciations or appeals of candidates. There simply was no cohesion
among these two groups. Therefore, traditional class identities
are weakened.
All totalled, these three factors may tend to blur the
socio-economic cleavages espoused by the Sociological School.
The absence of strong SES correlation coefficients may be due,
not to their absence, but rather to the aforementioned dampening
factors.
For the candidates and public officials of the area,
these results have tremendous meaning. Leftist voting and race
are strongly associated. Therefore, in any election, the leftist
most candidate will carry the City of Richmond. With the high
50

black population in the city, a staunch conservative candidate
stands very little chance of receiving many votes. Likewise,
no public official can hope to remain in office unless he or
she supports policies which are leftist in nature.
When this project was started, this author believed
firmly that one's voting behavior was directly related to his
or her socio-economic status. This study has shown, quite clearly
I think, that in Richmond, Virginia, race and not SES is the
important factor. Furthermore, this study has shown the need
for and relevance of other approaches. The Psychological School
has many ideas which need to be explored. Finally, this study
has revealed the limitations of using aggregate data. Many
explanations of the findings here could only be speculated upon
because of the absence of survey data. Any further study of
voting behavior in Richmond should include both the Sociological
School and the Psychological School. Also it should incorporate
both aggregate and survey data.
51

APPENDIX
A. Census Tracts in the Richmond, Virginia SMSA, 1970.
B. Voting Precincts - City of Richmond, Virginia, April, 1971.
52
BIBLIOGRAPHY
Anderson, Bo, Morris, Zelditch, Takagi, Paul, and Whiteside, Don. "On Conservative Attitudes". Acta Sociologica, VIII (1965).
Berelson, Bernard R., Lazarsfeld, Paul F., and McPhee, William N. Voting: A Study Of Opinion Formation l!!.A Presidential Campaign. Chicago & London: The University of Chicago Press, 1954.
Campbell, Angus, Converse, Phillip E., Miller, Warren E., and Stokes, Donald E. The American Voter. New York, London, Sydney: John Wiley & Sons, Inc., 1964.
Campbell, Angus and Stokes, Donald E. "Partisan Attitudes And The Presidential Vote". American Voting Behavior. Westport, Connecticut: Greenwood Press, Inc., 1959.
Kelley, Stanley, Jr., and Miner, Thad W. "The Simple Act Of Voting". American Political Science Review, No. 2 (June, 1974), 572-591.
Lazarsfeld, Paul F., Berelson, Bernard, and Gaudet, Hazel. The People's Choice. New York and London: Columbia University Press, 1968.
Lipset, Seymour Martin. Political Man: The Social Basis Of Politics. Garden City, New York:-Ooubleday & Company, Inc., 1960.
Luce, R. Duncan. "Analyzing The Social Process Underlying Group Voting Patterns 11
• American Voting Behavior. Westport, Connecticut: Greenwood Press, Inc., 1959.
Margolis, Michael. 11 From Confusion To Confusion: Issues And The American Voter (1956-1972}". American Political Science Review, LXXI (March, 1977), 31-43.
Masters, Nicholas A., and Wright, Deil S. "Trends And Variations In The Two-Party Vote: The Case Of Michigan 11
• American Political Science Review, LII (December, 1958), 1078-1090.
Pamper, Gerald M. Elections In America. New York/Toronto: Dodd, Mead and Company, 1968:°
53

Pomper, Gerald M. "Front Confusion To Clarity: Issues And American Voters, 1956-196811
• American Political Science Review, LXVI {June, 1972), 415-428.
Pomper, Gerald M. The Election Of 1976. New York: David McKay Co., Inc. :t 1977. - --
Renneker, Richard E., M.D. "Some Psychodynamic Aspects Of Voting Behavior". American Voting Behavior. Westport, Connecticut: Greenwood Press, Inc., 1959.
Richmond Times Dispatch. "Godwin vs. Howell". James Latimer. October 28, 1973.
Sabato, Larry. Aftermath Of 'Armageddon': An Analysis Of The 1976 Virginia Gubernatorial Election. Charlottesville, Virginia: University of Virginia Printing Office, 1975.
Segal, David R., and Meyer, Marshall W. "The Social Contex Of Political Partisanship". Quantitative Ecological Analysis l.!!. The Social Sciences. Cambridge, Massachusetts: The M.I.T. Press, 1969.
Stephens, William N., and Long, Stephen C. "Education And Political Behavior". Political Science Annual, 1969-1970. New York: The Bobbs-Merrill Company, Inc., 1970.
54

~ ~ "' wl
OUIOCCASIN a. o.' ..
2001.07
2004.02
20;~~~ ( 505
-""' "-----~.. '- / /T., r __ ..... -~,-.
\ 100~01
~-~
1009.02
1009.03
M10LO'TMl,t..N
U.S. DEPARTMENT OF COMMERCE BUREAU OP THE CENSUS
CENSUS TRACTS IN THE RICHMOND, VA. SMSA
s,,o
'i\'S., . 0
t{f
/":" \'v •. 'l '
? ._.~:f • "'""
11ou 1 Beaverdam Dist "~-'\ , 3001
' ' South Anna Dist
3002
·~O/ ·cJ1 0 ~~~
Henry Dist ~ ,._ fi{<'c \..,_s~ '~
·~ 3006 c "'I
) ...... t\..c \,...r"" ~s ...
Cold Harbor Dist /-
3009 hf' 1'8
(.'~~~':,!,, ~v
) f\ J\{~(2014.02 'L
<!:/O -.:1ii/ ~Iii: .
..!!15 _'\. ~t ·11 Dist (-""'--"~' Clover H1 ' ' .. ~
',7 1010
BOUNDARY SYMBOLS
Census Tract Boundaries:
_ - - -- County
,q_ 1007 PART _
0~~~~~... . 1006), ~ '~q,, co q;; v---co--
Minor Civil Division
Other Tracts
4 0 .it 8 MILES
~<)-
2005.03
1001.04
1002.01
1003.01
..
• , \ 1003Jl3 °"\, ~ '~ ~ .. ~--
\/~
1bo2.02
....
~ '!'
BELLS
2008.03
608
.. .. "' ',
I I
J
I I
l INSET MAP - RICHMOND AND VICINITY
~ .. +"'
N
2010.01
2014.01
2 MIU:S
2012.01
''\___ __ ""' .. ..
J 970 Census of Population and Housing RICHMOND, VA. STANDARD METROPOLITAN STATISTICAL AREA Final Report PHCl11-173

. l
I\ t_ l
12.
' '
/
;~ --.. ' I ' ... _
'- ... J \
,... ,
\·
1'. /
14 " ;x;
' !J • I
\ ~~~A-rvt~f:.~N-D~l'-1~E:.-N~T-5~~~-.
Or'dinoncst Date 1-:::!~1.!:1~-!!."=;t.!:-~"°'' ~.+-:-. 47"_':'1 !>:;"-'-1:;;-1 '-i ~
12·n·-5). 2-za-ia , 7Z·B·5<1- ?.·Z8-1Z 7Z·J7&·184 13-28·72 7Z·l95"·Z02 8 • 24 ·TZ
" --.J.
---- . -
. '-
... ~ '
/
. i
\
/' \ \ ~--~'\ __ ---=:Ji
.. -- ~~yL.. ,, ( k " • ~,. i 1
.-.::.~~~' \
\ (
\
\
,..::~·.~
~~
-,
/
/ J'
\ \
•.'
..... / /: ...
....... ·
/ I
.1
( I t V VR G-1 NI A
' AND'
ENVIRONS
DEPARTMENT OF f'U_BLlC WORKS ' 9:;P~All OF (t~'S "-(f,ANQ
.,, I,
' .
/
-- I(._ -
{·
),
/
'. !. \ .
• <.
1
/
·f /
J
.J
......
-.
',
.• 3
~ I ..... I~
~-4
- ...........
", I -·-...+, '.J..,_~
l _,, '
~-;: ::-~ :~ : ~ ~ ~
":· • 12 ~t"<"' "',
-~f...:.__._"
..-,
14
' 1