the role of slirp and notch signalling in colorectal cancer › files › 3227988 › ... · the...
TRANSCRIPT

The role of SLIRP and Notch signalling in colorectal cancer Patrick Aaron Candy BSc (Hons) Biotechnology, Murdoch University BSc Computer Science, Murdoch University This thesis is presented for the degree of Doctor of Philosophy in Medicine School of Medicine and Pharmacology under the Faculty of Medicine, Dentistry and Health Sciences at the University of Western Australia Date of Final Submission: July 2013


Declaration This thesis “The role of SLIRP and Notch signalling in colorectal cancer” has been completed for the degree of Doctorate of Philosophy in Medicine at the University of Western Australia. This thesis is composed as a series of papers that are being submitted for publication in international peer review journals. Chapters 2-3 will be submitted to Cancer Research and Chapter 4 has been accepted by the British Journal of Cancer. The author of this thesis wrote the entirety of these papers (sole 1st author on each) and performed all experimental work within, except as noted below. The contributions to Chapter 2 are as follows: Michael Phillips provided statistical support (7%), Andrew Redfern helped score the tissue microarrays (TMAs) and reviewed the paper draft (4%), Lisa Stuart assisted with DAB staining and scoring TMAs (3%), Larissa Wintle assisted with immunofluorescent staining of TMAs (2%) and pathologist Ben Wood assisted with scoring of TMAs (2%). Peter Leedman provided insights and reviewed the draft (10%) with Shane Colley (3%). The contributions to Chapter 3 are as follows: John Davidson performed the forest plot of SLIRP mRNA expressions (2%). Peter Leedman (10%), Andrew Redfern (3%) and Shane Colley (3%) provided insights and reviewed the paper. The contributions to Chapter 4 are as follows: Michael Phillips provided statistical support (7%) and Lisa Stuart assisted with staining and scoring the TMAs (3%). Andrew Redfern helped score TMAs, and provided insights and a review of the paper (6%) with Peter Leedman (10%), Shane Colley (3%) and John Davidson (1%). I declare this work I present as a thesis, is my own work, and all sources and assistance received has been appropriately acknowledged. This research has been principally supervised by Prof Peter J Leedman, with Dr Shane M Colley acting as secondary supervisor. PhD Candidate Coordinating Supervisor Mr. Patrick Candy Prof. Peter Leedman July 2013 July 2013
i

Publications arising from this thesis
1. Candy PA, Phillips MR, Redfern AD, Colley SM, Davidson JA, Stuart LM, Wintle LC, Wood B and Leedman PJ. SLIRP, a nuclear receptor corepressor is a tumour suppressor in colorectal cancer that regulates cross-talk between the retinoic acid and notch signalling pathways. To be submitted to Cancer Research. (Chapter 2-3).
2. Candy PA, Phillips MR, Redfern AD, Stuart LM, Davidson JA, Colley SM,
Wood B, Zeps N and Leedman PJ. Notch signalling shows prognostic value in colorectal cancer survival and 5-fluorouracil response rates. Accepted by the British Journal of Cancer. (Chapter 4).
3. Kalinowski FC, Giles KM, Candy PA, Ali A, Ganda C, Epis MR, Webster RJ and Leedman PJ. miR-7 regulates EGFR signalling and the sensitivity of head and neck cancer cells to erlotinib. PLoS ONE, 2012;7(10).
4. Candy PA, Phillips MR, Redfern AD, Stuart LM, Davidson JA, Iacopetta B,
Wood B, Colley SM, Leedman PJ. SLIRP Represses Retinoic Acid, SOX9 and Notch Signalling in Colorectal Cancer and Is a Good Prognostic Factor. Endocr Rev 2012;33: OR05-2.
5. Candy PA, Colley SM, Phillips MR, Iacopetta B, Stuart LM, Wood B, Redfern
AD and Leedman PJ. SLIRP a Nuclear Receptor Coregulator Is a Good Prognostic Factor in Colorectal Cancer. Endocr Rev 2011;32: P1-30.
ii

Abstract
Colorectal cancer (CRC) is the third most common malignancy and the second highest
cause of cancer death, accounting for more than 4000 Australians deaths per year. The
majority of patients are diagnosed with advanced disease that carries a poor prognosis.
There are few clinically useful biomarkers for prediction of CRC disease outcome or
new therapies which target specific signalling pathways. Thus, there is a pressing need
to identify novel biomarkers and characterise new potential therapeutic targets to
provide a foundation for innovative approaches to address the issue of CRC mortality.
The nuclear receptor (NR) superfamily of ligand-inducible transcription factors plays an
important role in CRC oncogenesis. For example, the NR retinoic acid (RA) receptor
alpha (RARα) is highly expressed in colorectal mucosa and cancer and promotes the
oncogenic Notch signalling pathway, in particular expression of Notch-induced
transcription factors (NTFs) HES1 and SOX9. As aberrant Notch signalling has been
implicated in promotion of epithelial to mesenchymal transition (EMT),
chemoresistance and metastasis in CRC, identification of factors capable of suppressing
both the NR (RARα) and Notch signalling pathways would present new opportunities
for CRC treatment.
The NR coregulators modulate (“fine-tune”) NR activity and play important roles in
oncogenesis. Examples include the coactivators SRC-1 and SRC-3 that are
overexpressed in numerous cancers, drive metastasis and when overexpressed, correlate
with poorer prognoses. Our interest in RNA biology and hormone action led us to focus
on the only known NR coactivator that can function as an RNA transcript, Steroid
Receptor RNA Activator (SRA), which associates with NR complexes to augment
transactivation.
iii

Our laboratory identified SRA stem-loop interacting RNA binding protein (SLIRP) that
forms a NR coregulator complex with SRA. SLIRP, expressed in the colon and in other
cells, represses the activities of NR pathways implicated in CRC, alluding to a
potentially significant role for SLIRP in CRC oncogenesis.
Based on these observations, several hypotheses were generated: (i) SLIRP expression
has clinical significance in CRC; (ii) SLIRP is a NR corepressor of RARα signalling in
CRC (iii) SLIRP represses Notch signalling in CRC, at the NTF level via RARα, and
can modulate cross-talk between NR and Notch signalling pathways; and (iv) the
overexpression of NTFs HEY1, HES1 and SOX9 in CRC will have prognostic
significance.
The clinicopathologic and prognostic significance of SLIRP was examined in a well-
studied CRC tissue microarray (TMA) of 975 patients[1]. SLIRP protein expression had
an antitumour signature, correlating with higher eight year survival (HR 0.66, p=0.001),
and reduced lymph node metastasis, COX-2 expression, vascular and perineural
invasion. Furthermore, two CRC patient studies showed high SLIRP mRNA correlates
with reduced risk of relapse (RR 0.39, p<0.05).
Functionally, in a range of CRC cells, SLIRP was a SRA-dependent repressor of both
RARα and Notch signalling, suppressing expression of multiple targets, including
HES1, SOX9, NOTCH2, NOTCH3, NFKB1 and LMO2. Depletion of SLIRP or SRA
from CRC cells produced markedly divergent effects on recruitment of RARα and
SOX9 to the HES1 promoter in ChIP assays. In addition, SLIRP depleted CRC cells
were more invasive and resistant to conventional chemotherapy.
The prognostic and clinicopathologic significance of SLIRP regulated NTFs (HES1 and
SOX9) and HEY1 was then assessed in the same CRC TMA. High NTF protein
iv

expression correlated with worse patient prognosis, particularly in patients treated with
chemotherapy, as each overexpressed NTF, additively increased the risk of death (HR
1.94, p=0.019), but showed no prognostic import in untreated patients (HR 0.74,
p=0.19).
In summary, the studies in this thesis have shown SLIRP is a novel CRC tumour
suppressor, and if replicated in other cohorts, the use of SLIRP and potentially NTF
expression signatures may be useful clinically as predictors of outcome and/or
therapeutic response. In CRC, SLIRP acts at the molecular level via dual inhibition of
the RARα and Notch signalling pathways and participates in novel SRA-dependent
cross-talk between the NR and Notch networks. Thus, targeted therapies that retain
and/or restore SLIRP expression may be of potential benefit in CRC treatment. This
thesis provides an exciting foundation for further studies to explore innovative
combined approaches for treatment of CRC which involve dual inhibition of NR and
Notch signalling, fundamentally driven by manipulation of NR coregulator expression,
together with direct targeting of the signalling pathways themselves.
v

Acknowledgements
This thesis and its discoveries would not be possible without the guidance, expertise and
support of the following people.
First and foremost I acknowledge my principle supervisor Professor Peter Leedman,
who has provided an array of excellent opportunities to learn, meet new people and
accomplish, in addition to being a source of inspiration, advice and experience. I look
forward to our future collaborations in medical research.
Special thanks also go to my secondary supervisor Dr Shane Colley for his advice over
the years and his review of this thesis. I acknowledge Michael Phillips for his statistical
support that enriches these clinical studies; I’ve enjoyed working with you.
I wish to mention past and present members from the Leedman laboratory, particularly
Michael Epis, Dianne Beveridge, Viki Russell, Kavitha Iyer, Clarissa Ganda, Simon
Kobelke, Rikki Brown, Richelle Searles, Karina Price, Caroline Rudnicka, Andrew
Barker, Andrew Woo and Priscilla Zhang. You are excellent people who made the lab a
stimulating environment and a great place to work. I reserve special acknowledgement
for Dr Keith Giles, Felicity Kalinowski, Lisa Stuart, and Larissa Wintle who in addition
to the above, were highly intelligent and gregarious scientific collaborators during my
candidature.
Throughout this thesis, I have had a productive collaboration with the oncologists Dr
Andrew Redfern and Dr Andrew Davidson from Royal Perth Hospital. Their clinical
insights and expertise have been invaluable contributions.
Thanks also to our collaborators, Dr Ben Wood from Sir Charles Gairdner Hospital and
Nik Zeps and Lisa Spalding of St John of Gods Hospital Subiaco, for their assistance
with pathology and tissue microarrays.
vi

This work has been funded by the National Health and Medical Research Council,
Cancer Council of Western Australia and the Royal Perth Hospital Medical Research
Foundation. Throughout this PhD, I have been supported by the Richard Walter
Gibbons Medical Research Scholarship from the University of Western Australia
(UWA). In addition, I acknowledge UWA and the Western Australian Institute for
Medical Research (WAIMR) who provided travel awards that have enabled this work to
be presented at national and international conferences.
I have benefited from a great network of friends and family over the years, which I
acknowledge here. In particular I wish to mention my close family, my two brothers
Chris and Luke, sister Rachel and mother Vicki who have been steadfast sources of
mutual support and encouragement.
In closing I’d like to dedicate this thesis to my late father, the astronomer Michael
Candy, for inspiring through action, a mix of curiosity, open mindedness and the desire
for excellence.
vii

Abbreviations 5-FU 5-flourouracil AJCC American Joint Committee on Cancer APC Adenomatous polyposis coli AR Androgen receptor BSA Bovine serum albumin C Cancer ChIP Chromatin Immunoprecipitation COX-2 Cyclooxygenase 2 CRC Colorectal cancer CSL Recombination signal binding protein for immunoglobulin kappa J region DAKO Diaminobenzidine DMSO Dimethyl sulphoxide DNA Deoxyribonucleic acid EDTA Ethylenediaminetetraacetic acid EMT Epithelial to mesenchymal transition ER Estrogen receptor ERE Estrogen response element GSI Gamma-secretase inhibitor GAPDH Glyceraldehyde-3-phosphate dehydrogenase GFP Green fluorescent protein GR Glucorticoid receptor HES1 Hairy enhancer of split 1 HES1E Hairy enhancer of split 1 response element HEY1 Hairy/enhancer-of-split related with YRPW motif 1 HSP60 Heat shock protein 60 H Hour HR Hazards ratio HRE Hormone response element HRP Hydrogen peroxide IgG Immunoglobulin G IP Immunoprecipitation LMO2 LIM domain only 2 LN Lymph node LRPPRC Leucine-rich pentatricopeptide repeat containing Luc Luciferase Min Minute mRNA Messenger ribonucleic acid MSI-H High microsatellite instability MLH1 mutL homolog 1 N Nonmalignant tissue Nc Non coding NCBI National Centre for Biotechnology Information NCoR Nuclear corepressor protein NDUFB8 NADH dehydrogenase 1 beta subcomplex subunit 8 NF-κB Nuclear factor-κB NOTCH1 Neurogenic locus notch homolog protein 1 NOTCH2 Neurogenic locus notch homolog protein 2
viii
NOTCH3 Neurogenic locus notch homolog protein 3 NR Nuclear receptor NTF Notch-induced transcription factor OR Odds ratio p p-value P53 Protein 53 PBS Phosphate buffered saline PLB Passive lysis buffer PNPase Polyribonucleotide nucleotidyltransferase PPAR Proliferated peroxisome activated receptor PR Progesterone receptor PTGS2 Prostaglandin-endoperoxide synthase 2 QPCR Quantitative polymerase chain reaction RA Retinoic acid RAR Retinoic acid receptor RARE Retinoic acid response element RNA Ribonucleic acid RRM RNA recognition motif RPLN Ratio of positive lymph nodes SDM7 Stem-loop structure 7 mutant SFRP4 Secreted frizzled-related protein 4 SHARP SMRT/HDAC1 associated repressor protein siRNA Small interfering RNA SKIP Ski-interacting protein SLIRP SRA stem-loop interacting RNA binding protein SOX9 SRY (sex determining region Y)-box 9 SOX9E SRY (sex determining region Y)-box 9 response element SRA Steroid receptor RNA activator 1 SRC-1 Steroid receptor coactivator 1 SRC-2 Steroid receptor coactivator 2 SRC-3 Steroid receptor coactivator 3 STR7 Stem-loop structure 7 SUV3 Suppressor of var1, 3-like 1 T Tumour tissue TBS-T Tris buffered saline – Tween 20 TGF-β Tumour growth factor β TMA Tissue microarray TR Thyroid receptor UWA University of Western Australia VDR Vitamin D receptor WAIMR Western Australian Institute for Medical Research WT Wild type
ix

Table of Contents Declaration ..................................................................................................................... i Publications arising from this thesis ............................................................................. ii Abstract ........................................................................................................................ iii Acknowledgements ...................................................................................................... vi Abbreviations ............................................................................................................. viii Table of Contents .......................................................................................................... x
Chapter 1: Introduction ................................................................................................. 1
1.1 An introduction to colorectal cancer ................................................................... 2
1.1.1 Colorectal cancer .......................................................................................... 2
1.1.2 Tumour site characteristics .......................................................................... 3
1.1.3 Molecular mechanisms underlying the development of CRC ..................... 3
1.1.4 Treatment of CRC ........................................................................................ 4
1.2 Nuclear receptors ................................................................................................ 6
1.2.1 An introduction to NRs ................................................................................ 6
1.2.2 VDR ............................................................................................................. 7
1.2.3 PPARγ .......................................................................................................... 7
1.2.4 RARα ........................................................................................................... 8
1.3 Nuclear receptor coregulators ............................................................................. 9
1.3.1 An introduction to coregulators ................................................................... 9
1.4 SRA .................................................................................................................... 10
1.4.1 An overview of SRA .................................................................................. 10
1.4.2 Tumourigenesis and SRA .......................................................................... 11
1.5 SLIRP ................................................................................................................ 11
1.5.1 SLIRP is a NR corepressor ........................................................................ 11
1.5.2 SLIRP is predominantly a mitochondrial protein ...................................... 12
1.6 Notch signalling ................................................................................................ 13
1.6.1 Overview of the Notch signalling pathway ................................................ 13
1.6.2 Significance of Notch signalling in CRC ................................................... 14
1.6.3 HEY1 ......................................................................................................... 14
1.6.4 HES1 .......................................................................................................... 15
1.6.5 SOX9 .......................................................................................................... 15
1.6.6 Cross-talk between the Notch and NR signalling pathways ...................... 16
1.7 The role of SLIRP and Notch signalling in colorectal cancer .......................... 17
1.7.1 Study hypotheses ........................................................................................ 17
1.7.2 Study aims .................................................................................................. 17
1.7.3 Significance and outcomes of the thesis .................................................... 18
x
Chapter 1: Tables and figures ................................................................................. 19
Chapter 2: SLIRP is a marker of favorable prognosis in colorectal cancer patients .. 34
2.1 Abstract ............................................................................................................. 35
2.2 Introduction ....................................................................................................... 36
2.3 Materials and methods ...................................................................................... 37
2.4 Results ............................................................................................................... 40
2.5 Discussion ......................................................................................................... 42
Chapter 2: Tables and figures ................................................................................. 45
Chapter 3: SLIRP regulates cross-talk between the retinoic acid and Notch signalling pathways in colorectal cancer................................................................... 51
3.1 Abstract ............................................................................................................. 52
3.2 Introduction ....................................................................................................... 53
3.3 Materials and methods ...................................................................................... 55
3.4 Results ............................................................................................................... 58
3.5 Discussion ......................................................................................................... 62
Chapter 3: Tables and figures ................................................................................. 67
Chapter 4: Notch signalling shows prognostic value in colorectal cancer survival and 5-flurouracil response rates ......................................................................................... 77
4.1 Abstract ............................................................................................................. 78
4.2 Introduction ....................................................................................................... 79
4.3 Materials and methods ...................................................................................... 81
4.4 Results ............................................................................................................... 84
4.5 Discussion ......................................................................................................... 87
Chapter 4: Tables and figures ................................................................................. 92
Chapter 5: Discussion & Conclusions ........................................................................ 99
5.1 Discussion overview ....................................................................................... 100
5.2 SLIRP has a tumour suppressor phenotype in CRC and regulates cross-talk between the retinoic acid and Notch signalling pathways .................................... 101
5.3 SLIRP biomarker potential in CRC ................................................................ 102
5.4 SLIRP, SRA and RARα are therapeutic targets in CRC................................. 103
5.5 Notch induced HEY1, HES1 and SOX9 have potential as prognostic biomarkers ............................................................................................................. 104
5.6 Final Conclusion ............................................................................................. 105
References ................................................................................................................. 107
Appendix I: Awards and conferences ....................................................................... 119
xi

Chapter 1: Introduction
1

1.1 An introduction to colorectal cancer
1.1.1 Colorectal cancer
Colorectal cancer (CRC) is the third most common malignancy and the second highest
cause of cancer death, accounting for more than 4000 Australian deaths per year [2]. It
can be categorised into four major stages based on progression of the disease. Using the
nomenclature of the American Joint Committee on Cancer (AJCC) staging protocol,
tumours classified as stage I are localised to the internal intestinal mucosa, stage II
tumours have grown through the wall of the colon or rectum, stage III tumours have
spread to neighbouring lymph nodes (LNs) and stage IV CRC has metastasised to other
organs, frequently the liver and lungs (Figure 1.1 and 1.2) [3]. Patient prognosis
worsens with the progression of CRC stage, with five year survival decreasing from
90% in stage I and II, down to 69% and 12% for stages III and IV respectively (Figure
1.3) [4]. With widespread implementation of methods for detection of CRC in its early
stages where treatment is effective, there has been a significant decline in CRC
mortality rates over the last two decades. These methods include the use of fecal occult
blood testing, colonoscopy and faecal DNA tests in groups who are at increased risk [5].
In 2012, the proportion of CRC diagnosed in the United States at stage I and II
accounted for 39% of cases, with regional (stage III) and distant (stage IV) CRC
accounting for 37% and 20% respectively (Figure 1.3) [6]. Thus the majority of patients
with CRC continue to present with advanced disease, which emphasizes the need for
better therapies to reduce the mortality associated with metastatic CRC.
2

1.1.2 Tumour site characteristics
CRC may be categorised, based on its site of occurrence, into proximal colonic, distal
colonic or rectal carcinoma, each with distinct demographics, risk factors, molecular
and pathological markers, and clinical outcomes [7]. Specifically, proximal CRC occurs
to the right of the splenic flexure, distal CRC arises to the left of the splenic flexure, and
rectal cancer occurs in the rectum (Figure 1.4). Compared to proximal CRC, distal and
rectal cancers occur with greater frequency in patients that are comparatively younger,
Caucasian and/or male [8, 9]. As distal colon and rectal cancer carry poorer prognoses
than proximal disease, their higher rates in men are a major factor for the increased male
rates of CRC mortality. Lifestyle factors also impact on the development of CRC. Large
population studies show a lack of physical exercise increases the incidence of colon
cancer, but has no effect on the risk of rectal cancer [10]. In contrast, intake of calcium
and vitamin D is associated with a reduced risk of developing rectal and distal CRC, but
not proximal CRC [11]. In addition, people with obesity and diets’ low in fruit,
vegetables and fibre and high in red or processed meat have greater risk of developing
all forms of CRC, particularly distal colon and rectal cancer [12, 13].
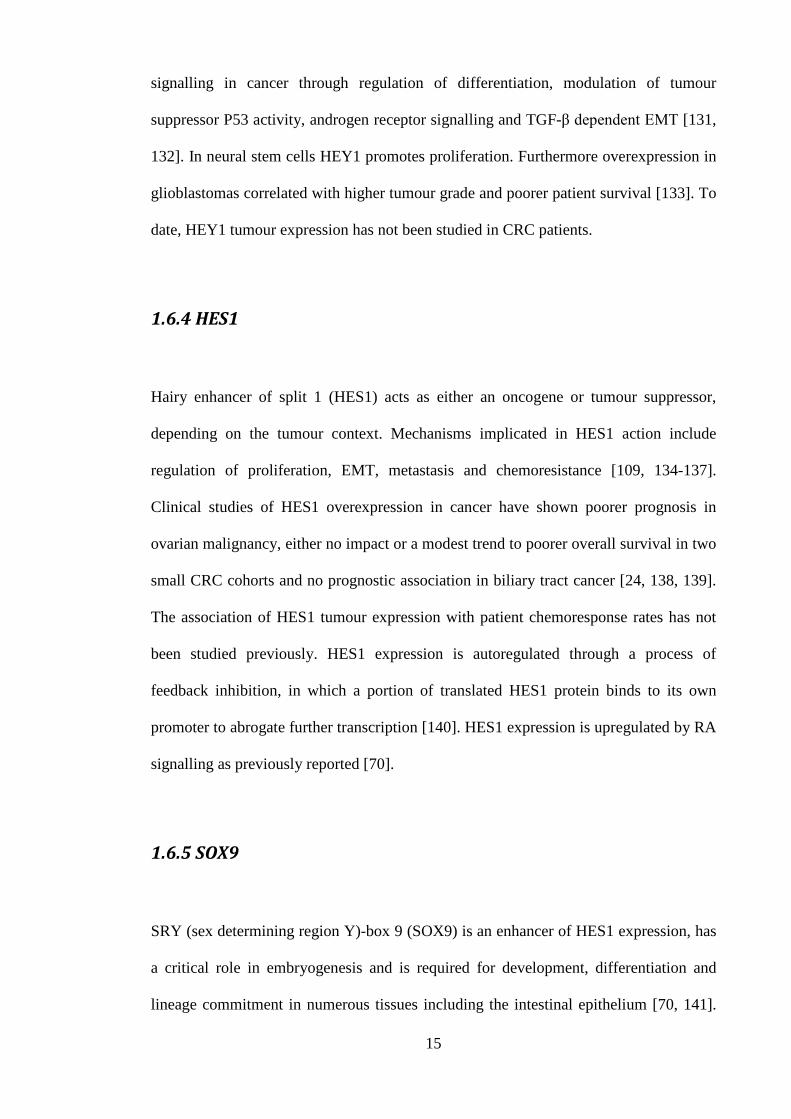
1.1.3 Molecular mechanisms underlying the development of CRC
The development of CRC has been well studied, and can be attributed predominantly to
two major pathways (Figure 1.5). The first, commonly called the Chromosomal
Instability pathway, begins with mutagenesis of adenomatous polyposis coli (APC) or
β-catenin genes, that prevents the phosphorylation and subsequent degradation of β-
catenin protein. These mutations are present in over 80% of CRCs and cause an
accumulation of β-catenin in the cytosol that can enter the nucleus where it dimerizes 3

with T-cell factor (TCF) 1–4, to promote expression of genes such as c-myc, c-jun and
cyclin D1, that enable the establishment of an oncogenic phenotype [14-16]. Further
mutations, methylations and deletions are required for the occurrence of metastatic
adenocarcinomas. Some of the key genes and pathways subverted in this process are
mothers against decapentaplegic homolog 4 (SMAD4), master tumour suppressor P53,
K-RAS, and Sonic Hedgehog and Notch signalling [17-25]. The second major path of
CRC development is termed the microsatellite instability (MSI-H) pathway, that
accounts for 15% of CRC incidence and occurs predominantly in proximal CRC [26,
27]. MSI-H tumours occur frequently in patients with Lynch syndrome, a genetic
disease characterised by mutation of one or more of the mismatch repair (MMR) genes
MLH1, MSH2, MSH6 and PMS2 [28]. Disruption of MMR genes allows the
propagation of replication errors that cause mutations and the accumulation of
microsatellites or short DNA sequences in the nucleus, which randomly insert into the
genome inducing further mutations in tumour suppressor genes to produce replication
error positive (RER) CRC [26, 29].
1.1.4 Treatment of CRC
The treatment of CRC depends on the patient’s health, and the tumours’ stage,
pathological features and molecular characteristics. Stage I CRC is generally treated
with surgery consisting of colectomy for colon cancer and/or transanal resection in
rectal cancer [30]. In stage II colon cancer, resection and removal of neighbouring
lymph nodes is performed. In addition, chemotherapy may be used, especially if the
tumour has obstructed the colon, was incompletely removed, or the tumours’ pathology
is undifferentiated or MSI-H (increased risk of CRC relapse). Adjuvant chemotherapy
normally consists of 5-fluorouracil (5-FU), leucovorin and oxaliplatin (FOLFOX), or 4
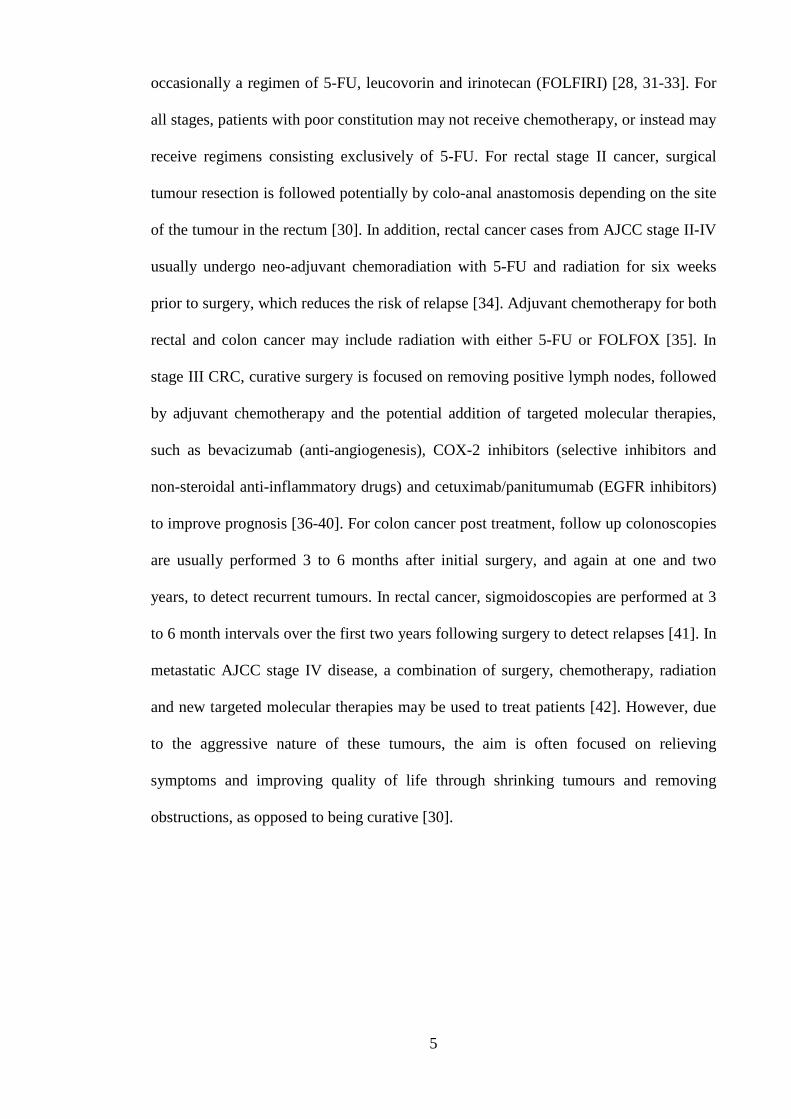
occasionally a regimen of 5-FU, leucovorin and irinotecan (FOLFIRI) [28, 31-33]. For
all stages, patients with poor constitution may not receive chemotherapy, or instead may
receive regimens consisting exclusively of 5-FU. For rectal stage II cancer, surgical
tumour resection is followed potentially by colo-anal anastomosis depending on the site
of the tumour in the rectum [30]. In addition, rectal cancer cases from AJCC stage II-IV
usually undergo neo-adjuvant chemoradiation with 5-FU and radiation for six weeks
prior to surgery, which reduces the risk of relapse [34]. Adjuvant chemotherapy for both
rectal and colon cancer may include radiation with either 5-FU or FOLFOX [35]. In
stage III CRC, curative surgery is focused on removing positive lymph nodes, followed
by adjuvant chemotherapy and the potential addition of targeted molecular therapies,
such as bevacizumab (anti-angiogenesis), COX-2 inhibitors (selective inhibitors and
non-steroidal anti-inflammatory drugs) and cetuximab/panitumumab (EGFR inhibitors)
to improve prognosis [36-40]. For colon cancer post treatment, follow up colonoscopies
are usually performed 3 to 6 months after initial surgery, and again at one and two
years, to detect recurrent tumours. In rectal cancer, sigmoidoscopies are performed at 3
to 6 month intervals over the first two years following surgery to detect relapses [41]. In
metastatic AJCC stage IV disease, a combination of surgery, chemotherapy, radiation
and new targeted molecular therapies may be used to treat patients [42]. However, due
to the aggressive nature of these tumours, the aim is often focused on relieving
symptoms and improving quality of life through shrinking tumours and removing
obstructions, as opposed to being curative [30].
5

1.2 Nuclear receptors
1.2.1 An introduction to NRs
The activities of the nuclear receptor (NR) superfamily of ligand-inducible transcription
factors have broad effects in humans, directly regulating transcription of a large
proportion of genes that control development, metabolism and physiology [43-48]. NRs
perform their functions as monomers, homodimers and heterodimers that bind their
respective hormone response elements (HREs) within the regulatory region of target
genes. HREs are specific for one receptor or a class of receptors. The NR superfamily
comprises seven classes, with individual receptors grouped based on sequence
homology as: Thyroid Hormone Receptor-like, Retinoid X Receptor-like, Estrogen
Receptor-like, Nerve Growth Factor IB-like, Steroidogenic Factor-like, Germ Cell
Nuclear Factor-like and Miscellaneous (Figure 1.6) [49]. The general structure of NRs
consists of an amino-terminal activation function (AF-1) domain, a DNA-binding
domain, a hinge region, and a carboxy-terminal ligand-binding domain containing a
second AF-2 domain (Figure 1.7). Ligand binding to NRs causes changes in the
conformation and dynamic behaviour of the receptor. The effects of a range of
hormonal ligands are mediated by NRs, which include the glucocorticoids, sex steroids,
mineralocorticoids, vitamin D and retinoids important in cancer [50]. In this section, we
will briefly explore the properties of the major NRs involved in CRC, and then focus on
retinoic acid (RA) receptor alpha (RARα), a key component in this thesis.
6

1.2.2 VDR
The vitamin D receptor (VDR) mediates the powerful antitumour effects of vitamin D
that reduce cancer incidence, progression and mortality [44, 51]. Some large population
studies show a strong inverse relationship between higher intake of vitamin D and the
incidence of CRC [44, 52]. Furthermore, a meta-analysis of VDR polymorphisms
studies has revealed that the BsmI polymorphism of the VDR gene is associated with
increased incidence of colon cancer [53]. VDR knockout mice display colon cell
hyperproliferation, increased cyclin D1 expression and higher rates of DNA damage
[54]. Clinically, higher levels of circulating vitamin D in a patient’s plasma at diagnosis
is predictive of improved disease outcome [51]. VDR expression is frequently
upregulated in early CRC, but decreases significantly during late CRC progression,
consistent with ligand unresponsiveness and possibly contributes to the failure of
vitamin D analogue therapy, which could involve promotion of immune function,
differentiation and apoptosis, and inhibition of cancer cell proliferation and invasiveness
[55-58]. Taken together, the emerging data suggests an important role for vitamin D and
VDR in CRC, even though the mechanisms involved are yet to be determined.
1.2.3 PPARγ
Peroxisome proliferator-activated receptor γ (PPARγ), is a potent tumour suppressor in
CRC [59]. For example, its overexpression in mouse intestines significantly reduced the
incidence of azoxymethane induced adenomas [45]. In humans, the effect of PPARγ
agonists are complex; increasing apoptosis in CRC cells, indicating potential for their
use in combination with chemotherapy [60]. The epigenetic silencing of PPARγ in CRC
7

appears to be common in the transition from adenoma to carcinoma, and associated with
metastasis and poorer prognosis [61-63]. Thus there is mounting evidence for roles of
NRs in CRC, such as PPARγ and VDR in modulating the incidence and mortality
associated with CRC.
1.2.4 RARα
RARα is one of the three forms of RAR that exists in the body, which are encoded by
the genes NR1B1 (RARα), NR1B2 (RARβ) and NR1B3 (RARγ) [64]. Like other NRs,
RARα contains a domain for ligand-binding for its principle ligand all-trans RA, a
DNA-binding domain for binding to RA response elements (RAREs) present upstream
of target genes, and a dimerization domain that permits binding to retinoid X receptors
(RXRs) to produce RAR/RXR heterodimers [65]. The RAR/RXR heterodimer is the
functional form of RARα that performs ligand-dependent regulation of gene
transcription (Figure 1.8). RARα has been implicated in cellular differentiation,
proliferation and apoptosis and its dysregulation is thought to underpin the etiology of
some inflammatory diseases and cancers. [65-69]. Recently RARα was found to
actively promote oncogenic Notch signalling in breast cancer, a key early development
pathway involved in epithelial to mesenchymal transition (EMT), metastasis and
resistance to chemotherapy [70]. However, despite RARα’s substantial expression in
colorectal mucosa and cancer, whether it can activate Notch signalling in these tissues
to promote CRC oncogenesis, has not yet been explored [71, 72].
8
1.3 Nuclear receptor coregulators
1.3.1 An introduction to coregulators
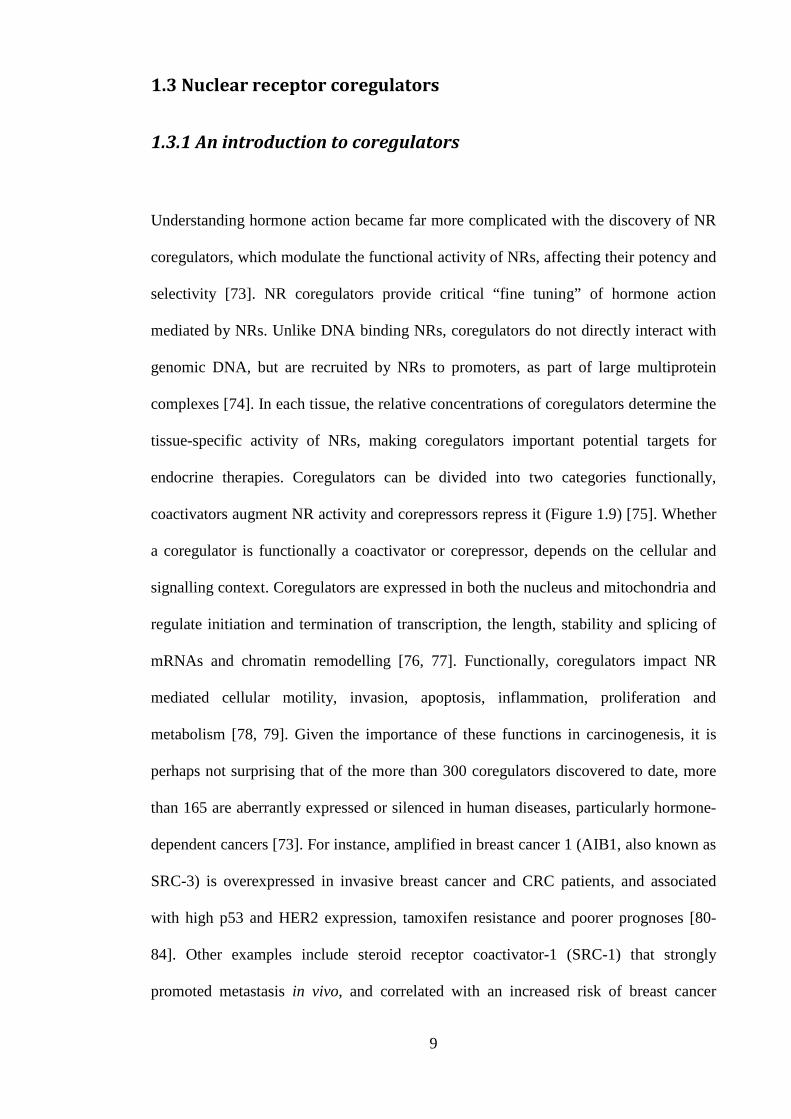
Understanding hormone action became far more complicated with the discovery of NR
coregulators, which modulate the functional activity of NRs, affecting their potency and
selectivity [73]. NR coregulators provide critical “fine tuning” of hormone action
mediated by NRs. Unlike DNA binding NRs, coregulators do not directly interact with
genomic DNA, but are recruited by NRs to promoters, as part of large multiprotein
complexes [74]. In each tissue, the relative concentrations of coregulators determine the
tissue-specific activity of NRs, making coregulators important potential targets for
endocrine therapies. Coregulators can be divided into two categories functionally,
coactivators augment NR activity and corepressors repress it (Figure 1.9) [75]. Whether
a coregulator is functionally a coactivator or corepressor, depends on the cellular and
signalling context. Coregulators are expressed in both the nucleus and mitochondria and
regulate initiation and termination of transcription, the length, stability and splicing of
mRNAs and chromatin remodelling [76, 77]. Functionally, coregulators impact NR
mediated cellular motility, invasion, apoptosis, inflammation, proliferation and
metabolism [78, 79]. Given the importance of these functions in carcinogenesis, it is
perhaps not surprising that of the more than 300 coregulators discovered to date, more
than 165 are aberrantly expressed or silenced in human diseases, particularly hormone-
dependent cancers [73]. For instance, amplified in breast cancer 1 (AIB1, also known as
SRC-3) is overexpressed in invasive breast cancer and CRC patients, and associated
with high p53 and HER2 expression, tamoxifen resistance and poorer prognoses [80-
84]. Other examples include steroid receptor coactivator-1 (SRC-1) that strongly
promoted metastasis in vivo, and correlated with an increased risk of breast cancer
9

relapse [85]. One of the most ubiquitous coregulators is the nuclear corepressor protein
(NCoR) initially identified in 1995 [86]. NCoR’s importance in the cell is exemplified
by data showing an embryonic lethality phenotype in the NCoR homozygous knock out
mouse [87]. NCoR is involved in the corepression of several NR pathways [88],
including RARα [89]. NCoR is also expressed in colorectal mucosa and tumours [90].
Thus NR coregulators play important roles in oncogenesis.
1.4 SRA
1.4.1 An overview of SRA
In 1999, a non-coding (nc) RNA of the steroid receptor RNA activator 1 (sra1) gene,
was isolated in a yeast two-hybrid screen, using the progesterone receptor, and found to
associate with coregulators such as SRC-1 [91]. Further studies revealed the sra1 gene’s
products exist as both protein, steroid receptor RNA activator protein (SRAP), and as
three ncRNA SRA isoforms, which regulate gene transcription as NR coregulators [92,
93]. Interestingly, SRAP does not contain DNA-binding domains, so its regulation of
gene transcription must be performed in complex with factors that do possess these
domains. However SRAP does contain an RNA recognition motif (RRM) that allows it
to associate with its own RNA, whereby it functions as a NR corepressor in breast
cancer [94]. Coactivation experiments have been performed using both coding and nc
SRA1 plasmids, in addition to SRA1 stem loop mutants, and confirmed that the ncRNA
SRA is a NR coregulator [95, 96]. SRA associates with NRs in an AF-1 dependent
manner to augment their transcriptional activity [92, 97]. NRs coactivated by SRA
include the RA, vitamin D, glucorticoid and PPARs [43, 95, 96]. SRA has a unique
structure consisting of stem-loops that facilitate the binding of other NR coregulators,
10

such as SLIRP, SHARP, SRC-1, SRAP and SRC-2, to permit them to influence the
functional activity of bound NRs (Figure 1.10) [92, 98]. SRA is ubiquitously expressed
in the body, with its concentration highest in the liver and skeletal muscle. To date,
SRA is the only coregulator that is active as an RNA transcript, as well as a protein.
1.4.2 Tumourigenesis and SRA
SRA has functional effects and clinical associations that support a potential role in
promotion of oncogenesis. SRA overexpression in vivo increased the proliferation and
apoptosis of epithelial tissue from mammary glands [98]. Clinically, SRA is
overexpressed in ovarian, breast and uterine cancers [99, 100]. In studies of breast
cancer samples, expression of an exon 3 deletion mutant of SRA, but not the wild type,
correlated with higher tumour grade [99, 100]. In prostate cancer, SRA is a coactivator
of androgen receptor, and its loss in prostate cell lines LNCaP and DU145, reduced both
cellular proliferation and TMPRSS2 expression [101]. Thus SRA appears to be involved
in oncogenesis in a range of tissues, but the molecular mechanisms are yet to be fully
elucidated.
1.5 SLIRP
1.5.1 SLIRP is a NR corepressor
The Leedman laboratory has had a long interest in RNA biology and hormone action. In
a collaboration with Professor Bert O’Malley (Baylor College of Medicine) they began
screening of a breast cancer library seeking new proteins binding to SRA that were
11

likely to be novel coregulators. In 2006, the stem-loop interacting RNA-binding protein
(SLIRP) was first isolated by the Leedman laboratory in a yeast three-hybrid screen,
bound to SRA’s stem-loop structure 7 (STR7) [43]. The SLIRP gene consists of four
exons, which are highly conserved across species, indicating that the encoded 109
amino acid protein may play important physiological roles [92]. Further investigation
revealed that SLIRP, like SHARP, is a NR coregulator, with its structure containing a
RRM permitting it to complex with SRA’s STR7 (Figure 1.11). The effect of SLIRP
under and overexpression upon the activity of numerous NRs, and thus its role in the
SRA coregulatory complex, was then tested. As shown in Figure 1.12, SLIRP
overexpression effectively abrogated the augmentation of VDR, PPAR, androgen,
glucocorticoid and thyroid receptor activity observed with overexpression of SRA. As
the activity of these NR pathways, particularly VDR and PPARs are associated with
CRC incidence and outcome, SLIRP regulation of these NRs allude to a potentially
significant role for SLIRP in CRC oncogenesis [43-46].
1.5.2 SLIRP is predominantly a mitochondrial protein
In HeLa cells, SLIRP expression was somewhat unexpectedly predominantly localised
to mitochondria, as seen by immunofluorescent microscopy (Figure 1.13).
Mitochondrial SLIRP has been shown in recent studies to have an important function in
the regulation of aerobic metabolism. SLIRP, in complex with leucine-rich
pentatricopeptide repeat containing (LRPPRC), acts as a posttranscriptional regulator of
mitochondrial genes [102]. SLIRP does this by regulating the stability and handling of
mature mRNAs through suppression of 3’ exonucleolytic mRNA degradation, mediated
by PNPase and SUV3 [103]. When SLIRP levels were ablated, there is a dramatic
decline in the expression of mitochondrial genes critical to oxidative phosphorylation 12

[104]. Specifically, electron transport proteins, cytochrome oxidase 2 and NDUFA8
showed marked reductions in expression [104]. As aerobic metabolism is frequently
impaired in metastatic CRC, compensated by increased glucose uptake and glycolysis,
SLIRP may have both a role in cellular aerobic respiration and in the metabolic switch
to anaerobic metabolism evident in many aggressive CRCs [104-107].
1.6 Notch signalling
1.6.1 Overview of the Notch signalling pathway
The Notch signalling pathway is an important development pathway with many roles in
the promotion of oncogenesis [108-111]. It is unique among the seven development
pathways, because typically activation of Notch signalling involves contact between
adjacent cells [112]. The signalling cell expresses Delta/Serrate/Lag-2 (DSL) ligands on
its surface, which bind with Notch receptors expressed on the surface of the receiving
cell (Figure 1.14) [113]. Upon ligand binding, a two-step process occurs. The first step
involves a member of the disintegrin and metalloproteinase (ADAMS) family cleaving
the Notch receptor at its juxtamembrane region [114]. The second step is cleavage of
the transmembrane domain of the receptor, by the γ-secretase complex, which causes
the translocation of the Notch intracellular domain (NICD) into the nucleus [115]. Then
the NICD forms a transcriptional activation complex with recombination signal binding
protein for immunoglobulin kappa J region (CSL) and coactivators, to promote
expression of the Notch-induced transcription factors (NTFs), which mediate
downstream effects (Figure 1.14) [114]. In humans there are four Notch receptors
(NOTCH1–4) and five types of DSL ligand, separated into two groups; the Delta like
(DLL1, DLL3, DLL4) and Serrate like (JAGGED1 and JAGGED2) ligands [113].
13

1.6.2 Significance of Notch signalling in CRC
Notch signalling is frequently activated in CRC tumours and has been implicated in
chemotherapy treatment resistance [116-118]. Notch signalling promotes epithelial to
mesenchymal transition (EMT), chemoresistance, proliferation and metastasis, and
influences key pathways, such as COX2, NF- B and Wnt signalling [108-111].
Clinically, numerous approaches for silencing Notch signalling have been explored,
with γ-secretase inhibitors (GSIs) and siRNAs showing most promise [119, 120]. Many
new specific Notch inhibitors are under development, with 23 phase I/II clinical trials
investigating the efficacy of GSIs ongoing (www.clinicaltrials.gov). However,
enthusiasm regarding the successes with in vitro and xenograft models has been
tempered by the lack of efficacy as single agent therapy in CRC as well as significant
mucosal toxicity [121, 122]. Of the four Notch receptors only NOTCH1 shows
upregulation with CRC progression [109]. However, NOTCH1 receptor expression did
not associate with altered outcome in CRC [123]. Hence if predictive or prognostic
factors do exist within this pathway, the downstream effectors of Notch activation, the
NTFs, in particular HEY1, HES1 and SOX9 may be more appropriate candidates for
further study and a salient focus of this thesis (Figure 1.15). Interestingly, upon Notch
activation, there is an increase in expression of HEY1, HES1 and SOX9, which
consequently accumulate in the nucleus, leading to the transcriptional inhibition of
downstream targets [124-126].
1.6.3 HEY1
Hairy/enhancer-of-split related with YRPW motif 1 (HEY1) has roles in cardiac
embryology, osteogenesis and neurogenesis [127-130]. It is a mediator of Notch 14
signalling in cancer through regulation of differentiation, modulation of tumour
suppressor P53 activity, androgen receptor signalling and TGF-β dependent EMT [131,
132]. In neural stem cells HEY1 promotes proliferation. Furthermore overexpression in
glioblastomas correlated with higher tumour grade and poorer patient survival [133]. To
date, HEY1 tumour expression has not been studied in CRC patients.
1.6.4 HES1
Hairy enhancer of split 1 (HES1) acts as either an oncogene or tumour suppressor,
depending on the tumour context. Mechanisms implicated in HES1 action include
regulation of proliferation, EMT, metastasis and chemoresistance [109, 134-137].
Clinical studies of HES1 overexpression in cancer have shown poorer prognosis in
ovarian malignancy, either no impact or a modest trend to poorer overall survival in two
small CRC cohorts and no prognostic association in biliary tract cancer [24, 138, 139].
The association of HES1 tumour expression with patient chemoresponse rates has not
been studied previously. HES1 expression is autoregulated through a process of
feedback inhibition, in which a portion of translated HES1 protein binds to its own
promoter to abrogate further transcription [140]. HES1 expression is upregulated by RA
signalling as previously reported [70].
1.6.5 SOX9
SRY (sex determining region Y)-box 9 (SOX9) is an enhancer of HES1 expression, has
a critical role in embryogenesis and is required for development, differentiation and
lineage commitment in numerous tissues including the intestinal epithelium [70, 141].
15

In cancer, SOX9 regulates proliferation, differentiation and metastasis [141, 142].
Clinical studies in breast, gastric biliary tract and colorectal cancer, indicate poorer
prognosis with tumour SOX9 overexpression [139, 141, 143, 144]. SOX9 expression in
cancer cells is increased by RA signalling as observed previously [70].
1.6.6 Cross-talk between the Notch and NR signalling pathways
Recently RARα was discovered to promote oncogenic Notch signalling in breast cancer,
particularly the expression of NTFs HES1 and SOX9 that play important functional
roles in carcinogenesis [70]. SRA is a coactivator of RARα signalling, but the effect of
SLIRP, a known corepressor of numerous NR pathways, on the RARα signalling
pathway is unknown. As SLIRP, RARα and Notch signalling pathway members are all
highly expressed in colorectal mucosa, the potential exists for SRA to mediate SLIRP
corepression of RARα, and thereby inhibition of Notch signalling and the process of
CRC oncogenesis.
Another interesting observation relates to the binding of SHARP, a NR corepressor to
SRA via the same stem-loop as SLIRP, STR7 [43, 145]. Relevant to the concept of
cross-talk is the observation that SHARP is a novel component of the Notch signalling
pathway [146], raising the possibility that SRA/SLIRP may participate in both the NR
and Notch signalling pathways.
16

1.7 The role of SLIRP and Notch signalling in colorectal cancer
1.7.1 Study hypotheses
Hypothesis 1: SLIRP expression has clinical significance in CRC.
Hypothesis 2: SLIRP is a NR corepressor of RARα signalling in CRC.
Hypothesis 3: SLIRP represses Notch signalling in CRC, at the NTF level via RARα,
and can modulate cross-talk between NR and Notch signalling pathways
Hypothesis 4: The overexpression of NTFs HEY1, HES1 and SOX9 in CRC will have
prognostic significance.
1.7.2 Study aims
Aim 1: Evaluate expression of SLIRP in CRC patients to determine its
clinicopathologic and prognostic significance.
Aim 2: Explore SLIRP’s regulation of RARα and Notch signalling.
Aim 3: Investigate SLIRP’s effect on CRC metastasis and chemoresistance.
Aim 4: Assess expression of HEY1, HES1 and SOX9 in CRC patients to determine
their clinicopathologic, prognostic and predictive significance.
17

1.7.3 Significance and outcomes of the thesis
The goal at the outset of this work was to explore the expression and potential
functional role of SLIRP in CRC. I planned to use a combination of translational
(human CRC tissue microrarrays and biostatistics) and molecular (luciferase assays,
siRNA treatments, Chromatin Immunoprecipitation assays, proliferation and matrigel
invasion assays) techniques to address the Aims. It was envisaged that successful
completion of the work would substantially enhance our understanding of coregulator
and SLIRP function in CRC, potentially identify new biomarkers for prognosis and
treatment response and place SLIRP/SRA in the centre of two key signalling pathways,
the NR and Notch networks. Moreover, successful completion of these studies could lay
a foundation to screen for molecules that enhance/restore SLIRP activity/expression as a
new approach to treat CRC, potentially in combination with direct Notch inhibitors.
The following Chapters are presented as complete papers, as each is being submitted for
publication in the next few weeks.
18

Chapter 1: Tables and figures
Figure 1.1: Anatomy of the human intestines. (A) Schematic view using longitudinal and cross sections. The rectangle denotes the area magnified in panel B. (B) Detailed diagram of the crypts of Lieberkühn. Adapted from Noah et al 2012 [114]. Abbreviations: +4 stem, quiescent intestinal stem cells, CBC, crypt base columnar cell.
19

Figure 1.2: Colorectal cancers are categorised as one of four stages at diagnosis according to the American Joint Committee on Cancer. Stage I tumours are localised to the muscularis mucosa, submucosa and muscularis propria of the intestine. Stage II cancers have penetrated the wall of the colon or rectum but have not yet spread to lymph nodes or distant sites. Stage III tumours have spread to nearby lymph nodes, but not other organs. Stage IV tumours have metastasised from the colon to other organs [3].
20

Figure 1.3: Five year survival and incidence of colorectal cancer (CRC) in the United States population (2012), grouped by tumour stage defined as localised (stage I and II), regional (stage III) or distant (stage IV) disease. Adapted from Siegel et al. 2012 [6].
21

Figure 1.4: Colorectal tumours are classified into three groups; proximal colorectal cancer, which originates to the right of the splenic flexure (cecum, ascending colon, and transverse colon); distal colorectal cancer that arises to the left of this site (descending colon, sigmoid colon) and rectum. Adapted from Li et al. 2009 [7].
22
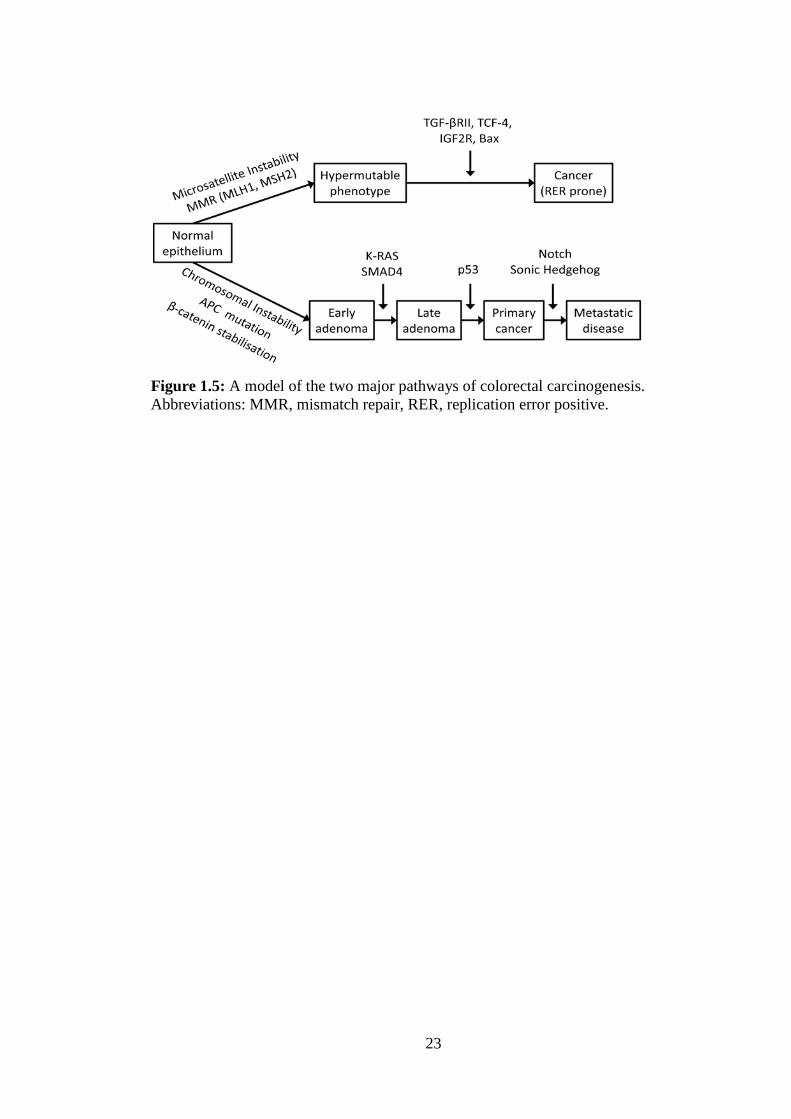
Figure 1.5: A model of the two major pathways of colorectal carcinogenesis. Abbreviations: MMR, mismatch repair, RER, replication error positive.
23

Figure 1.6: The nuclear receptor superfamily, grouped based on homology as seven subclasses: (1) Thyroid Hormone Receptor-like, (2) Retinoid X Receptor-like, (3) Estrogen Receptor-like, (4) Nerve Growth Factor IB-like, (5) Steroidogenic Factor-like, (6) Germ Cell Nuclear Factor-like and (7) Miscellaneous. Adapted from Zhao et al. 2004 [49].
24

Figure 1.7: Generic structure of nuclear receptors
25
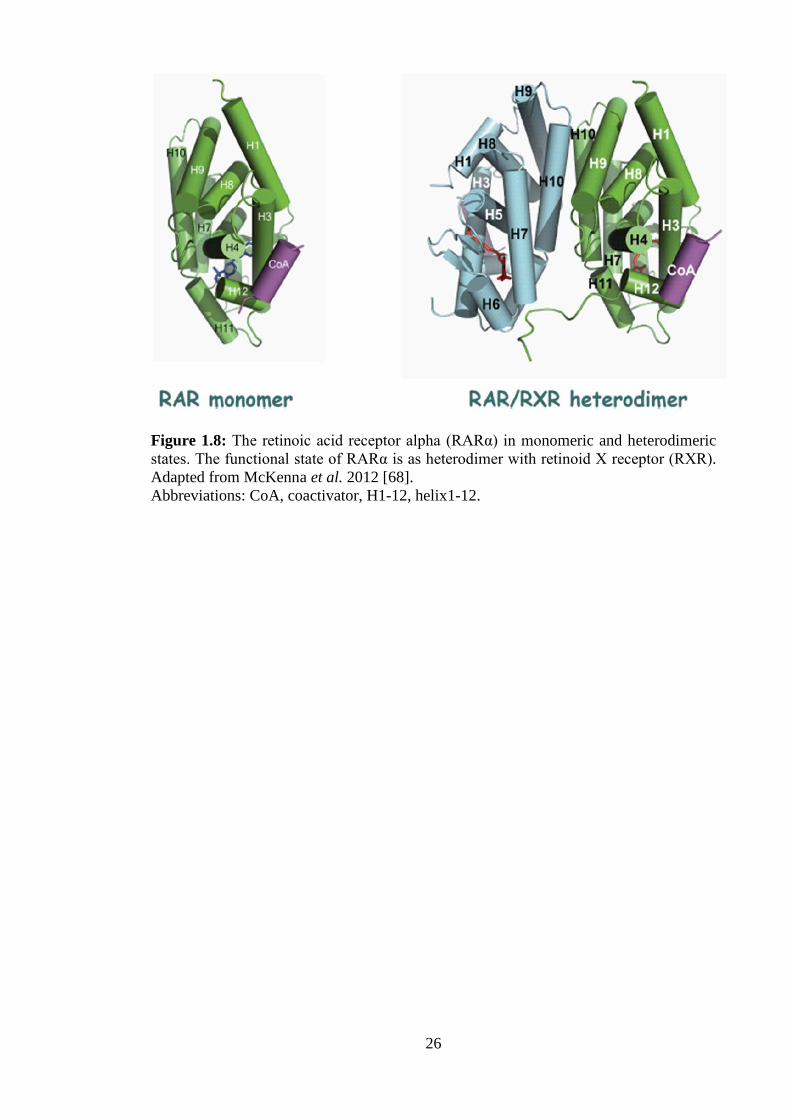
Figure 1.8: The retinoic acid receptor alpha (RARα) in monomeric and heterodimeric states. The functional state of RARα is as heterodimer with retinoid X receptor (RXR). Adapted from McKenna et al. 2012 [68]. Abbreviations: CoA, coactivator, H1-12, helix1-12.
26

Figure 1.9: The activities of nuclear receptors (NRs) are modulated by forming complexes with coregulators, that either augment (coactivators) or reduce (corepressors) the transcriptional activity of NRs binding to corresponding hormone response elements (HREs). Adapted from Chawla et al. 2004 [75].
27

Figure 1.10: The Steroid receptor RNA activator (SRA) and its binding partners. SRA’s stem-loop structure 7 (STR7) is the binding site of the corepressors SLIRP and SHARP. Adapted from Colley et al. 2011 [92].
28
Figure 1.11: Representation of the human SLIRP protein [43]. Abbreviations: MLS, mitochondrial localisation signal, RRM, RNA recognition motif.
29

Figure 1.12: SLIRP repression and SRA augmentation of nuclear receptor signalling in HeLa cells, adapted from Hatchell et al. 2006 [43]. Abbreviations: ARE, androgen receptor element; Dex, dexamethasone; DHT, dihydrotestosterone; GRE, glucocorticoid receptor element; GW501516, PPARδ agonist; PPARE, peroxisome proliferator activated receptor element; T3, tri-iodothyronine; TRE, thyroid receptor element; VitD, vitamin D; VDRE, vitamin D receptor element.
30

Figure 1.13: Immunofluorescent staining images for DAPI, SLIRP and HSP60 mitochondrial protein in HeLa cells. As evident in the overlayed window, SLIRP and HSP60 strongly colocalised, indicative of a predominantly mitochondrial subcellular localisation for SLIRP. Adapted from Hatchell et al. 2006 [43].
31

Figure 1.14: Simplified schematic of the Notch signalling pathway. Upon Notch ligand binding, a two-step proteolysis cleavage process (small arrows) within the juxtamembrane region and transmembrane domain of the Notch receptor is catalyzed by a member of the disintegrin and metalloproteases (ADAMS) family and the γ-secretase containing complex, respectively, then the Notch intracellular domain (NICD) is released from the membrane and translocates to the nucleus, where it forms a transcriptional activation complex with CSL and coactivators (CoA), thereby inducing the transcription of target genes, such as HES1. Adapted from Kume et al. 2009 [113].
32

Figure 1.15: Simplified schematic of the Notch signalling pathway, focusing upon the regulation and suspected downstream effects of Notch-induced transcription factors (NTFs) HEY1, HES1 and SOX9.
33

Chapter 2: SLIRP is a marker of favorable prognosis in colorectal cancer patients
34

2.1 Abstract
The expression of SLIRP, a mitochondrial protein and nuclear receptor coregulator
(NR), was evaluated in colorectal cancer (CRC) patients to determine its
clinicopathologic and prognostic significance. Levels of SLIRP protein were measured
by immunohistochemistry in a nonmalignant and tumour tissue microarray (TMA) of
975 CRC patients, and findings correlated to pathologic, molecular and clinical
variables. SLIRP had lower expression in stage III compared to stage II CRC patients,
in both tumour (OR 0.49, p<0.0001) and nonmalignant (OR 0.16, p<0.0001) tissue.
High SLIRP expression in tumour and nonmalignant tissue was associated with a higher
eight year survival for CRC patients (HR 0.66, p=0.001, HR 0.67, p=0.007
respectively). SLIRP had a tumour suppressor phenotype, correlating inversely with
high microsatellite instability (MSI-H), cyclooxygenase 2 (COX2, also known as
PTGS2) overexpression, lymph node metastasis, and vascular and lymphatic invasion.
High SLIRP expression correlated with a strong lymphocytic response, and elevated β-
catenin, SFRP4, P53 and MLH1 expression. Multivariable models show SLIRP has
value as a prognostic biomarker in patients with proximal CRC (Harrell’s Concordance
= 0.781). This clinical study demonstrates potential for SLIRP expression in
determination of CRC prognosis and treatment. Patients with high SLIRP expressing
tumours showed lower rates of lymph node spread and improved overall survival.
SLIRP may be a tumour suppressor and therapeutic target through its action as a
regulator of energy metabolism and modulator of NR signalling, processes that play
major roles in determination of CRC incidence, progression and mortality.
35

2.2 Introduction Colorectal cancer (CRC) is the third most common malignancy and the second highest
cause of cancer death in the United States [4]. CRC may be categorised, based on its
site of emergence into proximal colonic, distal colonic or rectal carcinoma, each with
distinct demographics, risk factors, molecular and pathological markers, and clinical
outcomes [7].
Stem-loop interacting RNA binding protein (SLIRP) has two broad functions important
in CRC. The first is performed in the nucleus where SLIRP acts as a nuclear receptor
(NR) coregulator and the second in mitochondria where SLIRP acts as a
posttranscriptional regulator of mitochondrial genes. SLIRP was initially identified in a
yeast three-hybrid screen as a nuclear protein that interacts with stem-loop 7 (STR7), a
substructure of steroid receptor RNA activator (SRA) [43]. It was subsequently
discovered that SLIRP acts with SRA in a coregulator complex to alter the activity of
many NR pathways. Affected signalling pathways include many NRs important in CRC
incidence, progression and mortality, such as vitamin D, estrogens, and the peroxisome
proliferator activated receptor (PPAR) pathways, which alludes to a potentially
significant role for SLIRP in CRC oncogenesis [43-46, 51, 55, 60]. This is accentuated
by the association of SRA overexpression with poorer prognosis in ovarian and breast
cancer patients [99, 100]. Although there are reports of NRs in mitochondria [147],
where SLIRP is predominantly expressed, no studies to date have shown whether
SLIRP has a role in their regulation in this organelle. The second known function of
SLIRP is performed in complex with the mitochondrial protein LRPPRC [102]. This
SLIRP-LRPPRC complex plays a role in posttranscriptional mitochondrial gene
expression by regulating the stability and handling of mature mRNAs through
36

suppression of 3’ exonucleolytic mRNA degradation mediated by PNPase and SUV3
[103]. Low SLIRP levels cause a dramatic reduction in the expression of many
mitochondrial genes critical to oxidative phosphorylation. As impaired oxidative
phosphorylation is a trait of advanced CRC, which favours anaerobic glycolysis, a loss
of SLIRP may be an important step in CRC progression [104-107].
Based on SLIRP’s biological functions and the emerging role for NRs and NR
coregulators in CRC, we explored the clinical significance of SLIRP expression in CRC
patients and its associations with molecular and pathological features. In TMAs of 975
stage II (lymph node (LN) negative) and III (LN positive) CRC patients, we found
SLIRP was a good prognostic factor and it was significantly correlated with survival.
SLIRP expression was associated with a good prognostic signature that included high β-
catenin, p53 and MLH1, and low COX-2, microsatellite instability (MSI) and ratio of
positive lymph nodes (RPLN).
2.3 Materials and methods Study populations Colorectal tissues were collected between 1990 and 1999 from CRC patients that
underwent surgery at Sir Charles Gairdner Hospital (SCGH), Western Australia.
Information on patient demographics and tumour features were obtained from SCGH
medical records and previous studies of this cohort [1, 148]. Tumour site was classified
as ‘rectal’ when in the rectum, ‘distal’ when occurring between the proximal rectal
margin and the splenic flexure and ‘proximal’ when proximal to and within the splenic
flexure. A total of 590 patients with stage II and 385 patients with stage III CRC were
studied (n=975). Information on tumour SLIRP, nonmalignant SLIRP, tumour stage,
37

anatomic site, ratio of positive lymph nodes (RPLN), histologic grade, vascular
invasion, perineural invasion, lymphatic invasion, lymphocytic response, MSI, β-
catenin, COX2, p53, MLH1 and SFRP4 was available. Information on disease-specific
survival was obtained from the Cancer Registry of Western Australia. The great
majority of cases received 5-fluorouracil chemotherapy including folinic acid for 6
cycles, with a minority of older cases receiving 5-fluorouracil chemotherapy including
levamisole for 12 cycles, each of four weeks duration. All rectal cancer patients were
treated prior to the introduction of neoadjuvant therapy as the standard of care for local
advanced disease. The median follow-up time was 62.8 months. At the end of the study
period, 31% of patients had died as a result of disease recurrence and 25% from other
causes. Ethics approval for this study was obtained from the Royal Perth Hospital
Human Research Ethics Committee.
Tissue microarray The TMA was constructed as described previously [148]. The array comprised 975
surgically resected cases within 14 TMA blocks. For each case, two cores of 1 mm
diameter were taken at random from tumour tissue, and an additional 1-mm diameter
core was taken from histologically normal colonic mucosa.
Diaminobenzidine immunohistochemistry Sections were deparaffinized through 3 changes of xylene (3 minutes), rehydrated
through graded alcohols to distilled water and subjected to antigen retrieval in EDTA
pH 8.0 under pressure. After blocking endogenous peroxide activity with hydrogen
peroxide (HRP), SLIRP polyclonal antibody (WAIMR) was applied at 1:3000 for 60
minutes. Dako Envision+ Dual link s–HRystemP was then applied for 30 min
38

incubation. Sections were visualised with diaminobenzidine (DAKO) followed by a
light counterstain of haematoxylin.
Immunofluorescence microscopy
For immunofluorescence studies, sections were blocked in 10% goat serum and 1%
BSA, and then stained overnight at 4°C with anti-SLIRP rabbit antibody (Abcam,
ab51523) at 1:250 and anti-HSP60 mouse antibody (Abcam, ab3080) at 1:100. After
three 5 min washes in PBS containing 1% BSA and 0.05% Triton-X 100, sections were
incubated with Alexa Fluor 488 goat anti-rabbit IgG at 1:250 (Invitrogen, A11034) and
Alexa Fluor 546 goat anti-mouse IgG at 1:250 (Invitrogen, A11003) for 1 h. After one
wash, 6-Diamidino-2-phenylindole dihydrochloride (Sigma-Aldrich, D9542) was
applied at 1:10000 for 5 minutes. Samples were then washed 3 times in PBS and
mounted. Images were visualised with a Nikon Eclipse Ti microscope and captured with
a Photometrics CoolSNAP HQ2 camera.
TMA Scoring Three authors independently scored the density of SLIRP staining across the cores, and
ranked them based on intensity using a scale from 0 to 3 (0, no expression; 1, weak
expression, 2, intermediate expression; 3, strong expression) (Figure 2.1A&B).
Individual investigator scores were then averaged with automated scoring performed as
follows. TMA slides were scanned with a high resolution scanner (ScanScope XT;
Aperio) at 400 x magnification and segmented in Spectrum (Aperio) to associate cores
with patient information. Image analysis software (ImageScope, Aperio) program
“Positive Pixel Count Version 9” was used to determine SLIRP expression. Score data
was analysed as either semi-ordinal, by Cox regression, or dichotomous, by Kaplan
Meier survival curves. Semi ordinal data consisted of densities ranging 0 to 3, in 0.25
39

increments. These were segregated to produce dichotomous data, by defining scores less
than 2, as low and those equal to or greater than 2, as high. This cut-point was chosen,
because it easily distinguished patients based on SLIRP expression into high and low
expressing groups.
Data analysis Bivariate associations of SLIRP with clinical and pathologic characteristics of patients
were estimated using Spearman’s rho because of the ordinal scale of SLIRP expression.
The Kaplan-Meier survivor function was used to generate survival curves and the log-
rank test was used for univariate tests of survival. Cox’s proportional hazards models
were used to examine associations of SLIRP and other variables with survival with ties
being addressed using Efron’s method. Harrell’s C statistic was used to estimate
concordance for each independent variable [149]. Age and gender adjusted estimates
were used to avoid confounding by these variables and stratification was used to control
confounding by tumour site and AJCC stage. The validity of the proportional hazards
assumption was assessed using the scaled Schoenfeld residuals as described by
Grambsch and Therneau [150]. All statistical tests were two-tailed and an alpha
probability less that 0.05 was regarded as statistically significant. The analysis was
conducted using Stata Version 12 (Stata-Corp LP, College Station, TX) and the ‘rms’
package of R [151].
2.4 Results To investigate the expression of SLIRP in CRC, we interrogated a well described
human CRC TMA [1] that contained a total of 3292 TMA cores of malignant and
nonmalignant tissue from 590 stage II (LN negative) and 385 stage III (LN positive)
40
CRC patients. SLIRP had a typically punctuate, cytoplasmic distribution, concentrated
in epithelial cells, in both tumour (Figure 2.1C-F) and nonmalignant (Figure 2.1G-J)
tissue that colocalised with mitochondrial protein HSP60.
Correlations between SLIRP protein and clinicopathologic and molecular features are
listed in Table 2.1. High SLIRP expression correlated with strong lymphocytic response
to tumours and elevated expression of Wnt signalling members’ β-catenin and SFRP4,
as well as tumour suppressors p53 and MLH1, a key DNA mismatch repair protein.
SLIRP was inversely correlated with MSI, LN metastasis, COX-2 and lymphatic and
vascular invasion.
Consistent with earlier studies patients with rectal cancer had a poorer prognosis than
those with proximal or distal colon cancer (Figure 2.2A). Patients with high SLIRP
expressing tumours had a significantly higher probability of survival than those with
low SLIRP (HR 0.81, p=0.006) after 8-years of follow up (Figure 2.2B, Table 2.2).
Stratifying by tumour site, high SLIRP associated with favourable prognosis in patients
with proximal colon (HR 0.72, p=0.004) and rectal cancer (HR 0.76, p=0.040), but not
in distal colon cancer (HR 1.07, p=0.678) (Figure 2.2C-E, Table 2.2). High SLIRP
significantly correlated with better prognosis in LN negative (HR 0.63, p=0.021), but
not LN positive CRC (HR 0.76, p=0.082) (Figure 2.2F&G). The proportion of patients
with high SLIRP tumour expression, halved from LN negative to positive CRC (OR
0.49, p=0.0001) (Table 2.3). This indicates SLIRP expression may be lost in metastatic
tumours.
Surprisingly, high SLIRP protein in nonmalignant tissue was strongly predictive of both
reduced LN metastasis and favourable prognosis (HR 0.83, p=0.027) (Figure 2.2H).
41

Stratifying by tumour site, a better prognosis was observed with high nonmalignant
SLIRP expression in patients with tumours of the proximal colon (HR 0.74, p=0.029),
but this was not significant in distal colon (HR 0.76, p=0.173) or rectum (HR 0.91,
p=0.529) (Table 2.2). High nonmalignant SLIRP expression correlated with an older
average age of patient diagnosis, such that for a ten year increase in age at diagnosis,
there was a 4% rise in patients with high SLIRP expression (p<0.05). In addition, there
was a 6-fold reduction (OR 0.16, p<0.0001) in the proportion of patients with high
nonmalignant SLIRP expression upon acquisition of LN positive disease (Table 2.3).
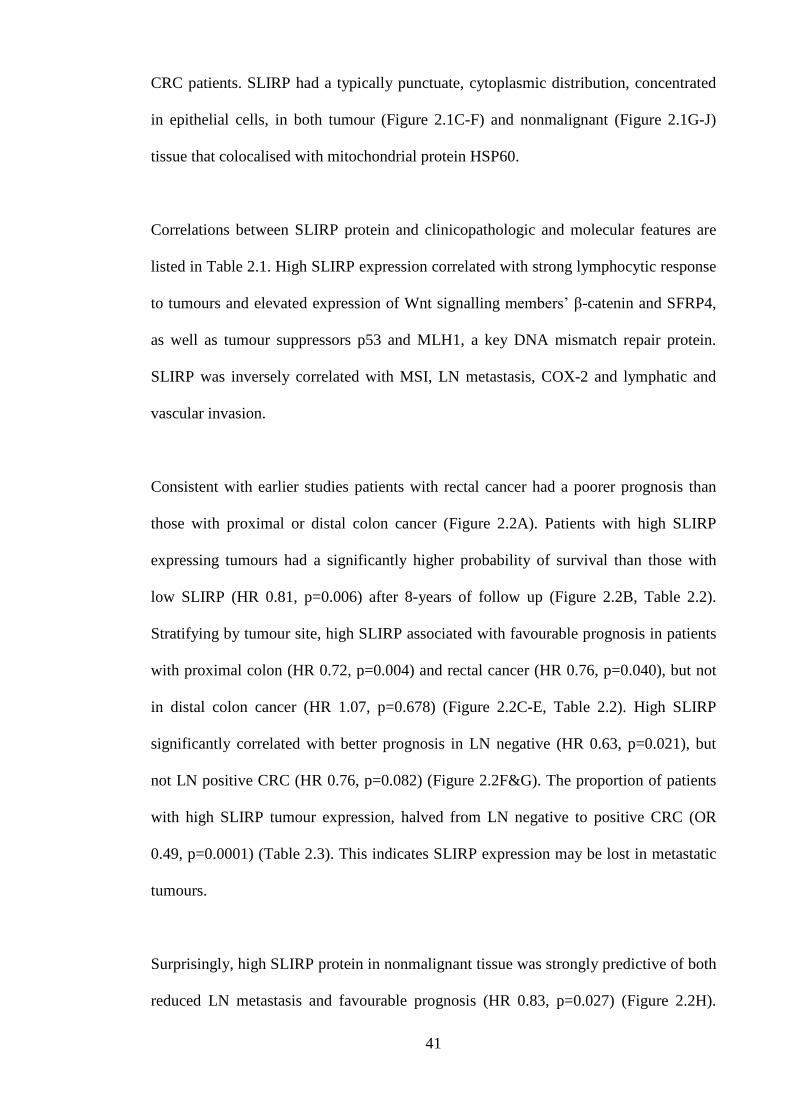
Multivariable regression models revealed that assessment of SLIRP protein expression
has prognostic value in CRC patients in combination with clinicopathologic features
(Table 2.4). The SLIRP Harrell’s Concordances for prediction of eight year survival in
patients with tumours of the proximal colon, distal colon and rectum, were 0.781, 0.695
and 0.677 respectively (Model A-C). Patients with high nonmalignant SLIRP
expression and any form of LN positive CRC showed improved survival (HR 0.56,
p=0.038) (Model D). High expression of tumour and nonmalignant SLIRP in patients,
correlated with improved survival (HR 0.74, p=0.019), with no association observed for
SLIRP overexpression in tumour or nonmalignant tissue alone (HR 1.05, p=0.76; HR
1.40, p=0.13 respectively) (Model E). Taken together, these expression data of SLIRP
indicate that high levels in nonmalignant and tumour tissue favour a good prognosis and
may possess antitumour activity.
2.5 Discussion
This is the first clinical investigation of SLIRP expression in AJCC stage II and III CRC
patients. Tumour overexpression of SLIRP correlated with improved survival across the
42

whole patient population. This survival benefit was accentuated in LN negative patients,
and those with proximal colon or rectal cancer.
Although specific NRs, such as the estrogen receptor in breast cancer [152], and the NR
coregulators SRC-1 and SRC-3 [153] in breast and other tumours have roles as either
established or potential biomarkers, there has been little application of biomarkers in
CRC. The correlation of SLIRP with greater survival benefit in LN negative CRC
patients, increases the utility of SLIRP as a putative biomarker, because LN negative
patients receive marginal gains and hence do not routinely receive adjuvant
chemotherapy. The use of accurate prognostic markers in LN negative disease would
allow for selection of patients most at risk of relapse for chemotherapy, which would
improve prognosis and potentially avoid unnecessary treatment toxicity in lower risk
patients [154].
We were intrigued by the observation that high SLIRP expression in nonmalignant
tissue correlated with improved prognosis and a reduced risk of LN metastasis.
Furthermore, there was a dramatic stage specific difference in the proportion of patients
with high nonmalignant SLIRP expression. Patients with high SLIRP expression were 6
times less likely to have LN metastasis than those with low SLIRP. In addition, as high
nonmalignant SLIRP expression correlated with an older age of diagnosis across the
patients, there may be a lower risk of CRC incidence in people with high nonmalignant
SLIRP expression. Patients with high nonmalignant SLIRP levels also had reduced risk
of COX-2 overexpression, higher survival with LN metastases and were more likely to
have a strong lymphocytic response against tumours that correlated with higher CRC
survival in this patient cohort [1]. These effects reinforce the concept that SLIRP may
43

be acting in normal colonic epithelium as a tumour suppressor, and its loss may signify
an early change in cellular phenotype which increases the risk of CRC incidence.
The dominant mitochondrial localisation of SLIRP in Hela cells, where SLIRP acts as a
regulator of metabolism, was also observed in tumour and nonmalignant colorectal
epithelial cells [43]. Functionally, mitochondrial SLIRP complexes with LRPPRC to
play a major role in posttranscriptional gene expression by enhancing the stability of
mature mitochondrial mRNAs [102, 103]. Among the stabilised targets are complex I
and IV proteins of the oxygen dependent electron transport chain, which include
NDUFB8 and cytochrome oxidase II [104]. As the proportion of patients with high
SLIRP expressing tumours halved from LN negative to positive CRC, SLIRP loss may
be a causal factor behind the common metastatic phenotype that features disrupted
oxidative phosphorylation, compensated by anaerobic glycolysis with increased glucose
transport and hypoxic resistance [104-107]. In addition, loss of SLIRP, removing its
role as a NR coregulator may cause dysregulation of PPAR and thyroid receptor
signalling and contribute to the aberrant glucose and lipid metabolism evident in
metastatic disease [43, 155]. Further studies will be needed to address these issues more
specifically.
In conclusion, the present study is the first description of SLIRP in cancer prognosis,
and demonstrates potential for SLIRP expression to be useful in determination of CRC
prognosis and treatment. Patients with high SLIRP expressing tumours showed lower
rates of mortality, LN spread and vascular and perineural invasion. This study suggests
SLIRP may act as a tumour suppressor possibly through its actions as a regulator of
metabolism and NR signalling, and provides a foundation to investigate the molecular
mechanisms involved. This is the focus of the next chapter.
44

Chapter 2: Tables and figures
Table 2.1: Bivariate associations between SLIRP expression and clinical variables
Tumour SLIRP Nonmalignant SLIRP Immunoreactivity Immunoreactivity Tumour SLIRP rho 0.312** n 715 Nonmalignant SLIRP rho 0.312** n 715 LN positive rho -0.218** -0.253** n 935 751 Well differentiated rho -0.016 0.038 tumour n 624 497 RPLN rho -0.214** -0.264** n 723 581 Vascular invasion rho -0.084* -0.094* n 695 556 Perineural invasion rho -0.033 -0.064 n 647 518 Lymphatic invasion rho -0.208** -0.251** n 432 352 Lymphocytic rho 0.083** 0.235** response n 876 704 β-catenin rho 0.227** 0.158** n 921 735 COX2 rho -0.132** -0.188** n 927 741 P53 rho 0.080* -0.056 n 933 747 MSI rho -0.087* 0.077* n 884 709 MLH1 rho 0.099** -0.103** n 927 740 SFRP4 rho 0.115** 0.004 n 938 750
Table 2.1: Bivariate associations between SLIRP expression and clinical variables NOTE: Protein data used in the spearman rank correlation tests were collected at the time of colorectal cancer diagnosis. Abbreviation: LN, lymph node, MSI, microsatellite instability, RPLN, ratio of positive to negative lymph nodes examined. *Correlation is significant at the <0.05 level (two tailed). **Correlation is significant at the <0.005 level (two tailed).
45

Table 2.2: Univariate Cox survival analysis of pathologic and molecular features Variable
n deaths
HR (adjusted for age and gender)
p-value
95% confidence interval of HR
Tumour SLIRP All 283 0.81 0.006 0.70-0.94 Proximal 117 0.72 0.004 0.57-0.90 Distal 61 1.07 0.678 0.78-1.46 Rectal 99 0.76 0.040 0.58-0.99 Nonmalignant All 230 0.83 0.027 0.70-0.98 SLIRP Proximal 91 0.74 0.029 0.56-0.97 Distal 49 0.76 0.173 0.52-1.13 Rectal 86 0.91 0.529 0.69-1.21 LN positive All 296 3.1 <0.0001 2.51-4.03 Proximal 119 4.96 <0.0001 3.12-6.81 Distal 63 2.96 <0.0001 1.00-1.06 Rectal 108 2.23 <0.0001 1.52-3.27 COX2 All 292 2.87 <0.0001 2.28-3.62 Proximal 117 4.10 <0.0001 2.81-5.99 Distal 64 2.80 <0.0001 1.69-4.62 Rectal 105 2.10 <0.0001 1.41-3.13 β-catenin All 287 0.68 0.004 0.52-0.89 Proximal 118 0.51 0.001 0.35-0.76 Distal 63 1.05 0.873 0.54-2.03 Rectal 100 0.89 0.619 0.57-1.40 SFRP4 All 298 1.02 0.853 0.84-1.24 Proximal 120 0.95 0.580 0.78-1.15 Distal 64 2.41 0.041 1.04-5.58 Rectal 108 0.85 0.473 0.54-1.33 P53 All 296 1.04 0.765 0.81-1.32 Proximal 119 1.34 0.139 0.91-1.97 Distal 64 1.31 0.292 0.80-2.14 Rectal 107 0.68 0.084 0.44-1.05 Table 2.2: Cox survival analysis of pathologic and molecular features NOTE: Cox regression analysis of deaths caused by colorectal cancer over the eight years following diagnosis. Tumour expressions were linear in Cox spline regression. Abbreviation: LN, lymph node, HR, hazard ratio.
46

Table 2.3: SLIRP protein expression in patient colorectal tissue
Category n Mean expression (cells/mm2)
Comparisons .
OR p-value
N stage II 443 378 Stage II: T vs. N 1.44 <0.0001 N stage III 308 61 Stage III: T vs. N 4.41 <0.0001
N all stages 751 248 N stages: III vs. II 0.16 <0.0001 T stage II 565 545 T stages: III vs. II 0.49 <0.0001
T stage III 383 269 All stages: T vs. N 1.75 <0.0001 T all stages 948 433
Table 2.3: SLIRP protein expression in patient colorectal tissue NOTE: SLIRP immunoreactivity/density levels in each patient’s tissue were determined using the image analysis software program “Positive Pixel Count Version 9” in the ImageScope® environment (Aperio). Abbreviation: N, nonmalignant tissue, OR, odds ratio, stage, American Joint Committee on Cancer staging, T, tumour tissue.
47
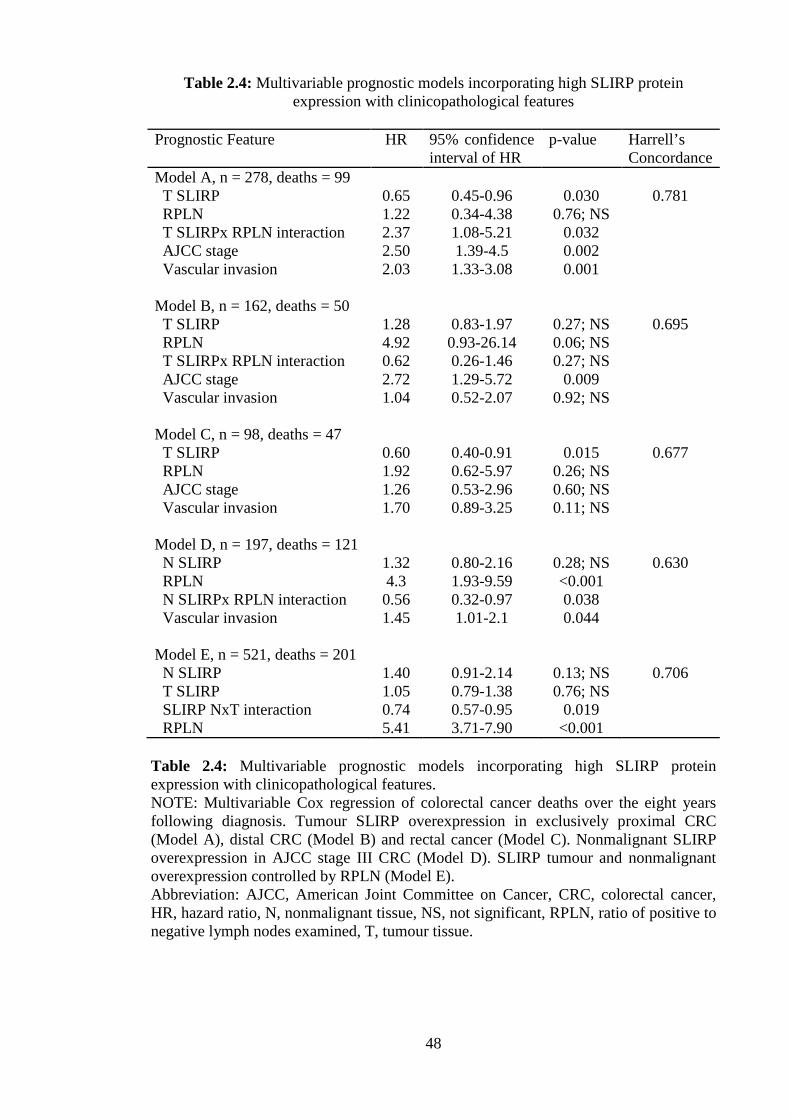
Table 2.4: Multivariable prognostic models incorporating high SLIRP protein expression with clinicopathological features
Prognostic Feature HR 95% confidence
interval of HR p-value Harrell’s
Concordance Model A, n = 278, deaths = 99 T SLIRP 0.65 0.45-0.96 0.030 0.781 RPLN 1.22 0.34-4.38 0.76; NS T SLIRPx RPLN interaction 2.37 1.08-5.21 0.032 AJCC stage 2.50 1.39-4.5 0.002 Vascular invasion 2.03 1.33-3.08 0.001 Model B, n = 162, deaths = 50
T SLIRP 1.28 0.83-1.97 0.27; NS 0.695 RPLN 4.92 0.93-26.14 0.06; NS T SLIRPx RPLN interaction 0.62 0.26-1.46 0.27; NS AJCC stage 2.72 1.29-5.72 0.009 Vascular invasion 1.04 0.52-2.07 0.92; NS
Model C, n = 98, deaths = 47 T SLIRP 0.60 0.40-0.91 0.015 0.677 RPLN 1.92 0.62-5.97 0.26; NS AJCC stage 1.26 0.53-2.96 0.60; NS Vascular invasion 1.70 0.89-3.25 0.11; NS Model D, n = 197, deaths = 121 N SLIRP 1.32 0.80-2.16 0.28; NS 0.630 RPLN 4.3 1.93-9.59 <0.001 N SLIRPx RPLN interaction 0.56 0.32-0.97 0.038 Vascular invasion 1.45 1.01-2.1 0.044
Model E, n = 521, deaths = 201
N SLIRP 1.40 0.91-2.14 0.13; NS 0.706 T SLIRP 1.05 0.79-1.38 0.76; NS SLIRP NxT interaction 0.74 0.57-0.95 0.019 RPLN 5.41 3.71-7.90 <0.001 Table 2.4: Multivariable prognostic models incorporating high SLIRP protein expression with clinicopathological features. NOTE: Multivariable Cox regression of colorectal cancer deaths over the eight years following diagnosis. Tumour SLIRP overexpression in exclusively proximal CRC (Model A), distal CRC (Model B) and rectal cancer (Model C). Nonmalignant SLIRP overexpression in AJCC stage III CRC (Model D). SLIRP tumour and nonmalignant overexpression controlled by RPLN (Model E). Abbreviation: AJCC, American Joint Committee on Cancer, CRC, colorectal cancer, HR, hazard ratio, N, nonmalignant tissue, NS, not significant, RPLN, ratio of positive to negative lymph nodes examined, T, tumour tissue.
48

Figure 2.1: Immunostaining of SLIRP in human colorectal tissue. Tumour tissue with strong immunoreactivity (A). Tumour tissue with no immunoreactivity (B). Nonmalignant tissue with weak immunoreactivity (C). Nonmalignant tissue with moderate immunoreactivity (D). Immunofluorescent staining in nonmalignant colorectal tissue: negative control (E), HSP60 (F), SLIRP (G) and colocalised DAPI, HSP60 and SLIRP (H). Immunofluorescent staining in tumour tissue: negative control (I), HSP60 (J), SLIRP (K) and colocalised DAPI, HSP60 and SLIRP (L). Bars, 50μM.
49
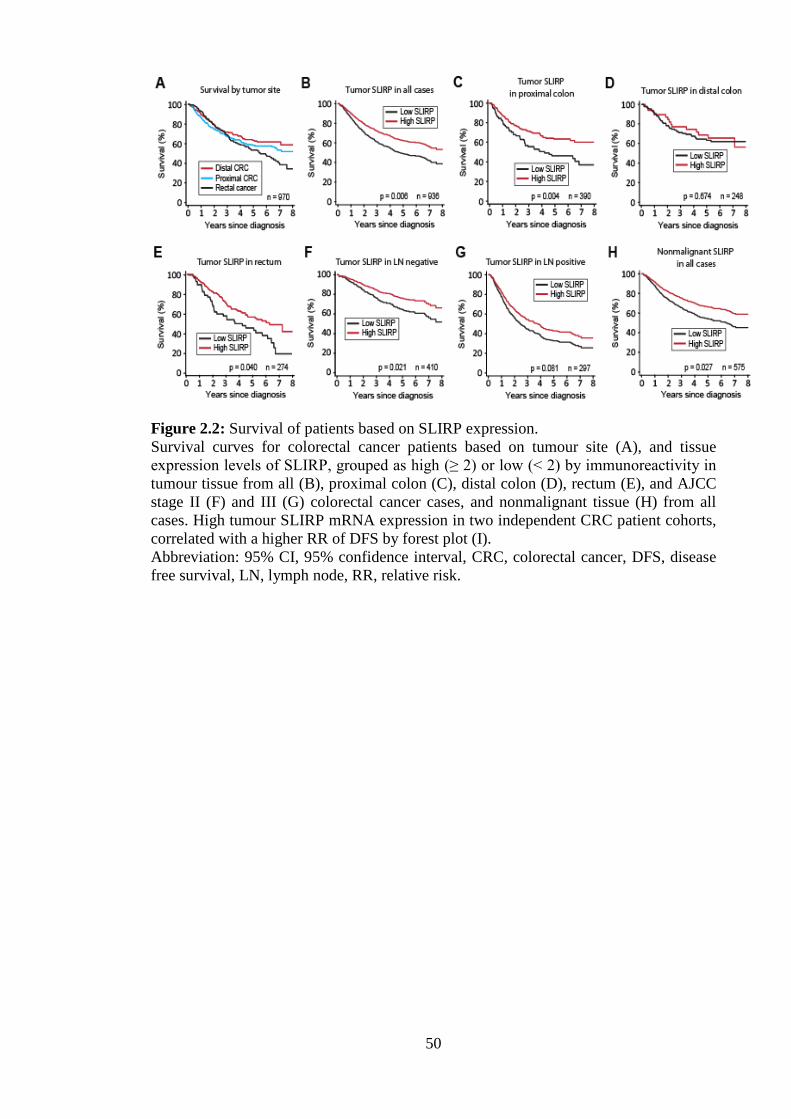
Figure 2.2: Survival of patients based on SLIRP expression. Survival curves for colorectal cancer patients based on tumour site (A), and tissue expression levels of SLIRP, grouped as high (≥ 2) or low (< 2) by immunoreactivity in tumour tissue from all (B), proximal colon (C), distal colon (D), rectum (E), and AJCC stage II (F) and III (G) colorectal cancer cases, and nonmalignant tissue (H) from all cases. High tumour SLIRP mRNA expression in two independent CRC patient cohorts, correlated with a higher RR of DFS by forest plot (I). Abbreviation: 95% CI, 95% confidence interval, CRC, colorectal cancer, DFS, disease free survival, LN, lymph node, RR, relative risk.
50

Chapter 3: SLIRP regulates cross-talk between the retinoic acid and Notch signalling pathways in
colorectal cancer
51

3.1 Abstract SLIRP is a SRA-binding NR corepressor that acts as a tumour suppressor in CRC. High
SLIRP expression is associated with a significant improvement in survival, however the
molecular mechanisms remain to be determined. Recently, RARα was found to promote
oncogenic Notch signalling in breast cancer, aberrant signalling of which is linked to
chemoresistance and metastasis. In light of this, SLIRP’s effects on RARα and Notch
signalling were explored. SLIRP repressed the transcription and translation of RARα,
whilst RARα regulated targets HES1 and SOX9 were elevated following SLIRP
ablation and reduced with overexpression in CRC cells. SLIRP also repressed
NOTCH2, NOTCH3, NFKB1, NFKB2 and LMO2. In Chromatin Immunoprecipitation
(ChIP) studies, SLIRP was recruited (with RARα) to the HES1 and SOX9 promoters.
When SLIRP was depleted from the cells with siRNA, ChIP revealed an increase in
RARα recruitment to the HES1 and SOX9 promoters, along with increased binding of
SOX9 to the HES1 promoter, and a decrease in binding of HES1 to its own promoter.
SRA depletion resulted in major changes in SLIRP and HES1 recruitment in ChIP
assays. Further, we found that SLIRP depleted CRC cells were more invasive in
collagen assays, displayed increased glucose consumption and were resistant to the
CRC chemotherapeutic agents, 5-fluorouracil, oxaliplatin and irinotecan. Furthermore,
high SLIRP mRNA expression in tumours correlated with higher disease free survival
(DFS) in CRC patients. Taken together, these data suggest that SLIRP is a potent
suppressor of SRA mediated Notch and RARα signalling in CRC and provide insight
into the mechanisms by which SLIRP may function as a tumour suppressor in this
disease.
52

3.2 Introduction The NR superfamily of ligand-inducible transcription factors plays important roles in
CRC. For instance, the peroxisome proliferator activated receptor γ (PPARγ) and the
vitamin D receptor (VDR) mediate powerful antitumour effects that are associated with
reduced CRC incidence, progression and mortality [57, 59]. The retinoic acid (RA)
receptor alpha (RARα) NR, is highly expressed in colorectal mucosa and CRC [71].
RARα is involved in differentiation, apoptosis and cellular matrix homeostasis [66, 67].
Recently RARα was discovered to promote oncogenic Notch signalling, particularly
expression of Notch-induced transcription factors (NTFs) HES1 and SOX9 [70]. Upon
Notch activation, there is an increase in expression of HES1 and SOX9, which
consequently accumulate in the nucleus, leading to the transcriptional inhibition of
downstream targets [125, 126]. Aberrant Notch signalling has been implicated in
promotion of epithelial to mesenchymal transition (EMT), chemoresistance,
proliferation and metastasis [109, 110, 117, 118], and hence is a key therapeutic target.
Phase I/II clinical trials testing Notch inhibitors are ongoing, however, despite successes
with in vitro and xenograft models, the significant mucosal toxicity of current Notch
inhibitors has prevented their routine clinical implementation [121, 122]. Discovery of
novel ways to interrupt Notch signalling may enable lower doses of current inhibitors
thereby reducing side effects and increasing tolerability.
SLIRP is a potent NR corepressor that binds SRA, via its RRM and SRA’s stem loop 7
[43]. SLIRP has two distinct functions of potential significance in CRC.
The first function of SLIRP is performed in the nucleus, where SLIRP acts as a NR
coregulator, in complex with SRA, altering the activity of many NR pathways [43].
53
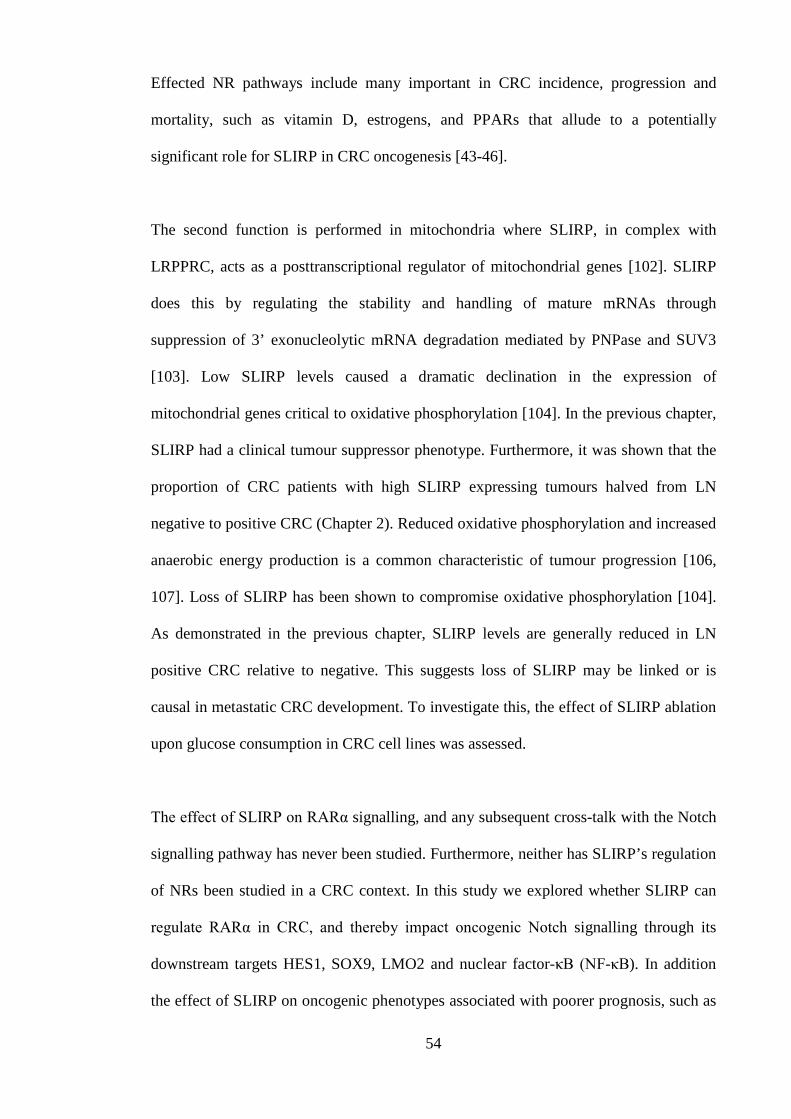
Effected NR pathways include many important in CRC incidence, progression and
mortality, such as vitamin D, estrogens, and PPARs that allude to a potentially
significant role for SLIRP in CRC oncogenesis [43-46].
The second function is performed in mitochondria where SLIRP, in complex with
LRPPRC, acts as a posttranscriptional regulator of mitochondrial genes [102]. SLIRP
does this by regulating the stability and handling of mature mRNAs through
suppression of 3’ exonucleolytic mRNA degradation mediated by PNPase and SUV3
[103]. Low SLIRP levels caused a dramatic declination in the expression of
mitochondrial genes critical to oxidative phosphorylation [104]. In the previous chapter,
SLIRP had a clinical tumour suppressor phenotype. Furthermore, it was shown that the
proportion of CRC patients with high SLIRP expressing tumours halved from LN
negative to positive CRC (Chapter 2). Reduced oxidative phosphorylation and increased
anaerobic energy production is a common characteristic of tumour progression [106,
107]. Loss of SLIRP has been shown to compromise oxidative phosphorylation [104].
As demonstrated in the previous chapter, SLIRP levels are generally reduced in LN
positive CRC relative to negative. This suggests loss of SLIRP may be linked or is
causal in metastatic CRC development. To investigate this, the effect of SLIRP ablation
upon glucose consumption in CRC cell lines was assessed.
The effect of SLIRP on RARα signalling, and any subsequent cross-talk with the Notch
signalling pathway has never been studied. Furthermore, neither has SLIRP’s regulation
of NRs been studied in a CRC context. In this study we explored whether SLIRP can
regulate RARα in CRC, and thereby impact oncogenic Notch signalling through its
downstream targets HES1, SOX9, LMO2 and nuclear factor-κB (NF-κB). In addition
the effect of SLIRP on oncogenic phenotypes associated with poorer prognosis, such as
54

metastasis, anaerobic glycolysis and chemoresistance were studied in vitro. Clinically,
mRNA SLIRP expression in tumours was compared to the rate of DFS in two CRC
patient cohorts. Thus this was the first CRC study that assessed the role of SLIRP as a
tumour suppressor through regulation of RA and Notch signalling, and by examination
of its effects on aggressive CRC phenotypes and patient DFS.
3.3 Materials and methods Study population and data analysis
The tumour mRNA expression data from two cohorts of 74 (GSE14333 [156]) and 370
(GSE2109 [157]) CRC patients were analysed. Data was normalised and annotated
using R packages affy, limma and hgu133plus2.db. The probe identifiers for SLIRP
(221434_s_at), SOX9 (202936_s_at) and HES1 (203393_at) were used. Available
phenotypes included gender, age, tumour site and stage. The time to death or recurrence
of disease was used in a Cox analysis to assess the influence of SLIRP mRNA
expression on DFS.
Cell Culture
All cell lines were obtained from the ATCC and grown at 37°C with 5% CO2 in
Dulbecco’s modified Eagle’s medium supplemented with 10% fetal bovine serum
(FBS).
55

Transfections, reagents, plasmid constructs and Luciferase Assays
Cells were seeded 24 hours prior to transfection in 6 well plates and transfected using
Lipofectamine 2000 (Invitrogen) with 50 μM of siRNA directed against SLIRP, SRA or
RARα or against Green Fluorescent Protein (GFP) as a negative control (Dharmacon) in
Optimem (Invitrogen). Dual siRNA experiments were achieved using 25 μM of each
siRNA for a total of 50 μM. Each experiment was repeated at least in triplicate, with
two different siRNA duplexes. Cell monolayers were harvested 3 days after transfection
with Passive Lysis Buffer (Promega) for Western blotting and Luciferase assays or in
Qiazol (Qiagen) for RNA extraction. Reporter vectors RARE [158, 159], HES1E [160],
or SOX9E (a kind gift from Prof Peter Koopman), plus the internal control vector pRL-
CMV Renilla (Promega) were transfected into CRC cell lines using Transit (Mirus) and
the luciferase and renilla activity of lysates measured using a Dual Luciferase Reporter
Assay System (Promega) as previously described [161]. Cultures were treated with 2
μM RA (Sigma-Aldrich) or DMSO vehicle only for 24 h. Expression vectors for SRA
(WT), SRA (SDM7), SLIRP (WT) and SLIRP (R24,25A) as previously described [43,
162]
qRT-PCR
Total RNA was extracted using the ThermoScript RT-PCR System (Invitrogen) and
qRT-PCR performed using a Corbett 6000 RotorGene instrument (Corbett Research)
with Platinum SYBR Green (Invitrogen) and GAPDH, SOX9, HES1, NOTCH2,
NOTCH3, NFKB1, NFKB2 and LMO2 mRNA primers (Table 3.1) from Primer Bank
[163]. Expression of target mRNAs relative to GAPDH mRNA was determined using
the 2-∆∆CT method [164].
56

ChIP assays
Assays were performed as described [165]. HT29 cells were treated with 2 μM RA for
70 min prior to fixation. Immunoprecipitations were done at 4˚C overnight using IgG
(SC-2027, Santa Cruz), SLIRP (Western Australian Monoclonal Antibody Facility),
NCoR (SC-8994, Santa Cruz), SOX9 (SC-20095, Santa Cruz), HES1 (SC-13844, Santa
Cruz) and RARα (ab41934, Abcam). DNA was purified using QIAquick PCR
Purification kits (Qiagen) and analyzed with quantitative PCR using Roche SYBR
Green master mix on a Roche Lightcycler 480. qPCR primers for RARE sites in the
SOX9 and HES1 promoters and the SOX9E and HES1E sites in the HES1 promoter
[70] are listed in Table 3.1. The real-time PCR data was normalized to the input.
Western Blotting
Western blotting was performed as previously described [161] with primary rabbit
antibodies for SLIRP (1:2500, Western Australian Monoclonal Antibody Facility),
SOX9 (1:1000, ab3697, Abcam) and LMO2 (1:1000, ab72841, Abcam), goat antibody
for HES1 (1:1000, SC-13844, Santa Cruz) and mouse antibody for β-actin (1:10000,
ab6276, Abcam). Secondary horseradish peroxidase-linked anti-mouse IgG (NA931V,
GE Healthcare), anti-goat IgG (AB324P, Chemicon Australia) and anti-rabbit IgG
(NA934V, GE Healthcare) antibodies were used at 1:10000.
Chemosensitivity assays
Two days after SLIRP and GFP siRNA transfection, SW620, HT29 or HCT116 cells
were seeded into 96-well plates at 3 x 10³ cells per well. After 3 h, ten-fold serial
dilutions from 1000 to 0.01 μM of 5-FU, irinotecan or oxaliplatin were added to the
cells. These were then covered and incubated at 37°C for 3 days after which cell
survival was determined with CellTiter 96 AQueous One Cell Proliferation Assay
57

(Promega). Dose response curves and EC50s were calculated with Prism (GraphPad
Software, Inc).
Glucose consumption assays
Two days after SLIRP and GFP siRNA transfection, SW620 and HT29 cells were
seeded into 24-well plates at 110 x 103 cells per well. 400 μL of fresh media was added,
and cells incubated at 37°C. Media samples were collected every 24 h and glucose
levels assessed using an Accu-Chek Performa (Roche) glucometer.
Cell invasion assays
Two days after SLIRP and GFP siRNA transfection, SW620, HT29 and HT1080 cells
were seeded into QCMTM 24-well Collagen Based Cell Invasion Assays (Chemicon
International) at 2.5 x 10⁵ cells per well. The chemoattractant used was 10% FBS with
invasion normalised to serum free control wells. 24 h post seeding, cells were harvested
and the number invading determined colorimetrically as described by the manufacturer.
3.4 Results
To investigate the mechanistic basis of SLIRP how may function as a tumour
suppressor in CRC, its effects on RARα and Notch signalling, were investigated. Initial
studies using siRNA to decrease SLIRP levels in RA-responsive HT29 cells (Figure
3.2), resulted in an upregulation of RARα and HES1 protein (Figure 3.1A). In
cotransfection studies in HT29 cells that were treated with siRNA to SRA or SLIRP, we
found that depleting SLIRP significantly enhanced RARα reporter activity and this was
augmented with addition of ligand (Figure 3.1B). Depletion of SRA blunted the
58
response to RA and SLIRP depletion, consistent with loss of its coactivation activity
(Figure 3.1B). A similar effect of SLIRP and SRA depletion was observed in
cotransfection studies using a Notch (HES1E-luc) reporter (Figure 3.1C). In addition,
depletion of RARα abolished any effects, confirming its requirement for mediating both
the RA/RARα and Notch reporter activity (Figure 3.1C). To explore the requirement for
the SRA stem-loop bound by SLIRP, we tested wild type and the SDM7 mutant SRA,
as well as a RNA-binding incompetent SLIRP (R24) with both RAR and Notch
reporters. The cotransfection with SDM7 resulted in increased reporter activity (Figure
3.1D) consistent with loss of SLIRP repression of RARα and Notch signalling.
Similarly, transcription of the SRA-binding mutant R24 showed reduced repression
relative to wild type SLIRP for both RARα and HES1 reporters (Figure 3.1D). These
data indicate key roles for both SRA and SLIRP’s RNA binding domain in the
repression of RARα and Notch transcription.
As SOX9 is another downstream mediator of RARα activity and a Notch pathway
member, we also assessed its regulation in response to modulating SLIRP and SRA
expression. As observed for RARα and HES1 (Figure 3.1A), SLIRP ablation resulted in
elevated SOX9 protein levels and SOX9 reporter activity (Figure 3.1A&H). Supporting
these reporter data, SLIRP depletion was associated with an increase in HES1 and
SOX9 mRNA (Figure 3.1E). Depletion of cellular SLIRP led to augmented Notch
signalling in other CRC cells SW620 and HCT116, which was not RA-regulated
(Figure 3.1G). To further study members of the Notch signalling pathway and
downstream target genes, we treated cells with SLIRP siRNA and found LMO2,
NOTCH2, NOTCH3, NFKB1 and NFKB2 were all significantly increased (Figure
3.1E).
59

Modulation of SLIRP and SRA levels have previously been shown to alter NR and
coregulator recruitment at target gene promoters [43]. To investigate whether the
changes observed in reporter assays were associated with altered recruitment of NRs,
coregulators and Notch pathway members, we used ChIP assays in CRC cells. At the
HES1 promoter, which contains RAREs, SLIRP binding was augmented in the presence
of RA and completely abrogated in the absence of SRA (Figure 3.3A&B). On the other
hand RARα binding was augmented with RA and increased further with SLIRP
depletion, whereas binding was blunted significantly with SRA depletion. These data
suggest a key role for SRA in mediating NR and coregulator recruitment at the HES1
promoter and implies SRA is involved in cross-talk across the NR and Notch signalling
pathways.
As HES1 has been shown to negatively regulate its own promoter, we next tested this
system for the effect of the loss of SLIRP. In SLIRP depleted cells there was decreased
binding of HES1 to its own promoter, an effect that was enhanced by loss of SRA.
Moreover these effects were unrelated to RA signalling as addition of RA had no effect
(Figure 3.3D).
To further investigate the effect of SLIRP mechanistically, we assessed its binding to
SOX9 and HES1 promoters by ChIP. SLIRP was actively recruited to the SOX9
promoter in the presence of RA (Figure 3.4A&B, Figure 3.5), and this was SRA-
dependent. In the absence of SLIRP these effects were increased whereas they were
significantly reduced with SRA depletion. The effect of SLIRP on recruitment of SOX9
to the HES1 promoter appeared even more sensitive to SRA depletion as it completely
abrogated the increase seen with loss of SLIRP (Figure 3.4C&D). NCoR showed
greater recruitment to the RAREs in the HES1 and SOX9 promoters, indicating it may
60

also facilitate suppression of RA induced Notch signalling (Figure 3.6). These studies
confirm SLIRP regulates multiple members of the RAR and Notch signalling pathways
at mRNA, protein and promoter level, all working in concert to inhibit signalling to
both pathways via novel cross-talk. In addition these pathways seem very sensitive to
the prevailing SRA level in the cells, indicating a critical role for SRA in mediating
these effects. Taken together these data provide a mechanism by which SLIRP could act
as a tumour suppressor in CRC
Resistance to chemotherapy is a major clinical issue in CRC. As SLIRP depletion leads
to increased Notch signalling activity that is associated with resistance to chemotherapy,
we explored the effect of SLIRP ablation upon the sensitivity of CRC cell lines to
chemotherapeutic agents. The HCT116, SW620 and HT29 cell lines were treated with
SLIRP or GFP specific siRNAs, and the routine CRC chemotherapeutics, 5-
fluorouracil, irinotecan and oxaliplatin (Figure 3.7). HCT116 and SW620 cells showed
a 3-4 fold increase in resistance to irinotecan upon SLIRP ablation, with no difference
observed in HT29 (Figure 3.7A-C). All cell lines were 3-5 fold more resistant to 5-
fluorouracil upon ablation of SLIRP (Figure 3.7D-F). Only HCT116 showed a 3 fold
greater resistance to oxaliplatin with SLIRP ablation (Figure 3.7G-I). These data
suggest loss of SLIRP may be a causal factor of chemotherapy resistance in CRC.
Metastasis is the major cause of death in CRC. As loss of SLIRP promotes Notch
signalling which is associated with increased metastasis, we assessed whether SLIRP
loss can increase the metastatic potential of CRC cells. The HT1080, SW620 and HT29
cell lines were treated with SLIRP or GFP specific siRNAs and their invasiveness
measured using matrigel invasion chambers. Increased invasion was observed in all cell
61

lines upon ablation of SLIRP, consistent with its putative tumour suppressor role
(Figure 3.8A).
In metastatic CRC, increased anaerobic glycolysis is a common aggressive adaption
[104-107]. As loss of SLIRP can promote reduced oxidative phosphorylation, we
assessed the effect of SLIRP ablation on glucose consumption by CRC cell lines
SW620 and HT29. SLIRP ablated cells showed greater uptake of glucose and rapidly
acidified the media, with the phenol red indicator turning yellow (Figure 3.8B). This
suggests that loss of SLIRP could potentially affect the metabolism of CRC cells,
inducing greater glucose consumption.
In an alternative approach to assess SLIRP expression and outcome in CRC, SLIRP
mRNA expression was examined in two CRC cohorts of 74 and 370 patients [156, 157].
This database interrogation found that patients with tumours that highly expressed
SLIRP had greater DFS rates in the three year period following initial surgery (Figure
3.8C). Furthermore, a negative association between SLIRP and HES1 mRNA
expression was observed across the patients (R=-0.22, p<0.0001) consistent with the in
vitro cell data showing that SLIRP is a potent inhibitor of Notch signalling (Figure 3.1).
3.5 Discussion
In this chapter we investigated potential mechanisms by which SLIRP might impact on
CRC growth and invasion. Specifically, SLIRP repressed expression of the Notch
receptors NOTCH2 and NOTCH3, and the NTFs HES1, SOX9, NFKB1, NFKB2 and
LMO2 that major play roles in CRC oncogenesis [109, 110, 117, 118, 126, 166-169].
SLIRP was also shown to repress HES1 via three different mechanisms. The first
62

involved recruitment of SLIRP corepressor complexes to the RAREs present in the
HES1 and SOX9 promoters in response to RA, which was associated with inhibition of
HES1 and SOX9 transcription. In addition there was greater RARα recruitment to the
HES1 and SOX9 promoters’ RAREs upon SLIRP siRNA ablation, consistent with
increased transcription. SRA is required for SLIRP mediated repression, because the
ablation of SRA resulted in loss of SLIRP recruitment, and the SLIRP RRM mutant
demonstrated reduced repression compared to the wild type. The second mechanism,
focused on the effect of SLIRP on the process of HES1 feedback inhibition. HES1
feedback inhibition is dependent on a portion of translated HES1 protein binding to its
own promoter to abrogate further transcription [140]. SLIRP ablated cells showed
decreased binding of HES1 to its own promoter, indicating reduced HES1 feedback
inhibition in the absence of SLIRP. The final mechanism examined the ability of SLIRP
to inhibit the binding of SOX9 to the HES1 promoter, to thereby repress HES1
transcription [70]. SLIRP ablated cells showed greater binding of SOX9 to the HES1
promoter in the presence of RA, indicative of SLIRP repression of HES1 transcription
via SOX9. Taken together, SLIRP may repress HES1 transcription through inhibition of
RARα and SOX9, and augmentation of HES1 feedback inhibition, with SRA an integral
component for SLIRP‘s effects.
As Notch signalling, particularly through HES1 and SOX9, has clinical association with
worse prognosis in cancer, and functional roles in promotion of CRC oncogenesis by
enhancing chemoresistance and metastasis [109, 137, 138, 141], the association of
SLIRP with these processes was further explored clinically and in vitro. Patients with
colorectal tumours that highly expressed SLIRP mRNA, had a greater DFS rate in two
independent cohorts, indicating SLIRP is a marker of favourable prognosis in CRC
[156, 157]. This is consistent with our previous work that showed high SLIRP protein
63

expression in CRC patients associated with a higher survival rate, a reduced incidence
of lymph node (LN) metastasis, and perineural and vascular invasion (Chapter 2).
Furthermore, a negative correlation between SLIRP expression and that of HES1 was
observed in CRC patients, implying SLIRP may innately play a role as an inhibitor of
Notch signalling in the clinical setting.
The association of SLIRP with improved overall and DFS, and its inhibition of
molecules functionally linked to increased chemoresistance, led us to examine in vitro
the effect of SLIRP on the sensitivity of cells to the routine CRC chemotherapeutics, 5-
fluorouracil, oxaliplatin and irinotecan. In all three CRC cell lines tested, siRNA
mediated SLIRP ablation conferred significantly greater resistance to 5-fluorouracil,
with greater resistance to irinotecan observed in HCT116 and SW620 cells and
increased resistance to oxaliplatin evident in only HCT116. The mechanism by which
SLIRP confers greater sensitivity to chemotherapy in these cells may be attributed to the
SLIRP mediated suppression of Notch signalling targets. Specifically, NOTCH2,
NOTCH3, NFKB1, NFKB2 and HES1 transcript levels increased following SLIRP
ablation. These genes have been shown in numerous cancers including CRC, to reduce
apoptosis and the sensitivity of tumours to 5-fluorouracil and platinum based
chemotherapies [109, 166-168, 170-172]. In addition, SLIRP could be acting via its
inhibition of estrogen and vitamin D signalling in CRC cells (Adriana Messineo,
unpublished data). This is of importance, because another potential mechanism of
SLIRP sensitisation to chemotherapy. This is because estrogen receptor signalling has
been linked to increased resistance to chemotherapy in breast, endometrial, bladder and
gastric cancer [173-176] and the vitamin D analogue DD-003 increased the sensitivity
of HT29 cells in vivo [177].
64

Loss of SLIRP promoted invasion of CRC cells in this study. Previously we showed a
higher incidence of LN metastasis in CRC patients with low SLIRP expression in their
colorectal tumour and nonmalignant tissue (Chapter 2). Preliminary results of a CRC
microarray with depletion of SLIRP indicate that the Notch signalling pathway and a
number of genes involved in metastasis are affected (data not shown). Clearly, some of
this effect may be attributed to repression of oncogenic Notch signalling by SLIRP,
which has numerous functional roles to promote CRC metastasis. Furthermore, use of γ-
secretase Notch inhibitors, which reduce HES1 and NF-κB, have been shown to reduce
invasiveness and the rate of recurrence in vivo [178]. Thus at least in part, SLIRP may
be involved in the clinical suppression of metastasis through its role as a Notch
suppressor.
High glucose consumption resulting from anaerobic glycolysis, is a common
accompaniment of in metastatic cells [104-107]. We found that SLIRP ablation
promoted glucose consumption and the production of acidic by-products by CRC cell
lines. Although still a preliminary result, when coupled with SLIRP’s mitochondrial
function, this indicates SLIRP may prove to be a key metabolic factor in CRC cells with
potential involvment in transformation from aerobic to anaerobic tumours (Chapter 2)
[102-107].
In conclusion, this study provides novel insight into SLIRP’s role as a tumour
suppressor by characterising key corepression of the RARα and Notch signalling
pathways. It was fascinating to appreciate how important SRA is for this process.
Furthermore, SLIRP is anti-invasive and its expression helps maintain sensitivity to
standard chemotherapy. These data contribute to build a case to identify modulators of
SLIRP’s activity and may provide a basis for using SLIRP expression in tumours as a
65

biomarker of excellent outcome in this disease. Figure 3.9 is a schematic that outlines
much of the data for this chapter. In particular, it illustrates that SLIRP activity in CRC
as a tumour suppressor are SRA dependent, involve at least the RARα and Notch
signalling pathways and these effects are mediated via the HES1 and SOX9 promoters.
SLIRP is also anti-invasive and regulates glucose consumption in CRC cells which may
modulate CRC metabolism as an additional tumour suppressive effect.
66

Chapter 3: Tables and figures
Table 3.1: Primers Primer Orientation Primer Sequence 5'-3' GAPDH Forward ATGGGGAAGGTGAAGGTCG GAPDH Reverse GGGGTCATTGATGGC AACAATA HES1 Forward ATGGAGAAAAATTCCTCGTCCC HES1 Reverse TTCAGAGCATCCAAAATCAGTGT HES1 promoter RARE site 1 Forward GGGCGAGGAGGGAGAGGCTG HES1 promoter RARE site 1 Reverse CCCGGGCTTCCCCAGGAAAC HES1 promoter SOX9E site 1 Forward AGGTTGCAGGTCAACAAAGG HES1 promoter SOX9E site 1 Reverse CTCCAGTCTGCAACCAAACA HES1 promoter HES1E site 1 Forward CAAGACCAAAGCGGAAAGAA HES1 promoter HES1E site 1 Reverse GGATCCTGTGTGATCCCTAGGC LMO2 Forward GACAAGCGGATTCGTGCCTAT LMO2 Reverse AGTTGATGAGGAGGTATCTGTCA NFKB1 Forward GAAGCACGAATGACAGAGGC NFKB1 Reverse GCTTGGCGGATTAGCTCTTTT NFKB2 Forward ATGGAGAGTTGCTACAACCCA NFKB2 Reverse CTGTTCCACGATCACCAGGTA NOTCH2 Forward CAACCGCAATGGAGGCTATG NOTCH2 Reverse GCGAAGGCACAATCATCAATGTT NOTCH3 Forward TGGCGACCTCACTTACGACT NOTCH3 Reverse CACTGGCAGTTATAGGTGTTGAC SOX9 Forward GCCAGGTGCTCAAAGGCTA SOX9 Reverse TCTCGTTCAGAAGTCTCCAGAG SOX9 promoter RARE site 1 Forward AGGAGCCAGGGAGATGCGCT SOX9 promoter RARE site 1 Reverse AGTGTCCCCATCAAGCCACGG SOX9 promoter RARE site 2 Forward ATGTCTGCCCGATGGTCTCCGA SOX9 promoter RARE site 2 Reverse AGCTTCGTATCCAGGGCTCTGTGA Table 3.1: List of primer pairs used in this study.
67

Figure 3.1: RARα and Notch signalling are regulated by SLIRP Western blot of RARα, HES1, SOX9 and β-actin from retinoic acid (RA) and GFP or SLIRP siRNA treated HT29 cells (A). RARα- and HES1-Luciferase (Luc) activity in GFP, SRA and SLIRP siRNA (B-C), or SRA wild type (wt), SRA stem loop 7 mutant (SDM7), SLIRP wt and SLIRP mutant RNA recognition motif (R24) overexpression vectors (D) transfected HT29 cells with or without (w/wo) RA. HES1E-Luc activity w/wo RA, in GFP and SLIRP siRNA treated HCT116 and SW620 cells (E). SOX9E-Luc activity w/wo RA, in GFP and SLIRP siRNA treated HT29s (F). HT29 mRNA levels of HES1, SOX9, LMO2, NOTCH2, NOTCH3, NFKB1 and NFKB2 w/wo RA and GFP or SLIRP siRNA treatment (G). All results are representative of triplicate experiments; error bars represent standard deviation. *Significant at the <0.05 level (two tailed). **Significant at the <0.01 level (two tailed).]
68

Figure 3.2: (A) SLIRP, SRA or RARα mRNA were ablated by siRNA directed against transcripts. (B) SLIRP protein was ablated by siRNA. (C) SRA mRNA was overexpressed upon addition of SRA wt and stem loop 7 mutant expression vectors as measured by qPCR. (D) SLIRP-FLAG expression indicates successful transfection of SLIRP-FLAG wt and R24,25A mutant vectors. All results are representative of triplicate experiments; error bars represent standard deviation.*Significant at the <0.05 level (two tailed). **Significant at the <0.01 level (two tailed).
69

Figure 3.3: SLIRP, SRA and RARα directly regulate HES1 transcription in HT29 cells. Schematic of RARα response elements in the HES1 promoter and its evaluative QPCR primer pair (A). Chromatin Immunoprecipitation (ChIP) assay, using IgG (control), SLIRP and RARα antibodies to measure the degree of SLIRP and RARα complex recruitment at the HES1 promoter’s retinoic acid response elements (RAREs) using QPCR (B). Schematic of the HES1 binding site in the HES1 promoter and its evaluative QPCR primer pair (C). ChIP assay using IgG and HES1 antibodies to measure the degree of HES1 binding to its own promoter with SLIRP and SRA siRNA ablation (D). All results are representative of triplicate experiments; error bars represent standard deviation.*Significant at the <0.05 level (two tailed). **Significant at the <0.01 level (two tailed).
70

Figure 3.4: SLIRP, SRA and RARα directly regulate SOX9 transcription. (A) Schematic of RARα response elements in the SOX9 promoter and its two evaluative QPCR primer pairs. (B) Chromatin Immunoprecipitation (ChIP) assay, using IgG (control), SLIRP and RARα antibodies to measure the degree of SLIRP and RARα complex recruitment at the SOX9 promoter’s cluster 1 retinoic acid (RA) response elements (RAREs) 1914-723 base pairs upstream of SOX9 exon 1 using QPCR with SRA and SLIRP siRNA ablation and RA. (C) Schematic of the SOX9 response element in the HES1 promoter and its evaluative QPCR primer pair. (D) ChIP assay using IgG and SOX9 antibodies to measure the degree of SOX9 recruitment to its HES1 promoter site and hence its promotion of HES1 transcription with SRA and SLIRP siRNA ablation and RA. All results are representative of triplicate experiments; error bars represent standard deviation.*Significant at the <0.05 level (two tailed). **Significant at the <0.01 level (two tailed).
71

Figure 3.5: Chromatin Immunoprecipitation assay using IgG (control), SLIRP and RARα antibodies to measure the degree of SLIRP and RARα complex recruitment at the SOX9 promoter’s cluster 2 of RARα sites -4914-775 base pairs upstream of SOX9 exon 1 using qPCR. All results are representative of triplicate experiments; error bars represent standard deviation.*Significant at the <0.05 level (two tailed). **Significant at the <0.01 level (two tailed).
72

Figure 3.6: NCoR is recruited to the HES1 and SOX9 promoters with retinoic acid treatment, as measured by Chromatin Immunoprecipitation assay. This used IgG (control) and NCoR antibodies to measure the degree of NCoR complex recruitment at the RARα response element cluster in the HES1 promoter (A) and the SOX9 promoter’s two clusters, 1 (B) and 2 (C), using QPCR. All results are representative of triplicate experiments; error bars represent standard deviation.*Significant at the <0.05 level (two tailed).
73

Figure 3.7: SLIRP siRNA ablation in cancer cells caused resistance to irinotecan, 5-fluorouracil and oxaliplatin. (A) HCT116 cells treated with irinotecan. (B) SW620 cells treated with irinotecan. (C) HT29 cells treated with irinotecan. (D) HCT116 cells treated with 5-fluorouracil. (E) SW620 cells treated with 5-fluorouracil. (F) HT29 cells treated with 5-fluorouracil. (G) HCT116 cells treated with oxaliplatin. (H) SW620 cells treated with oxaliplatin. (I) HT29 cells treated with oxaliplatin.
74

Figure 3.8: SLIRP’s effects on invasion and glucose consumption, and associations with survival Collagen coated invasion chambers demonstrated an increased invasiveness of cancer cells with SLIRP siRNA ablation compared with GFP siRNA treatment (A). Glucose consumption was increased in HT29 cells with SLIRP siRNA ablation (B). High tumour SLIRP mRNA expression in two independent CRC patient cohorts, correlated with a lower relative risk (RR) of cancer relapse, depicted as a forest plot with 95% confidence intervals (95% CI) (C). All results are representative of triplicate experiments; error bars represent standard deviation.*Significant at the <0.05 level (two tailed). **Significant at the <0.01 level (two tailed).
75

Figure 3.9: Summary diagram of SLIRP’s actions in CRC. SLIRP expression correlates with higher survival and reduced relapse, and, in vitro, represses RARα and Notch signalling, and is associated with reduced CRC invasion, glucose consumption and resistance to chemotherapy.
76

Chapter 4: Notch signalling shows prognostic value in colorectal cancer survival and 5-flurouracil
response rates
77

4.1 Abstract The expression of Notch-induced transcription factors (NTFs) HEY1, HES1 and SOX9
were evaluated in colorectal cancer (CRC) patients to determine their clinicopathologic
and prognostic significance. Levels of HEY1, HES1 and SOX9 protein were measured
by immunohistochemistry in a nonmalignant and malignant tissue microarray of 441
CRC patients, and findings correlated to pathologic, molecular and clinical variables.
The NTFs HEY1, HES1 and SOX9 were overexpressed in tumours relative to colonic
mucosa (ORs 3.40, p<0.0001; 7.42, p<0.0001; 4.01 p<0.0001 respectively). HEY1
overexpression was a negative prognostic factor for all CRC patients (HR 1.29,
p=0.023) and strongly correlated with perineural and vascular invasion and lymph node
(LN) metastasis. In 5-fluorouracil (5-FU) treated patients, the tumour overexpression of
SOX9 correlated with markedly poorer survival (HR 8.72, p=0.034), but had no
predictive effect in untreated patients (HR 0.70, p=0.29). When HEY1, HES1 and
SOX9 expression were combined to predict survival with chemotherapy, in treated
patients there was an additive increase in risk of death with each NTF overexpressed
(HR 1.94, p=0.019), but no prognostic import in the untreated patient group (HR 0.74,
p=0.19). The present study is the first to discover HEY1 overexpression correlates with
poorer outcome in CRC, and NTF expression is predictive of CRC patient survival with
5-FU chemotherapy. If confirmed in future studies, testing of NTF expression has the
potential to help select patients to undergo chemotherapy alone or in combination with
Notch inhibitors.
78

4.2 Introduction
CRC is the third most common tumour and the second highest cause of cancer death in
the Western world [4]. CRC may be categorised, based on its site of emergence into
proximal colonic, distal colonic or rectal carcinoma, each with distinct demographic,
risk factors, molecular and pathological markers, and clinical outcomes [7]. Aberrant
Notch signalling has been implicated in chemotherapy treatment resistance [116-118].
In the malignant state, Notch signalling promotes epithelial to mesenchymal transition
(EMT), chemoresistance, proliferation and metastasis, and activates key CRC related
pathways, such as COX2, NF- B and Wnt signalling [108-111]. Numerous approaches
for silencing Notch signalling have been explored, with gamma-secretase inhibitors
(GSIs) and siRNAs showing most promise [119, 120]. Many new specific Notch
inhibitors are under development, with 23 phase I/II clinical trials investigating the
efficacy of GSIs ongoing (www.clinicaltrials.gov). However, enthusiasm regarding the
successes with in vitro and xenograft models has been tempered by the lack of efficacy
as single agent therapy in CRC as well as significant mucosal toxicity [121, 122].
Treatment in concert with chemotherapy shows promise in the preclinical setting but
remains unexplored in patients. Thus, there is a need to better understand the intricacies
of Notch signalling effectors to better guide the future development and application of
Notch inhibitors.
If predictive or prognostic factors do exist within this pathway, the downstream
effectors of Notch activation, the Notch-induced transcription factors (NTFs), in
particular HEY1, HES1 and SOX9 are appropriate candidates for further study and the
focus of this investigation. Upon Notch activation, there is an increase in expression of
HEY1, HES1 and SOX9, which consequently accumulate in the nucleus, leading to the
79

transcriptional regulation of downstream targets [124-126]. HEY1 has roles in cardiac
embryology, osteogenesis and neurogenesis [127-130]. It is a mediator of Notch
signalling in cancer, through regulation of differentiation, tumour suppressor P53
activity, androgen receptor signalling and TGF-β dependent EMT [131, 132]. In neural
stem cells HEY1 promotes proliferation, while its overexpression in glioblastomas
correlates with higher tumour grade and poorer patient survival [133]. To date, HEY1
tumour expression has not been studied in CRC patients. HES1, acts as either oncogene
or tumour suppressor, depending on the tumour context. Implicated mechanisms include
regulation of proliferation, EMT, metastasis and chemoresistance [109, 134-137].
Clinical studies of HES1 overexpression in cancer have shown poorer prognosis in
ovarian malignancy, either no impact or a modest trend to poorer overall survival in two
small CRC cohorts and no prognostic association in biliary tract cancer [24, 138, 139].
SOX9 directly promotes HES1 expression, has a critical role in embryogenesis and is
required for development, differentiation and lineage commitment in numerous tissues
including the intestinal epithelium [70, 141]. In cancer, SOX9 regulates proliferation,
differentiation and metastasis [141, 142]. Clinical studies in breast, gastric biliary tract
and colorectal cancer, indicate poorer prognosis with tumour SOX9 overexpression
[139, 141, 143, 144]. Hence, considering the mechanistic evidence of roles for HEY1,
HES1 and SOX9 in cancer pathogenesis and the preclinical data implicating Notch
signalling chemotherapy responsiveness, we set out to characterise expression of these
NTFs in CRC and to explore a potential role in chemotherapy resistance. To this end,
this study seeks to determine the prognostic, predictive and clinicopathologic
significance of these NTFs and their consequent suitability as biomarkers in
determining which patients will benefit most from Notch inhibitor therapy using a CRC
tissue microarray (TMA).
80

4.3 Materials and methods
Study populations
Colorectal tissues were collected between 1990 and 1999 from CRC patients
undergoing surgery at Sir Charles Gairdner Hospital (SCGH), Western Australia.
Information on patient demographics and tumour features were obtained from SCGH
medical records and previous studies of this cohort [1, 148, 179]. Tumour site was
classified as proximal to and including, or distal to the splenic flexure, until the rectum
that was classified as rectal. Samples from a total of 280 patients with AJCC stage II
(48% male) and 161 patients with stage III CRC (49% male) were stained for HEY1,
HES1 and SOX9 protein expression (n=441). Information on tumour stage, anatomic
site, histologic grade, vascular invasion, perineural invasion, 5-flourouracil (5-FU)
chemotherapy, microsatellite instability (MSI), β-catenin, COX2, P53, MLH1 and
SFRP4 was available. Information on disease-specific survival was obtained from the
Cancer Registry of Western Australia. 5-fluorouracil chemotherapy included either
folinic acid for 6 cycles or levamisole for 12 cycles, each of four weeks duration. All
patients were treated prior to neoadjuvant therapy became the standard of care. The
median follow-up time was 69.7 months for patients with AJCC stage II disease and
52.4 months for patients with stage III disease. At the end of the study period, 31% of
patients had died as a result of disease recurrence and 25% had died from unrelated
causes. Ethics approval for this study was obtained from the Royal Perth Hospital
Human Research Ethics Committee.
81

Colorectal tissues were collected between 1990 and 1999 from 1056 consenting CRC
patients undergoing surgery at Sir Charles Gairdner Hospital (SCGH), Western
Australia. Information on patient demographics and tumour features were obtained from
SCGH medical records and previous studies of this cohort [1, 148, 179]. Tumour site
was classified as ‘rectal’ when in the rectum, ‘distal’ when occurring between the
proximal rectal margin and the splenic flexure and ‘proximal’ when proximal to and
within the splenic flexure. Samples from a total of 280 patients with AJCC stage II
(48% male, 52% female) and 161 patients with stage III CRC (49% male, 51% female)
were stained for HEY1, HES1 and SOX9 protein expression (n=441). Information on
tumour stage, anatomic site, histologic grade, vascular invasion, perineural invasion, 5-
flourouracil (5-FU) chemotherapy, microsatellite instability (MSI) determined by BAT-
26 marker, β-catenin, COX2, P53, MLH1 and SFRP4 was available. Information on
disease-specific survival was obtained from the Cancer Registry of Western Australia.
The great majority of cases received 5-fluorouracil chemotherapy including folinic acid
for 6 cycles, with a minority of older cases receiving 5-fluorouracil chemotherapy
including levamisole for 12 cycles, each of four weeks duration. All rectal cancer
patients were treated prior to the introduction of neoadjuvant therapy as the standard of
care for local advanced disease. The median follow-up time was 69.7 months for
patients with AJCC stage II disease and 52.4 months for patients with stage III disease.
At the end of the study period, 31% of patients had died as a result of disease recurrence
and 25% had died from unrelated causes. Ethics approval for this study was obtained
from the Royal Perth Hospital Human Research Ethics Committee.
82

Tissue microarray
The TMA was constructed as described previously [148]. The array comprised 441
surgically resected cases within 7 TMA blocks. For each case, two cores of 1 mm
diameter were taken at random from tumour tissue, and an additional 1-mm diameter
core was taken from histologically normal colonic mucosa.
Immunohistochemistry
Sections were deparaffinized through 3 changes of xylene (3 minutes), rehydrated
through graded alcohols to distilled water and subjected to antigen retrieval in EDTA
pH 8.0 under pressure. After blocking endogenous peroxide activity with hydrogen
peroxide (HRP), either SOX9 (SC-20095, Santa Cruz, 1:75), HES1 (AB5702,
Millipore, 1:3000) or HEY1 (AB22614, Abcam, 1:75) antibody was applied for 60 min.
Dako Envision+ Dual link s–HRystemP was then applied for 30 min incubation.
Sections were visualised with diaminobenzidine (DAKO) followed by a light
counterstain of haematoxylin.
TMA Scoring
Three authors independently scored the density of HEY1, HES1 and SOX9 staining
across the cores, and ranked them based on intensity using a scale from 0 to 3 (0, no
expression; 1, weak expression, 2, intermediate expression; 3, strong expression)
(Figure 4.1A&B). Individual investigator scores were equivalent to the automated
scoring of NTF expression in TMA slides performed with ImageScope (Aperio).
Analysed data was either semi-ordinal consisting of densities ranging 0 to 3, in 0.25
increments, as used in Cox regressions, or defined as dichotomous, with scores equal to
or less than 1.5, as low and those greater than 1.5, as high, as used in Kaplan Meier
83

curves. This cut-point was chosen, because it easily distinguished patients based on
NTF expression into high and low expressing groups.
Data analysis Bivariate associations of each NTF with patient clinical and pathologic characteristics
were estimated using Spearman’s rho because of the ordinal scale of NTF expression.
The Kaplan-Meier survivor function was used to generate survival curves and the log-
rank test was used for univariate tests of survival. Cox’s proportional hazards models
were used to examine associations of NTFs and other variables with survival with ties
being addressed using Efron’s method. Harrell’s C statistic was used to estimate
concordance for each independent variable [149]. Age and gender adjusted estimates
were used to avoid confounding by these variables and stratification was used to control
confounding by tumour site and AJCC stage. The validity of the proportional hazards
assumption was assessed using the scaled Schoenfeld residuals as described by
Grambsch and Therneau [150]. All statistical tests were two-tailed and an alpha
probability less that 0.05 was regarded as statistically significant. The analysis was
conducted using Stata Version 12 (Stata-Corp LP, College Station, TX) and the ‘rms’
package of R [151].
4.4 Results
NTF protein expression
The normal and malignant colorectal tissues from 280 AJCC stage II and 161 AJCC
stage III CRC patients were analysed for HEY1, HES1 and SOX9 protein expression.
Distributions of protein expression are shown in Figure 4.1. In normal colonic
epithelium, HEY1, and HES1 were highly expressed towards the bowel luminal surface,
84

with expression reducing to none towards the base of the crypt. Conversely, SOX9 was
predominantly expressed in basal crypt cells with weaker expression evident towards
the bowel luminal surface. SOX9 expression was predominantly nuclear with weak
cytoplasmic staining in malignant and nonmalignant tissue. HES1 showed both a
nuclear and cytoplasmic localisation, and HEY1 was predominantly expressed in the
cytoplasm of patients. Expression data for each NTF had a log-normal distribution by
Shapiro-Wilks tests. The expressions of HEY1, HES1 and SOX9 were significantly
elevated in malignant relative to normal tissues (ORs 3.44, p<0.0001, 7.40, p<0.0001,
4.08 p<0.0001, respectively) (Table 4.1). The total percentage of patients with tumours
classed as having overexpressed HEY1, HES1 and SOX9 was 61 %, 68 % and 60 %
respectively.
NTF associations
Correlations between NTFs and clinicopathologic and molecular features are listed in
Table 4.2. NTFs showed significant coexpression across the CRC patients’ malignant
and nonmalignant tissues. High HEY1 tumour expression correlated significantly with
elevated levels of HES1 (rho 0.382, p<0.005) and SOX9 (rho 0.190, p<0.005) in
malignant tissue and HEY1 (rho 0.241, p<0.005) and SOX9 (rho 0.149, p<0.05) in
nonmalignant tissue. In addition, HEY1 overexpression strongly correlated with higher
stage (rho 0.221, p<0.005), LN metastasis (rho 0.255, p<0.005), overexpression of the
proinflammatory prostaglandin synthase COX2 (rho 0.287, p<0.005), DNA mismatch
repair protein MLH1 (rho 0.136, p<0.05), the apoptotic inducer SFRP4 (rho 0.102,
p<0.05), the CRC oncogene β-catenin (rho 0.166, p<0.005), vascular (rho 0.134,
p<0.05) and perineural (rho 0.160, p<0.05) invasion, and inversely correlated with MSI
(rho -0.106, p<0.05). SOX9 overexpression in tumours correlated with vascular
invasion (rho 0.123, p<0.05), and high expression of HES1 (rho 0.190, p<0.005) and
85

SOX9 (rho 0.190, p<0.005) in malignant tissue and SOX9 (rho 0.304, p<0.005) in
nonmalignant tissue. Elevated HES1 expression in tumours correlated with
overexpression of the critical tumour suppressor P53 (rho 0.101, p<0.05), HEY1 (rho
0.382, p<0.005), SOX9 (rho 0.190, p<0.005), SFRP4 (rho 0.128, p<0.05) and β-catenin
(rho 0.238, p<0.005) in malignant tissue, and HEY1 (rho 0.235, p<0.005) and HES1
(rho 0.130, p<0.05) in nonmalignant tissue (Table 4.2). Overexpression of NTFs was
not associated with tumour site, patient age or tumour differentiation.
Survival analyses
Cox regression of clinicopathologic and molecular features stratified by tumour site are
shown in Table 4.3. Across all patients, tumour overexpression of HEY1 correlated with
poorer prognosis (HR 1.29, p=0.023). In contrast elevated HES1 and SOX9 expression
were not significantly associated with overall survival (HRs 1.05, p=0.607 and 1.14,
p=0.205 respectively). In this cohort, overexpression of COX2, LN metastasis and
AJCC stage III predicted reduced survival, whereas overexpression of β-catenin and
MSI predicted higher survival (Table 4.3).
Patient outcomes were next stratified by tumour site and AJCC stage and related to
HEY1, HES1 and SOX9 protein expression (Table 4.4). Overexpression of NTF HEY1,
HES1 or SOX9 was predictive of reduced survival in stage III (HRs 1.34, p=0.007;
1.23, p=0.037; 1.29, p=0.022 respectively), but not stage II CRC cases (HRs 1.05,
p=0.73; 0.98, p=0.82; 1.02, p=0.83 respectively).
A major factor that affects survival and its prediction by NTF tumour expression, in
stage III, but not stage II CRC, is the effectiveness of adjuvant chemotherapy.
Consistent with clinical practice at the time, a proportion of stage III CRC cases
received chemotherapy, but no stage II CRC cases did. As activation of Notch 86

signalling has been associated with chemotherapy resistance [116-118], we investigated
whether tumour overexpression of NTFs predicted reduced survival in chemotherapy
treated patients. As shown in Figure 4.2, stage III CRC patients with tumour
overexpression of SOX9 had poorer survival with 5-FU treatment, relative to those with
low SOX9 (HR 8.72, p=0.034) over a 10 year period. A similar trend towards reduced
survival was observed for patients with tumour overexpression of HEY1 or HES1
treated with chemotherapy, but this was not significant (HR 2.07, p=0.14; HR 2.07,
p=0.14 respectively). In untreated patients, tumour overexpression of HEY1, HES1 or
SOX9 did not correlate with poorer prognosis (HR 1.08, p=0.79; HR 0.66 p=0.16; HR
0.70 p=0.29 respectively) (Figure 4.2).
The prognoses of chemotherapy treated and untreated stage III CRC patients were then
predicted using the collective immunoreactivities of HEY1, HES1 and SOX9 (Figure
4.3). In the 61 chemotherapy treated patients, there was an additive increase in the risk
of death for each NTF highly expressed in tumours (HR 1.94, p=0.019). The 95 patients
not treated with chemotherapy, had a nonsignificant trend towards reduced risk of death
with overexpression of NTFs (HR 0.74, p=0.19).
4.5 Discussion
Through our evaluation of SLIRP as a tumour suppressor we conducted extensive
studies involving the Notch signalling pathway. That experience prompted this
exploratory study which is the first study to compare the interrelationships of HEY1,
HES1 and SOX9 in CRC. We have established these three NTFs are significantly
coexpressed, which is attributable to their mutual transcriptional activation by Notch
signalling, and SOX9’s transcriptional activation of HES1 [70, 121, 124, 125]. All three 87

proteins are upregulated between 3-7 fold in CRC compared to colonic epithelium. The
upregulation of HES1 and SOX9 in tumours has been observed previously, whereas
HEY1 has not been studied [24, 141].
Tumour SOX9, and the combination of HEY1, HES1 and SOX9 protein overexpression
were predictive of a significantly poorer response to chemotherapy in stage III CRC
patients. Previous studies of these NTFs have never explored chemoresponse, and there
exist no reports of proteins giving predictive data of this significance for adjuvant
chemotherapy in CRC [123, 138, 141, 180, 181]. At the time of the generation of the
CRC TMA, adjuvant chemotherapy was given for stage III but not stage II disease,
allowing the reduced effectiveness of chemotherapy observed with NTF overexpression,
to exert selective survival pressure. More recently 5-FU and oxaliplatin combinations
have become standard of care in CRC stage III, as well as a proportion of stage II and
IV patients, making the prediction of chemotherapy effectiveness by NTFs increasingly
relevant to contemporary clinical care [30]. Furthermore, the expression of NTFs may
be capable of predicting survival of patients with other cancers that are treated with 5-
FU, and hence could be studied in lung, breast, liver, stomach, oesophageal and head
and neck cancer [182]. Tumour NTF expression also has potential to guide the use of
Notch inhibitory therapy, alone or in combination with chemotherapy to increase their
benefit to patients. Hence, assuming confirmation in a larger study, the uniqueness of
this data for prognostication of adjuvant chemotherapy could see its integration towards
regular use in clinical practice.
Notch signalling has been implicated in chemoresistance at the preclinical level [116-
118]. In CRC cells, 5-FU, oxaliplatin and irinotecan induced chemoresistance is
promoted by NTFs, such as HES1, and abrogated using Notch inhibitory therapy [109].
88

Coupled with the functional roles of NTFs in apoptotic resistance and EMT [108-111,
134-137, 141, 142], and the associations of NTF overexpression in this study with
markedly poorer survival in chemotherapy treated patients, further studies are required
to explore the clinical benefit of using combinations of Notch inhibitors with
chemotherapy [119, 120]. In addition, the clinical limitations caused by the toxicity of
existing Notch inhibitors that target upstream parts of the Notch signalling pathway
[121, 122], may be mitigated by the more targeted therapeutic inhibition of downstream
NTFs.
HEY1 overexpression was correlated with greater incidence of LN metastasis,
perineural and vascular invasion, and poorer survival accentuated in stage III CRC
patients. These findings are consistent with previous studies of HEY1 in glioblastoma
and pancreatic cancer [133, 181]. This may be related to HEY1’s clinical associations
with increased risk of LN metastasis and mortality, due to its promotion of proliferation
and EMT in tumours [131-133]. In addition, HEY1 overexpression was tightly linked to
COX2 expression. COX2 drives angiogenesis, inflammation and associated with
reduced survival [183, 184]. HEY1 expression also correlated with Wnt pathway
members β-catenin and SFRP4, an association attributable to Notch signalling’s
activation of the Wnt signalling pathway [108]. Interestingly, HEY1 overexpression
was associated with high levels of DNA repair protein MLH1, which reduces the
incidence of MSI tumours. HEY1 inversely correlated with tumours that have MSI,
which has never been reported previously. This may be due to Notch signalling being
more active in tumours with reduced MSI [108, 185].
HES1 overexpression in tumours correlated significantly with inferior survival in stage
III CRC, consistent with trends seen in smaller CRC cohorts [24, 139]. This association
89

was confined to 5-FU treated patients. HES1 overexpression also correlated strongly
with β-catenin’s expression [108]. The association between tumour overexpressions of
HES1 and the master tumour suppressor P53, may be attributed to transcriptional
activation of P53 by HES1 [186].
SOX9 overexpression in tumours was the strongest predictor of reduced survival in 5-
FU treated patients (HR 8.72, P=0.034) and correlated with vascular invasion.
Previously, increased mortality associated with elevated SOX9, has been observed in
numerous cancers, including separate cohorts of colon and rectal cancer [139, 141, 143,
144]. Many studies report mechanistic roles for SOX9 in cancer promotion, specifically
in apoptotic resistance, neoplastic transformation and proliferation in glioma, colorectal
and prostate cancer [141, 142]. However, this is the first study to demonstrate value for
SOX9 as a biomarker in prediction of response to 5-FU treatment.
The most important limitation of this study is the lack of randomised chemotherapy,
making any comparison between treated and untreated patients confounded by selection
bias. In general patients not receiving treatment were perceived as either at lower risk of
relapse or were considered unfit for therapy. Performance status data which might have
allowed a degree of compensation for the latter factor was not available. Hence our
analyses of chemoresponse have both been performed within and not between cohorts
defined by receipt of therapy.
In conclusion, the present study is the first to discover tumour HEY1 overexpression
correlates with poorer CRC outcome, and NTFs may have value as biomarkers for
prediction of survival with 5-FU chemotherapy treatment. If confirmed these NTFs, in
particular SOX9, have the potential to enter clinical practice to help define who would
90

receive adjuvant chemotherapy. Furthermore, as there are mechanistic roles for these
NTFs in CRC chemoresistance and metastasis, some of which have been explored in
Chapter 3, additional studies should be pursued to explore whether patients
overexpressing these NTFs may benefit preferentially from Notch targeted therapies in
conjunction with conventional chemotherapy.
91

Chapter 4: Tables and figures Table 4.1: Comparison of the mean densities of HEY1, HES1 and SOX9 in colonic mucosa and
colorectal cancer tissues
Normal Tumour Marker n Density (cells/mm2) n Density (cells/mm2) T/N P HEY1 304 108 395 368 3.44 <0.0001 SOX9 301 89 392 363 4.08 <0.0001 HES1 300 55 392 407 7.40 <0.0001
Table 4.1: Mean density of the Notch transcription factors HEY1, SOX9 and HES1 in normal colonic mucosa and colorectal cancer tissues Abbreviation: n, number of patients, T/N, tumour/normal ratio
92
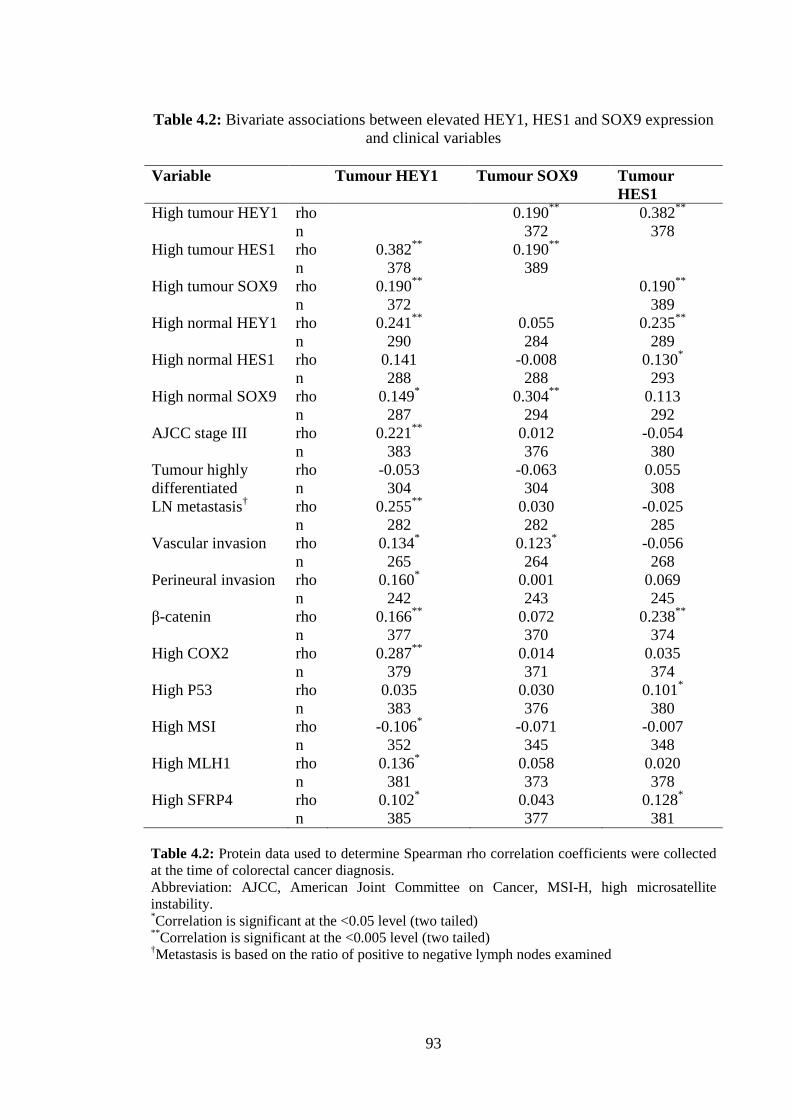
Table 4.2: Bivariate associations between elevated HEY1, HES1 and SOX9 expression
and clinical variables
Variable Tumour HEY1 Tumour SOX9 Tumour HES1
High tumour HEY1 rho 0.190** 0.382** n 372 378 High tumour HES1 rho 0.382** 0.190** n 378 389 High tumour SOX9 rho 0.190** 0.190** n 372 389 High normal HEY1 rho 0.241** 0.055 0.235** n 290 284 289 High normal HES1 rho 0.141 -0.008 0.130* n 288 288 293 High normal SOX9 rho 0.149* 0.304** 0.113 n 287 294 292 AJCC stage III rho 0.221** 0.012 -0.054 n 383 376 380 Tumour highly rho -0.053 -0.063 0.055 differentiated n 304 304 308 LN metastasis† rho 0.255** 0.030 -0.025 n 282 282 285 Vascular invasion rho 0.134* 0.123* -0.056 n 265 264 268 Perineural invasion rho 0.160* 0.001 0.069 n 242 243 245 β-catenin rho 0.166** 0.072 0.238** n 377 370 374 High COX2 rho 0.287** 0.014 0.035 n 379 371 374 High P53 rho 0.035 0.030 0.101* n 383 376 380 High MSI rho -0.106* -0.071 -0.007 n 352 345 348 High MLH1 rho 0.136* 0.058 0.020 n 381 373 378 High SFRP4 rho 0.102* 0.043 0.128* n 385 377 381 Table 4.2: Protein data used to determine Spearman rho correlation coefficients were collected at the time of colorectal cancer diagnosis. Abbreviation: AJCC, American Joint Committee on Cancer, MSI-H, high microsatellite instability. *Correlation is significant at the <0.05 level (two tailed) **Correlation is significant at the <0.005 level (two tailed) †Metastasis is based on the ratio of positive to negative lymph nodes examined
93
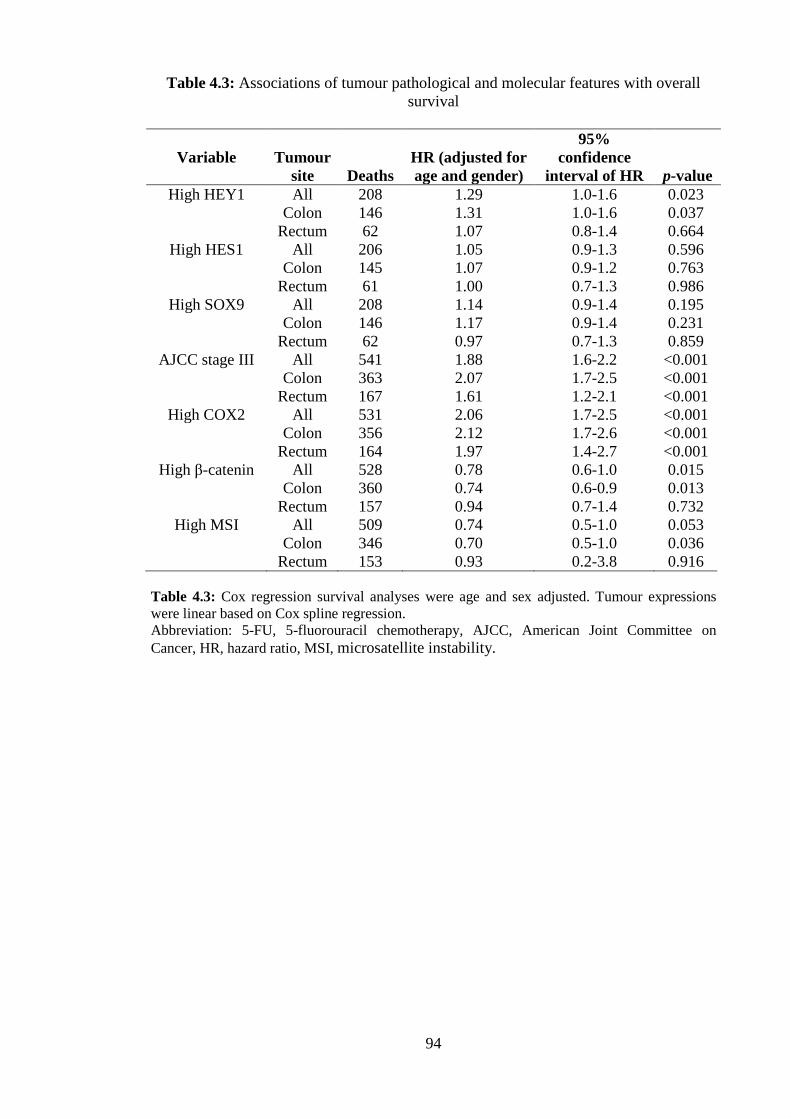
Table 4.3: Associations of tumour pathological and molecular features with overall survival
Variable Tumour site Deaths
HR (adjusted for age and gender)
95% confidence
interval of HR p-value High HEY1 All 208 1.29 1.0-1.6 0.023
Colon 146 1.31 1.0-1.6 0.037 Rectum 62 1.07 0.8-1.4 0.664
High HES1 All 206 1.05 0.9-1.3 0.596 Colon 145 1.07 0.9-1.2 0.763 Rectum 61 1.00 0.7-1.3 0.986
High SOX9 All 208 1.14 0.9-1.4 0.195 Colon 146 1.17 0.9-1.4 0.231 Rectum 62 0.97 0.7-1.3 0.859
AJCC stage III All 541 1.88 1.6-2.2 <0.001 Colon 363 2.07 1.7-2.5 <0.001
Rectum 167 1.61 1.2-2.1 <0.001 High COX2 All 531 2.06 1.7-2.5 <0.001
Colon 356 2.12 1.7-2.6 <0.001 Rectum 164 1.97 1.4-2.7 <0.001
High β-catenin All 528 0.78 0.6-1.0 0.015 Colon 360 0.74 0.6-0.9 0.013 Rectum 157 0.94 0.7-1.4 0.732
High MSI
All 509 0.74 0.5-1.0 0.053 Colon 346 0.70 0.5-1.0 0.036
Rectum 153 0.93 0.2-3.8 0.916 Table 4.3: Cox regression survival analyses were age and sex adjusted. Tumour expressions were linear based on Cox spline regression. Abbreviation: 5-FU, 5-fluorouracil chemotherapy, AJCC, American Joint Committee on Cancer, HR, hazard ratio, MSI, microsatellite instability.
94
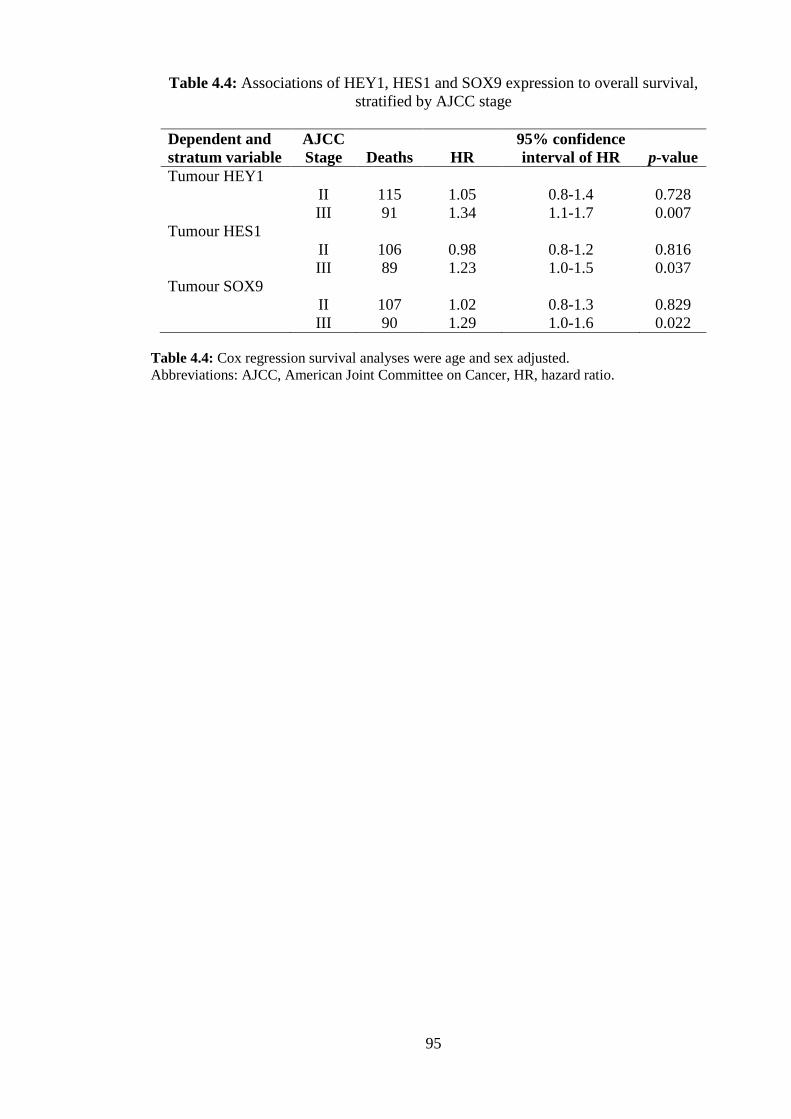
Table 4.4: Associations of HEY1, HES1 and SOX9 expression to overall survival, stratified by AJCC stage
Dependent and stratum variable
AJCC Stage Deaths HR
95% confidence interval of HR p-value
Tumour HEY1 II 115 1.05 0.8-1.4 0.728 III 91 1.34 1.1-1.7 0.007
Tumour HES1 II 106 0.98 0.8-1.2 0.816 III 89 1.23 1.0-1.5 0.037
Tumour SOX9 II 107 1.02 0.8-1.3 0.829 III 90 1.29 1.0-1.6 0.022
Table 4.4: Cox regression survival analyses were age and sex adjusted. Abbreviations: AJCC, American Joint Committee on Cancer, HR, hazard ratio.
95

Figure 4.1: Colorectal tissue immunostained for HES1, HEY1 and SOX9. Bars, 50 μM. A, HES1 staining in nonmalignant tissue. B, HEY1 staining in nonmalignant tissue. C, SOX9 staining in nonmalignant tissue. D, HES1 staining in tumour tissue. E, HEY1 staining in tumour tissue. F, SOX9 staining in tumour tissue.
96

Figure 4.2: Survival curves for AJCC stage III colorectal cancer patients that were chemotherapy treated based on tumour expression levels of HEY1 (A), HES1 (B) or SOX9 (C), or untreated based on tumour expression levels of HEY1 (D), HES1 (F) or SOX9 (E), grouped as high (> 1.5) or low (≤ 1.5) by immunoreactivity. Abbreviations: AJCC, American Joint Committee on Cancer, HR, hazard ratio.
97

Figure 4.3: Multivariable survival curves for stage III colorectal cancer patients, treated (A) or not treated (B) with 5-fluorouracil, based on a combination of tumour HEY1, HES1 and SOX9 expression levels, grouped as high (> 1.5) or low (≤ 1.5) by immunoreactivity. Abbreviations: HR, hazard ratio, NTF, Notch-induced transcription factor.
98

Chapter 5: Discussion & Conclusions
99

5.1 Discussion overview
My goal in this thesis was to investigate if SLIRP played a role in CRC and if so, to
begin to characterize its functional effects on specific pathways, namely NR and Notch
signalling. The data did in fact show SLIRP is a potent tumour suppressor of the RARα
and Notch pathways, acting at the transcriptional level and associated with anti-invasion
and chemosensitivity properties. Logical extension led into evaluation of NTFs and we
found them to be potentially important as biomarker of response to therapy.
The data in Chapter 2 showed the potential for SLIRP as a biomarker for prediction of
prognosis and determination of chemotherapy treatment in AJCC stage II disease. In
addition, SLIRP expression showed a tumour suppressor phenotype in its associations
with important clinical, pathological and molecular variables.
In Chapter 3, the mechanisms by which SLIRP might function as a tumour suppressor
were explored. SLIRP suppressed RARα and Notch signalling, was associated with
greater sensitivity to chemotherapy and reduced invasion of CRC cells in vitro.
In Chapter 4, a thorough investigation of the predictive and prognostic significance of
the NTFs repressed by SLIRP, HES1 and SOX9, in addition to NTF HEY1, was
presented. NTF expression was associated with a poor prognosis and showed potential
for improving patient selection for chemotherapy and Notch inhibitor treatment in CRC.
In this final Chapter, I will discuss the implications of these findings, which highlight
the importance of both SLIRP and Notch signalling in CRC in the broader scientific and
100

clinical context, and emphasize how this thesis provides a foundation for further studies
on SLIRP and SRA and reinforces the importance of Notch signalling in CRC.
5.2 SLIRP has a tumour suppressor phenotype in CRC and regulates cross-talk between the retinoic acid and Notch signalling pathways
Prior to this study, SLIRP was a known SRA-binding protein that repressed the activity
of numerous NR pathways in HeLa cells, however its role in CRC and RARα signalling
was unknown [43]. We assessed SLIRP protein in a well-studied CRC tissue microarray
of 975 patients, in addition to two independent CRC cohorts at the mRNA level. These
investigations revealed SLIRP to be a tumour suppressor with reduced expression in
primary CRC biopsies from patients with LN positive disease (OR 0.49, p<0.0001)
while its elevated expression was associated with a higher eight year survival (HR 0.66,
p=0.001). Interestingly, SLIRP expression was greatly reduced in nonmalignant
colorectal tissue from LN positive cases relative to negative ones (OR 0.16, p<0.0001).
Furthermore, SLIRP nonmalignant tissue expression was just as predictive of patient
outcome as tumour SLIRP (HR 0.67, p=0.007). This remarkable finding may indicate
the prevailing colonic epithelial SLIRP levels help determine risk of CRC development.
High SLIRP expression correlated inversely with the poor prognostic indicators COX-2
and vascular and lymphatic invasion, and positively with the good indicators elevated β-
catenin, SFRP4, P53 and MLH1 expression. High tumour levels of SLIRP mRNA also
correlated with reduced relapse in CRC patients (RR 0.39, p<0.05).
Functionally, in a range of CRC cells, SLIRP was shown to be an SRA-dependent
repressor of both RARα and Notch signalling, downregulating multiple downstream
targets, including HES1, SOX9, NOTCH2, NOTCH3, NFKB1, NFKB2 and LMO2 that 101

play major roles in brain, colon, gastric, ovarian and T-cell oncogenesis [109, 110, 117,
118, 126, 166-169]. SLIRP repression of HES1 and SOX9 was associated with greater
binding to their promoters, while SRA depletion had the opposite effect. In addition,
SLIRP depleted CRC cells were more invasive and resistant to chemotherapy.
Collectively, these data indicate that SLIRP is a tumour suppressor in human CRC,
participates in SRA-dependent NR-Notch signalling cross-talk by suppressing the
RARα and HES1 pathways, and has potential as both a biomarker and therapeutic
target.
Although other NR coregulators have been examined in CRC, few have been studied as
extensively as the work presented herein. Prior contributions in this area have focused
predominantly on the NRs, rather than NR coregulators. Thus, these findings
significantly expand our understanding of NR coregulators in this disease and RNA-
binding NR coregulators in general.
5.3 SLIRP biomarker potential in CRC
Identification of SLIRP as a predictor of CRC prognosis and chemoresponsiveness is
intriguing. This finding, if replicated in other cohorts, could be capitalised on to
improve clinical approaches to treating CRC in a number of ways. First relates to
biomarkers for determination of CRC patient prognosis and individualised treatment
[187]. In CRC, biomarkers are required to identify the LN negative patients most at risk
of subsequent relapse and metastases following surgery, so they may be selected for
chemotherapy and targeted therapies [33]. Under current treatment regimens, LN
negative patients do not routinely receive adjuvant chemotherapy, unless they present
102

with colon obstruction, or tumours with high MSI, low differentiation and/or vascular
and perineural invasion [28, 31-33]. The approach is based on the side effect profile of
oxaliplatin and irinotecan which are significant, and the fact that most LN negative
patients will not benefit from their administration [30]. However, our data suggest that
elevated SLIRP expression is predictive of a good response to chemotherapy and thus
giving these agents selectively to LN negative/SLIRP positive patients may reduce their
risk of relapse. Given this translational potential of SLIRP in CRC, further studies are
planned in different cohorts to confirm and expand these initial observations. If SLIRP
turned out to be a useful clinical prognosticator, even in small groups of selected CRC
patients, it would represent an important translational outcome stemming from this
work.
5.4 SLIRP, SRA and RARα are therapeutic targets in CRC
The discovery of SLIRP’s repression of Notch signalling, in addition to SLIRP’s
repression of invasion and chemoresistance in CRC cell lines, indicate SLIRP and its
binding partners may be attractive therapeutic targets in CRC [108-111]. This is
especially relevant given the difficulties associated with developing Notch inhibitors
with an acceptable toxicity profile, as current therapeutics primarily target the γ-
secretase, which is upstream of the Notch signalling pathway and is associated with
multiple off target effects [119, 120]. The data presented herein suggests a number of
potential avenues for the treatment of CRC through targeting SLIRP, SRA or RARα.
First, the discovery of small molecule agonists of SLIRP’s RARα coregulator action,
may be capable of repressing oncogenesis mediated by Notch signalling and its
downstream effectors. Second, identification of SLIRP inducers that promote its
103

overexpression in patient nonmalignant and tumour tissue, could be clinically useful.
Third, this study has shown the important role of SRA and RARα in driving CRC Notch
signalling. Numerous small molecule inhibitors exist, which disrupt oncogenic
pathways in CRC, with potential to improve survival, especially when used in
combination with adjuvant chemotherapy. These include the NEDD8-activating enzyme
inhibitor MLN4924, VEGFR inhibitor vatalanib, PARP inhibitor ABT-888 and the
Aurora kinase inhibitor PF-03814735 [188-191]. The development of small molecule
inhibitors to selectively disrupt RARα or SRA in tumours, could ablate the Notch
pathway and its associated pro-oncogenic effects to reduce metastasis and the
occurrence of chemoresistance in CRC [108-111]. In summary, this study has unveiled
numerous potential therapeutic avenues for further research into suppression of
oncogenic Notch signalling through targeting SLIRP, SRA and RARα.
5.5 Notch induced HEY1, HES1 and SOX9 have potential as prognostic biomarkers
This study’s investigation of the expression of NTFs, HEY1, HES1 and SOX9 in CRC
patients, has enhanced our understanding of these molecules in the clinical setting and
presents some opportunities, if replicated in other cohorts, for their use in CRC
prognostication. High tumour expression of these NTFs correlated with a worse
prognosis, indicating they may be useful markers for identification of patients who may
benefit preferentially from Notch inhibitory therapy [119, 120]. In particular, HEY1
most strongly associated with poorer prognosis, in addition to the early markers of
metastasis, perineural and vascular invasion, high expression of pro-inflammatory
prostaglandin synthase COX-2 and a greater proportion of positive LNs in patients.
Thus, patients with high HEY1 tumour expression, may have reduced risk of
104

developing metastatic CRC if treated with Notch inhibitory therapies, because HEY1 is
essential in early development [127-130], promotes EMT and differentiation [131, 132],
and associates with LN metastasis and poorer outcome in CRC patients [133]. High
tumour expression of SOX9 and a combination of all three NTFs, HEY1, HES1 and
SOX9, correlated with worse survival in patients that received 5-FU based
chemotherapies. Given the key role of Notch signalling in chemoresistance [116-118],
patients with tumours that express these NTFs to a high level may therefore benefit
most from the use of Notch inhibitors in conjunction with chemotherapy potentially
rendering them as responsive to chemotherapy as those with low tumour NTF
expression [116-120]. It will be important to assess NTF expression in cohorts that have
received current routine adjuvant chemotherapy combinations of FOLFOX and
FOLFIRI, overcoming the limitation of only examining 5-FU used in this study. If
replicated, use of the NTF signalling to select patients for Notch inhibitor treatment and
chemotherapy would be an important advance in the area of targeted CRC treatment and
a move towards personalised medicine.
5.6 Final Conclusion
CRC remains the third most common tumour and the second highest cause of cancer
death in Australia [2]. There is a clear need to better understand the molecular basis of
this disease to develop new therapies and improve existing treatment. In this thesis I
found SLIRP to be a favourable prognostic marker with an antitumour signature in CRC
patients, in addition to being a suppressor of oncogenic RARα and Notch signalling,
invasion and chemoresistance. Mechanistically, SLIRP was also shown to suppress the
expression of the NTFs HES1 and SOX9 and the critical role for SRA in mediating
105

many of these effects was identified. I identified a NTF signature (HEY1, HES1 and
SOX9 overexpression) that predicted reduced response to chemotherapy and poorer
prognosis in CRC patients. These findings provide a strong foundation for further
studies to investigate the therapeutic potential of targeting SLIRP, SRA and RARα to
suppress oncogenic Notch and NR signalling in CRC patients that may lead to improved
outcomes. In addition, further research may validate the biomarker potential of SLIRP,
HEY1, HES1 and SOX9 tumour expression to improve prognostication and help guide
the selection of patients for Notch inhibitory therapies and chemotherapy.
106

References
107

1. Salama, P., et al., Tumour-Infiltrating FOXP3+ T Regulatory Cells Show Strong
Prognostic Significance in Colorectal Cancer. J Clin Oncol, 2009. 27(2): p. 186-192.
2. Australian Institute of Health and Welfare (AIHW) and A.A.o.C.R. (AACR), Cancer in Australia: an overview, 2012. Cancer series Canberra: AIHW, 2012. 74.
3. Greene, F., et al., AJCC Cancer Staging Handbook: From the AJCC Cancer Staging Manual (6th edition). 2002: Springer Verlag, New York.
4. Jemal, A., et al., Global cancer statistics. CA: A Cancer Journal for Clinicians, 2011. 61(2): p. 69-90.
5. Schoen, R.E., et al., Colorectal-Cancer Incidence and Mortality with Screening Flexible Sigmoidoscopy. New England Journal of Medicine, 2012. 366(25): p. 2345-2357.
6. Siegel, R., D. Naishadham, and A. Jemal, Cancer statistics, 2012. CA: A Cancer Journal for Clinicians, 2012. 62(1): p. 10-29.
7. Li, F.Y. and M.D. Lai, Colorectal cancer, one entity or three. J Zhejiang Univ Sci B, 2009. 10(3): p. 219-29.
8. Nelson, R.L., et al., The relation of age, race, and gender to the subsite location of colorectal carcinoma. Cancer, 1997. 80(2): p. 193-7.
9. Saltzstein, S.L. and C.A. Behling, Age and time as factors in the left-to-right shift of the subsite of colorectal adenocarcinoma: a study of 213,383 cases from the California Cancer Registry. J Clin Gastroenterol, 2007. 41(2): p. 173-7.
10. Murphy, N., et al., Dietary fibre intake and risks of cancers of the colon and rectum in the European prospective investigation into cancer and nutrition (EPIC). PLoS One, 2012. 7(6): p. e39361.
11. Cho, E., et al., Dairy foods, calcium, and colorectal cancer: a pooled analysis of 10 cohort studies. J Natl Cancer Inst, 2004. 96(13): p. 1015-22.
12. Terry, P., et al., Fruit, vegetables, dietary fiber, and risk of colorectal cancer. J Natl Cancer Inst, 2001. 93(7): p. 525-33.
13. Sandhu, M.S., I.R. White, and K. McPherson, Systematic review of the prospective cohort studies on meat consumption and colorectal cancer risk: a meta-analytical approach. Cancer Epidemiol Biomarkers Prev, 2001. 10(5): p. 439-46.
14. He, T.C., et al., Identification of c-MYC as a target of the APC pathway. Science, 1998. 281(5382): p. 1509-12.
15. Mann, B., et al., Target genes of beta-catenin-T cell-factor/lymphoid-enhancer-factor signalling in human colorectal carcinomas. Proc Natl Acad Sci U S A, 1999. 96(4): p. 1603-8.
16. Polakis, P., The oncogenic activation of [beta]-catenin. Current Opinion in Genetics & Development, 1999. 9(1): p. 15-21.
17. Ahn, B.K., et al., Smad4 may help to identify a subset of colorectal cancer patients with early recurrence after curative therapy. Hepatogastroenterology, 2011. 58(112): p. 1933-6.
18. Oltedal, S., et al., Detection of occult metastases in sentinel lymph nodes from colon cancer patients by K-ras mutation peptide nucleic acid clamp PCR. Ann Surg, 2010. 251(6): p. 1087-91.
19. You, S., et al., PTCH1, a receptor of Hedgehog signalling pathway, is correlated with metastatic potential of colorectal cancer. Ups J Med Sci, 2010. 115(3): p. 169-75.
108

20. Xu, X.M., et al., DNA alterations of microsatellite DNA, p53, APC and K-ras in Chinese colorectal cancer patients. Eur J Clin Invest, 2012. 42(7): p. 751-9.
21. Grim, J.E., et al., Fbw7 and p53 cooperatively suppress advanced and chromosomally unstable intestinal cancer. Mol Cell Biol, 2012. 32(11): p. 2160-7.
22. Roger, L., et al., Gain of oncogenic function of p53 mutants regulates E-cadherin expression uncoupled from cell invasion in colon cancer cells. J Cell Sci, 2010. 123(Pt 8): p. 1295-305.
23. Fre, S., et al., Notch and Wnt signals cooperatively control cell proliferation and tumourigenesis in the intestine. Proc Natl Acad Sci U S A, 2009. 106(15): p. 6309-14.
24. Reedijk M, O.S., Zhang H, Chetty R, Tennert C, Dickson BC, Lockwood G, and E.S. Gallinger S, Activation of Notch signalling in human colon adenocarcinoma. Int J Oncol., 2008. 33(6): p. 1223-9.
25. Mannan, A. and V. Hahn-Stromberg, K-ras mutations are correlated to lymph node metastasis and tumour stage, but not to the growth pattern of colon carcinoma. Apmis, 2012. 120(6): p. 459-68.
26. Patil, D.T., et al., A five-marker panel in a multiplex PCR accurately detects microsatellite instability-high colorectal tumours without control DNA. Diagn Mol Pathol, 2012. 21(3): p. 127-33.
27. Miyakura, Y., et al., Extensive methylation of hMLH1 promoter region predominates in proximal colon cancer with microsatellite instability. Gastroenterology, 2001. 121(6): p. 1300-1309.
28. Buecher, B., et al., Role of microsatellite instability in the management of colorectal cancers. Dig Liver Dis, 2012. 26(12): p. 00387-8.
29. Shokal, U. and P.C. Sharma, Implication of microsatellite instability in human gastric cancers. Indian J Med Res, 2012. 135(5): p. 599-613.
30. DeVita, V., et al., DeVita, Hellman, and Rosenberg's Cancer: Principles & Practice of Oncology. 2008, Lippincott Williams & Wilkins.
31. Lindor, N.M., et al., Recommendations for the care of individuals with an inherited predisposition to Lynch syndrome: a systematic review. JAMA, 2006. 296(12): p. 1507-17.
32. Rothenberg, M.L., et al., Superiority of oxaliplatin and fluorouracil-leucovorin compared with either therapy alone in patients with progressive colorectal cancer after irinotecan and fluorouracil-leucovorin: interim results of a phase III trial. J Clin Oncol, 2003. 21(11): p. 2059-69.
33. Ochiai, T., et al., Individualized chemotherapy for colorectal cancer based on the collagen gel droplet-embedded drug sensitivity test. Oncol Lett, 2012. 4(4): p. 621-624.
34. Mathis, K.L., S.Y. Boostrom, and J.H. Pemberton, New developments in colorectal surgery. Curr Opin Gastroenterol, 2013. 29(1): p. 72-8.
35. Raftery, L. and R.M. Goldberg, Optimal delivery of cytotoxic chemotherapy for colon cancer. Cancer J, 2010. 16(3): p. 214-9.
36. Andre, T., et al., Panitumumab combined with irinotecan for patients with KRAS wild-type metastatic colorectal cancer refractory to standard chemotherapy: a GERCOR efficacy, tolerance, and translational molecular study. Ann Oncol, 2012. 5: p. 5.
37. Garcia Rodriguez, L.A., et al., Coxibs: pharmacology, toxicity and efficacy in cancer clinical trials. Recent Results Cancer Res, 2013. 191: p. 67-93.
38. Kraus, S., I. Naumov, and N. Arber, COX-2 active agents in the chemoprevention of colorectal cancer. Recent Results Cancer Res, 2013. 191: p. 95-103.
109

39. Bokemeyer, C., et al., Fluorouracil, leucovorin, and oxaliplatin with and without cetuximab in the first-line treatment of metastatic colorectal cancer. J Clin Oncol, 2009. 27(5): p. 663-71.
40. Saltz, L.B., et al., Bevacizumab in combination with oxaliplatin-based chemotherapy as first-line therapy in metastatic colorectal cancer: a randomized phase III study. J Clin Oncol, 2008. 26(12): p. 2013-9.
41. Rex, D.K., et al., Guidelines for colonoscopy surveillance after cancer resection: a consensus update by the American Cancer Society and US Multi-Society Task Force on Colorectal Cancer. CA Cancer J Clin, 2006. 56(3): p. 160-7; quiz 185-6.
42. Kohne, C.H., et al., Phase III study of weekly high-dose infusional fluorouracil plus folinic acid with or without irinotecan in patients with metastatic colorectal cancer: European Organisation for Research and Treatment of Cancer Gastrointestinal Group Study 40986. J Clin Oncol, 2005. 23(22): p. 4856-65.
43. Hatchell, E.C., et al., SLIRP, a Small SRA Binding Protein, Is a Nuclear Receptor Corepressor. Molecular Cell, 2006. 22(5): p. 657-668.
44. Holt, P.R., New insights into calcium, dairy and colon cancer. World J Gastroenterol., 2008 14(28): p. 4429-33.
45. Osawa, E., et al., Peroxisome proliferator-activated receptor [gamma] ligands suppress colon carcinogenesis induced by azoxymethane in mice. Gastroenterology, 2003. 124(2): p. 361-367.
46. Press, O.A., et al., Gender-related survival differences associated with polymorphic variants of estrogen receptor-beta (ERbeta) in patients with metastatic colon cancer. Pharmacogenomics J, 2011. 11(5): p. 375-82.
47. Mangelsdorf, D.J., et al., The nuclear receptor superfamily: the second decade. Cell, 1995. 83(6): p. 835-9.
48. Novac, N. and T. Heinzel, Nuclear receptors: overview and classification. Curr Drug Targets Inflamm Allergy, 2004. 3(4): p. 335-46.
49. Zhang, Z., et al., Genomic analysis of the nuclear receptor family: new insights into structure, regulation, and evolution from the rat genome. Genome Res, 2004. 14(4): p. 580-90.
50. Conzen, S.D., Minireview: Nuclear Receptors and Breast Cancer. Molecular Endocrinology, 2008. 22(10): p. 2215-2228.
51. Ng, K., et al., Circulating 25-Hydroxyvitamin D Levels and Survival in Patients With Colorectal Cancer. J Clin Oncol, 2008. 26(18): p. 2984-2991.
52. Jenab, M., et al., Association between pre-diagnostic circulating vitamin D concentration and risk of colorectal cancer in European populations:a nested case-control study. Bmj, 2010. 340(340): p. b5500.
53. Bai, Y.H., et al., Vitamin D receptor gene polymorphisms and colorectal cancer risk: a systematic meta-analysis. World J Gastroenterol, 2012. 18(14): p. 1672-9.
54. Kallay, E., et al., Characterization of a vitamin D receptor knockout mouse as a model of colorectal hyperproliferation and DNA damage. Carcinogenesis, 2001. 22(9): p. 1429-1435.
55. Palmer, H.G., et al., The transcription factor SNAIL represses vitamin D receptor expression and responsiveness in human colon cancer. Nat Med, 2004. 10(9): p. 917-919.
56. Cross, H.S., et al., 25-Hydroxyvitamin D3-1[alpha]-hydroxylase and vitamin D receptor gene expression in human colonic mucosa is elevated during early cancerogenesis. Steroids, 2001. 66(3-5): p. 287-292.
110

57. Byers, S.W., et al., Mechanism of action of vitamin D and the vitamin D receptor in colorectal cancer prevention and treatment. Rev Endocr Metab Disord, 2012. 13(1): p. 31-8.
58. Vuolo, L., et al., Vitamin D and cancer. Front Endocrinol (Lausanne), 2012. 3(58): p. 58.
59. Fucci, A., et al., The role of peroxisome proliferator-activated receptors in the esophageal, gastric, and colorectal cancer. PPAR Res, 2012. 2012(6): p. 242498.
60. Dai Y., Q.L., Gu Q, et al., Activation of ppary and inhibition of xiap in human cancer cells: Synergistic effects on cell proliferation, apoptosis, and tumourigenesis. Gastroenterology, 2007. 132(4): p. A425-A425.
61. Thompson, E.A., PPARgamma physiology and pathology in gastrointestinal epithelial cells. Mol Cells, 2007. 24(2): p. 167-76.
62. Pancione, M., et al., Reduced beta-catenin and peroxisome proliferator-activated receptor-gamma expression levels are associated with colorectal cancer metastatic progression: correlation with tumour-associated macrophages, cyclooxygenase 2, and patient outcome. Hum Pathol, 2009. 40(5): p. 714-25.
63. Ogino, S., et al., Colorectal cancer expression of peroxisome proliferator-activated receptor gamma (PPARG, PPARgamma) is associated with good prognosis. Gastroenterology, 2009. 136(4): p. 1242-50.
64. Germain, P., et al., Co-regulator recruitment and the mechanism of retinoic acid receptor synergy. Nature, 2002. 415(6868): p. 187-92.
65. Rochette-Egly, C. and P. Germain, Dynamic and combinatorial control of gene expression by nuclear retinoic acid receptors (RARs). Nucl Recept Signal., 2009. 7(5).
66. Yu, S., et al., Retinoic acid induces neurogenesis by activating both retinoic acid receptors (RAR) and peroxisome proliferator-activated receptor beta/delta (PPARbeta/delta). J Biol Chem, 2012. 26: p. 26.
67. Zhao, J., et al., Comparative proteomic analysis of colon cancer cell HCT-15 in response to all-trans retinoic acid treatment. Protein Pept Lett, 2012. 4: p. 4.
68. McKenna, N.J., EMBO Retinoids 2011: mechanisms, biology and pathology of signalling by retinoic acid and retinoic acid receptors. Nucl Recept Signal., 2012. 10.
69. Bushue, N. and Y.-J.Y. Wan, Retinoid pathway and cancer therapeutics. Advanced Drug Delivery Reviews, 2010. 62(13): p. 1285-1298.
70. Müller, P., et al., SOX9 mediates the retinoic acid-induced HES-1 gene expression in human breast cancer cells. Breast Cancer Research and Treatment, 2010. 120(2): p. 317-326.
71. D'Errico, I. and A. Moschetta, Nuclear receptors, intestinal architecture and colon cancer: an intriguing link. Cell Mol Life Sci, 2008. 65(10): p. 1523-43.
72. O'Connell, M.J., et al., Relationship between tumour gene expression and recurrence in four independent studies of patients with stage II/III colon cancer treated with surgery alone or surgery plus adjuvant fluorouracil plus leucovorin. J Clin Oncol, 2010. 28(25): p. 3937-44.
73. O'Malley, B.W. and R. Kumar, Nuclear Receptor Coregulators in Cancer Biology. Cancer Research, 2009. 69(21): p. 8217-8222.
74. McKenna, N.J. and B.W. O'Malley, Combinatorial Control of Gene Expression by Nuclear Receptors and Coregulators. Cell, 2002. 108(4): p. 465-474.
75. Chawla, A., et al., Nuclear receptors and lipid physiology: opening the X-files. Science, 2001. 294(5548): p. 1866-70.
111

76. Lonard, D.M. and W. O'Malley B, Nuclear receptor coregulators: judges, juries, and executioners of cellular regulation. Mol Cell, 2007. 27(5): p. 691-700.
77. Kinyamu, H.K., W.N. Jefferson, and T.K. Archer, Intersection of nuclear receptors and the proteasome on the epigenetic landscape. Environmental and Molecular Mutagenesis, 2008. 49(1): p. 83-95.
78. Huang, W. and C.K. Glass, Nuclear Receptors and Inflammation Control: Molecular Mechanisms and Pathophysiological Relevance. Arteriosclerosis, Thrombosis, and Vascular Biology, 2010. 30(8): p. 1542-1549.
79. Rosell, M., M.C. Jones, and M.G. Parker, Role of nuclear receptor corepressor RIP140 in metabolic syndrome. Biochimica et Biophysica Acta (BBA) - Molecular Basis of Disease, 2011. 1812(8): p. 919-928.
80. Xie, D., et al., Correlation of AIB1 overexpression with advanced clinical stage of human colorectal carcinoma. Hum Pathol, 2005. 36(7): p. 777-83.
81. Osborne, C.K., et al., Role of the estrogen receptor coactivator AIB1 (SRC-3) and HER-2/neu in tamoxifen resistance in breast cancer. J Natl Cancer Inst, 2003. 95(5): p. 353-61.
82. Oh, A.S., et al., Tyrosine phosphorylation of the nuclear receptor coactivator AIB1/SRC-3 is enhanced by Abl kinase and is required for its activity in cancer cells. Mol Cell Biol, 2008. 28(21): p. 6580-93.
83. Anzick, S.L., et al., AIB1, a steroid receptor coactivator amplified in breast and ovarian cancer. Science, 1997. 277(5328): p. 965-8.
84. Li, Z., et al., Amplifications of NCOA3 gene in colorectal cancers in a Chinese population. World J Gastroenterol., 2012. 18(8): p. 855-860.
85. Redmond, A.M., et al., Coassociation of estrogen receptor and p160 proteins predicts resistance to endocrine treatment; SRC-1 is an independent predictor of breast cancer recurrence. Clin Cancer Res, 2009. 15(6): p. 2098-106.
86. Horlein, A.J., et al., Ligand-independent repression by the thyroid hormone receptor mediated by a nuclear receptor co-repressor. Nature, 1995. 377(6548): p. 397-404.
87. Jepsen, K., et al., Combinatorial roles of the nuclear receptor corepressor in transcription and development. Cell, 2000. 102(6): p. 753-63.
88. Cohen, R.N., Nuclear receptor corepressors and PPARgamma. Nucl Recept Signal, 2006. 4(8): p. e003.
89. Mengeling, B.J., et al., Aberrant corepressor interactions implicated in PML-RAR(alpha) and PLZF-RAR(alpha) leukemogenesis reflect an altered recruitment and release of specific NCoR and SMRT splice variants. J Biol Chem, 2011. 286(6): p. 4236-47.
90. Tzelepi, V., et al., Expression of estrogen receptor co-regulators NCoR and PELP1 in epithelial cells and myofibroblasts of colorectal carcinomas: cytoplasmic translocation of NCoR in epithelial cells correlates with better [corrected] prognosis. Virchows Arch, 2009. 454(1): p. 41-53.
91. Lanz, R.B., et al., A Steroid Receptor Coactivator, SRA, Functions as an RNA and Is Present in an SRC-1 Complex. Cell, 1999. 97(1): p. 17-27.
92. Colley, S.M. and P.J. Leedman, Steroid Receptor RNA Activator - A nuclear receptor coregulator with multiple partners: Insights and challenges. Biochimie, 2011. 93(11): p. 1966-72.
93. Emberley, E., et al., Identification of new human coding steroid receptor RNA activator isoforms. Biochem Biophys Res Commun, 2003. 301(2): p. 509-15.
94. Hube, F., et al., Steroid receptor RNA activator protein binds to and counteracts SRA RNA-mediated activation of MyoD and muscle differentiation. Nucleic Acids Res, 2011. 39(2): p. 513-25.
112

95. Zhao, X., et al., Regulation of Nuclear Receptor Activity by a Pseudouridine Synthase through Posttranscriptional Modification of Steroid Receptor RNA Activator. Molecular Cell, 2004. 15(4): p. 549-558.
96. Lanz, R.B., et al., A steroid receptor coactivator, SRA, functions as an RNA and is present in an SRC-1 complex. Cell, 1999. 97(1): p. 17-27.
97. Warnmark, A., et al., Activation functions 1 and 2 of nuclear receptors: molecular strategies for transcriptional activation. Mol Endocrinol, 2003. 17(10): p. 1901-9.
98. Lanz, R.B., et al., Steroid receptor RNA activator stimulates proliferation as well as apoptosis in vivo. Mol Cell Biol, 2003. 23(20): p. 7163-76.
99. Hube, F., et al., Alternative splicing of the first intron of the steroid receptor RNA activator (SRA) participates in the generation of coding and noncoding RNA isoforms in breast cancer cell lines. DNA Cell Biol, 2006. 25(7): p. 418-28.
100. Hussein-Fikret, S. and P.J. Fuller, Expression of nuclear receptor coregulators in ovarian stromal and epithelial tumours. Mol Cell Endocrinol, 2005. 229(1-2): p. 149-60.
101. Agoulnik, I.U. and N.L. Weigel, Coactivator selective regulation of androgen receptor activity. Steroids, 2009. 74(8): p. 669-74.
102. Sasarman, F., et al., LRPPRC and SLIRP interact in a ribonucleoprotein complex that regulates posttranscriptional gene expression in mitochondria. Mol Biol Cell, 2010. 21(8): p. 1315-23.
103. Chujo, T., et al., LRPPRC/SLIRP suppresses PNPase-mediated mRNA decay and promotes polyadenylation in human mitochondria. Nucleic Acids Research, 2012. 40(16): p. 8033-47.
104. Baughman, J.M., et al., A computational screen for regulators of oxidative phosphorylation implicates SLIRP in mitochondrial RNA homeostasis. PLoS Genet, 2009. 5(8): p. e1000590.
105. Koukourakis, M.I., et al., Comparison of metabolic pathways between cancer cells and stromal cells in colorectal carcinomas: a metabolic survival role for tumour-associated stroma. Cancer Res, 2006. 66(2): p. 632-7.
106. Shim, B., et al., Glucose transporter 1 (GLUT1) of anaerobic glycolysis as predictive and prognostic values in neoadjuvant chemoradiotherapy and laparoscopic surgery for locally advanced rectal cancer. International Journal of Colorectal Disease, 2012. 28(3): p. 375-83..
107. Jose, C., N. Bellance, and R. Rossignol, Choosing between glycolysis and oxidative phosphorylation: a tumour's dilemma? Biochim Biophys Acta, 2011. 1807(6): p. 552-61.
108. Zhang, X., et al., Notch1 promotes glioma cell migration and invasion by stimulating β-catenin and NF-κB signalling via AKT activation. Cancer Science, 2011. 103(2): p. 181-90.
109. Meng, R.D., et al., γ-Secretase Inhibitors Abrogate Oxaliplatin-Induced Activation of the Notch-1 Signalling Pathway in Colon Cancer Cells Resulting in Enhanced Chemosensitivity. Cancer Research, 2009. 69(2): p. 573-582.
110. Garcia, A. and J.J. Kandel, Notch: A key regulator of tumour angiogenesis and metastasis. Histol Histopathol, 2012. 27(2): p. 151-6.
111. Xie, M., et al., Activation of Notch-1 enhances epithelial-mesenchymal transition in gefitinib-acquired resistant lung cancer cells. Journal of Cellular Biochemistry, 2011. 113(5): p. 1501-13.
112. Barolo, S. and J.W. Posakony, Three habits of highly effective signalling pathways: principles of transcriptional control by developmental cell signalling. Genes Dev, 2002. 16(10): p. 1167-81.
113
113. Kume, T., Novel insights into the differential functions of Notch ligands in vascular formation. J Angiogenes Res, 2009. 1(8): p. 8.
114. Noah, T.K. and N.F. Shroyer, Notch in the Intestine: Regulation of Homeostasis and Pathogenesis. Annu Rev Physiol, 2012. 26: p. 26.
115. De Strooper, B., et al., A presenilin-1-dependent gamma-secretase-like protease mediates release of Notch intracellular domain. Nature, 1999. 398(6727): p. 518-22.
116. Izrailit, J. and M. Reedijk, Developmental pathways in breast cancer and breast tumour-initiating cells: Therapeutic implications. Cancer Letters, 2012. 317(2): p. 115-126.
117. Miyamoto, S. and D.W. Rosenberg, Role of Notch signalling in colon homeostasis and carcinogenesis. Cancer Science, 2011. 102(11): p. 1938-1942.
118. Schreck, K.C., et al., The Notch Target Hes1 Directly Modulates Gli1 Expression and Hedgehog Signalling: A Potential Mechanism of Therapeutic Resistance. Clinical Cancer Research, 2010. 16(24): p. 6060-6070.
119. Fan, X., et al., NOTCH Pathway Blockade Depletes CD133-Positive Glioblastoma Cells and Inhibits Growth of Tumour Neurospheres and Xenografts. Stem Cells, 2010. 28(1): p. 5-16.
120. Purow, B.W., et al., Expression of Notch-1 and Its Ligands, Delta-Like-1 and Jagged-1, Is Critical for Glioma Cell Survival and Proliferation. Cancer Research, 2005. 65(6): p. 2353-2363.
121. Staal, F.J.T. and A.W. Langerak, Signalling pathways involved in the development of T-cell acute lymphoblastic leukemia. Haematologica, 2008. 93(4): p. 493-497.
122. Strosberg, J.R., et al., A phase II study of RO4929097 in metastatic colorectal cancer. Eur J Cancer, 2012. 48(7): p. 997-1003.
123. Jin, H.Y., et al., [Expression pattern and clinical significance of hairy enhancer of split 1 in colorectal cancer]. Zhonghua Yi Xue Za Zhi, 2011. 91(41): p. 2891-4.
124. Maier, M.M. and M. Gessler, Comparative Analysis of the Human and Mouse Hey1 Promoter: Hey Genes Are New Notch Target Genes. Biochemical and Biophysical Research Communications, 2000. 275(2): p. 652-660.
125. Kunnimalaiyaan, M., K. Traeger, and H. Chen, Conservation of the Notch1 signalling pathway in gastrointestinal carcinoid cells. American Journal of Physiology - Gastrointestinal and Liver Physiology, 2005. 289(4): p. G636-G642.
126. Muto, A., et al., The group E Sox genes Sox8 and Sox9 are regulated by Notch signalling and are required for Müller glial cell development in mouse retina. Experimental Eye Research, 2009. 89(4): p. 549-558.
127. Fischer, A., et al., Combined Loss of Hey1 and HeyL Causes Congenital Heart Defects Because of Impaired Epithelial to Mesenchymal Transition. Circulation Research, 2007. 100(6): p. 856-863.
128. Belandia, B., et al., Hey1, a mediator of notch signalling, is an androgen receptor corepressor. Mol Cell Biol, 2005. 25(4): p. 1425-36.
129. Zamurovic, N., et al., Coordinated Activation of Notch, Wnt, and Transforming Growth Factor-β Signalling Pathways in Bone Morphogenic Protein 2-induced Osteogenesis. Journal of Biological Chemistry, 2004. 279(36): p. 37704-37715.
130. Sakamoto, M., et al., The Basic Helix-Loop-Helix Genes Hesr1/Hey1 and Hesr2/Hey2 Regulate Maintenance of Neural Precursor Cells in the Brain. Journal of Biological Chemistry, 2003. 278(45): p. 44808-44815.
114
131. Yang, J. and R.A. Weinberg, Epithelial-Mesenchymal Transition: At the Crossroads of Development and Tumour Metastasis. Developmental Cell, 2008. 14(6): p. 818-829.
132. Villaronga, M.A., et al., HEY1 Leu94Met gene polymorphism dramatically modifies its biological functions. Oncogene, 2009. 29(3): p. 411-420.
133. Hulleman, E., et al., A role for the transcription factor HEY1 in glioblastoma. Journal of Cellular and Molecular Medicine, 2009. 13(1): p. 136-146.
134. Zage, P.E., et al., Notch pathway activation induces neuroblastoma tumour cell growth arrest. Pediatric Blood & Cancer, 2012. 58(5): p. 682-9.
135. Kannan, S., et al., Notch/HES1-mediated PARP1 activation: a cell type–specific mechanism for tumour suppression. Blood, 2011. 117(10): p. 2891-2900.
136. Ueo, T., et al., The role of Hes genes in intestinal development, homeostasis and tumour formation. Development, 2012. 139(6): p. 1071-82.
137. Hughes, D.P., How the NOTCH pathway contributes to the ability of osteosarcoma cells to metastasize. Cancer Treat Res, 2009. 152: p. 479-96.
138. Wang, X., et al., The expressions of bHLH gene HES1 and HES5 in advanced ovarian serous adenocarcinomas and their prognostic significance: a retrospective clinical study. Journal of Cancer Research and Clinical Oncology, 2010. 136(7): p. 989-996.
139. Mazur, P.K., et al., Expression and Clinicopathological Significance of Notch Signalling and Cell-Fate Genes in Biliary Tract Cancer. Am J Gastroenterol, 2012. 107(1): p. 126-135.
140. Bai, G., et al., Id sustains Hes1 expression to inhibit precocious neurogenesis by releasing negative autoregulation of Hes1. Dev Cell, 2007. 13(2): p. 283-97.
141. Matheu, A., et al., Oncogenicity of the developmental transcription factor Sox9. Cancer Research, 2012.
142. Bastide, P., et al., Sox9 regulates cell proliferation and is required for Paneth cell differentiation in the intestinal epithelium. The Journal of Cell Biology, 2007. 178(4): p. 635-648.
143. Zhou, C.-J., et al., Elevated expression of SOX9 is related with the progression of gastric carcinoma. Diagnostic Cytopathology, 2011. 39(2): p. 105-109.
144. Lü, B., et al., Analysis of SOX9 Expression in Colorectal Cancer. American Journal of Clinical Pathology, 2008. 130(6): p. 897-904.
145. Shi, Y., et al., Sharp, an inducible cofactor that integrates nuclear receptor repression and activation. Genes Dev, 2001. 15(9): p. 1140-51.
146. Oswald, F., et al., SHARP is a novel component of the Notch/RBP-Jkappa signalling pathway. EMBO J, 2002. 21(20): p. 5417-26.
147. Colley, S.M. and P.J. Leedman, SRA and its binding partners: an expanding role for RNA-binding coregulators in nuclear receptor-mediated gene regulation. Critical Reviews in Biochemistry and Molecular Biology, 2009. 44(1): p. 25-33.
148. Chai, S.M., et al., Screening for defective DNA mismatch repair in stage II and III colorectal cancer patients. Clinical Gastroenterology and Hepatology, 2004. 2(11): p. 1017-1025.
149. Harrell, F.E., Califf R. M., Pryor D. B., Lee K. L., and Rosati R.A., Evaluating the yield of medical tests. Journal of the American Medical Association 1982. 247: p. 2543-2546.
150. Grambsch, P.M., and Therneau, T. M., Proportional hazards tests and diagnostics based on weighted residuals. 1994.
151. Harrell, F.E., rms: Regression Modeling Strategies. R package version 3.3-3. 2011.
115
152. Bostner, J., et al., Activation of Akt, mTOR, and the estrogen receptor as a signature to predict tamoxifen treatment benefit. Breast Cancer Res Treat, 2012. 15: p. 15.
153. O'Malley, B.W. and R. Kumar, Nuclear receptor coregulators in cancer biology. Cancer Res, 2009. 69(21): p. 8217-22.
154. Morris, E.J., et al., Who to treat with adjuvant therapy in Dukes B/stage II colorectal cancer? The need for high quality pathology. Gut, 2007. 56(10): p. 1419-25.
155. Lu, C. and S.Y. Cheng, Thyroid hormone receptors regulate adipogenesis and carcinogenesis via crosstalk signalling with peroxisome proliferator-activated receptors. J Mol Endocrinol, 2010. 44(3): p. 143-54.
156. Jorissen, R.N., et al., Metastasis-Associated Gene Expression Changes Predict Poor Outcomes in Patients with Dukes Stage B and C Colorectal Cancer. Clin Cancer Res, 2009. 15(24): p. 7642-7651.
157. Bittner, M., ed. Expression Project for Oncology (expO). 2006. 158. Underhill, T., D. Cash, and E. Linney, Constitutively active retinoid receptors
exhibit interfamily and intrafamily promoter specificity. Mol Endocrinol, 1994. 8(3): p. 274-285.
159. Spanjaard, R.A., et al., Specific activation of retinoic acid receptors (RARs) and retinoid X receptors reveals a unique role for RARgamma in induction of differentiation and apoptosis of S91 melanoma cells. J Biol Chem, 1997. 272(30): p. 18990-9.
160. Wakabayashi, N., et al., A novel cis-acting element regulates HES-1 gene expression in P19 embryonal carcinoma cells treated with retinoic acid. J Biochem, 2000. 128(6): p. 1087-95.
161. Epis, M.R., et al., miR-331-3p regulates ERBB-2 expression and androgen receptor signalling in prostate cancer. J Biol Chem, 2009. 284(37): p. 24696-704.
162. Lanz, R.B., et al., Steroid Receptor RNA Activator Stimulates Proliferation as Well as Apoptosis In Vivo. Mol. Cell. Biol., 2003. 23(20): p. 7163-7176.
163. Wang, X. and B. Seed, A PCR primer bank for quantitative gene expression analysis. Nucleic Acids Res, 2003. 31(24): p. e154.
164. Livak, K.J. and T.D. Schmittgen, Analysis of Relative Gene Expression Data Using Real-Time Quantitative PCR and the 2-[Delta][Delta]CT Method. Methods, 2001. 25(4): p. 402-408.
165. Dowhan, D.H., et al., Steroid hormone receptor coactivation and alternative RNA splicing by U2AF65-related proteins CAPERalpha and CAPERbeta. Mol Cell, 2005. 17(3): p. 429-39.
166. Park, J.T., et al., Notch3 overexpression is related to the recurrence of ovarian cancer and confers resistance to carboplatin. Am J Pathol, 2010. 177(3): p. 1087-94.
167. McAuliffe, S.M., et al., Targeting Notch, a key pathway for ovarian cancer stem cells, sensitizes tumours to platinum therapy. Proc Natl Acad Sci U S A, 2012. 109(43): p. E2939-48.
168. Yao, J., et al., ERK inhibition enhances TSA-induced gastric cancer cell apoptosis via NF-kappaB-dependent and Notch-independent mechanism. Life Sci, 2012. 91(5-6): p. 186-93.
169. Treanor, L.M., et al., Functional interactions between Lmo2, the Arf tumour suppressor, and Notch1 in murine T-cell malignancies. Blood, 2011. 117(20): p. 5453-5462.
170. Kogoshi, H., et al., Gamma-secretase inhibitors suppress the growth of leukemia and lymphoma cells. Oncol Rep, 2007. 18(1): p. 77-80.
116

171. Man, C.H., et al., Inhibition of NOTCH3 signalling significantly enhances sensitivity to cisplatin in EBV-associated nasopharyngeal carcinoma. J Pathol, 2012. 226(3): p. 471-81.
172. Yan, S., et al., Expression profile of Notch-related genes in multidrug resistant K562/A02 cells compared with parental K562 cells. Int J Lab Hematol, 2010. 32(2): p. 150-8.
173. Koullias, G.J., et al., Brief tamoxifen pretreatment enhances the chemosensitivity of gastric carcinoma cells to 5-fluorouracil in vitro. Anticancer Res, 2003. 23(2B): p. 1575-80.
174. Maehara, Y., et al., Estrogen-receptor-negative breast cancer tissue is chemosensitive in vitro compared with estrogen-receptor-positive tissue. Eur Surg Res, 1990. 22(1): p. 50-5.
175. Pu, Y.S., et al., Combined cytotoxic effects of tamoxifen and chemotherapeutic agents on bladder cancer cells: a potential use in intravesical chemotherapy. Br J Urol, 1996. 77(1): p. 76-85.
176. Lee, H.H., et al., Downregulation of Aurora-A overrides estrogen-mediated growth and chemoresistance in breast cancer cells. Endocr Relat Cancer, 2008. 15(3): p. 765-75.
177. Tanaka, Y., et al., Inhibition of HT-29 human colon cancer growth under the renal capsule of severe combined immunodeficient mice by an analogue of 1,25-dihydroxyvitamin D3, DD-003. Cancer Res, 1994. 54(19): p. 5148-53.
178. Huynh, C., et al., The novel gamma secretase inhibitor RO4929097 reduces the tumour initiating potential of melanoma. PLoS One, 2011. 6(9): p. e25264.
179. Feng Han, Q., et al., Expression of sFRP-4 and [beta]-catenin in human colorectal carcinoma. Cancer Letters, 2006. 231(1): p. 129-137.
180. Clark-Langone, K.M., et al., Translating tumour biology into personalized treatment planning: analytical performance characteristics of the Oncotype DX Colon Cancer Assay. BMC Cancer, 2010. 10(691): p. 691.
181. Mann, C.D., et al., Notch3 and hey-1 as prognostic biomarkers in pancreatic adenocarcinoma. PLoS One, 2012. 7(12): p. e51119.
182. Shirasaka, T. and T. Taguchi, [Timeline from discovery of 5-FU to development of an oral anticancer agent S-1 and its drug concept]. Gan To Kagaku Ryoho, 2006. 33 Suppl 1: p. 4-18.
183. Zhou, L., et al., The Down-Regulation of Notch1 Inhibits the Invasion and Migration of Hepatocellular Carcinoma Cells by Inactivating the Cyclooxygenase-2/Snail/E-cadherin Pathway In Vitro. Dig Dis Sci, 2012. 7: p. 7.
184. Tseng, Y.C., et al., Notch2-induced COX-2 expression enhancing gastric cancer progression. Mol Carcinog, 2012. 51(12): p. 939-51.
185. Morikawa, T., et al., Association of CTNNB1 (beta-catenin) alterations, body mass index, and physical activity with survival in patients with colorectal cancer. JAMA, 2011. 305(16): p. 1685-94.
186. Huang, Q., et al., Identification of p53 regulators by genome-wide functional analysis. Proceedings of the National Academy of Sciences of the United States of America, 2004. 101(10): p. 3456-3461.
187. McCourt, C.M., et al., Immunohistochemistry in the era of personalised medicine. J Clin Pathol, 2013. 66(1): p. 58-61.
188. Jani, J.P., et al., PF-03814735, an orally bioavailable small molecule aurora kinase inhibitor for cancer therapy. Mol Cancer Ther, 2010. 9(4): p. 883-94.
189. Davidson, D., et al., The PARP inhibitor ABT-888 synergizes irinotecan treatment of colon cancer cell lines. Invest New Drugs, 2012. 9: p. 9.
117

190. Blank, J.L., et al., Novel DNA Damage Checkpoints Mediating Cell Death Induced by the NEDD8-Activating Enzyme Inhibitor MLN4924. Cancer Res, 2013. 73(1): p. 225-34.
191. Hecht, J.R., et al., Randomized, Placebo-Controlled, Phase III Study of First-Line Oxaliplatin-Based Chemotherapy Plus PTK787/ZK 222584, an Oral Vascular Endothelial Growth Factor Receptor Inhibitor, in Patients With Metastatic Colorectal Adenocarcinoma. Journal of Clinical Oncology, 2011. 29(15): p. 1997-2003.
118

Appendix I: Awards and conferences Awards 1. Royal Perth Hospital, Young Clinical Investigator Award ($750, 2012). 2. Endocrine Society of Australia, Novartis Junior Scientist Award ($5000, 2012). 3. WAIMR, Travel Award ($1000, 2012). 4. UWA, Travel Award ($1850, 2012). 5. Endocrine Society of America, Outstanding Abstract Award ($500, 2012). 6. Royal Perth Hospital, Young Scientific Investigator Award ($750, 2011). 7. Endocrine Society of America, Presidential Poster Prize (2011). 8. UWA, Richard Walter Gibbon Medical Research Fellowship (2009). Oral and poster presentations 1. Medical Research Foundation Young Investigator Day (Perth, Western Australia,
2012) 2. WAIMR seminar series (Perth, Western Australia, 2012) 3. Combined Biological Sciences Meeting (Perth, Western Australia, 2012) 4. Endocrine Society of Australia Annual Meeting (Gold Coast, Queensland Australia,
2012) 5. Endocrine Society of America Annual Meeting (Houston, Texas United States,
2012) 6. Australian Society for Medical Research Annual Meeting (Perth, Western Australia,
2012) 7. Medical Research Foundation Young Investigator Day (Perth, Western Australia,
2011) 8. Endocrine Society of Australia Annual Meeting (Perth, Western Australia, 2011) 9. Endocrine Society of America Annual Meeting (Boston, Massachusetts United
States, 2011) 10. Combined Biological Sciences Meeting (Perth, Western Australia, 2011) 11. Western Australian Cancer Council Conference (Perth, Western Australia, 2011) 12. WAIMR seminar series (Perth, Western Australia, 2009)
119