the role of microbial community function in spatial …kearney.ucdavis.edu/new...
TRANSCRIPT

2006-2011 Mission Kearney Foundation of Soil Science: Understanding and Managing Soil-Ecosystem
Functions Across Spatial and Temporal Scales Progress Report: 2006000, 1/1/2007-12/31/2007
1UC Davis Department of Viticulture and Enology, e-mail: [email protected] *Principal Investigator 2UC Davis Department of Land, Air & Water Resources
The Role of Microbial Community Function in Spatial and Temporal Variation of Nitrogen Trace Gas Emissions from California Perennial Cropping Systems
David R. Smart1, Kate M. Scow2, Peter J. Hernes2
Keywords: Soil carbon, greenhouse gas mitigation, denitrification, CO2, N2O, CH4 emissions.
Summary
Research highlights • We identified two sampling sites, one almond orchard (Nickel’s Soil Laboratory, Arbuckle)
and a table grape vineyard (Delano), both with very different irrigation, N fertilizer regimes and other management practices that affect temporal and spatial scales of soil gas emissions (e.g., girdling of vines, Delano). A highlight of this effort was the recruitment of the Nickel’s Soil Laboratory, Farm Advisor Jennifer Hashim (Kern County) and Farm Advisor John Engstrom (Colusa County), to insure the assessment of greenhouse gas emissions on a diurnal, seasonal, and inter-annual time scale will have the requisite human resources to insure success.
• We acquired more than six months of data in compiling an annual budget for nitrous oxide (N2O), methane (CH4) and carbon dioxide (CO2) emissions in both the vineyard and almond orchard to compliment previous work within a wine grape vineyard and natural oak grassland in Napa for large-scale regional comparisons.
• Preliminary experiments indicated that spatial heterogeneity of N fertilization and irrigation (fertigation) on the extent of N2O (and CO2) fluxes in both the almond orchard and the table grape vineyard were massive, but that spatial constraints may be limited by cultural practices like surface versus subterranean drip.
• For detection of the microbial populations involved in the process of denitrification, we completed optimization of detection and quantification of the denitrification genes, nirS, nirK (nitrite reductase) and nosZ (nitrous-oxide reductase) in agricultural soils using quantitative polymerase chain reaction (QPCR).
• Ongoing work has been performed to test the possibility of quantifying by QPCR the dentrification gene (mentioned above) transcripts (as mRNA) in agricultural soils. We currently have preliminary results illustrating the detection of 16S rRNA (as RNA), which is a method of quantifying the active microbial community.

The Role of Microbial Community Function in Spatial and Temporal Variation of Nitrogen Trace Gas Emissions from California Perennial Cropping Systems—Smart
2
Project Objectives The identification of two suitable perennial crop sampling sites with different land management practices was successful, along with the implementation of a rigorous trace gas sampling regime set up to compliment ongoing budgeting work in wine grape vineyards and natural oak grasslands that represent a larger regional assessment of greenhouse gas (GHG) production and consumption. Intensive diurnal measurements of N2O and CO2 were conducted at the Nickels almond orchard (November 2007) in order to investigate the differences in three irrigation treatments that are in use at Nickels (e.g., sub-surface drip, surface drip, and micro-sprinkle jets). The data from this experiment will determine which irrigation treatment will be the focus for future microbial community, denitrification, and micro-spatial work. An intensive diurnal and fertilization study (June 2007) also was conducted at the table grape vineyard in Delano, where measurements of N2O and CO2 were measured before and after an N fertilization event (input of ~ 80 kg N ha-1), and also before and after the management practice of vine girdling (CO2 data not shown). A second N fertilization event at the Delano vineyard also was monitored (November 2007), and data for this event is not described within this report as samples and data are still being analyzed. Annual budgets at both sites will be compiled from a large data set we are currently collecting and will enable us to assess smaller-scale GHG emission release pathways, and thus determine the effects current management practices will have upon such emissions, leading the way for mitigation strategies to be implemented.
In order to address objective 2 (test the impact of irrigation and N additions on the composition of microbial communities as well as the functional physiology of such communities that favor N transformations and N trace gas loss), we have developed the molecular tools needed to detect denitrifying bacteria at the various study sites. We have elected to use a PCR-based approach targeting functional genes that is both selective and highly sensitive for specific denitrifying populations. With this approach, we will be able to both quantify denitrifying bacteria, based on the number of denitrification gene copies determined by QPCR, and investigate the ratio of nitrous-oxide producing genes (nirS and nirK) to nitrous-oxide consuming genes (nosZ). Furthermore we plan to analyze the diversity of these denitrification genes through clone library and sequencing analysis to determine whether specific denitrifying species are associated with different amounts of nitrous-oxide emissions. To date, we have optimized the detection and analysis of these denitrification genes in agricultural soil as DNA and are currently involved in the optimization of these same methodologies to detect denitrification gene transcripts of mRNA. Targeting mRNA will develop methods that are more representative of the metabolically active members of the denitrifying microbial community (Philippot 2005).
Approach and Procedures
Greenhouse gas emissions Field measurements were made at two California perennial crop study sites – one table grape vineyard (Delano) and one almond orchard (Nickels). The study site in Delano is a 90-acre Crimson variety table grape vineyard, located in the California Central Valley in Kern County. The climate of the Central Valley is largely warm Mediterranean with daily temperatures between 12 and 25oC (average annual minimum and maximum). Soils in Delano are typically a

The Role of Microbial Community Function in Spatial and Temporal Variation of Nitrogen Trace Gas Emissions from California Perennial Cropping Systems—Smart
3
fine sandy loam. The study site at the Nickel Soil Laboratory, in Arbuckle, Colusa County, consists of a 22-acre almond orchard with four varieties of almonds. For the purposes of this study, only the Nonpareil variety was investigated. Within this orchard are three different irrigation systems, (1) surface drip, (2) micro-sprinkle jets, and (3) geoflow subsurface irrigation. Arbuckle has a dry sub-humid mesoclimate, with an average annual temperature of 16oC. Soils found in this area are fine loamy soils. Average annual precipitation for Delano and Nickels is approximately 5.72 and 20 inches, respectively.
To measure N2O, permanent 20.32-cm diameter PVC collars were inserted 2 cm into soil. N2O fluxes were measured using a static chamber technique (fig. 1) modified from Hutchinson and Mosier (1981), in which chambers are fitted over the collars (Hutchinson and Mosier 1981). Gas samples (20 cc) were taken from the chambers using a syringe at regular intervals (0, 60 and 120 minutes for Nickels and 0, 40, 80 and 120 minutes for Delano). Samples for N2O were then analyzed on a gas chromatograph (GC) with Poropak Q Column (1.8 m, 80/100, 90ºC) and a 63Ni electron capture detector, equipped to quantify N2O concentrations. Soil fluxes were estimated by determining the rate of change of N2O concentrations within the chamber headspace and using the slope of its increase to calculate gas emission rate in mols m-2 s-1. At Delano, a total of 11 collars were inserted between the vines directly under the drip irrigation emitters in order to investigate the “fertigation zone” and also within the vine rows. At Nickels, 18 permanent PVC collars for each gas, were inserted within the different irrigation blocks with six repetitions of each for the three irrigation treatments (see fig. 2).
In order to measure soil CO2 efflux in situ, at both the vineyard site and the almond orchard, we use a non-dispersive infrared gas analyzer with a vented closed dynamic chamber (model LI-6400/6400-09, LICOR, Lincoln NE, see Luo and Zhou, 2007). Permanent 10.16-cm diameter PVC collars were inserted 2 cm into soil one month prior to the first measurement. All vegetation within the collar is removed. Vineyard soil collars were placed within the vine rows and within the orchard; collars were placed within the tree rows within the area of irrigation. A total of eight collars were installed for Delano and 18 collars for Nickels. All efflux measurements are corrected for vapor pressure, soil temperature, and chamber temperature. Percent gravimetric soil moisture content at 0 to 20 cm is determined following each efflux measurement and deep (1 m) soil cores will be taken to determine bulk densities and particle size analyses. The soil respiration measurements are made between approximately 11 a.m. and 3 p.m. and every two to three weeks, except during diurnal experiments in which efflux is measured approximately every two hours.
In order to quantify the denitrification genes as DNA, nitrite reductase (nirK and nirS) and nitrous oxide reductase (nosZ), in soil, total DNA is extracted from 0.5 g soil using a Bio 101 Fast DNA SPIN kit for soil (Bio 101, Inc., Vista, Calif.), following a humic acid clean-up step. The quality and yield of DNA extracted is quantified with a Qubit fluorometer (Invitrogen, Carlsbad, NM). Thermal cycling, fluorescent data collection, and data analysis are carried out with the ABI Prism 7300 sequence detection system according to the manufacturer’s instructions using SYBR-green based detection. QPCR reactions for nirK, nirS and nosZ contain 5 uL of template DNA (~ 1 ng/µL), 1.5 µM of each forward and reverse primer, 10 µL of 2x ABI Power SYBR green master mix, in a total volume of 20 µL. The primers (5’-3’) used to detect the nirK, nirS and nosZ genes are nirK876 (ATYGGCGGVAYGGCGA) and nirK1040 (GCCTCGATCAGRTTRTGGTT) (Henry,

The Role of Microbial Community Function in Spatial and Temporal Variation of Nitrogen Trace Gas Emissions from California Perennial Cropping Systems—Smart
4
Baudoin et al. 2005) nirSCd3aF (AACGYSAAGGARACSGG) and nirSR3cd (GASTTCGGRTGSGTCT TSAYGAA) (Kandeler 2006), nosZ2F (CGCRACGGCAASAAGGTSMSSG T) and nosZ2R (CAKRTGCAKSGCRTGGCAGAA) (Henry, Bru et al. 2006), respectively. The conditions for nirK and nirS real-time PCR are 10 min at 95˚C for enzyme activation; afterwards six touchdown cycles are performed: 15 s at 95˚C for denaturation, 30 s at 63˚C for annealing, 30 s at 72˚C for extension. The annealing temperature is progressively decreased by 1˚C down to 58˚C. Finally, a last cycle with an annealing temperature of 58˚C is repeated 40 times with the addition of a data acquisition step of 30 s at 80˚C after the extension phase. One last step of 95˚C for 15 s, 60˚C for 30 s and 95˚C for 30s is added to obtain a specific denaturation curve. The thermal cycling conditions for nosZ are similar except for the annealing temperature, which is 65°C for the first 6 cycles and 60°C for 15 s for the 40 cycles. Purity of amplified products is checked by the observation of a single melting peak and the presence of a unique band of the expected size in a 3% agarose gel stained with ethidium bromide. A calibration curve for each gene is generated by cloning each PCR amplified denitrification gene fragment from known denitrifying bacterial strains into E. coli, purifying the plasmid, quantifying with a Qubit fluorometer.
In order to characterize the active denitrifying bacterial community, total RNA is extracted from 0.5 g soil (Nicol, Tscherko et al. 2005), and cDNA prepared by reverse transcription (RT) with SuperScript III reverse transcription reagents (Invitrogen, Carlsbad, NM) using gene specific primers. The quality and yield of RNA is estimated using a Qubit fluorometer (Invitrogen, Carlsbad, NM). Subsequent QPCR is performed using the cDNA as template and as described above for DNA based QPCR except using SYBR GreenER (Invitrogen, Carlsbad, NM) for increased sensitivity. Additionally, TaqMan (ABI, Foster City, CA) probe-based detection is used to quantify universal bacteria (Suzuki 2000) by RT-QPCR using the 16S rRNA gene.
Figure1: Photo of N2O static collar and chamber for gas collection.
Figure 2: Experimental design for GHG sampling at Nickels Soil Lab orchard. SD represents surface drip irrigation, MS = micro-sprinkle and GF/S = geoflow subsurface irrigation.
SD MS GF/S
SD
SD
SD
SD SD
MS
MS
MS
MS
MS
GF/S GF/S
GF/S
GF/S
GF/S
11 6 trees
The Role of Microbial Community Function in Spatial and Temporal Variation of Nitrogen Trace Gas Emissions from California Perennial Cropping Systems—Smart
5
Results
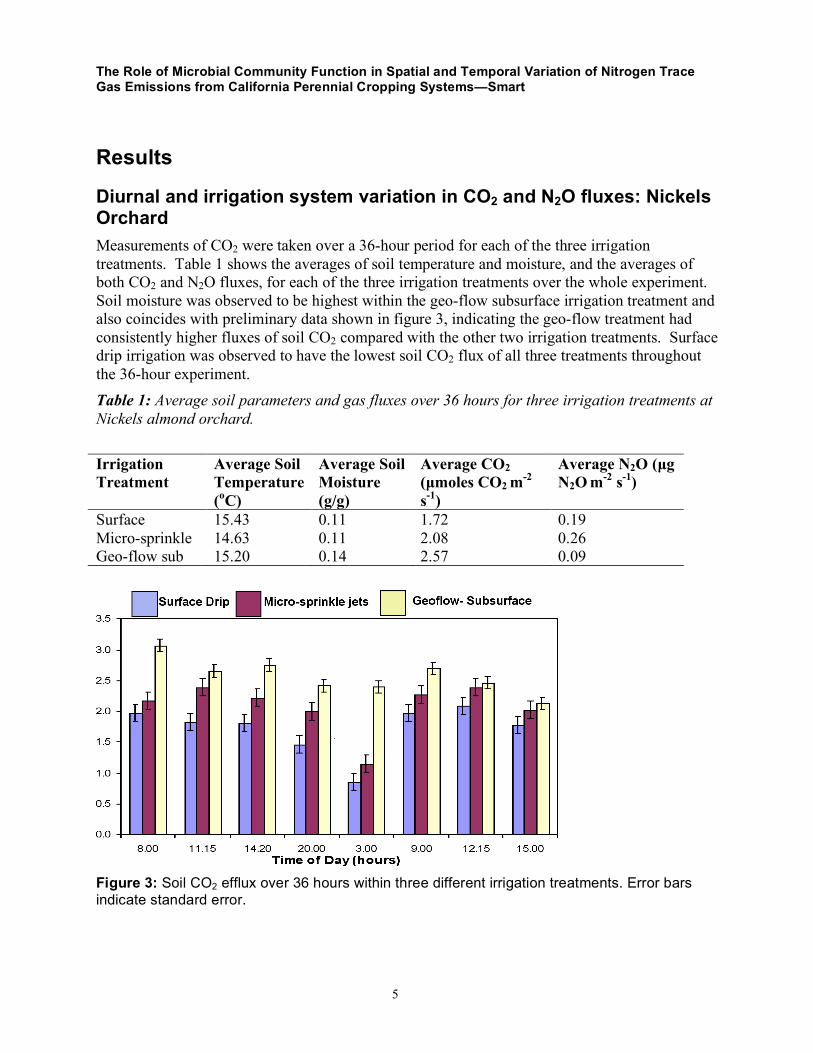
Diurnal and irrigation system variation in CO2 and N2O fluxes: Nickels Orchard Measurements of CO2 were taken over a 36-hour period for each of the three irrigation treatments. Table 1 shows the averages of soil temperature and moisture, and the averages of both CO2 and N2O fluxes, for each of the three irrigation treatments over the whole experiment. Soil moisture was observed to be highest within the geo-flow subsurface irrigation treatment and also coincides with preliminary data shown in figure 3, indicating the geo-flow treatment had consistently higher fluxes of soil CO2 compared with the other two irrigation treatments. Surface drip irrigation was observed to have the lowest soil CO2 flux of all three treatments throughout the 36-hour experiment. Table 1: Average soil parameters and gas fluxes over 36 hours for three irrigation treatments at Nickels almond orchard. Irrigation Treatment
Average Soil Temperature (oC)
Average Soil Moisture (g/g)
Average CO2 (µmoles CO2 m-2 s-1)
Average N2O (µg N2O m-2 s-1)
Surface 15.43 0.11 1.72 0.19 Micro-sprinkle 14.63 0.11 2.08 0.26 Geo-flow sub 15.20 0.14 2.57 0.09
Figure 3: Soil CO2 efflux over 36 hours within three different irrigation treatments. Error bars indicate standard error.

The Role of Microbial Community Function in Spatial and Temporal Variation of Nitrogen Trace Gas Emissions from California Perennial Cropping Systems—Smart
6
As with CO2, N2O was also measured over a 36-hour period at the Nickels almond orchard, where no significant diurnal variation was detected. Preliminary results observed in table 1 and figure 4 indicated the Micro-sprinkle irrigation treatment emitted the largest quantities of N2O on average, and throughout the whole 36-hour experiment. Geo-flow subsurface irrigation was observed to have the overall lowest emissions of N2O throughout the whole experiment and on average. Further statistical analysis of the data is currently in progress. Bi-weekly measurements (from October 2007 to present) of the two GHG’s mentioned here are currently being taken as part of the temporal aspect of the project, looking into seasonal and inter-annual variation. This data will enable us to acquire comprehensive background emissions for GHGs within the orchard and will help to establish some of the smaller spatial scale microbial work related to denitrifying communities and N2O emission pathways.
Delano diurnal and N fertilization experiment The data presented within this section of the report focuses mainly upon the Delano June 2007 diurnal and N input N2O gas flux measurements as we are currently in the process of analyzing CO2 data also obtained within the June 2007 sampling period, and we are analyzing samples from the November 2007 N input experiment also at Delano.
Figure 4: Flux of N2O emitted from soils over 36 hours within three different irrigation treatments. Error bars indicate standard error.
Results for the fertilization experiment looking into the effects of N fertilizer application upon N2O gas flux from soils in the Delano table grape vineyard are presented in figure 5. N2O fluxes from soils situated in the berm of the Delano table grape vineyard were assessed both prior and after a nitrogen fertilizer (80 kg N ha-1 ammonium nitrate) event (see fig. 5). N2O fluxes were measured diurnally in order to capture any subsequent changes in emissions relating to fertilization. No statistical difference in emissions was observed over the diurnal period; fluxes remained within error. After the application of the N fertilizer (green arrow), however, a significant increase in emissions was observed (53.78 µg N2O m-2 min-1). The application of N fertilizers has previously been shown to cause such a rapid increase of N2O emissions from agricultural soils, where increases in N2O flux have been observed previously, especially where

The Role of Microbial Community Function in Spatial and Temporal Variation of Nitrogen Trace Gas Emissions from California Perennial Cropping Systems—Smart
7
increases peak up to the first two days after application (Velthof et al. 1997). This is due to the fact that within most agricultural soils N2O is formed biogenically due to an increase in mineralized N. This N, in turn, increases microbial nitrification and denitrification rates (Mosier et al. 1998), both of which produce N2O as a product. After the initial flux, emissions remain largely constant for approximately two days and then increased slightly. A final measurement was made two weeks after the fertilizer input event when concentrations of N2O had returned to near background levels as observed prior to N input. Therefore the addition of N fertilizers will directly enhance the formation of N2O.
Figure 5: N2O flux rates and soil temperature of the table grape Delano vineyard in June 2007 pre- and post-nitrogen fertilization. The green arrow indicates the N fertilizer application event (80kg N ha -1) and error bars represent standard error of the mean (n=11). The ellipse represents N2O flux measurement two weeks after the N input event.
Microbial results Detection limit and linear ranges for each of the targeted denitrification genes are summarized below in the table. Also included in the table are typical results for the concentration of denitrification genes in an agricultural soil. Detection of denitrification genes by qPCR
* normalized for DNA extraction efficiency
Gene Range of detection (copies) Linearity (R2) Copies / g soil * nirS 54 - 5.4 x 10⁸ 0.98 5.8 ± 0.4 x10⁶
nirK 16 - 1.6 x 10⁶ 0.99 9.2 ± 0.1 x10⁵ nosZ 51 - 5.1 x 10⁶ 0.95 7.3 ± 1.6 x10⁵

The Role of Microbial Community Function in Spatial and Temporal Variation of Nitrogen Trace Gas Emissions from California Perennial Cropping Systems—Smart
8
From the table, we can calculate the ratio of the sum of nir genes to nos genes (nir:nos) to use as an indication of nitrous-oxide producing potential. Presently, we are testing the validity of this hypothesis. Nevertheless the ratio of nir:nos genes in this case is 9.2, suggesting that there is more nitrite reduction than nitrous oxide reduction leading to a net production of N2O. In order to investigate the contribution of denitrifying bacteria to N2O emissions, the ratio of nir:nos genes will be evaluated and correlated with N2O emissions.
Preliminary results for RT-QPCR have been challenging to obtain, due to the unstable nature of mRNA. 16S rRNA genes (as RNA) have been quantified in soil environments, but the denitrification genes have not yet been detected (as RNA). In preliminary results, it has been determined that agricultural soils in Yolo County contain 2.0x10⁸ 16S rRNA copies/g dry soil as DNA, but only 2.5x10⁶ 16S rRNA copies/g dry soil as RNA. This discrepancy, of two orders of magnitude, may reflect the recalcitrant nature of DNA (e.g., it persists long after the organism from which the DNA originated) or, conversely, the small active portion of the total microbial community. We are currently quantifying the abundance of the denitrification genes, nirS, nirK and nosZ, as RNA. To achieve this goal, we have determined the detection limit for RT-QPCR by preparing RNA standards by in-vitro transcription of nosZ gene fragments, quantifying nosZ RNA by Qubit fluorescence, preparing dilutions, and performing RT-QPCR as described above. The preliminary results of these calibration and detection limit experiments have indicated that the RT portion of the experiment is the bottle neck and currently has a working detection limit of 6,000 copies of nosZ RNA, versus the expected 50 copies. Current and future work is focused on improving this detection limit, followed by optimization of RNA extraction from soil for use in RT-QPCR experiments to answer questions concerning the microbial ecology of denitrifying bacteria.
Discussion
Spatial and temporal variation in CO2 and N2O fluxes Our results contribute to a need to assess GHG emissions from all agricultural sectors in order for compliance with goals set out in the California Global Warming Solutions Act of 2006 or AB32. Agricultural activities have been estimated to contribute to only approximately 5% of anthropogenic CO2 production, approximately 45 to 55% of CH4 production (rice and cattle), but up to 70% of total anthropogenic N2O production comes from agricultural related activities (IPCC, 2001). This quantity, and the factors that contribute to its emission, remain very poorly constrained (Olivier et al. 1990; Kroeze et al. 1999).
Agricultural soils alone account for anywhere from 9 to 40% of the total global estimated N2O budget based on the above-cited assessments. A very large fraction of anthropogenic-derived N2O can surely be attributed to the nearly 80 Tg N (Tg = 109 grams) of nitrogen fertilizers generated and used in agriculture each year. Temporal and spatial variation in production during fertilization events has restricted our ability to accurately assess N2O production in a way that can partition it among agricultural sectors. The Intergovernmental Panel on Climate Change (IPCC, 2001) generally adheres to a standard methodology of estimating N2O emissions from agricultural soils as a constant fraction (1.25%) of the anthropogenic N input. Yet, some investigations we are aware of have shown that, as much as 60% of N applied with water can be lost to denitrification. We have measured N2O loss from drip irrigation applications in California

The Role of Microbial Community Function in Spatial and Temporal Variation of Nitrogen Trace Gas Emissions from California Perennial Cropping Systems—Smart
9
vineyards that accounted for roughly 9.25% of the applied N. But this was from a wine grape vineyard in which soil temperatures would be lower and which would receive only half the quantity of N that was applied to the Delano table grape vineyard. The IPCC approach is recognized to be insensitive to management practices and a few investigations of Midwest corn cultivation suggest the percentage of the total N emitted as N2O may decline with increasing N-inputs (Del Grosso 2006).
Our results thus make a strong contribution in efforts to mitigate GHG emissions from the agriculture sector: Preliminary results indicate the subterranean drip method of irrigation may diminish N2O emissions (fig. 4) but further study is needed particularly during fertigation events. The exercises we are carrying out with respect to diurnal variation in N2O and CO2 fluxes (fig. 5) will assist in modeling efforts whose goal is to estimate the contribution perennial crops make to GHG emissions in California and thus point to areas in which mitigation efforts can be most effective.
References Del Grosso, S.J., et al. 2006. DAYCENT national-scale simulations of nitrous oxide emissions
from cropped soils in the United States. Journal of Environmental Quality 35(4): p. 1451-1460.
Henry, S., E. Baudoin, et al. 2005. Quantification of denitrifying bacteria in soils by nirK gene targeted real-time PCR (vol 59, pg 327, 2004). Journal of Microbiological Methods 61(2): 289-290.
Henry, S., D. Bru, et al. 2006. Quantitative detection of the nosZ gene, encoding nitrous oxide reductase, and comparison of the abundances of 16S rRNA, narG, nirK, and nosZ genes in soils. Applied Environmental Microbiology 72(8): 5181-5189.
Hutchinson, G. L. and A. R. Mosier. 1981. Improved soil cover method for field measurement of nitrous-oxide fluxes. Soil Science Society of America Journal 45(2): 311-316.
IPCC, Climate Change 2001: The scientific basis. Contribution of Working Group I to the Third Assessment Report of the Intergovernmental Panel on Climate Change. Cambridge: Cambridge University Press.
Ishizuka, S., H. Tsuruta, et al. 2002. An intensive field study on CO2, CH4, and N2O emissions from soils at four land-use types in Sumatra, Indonesia. Global Biogeochemical Cycles 16(3).
Kandeler, E., K. Deiglmayr, D. Tscherko, D. Bru, L. Philippot. 2006. Abundance of narG, nirS, nirK, and nosZ genes of denitrifying bacteria during primary successions of a glacier foreland. Applied Environmental Microbiology 72(9): 5957-5962.
Kroeze, C., A. Mosier and L. Bouwman. 1999. Closing the global N2O budget: A retrospective analysis 1500-1994. Global Biogeochemical Cycles 13(1): p. 1-8.
Luo, L. and X. Zhou. 2007. Soil respiration and the environment. Burlington, M.A.: Academic Press.
Mosier, A., C. Kroeze, C. Nevison, O. Oenema, S. Seitzinger and O. van Cleemput. 1998. Closing the global N2O budget: nitrous oxide emissions through the agricultural nitrogen cycle. Nutrient Cycling in Agroecosystems 52: 225–248.

The Role of Microbial Community Function in Spatial and Temporal Variation of Nitrogen Trace Gas Emissions from California Perennial Cropping Systems—Smart
10
Nicol, G.W., D. Tscherko, et al. 2005. Primary succession of soil Crenarchaeota across a receding glacier foreland. Environmental Microbiology 7(3): 337-347.
Olivier, J.G.J., et al. 1998. Global air emission inventories for anthropogenic sources of NOx, NH3 and N2O in 1990. Environmental Pollution 102: p. 135-148.
Philippot, L. and S. Hallin. 2005. Finding the missing link between diversity and activity using denitrifying bacteria as a model functional community. Current Opinion in Microbiology 8(3): 234-239.
Suzuki, M.T., L.T. Taylor and E.F. DeLong. 2000. Quantitative analysis of small-subunit rRNA genes in mixed microbial populations via 5 '-nuclease assays. Applied Environmental Microbiology 66: 4605-4614
Velthof, G.L., O. Oenema, R. Postma and M.L. Van Beusichem. 1997. Effects of type and amount of applied nitrogen fertilizer on nitrous oxide fluxes from intensively managed grassland. Nutrient Cycling in Agroecosystems 46: 257-267.
This research was funded by the Kearney Foundation of Soil Science: Understanding and Managing Soil-Ecosystem Functions Across Spatial and Temporal Scales, 2006-2011 Mission (http://kearney.ucdavis.edu). The Kearney Foundation is an endowed research program created to encourage and support research in the fields of soil, plant nutrition, and water science within the Division of Agriculture and Natural Resources of the University of California.