marna kearney - tips
TRANSCRIPT
P A P E R S
TIPS
2 0 0 32 0 0 3F O R U M
Zero Rating Food: A Computable General Equilibrium Analysis
for South Africa
Marna Kearney
Development Policy Research UnitSchool of Economics, University of Cape Town
1
Zero Rating Food: A Computable General Equilibrium Analysis for South Africa
By
Marna Kearney
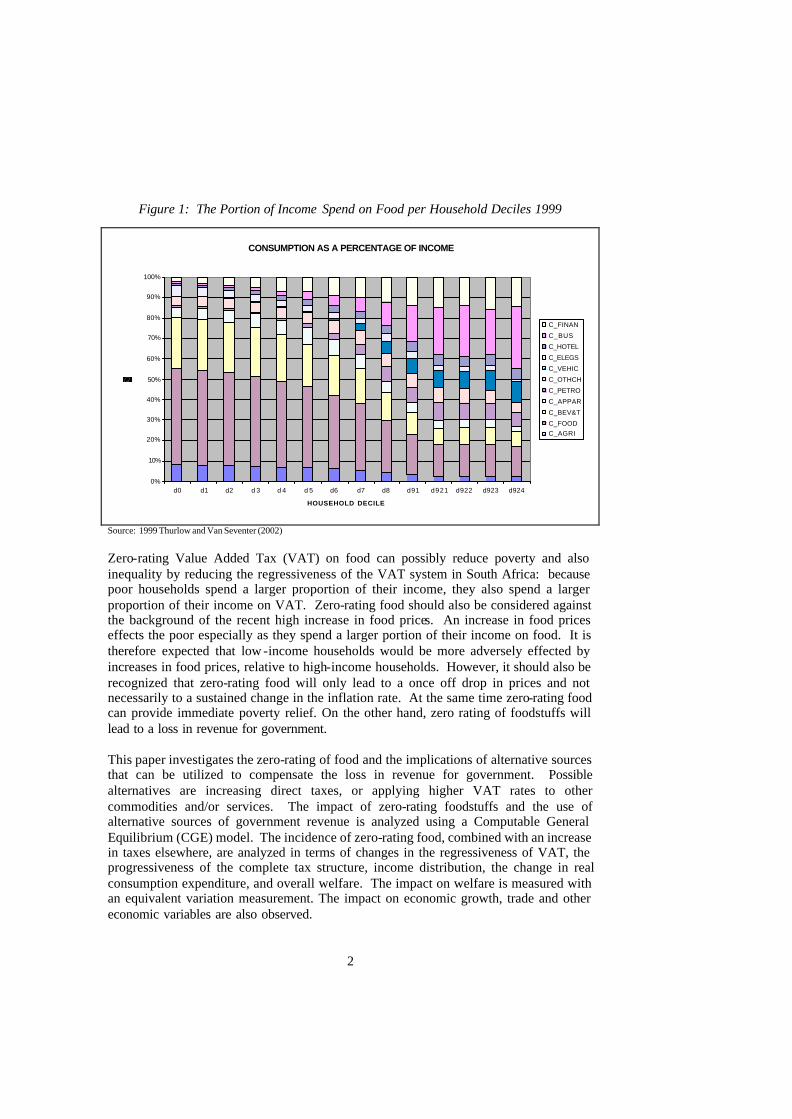
ABSTRACT Poverty in South Africa is severe. Zero-rating food can possibly reduce poverty as poor households spend the largest proportion of their income on food. Zero-rating food can also reduce the regressiveness of Value Added Tax (VAT) for the same reason. However, zero-rating food will results in a loss in revenue for government. Zero-rating food should be considered in conjuction with alternative sourc es of revenue, such as increasing direct taxes proportionately or increasing VAT on all other commodities, or alternatively increasing VAT on commodity or services used mostly by high-income households. A Computable General Equilibrium (CGE) model is used to analyze the combined effect on zero-rating food and using alternative revenue sources to compensate for the loss in revenue. The results indicate that zero-rating food, while increasing VAT on either business or financial services could turn a regressive VAT into a progressive VAT. However, this would require excessive high increases in the statutory VAT rates of these services. More realistic options investigated are increasing direct taxes, or alternatively increasing VAT on all other commodities to 16 percent. Increasing direct taxes is most successful in creating a more progressive tax structure, and still generating a positive impact on GDP. The results indicate that zero-rating food combined with a proportional percentage increase in direct taxes can improve the welfare of poor households, without impacting negatively on other households. 1. Introduction In a report on poverty published by Statistics South Africa (Stats SA) in 2000, it is stated that 48, 8 percent of South Africans spend less than R250 per month - the per capita poverty line (Stats SA, 2000: 2). Low -income households consume the largest portion of their income, with food being the largest consumption expenditure item. Figure 1 shows the portion of household income spend on food for each household decile. Low-income households (income deciles zero to four) spend up to 40 percent of their income on food compared to high-income households (deciles eight and nine), who only spend 9 percent.
2
Figure 1: The Portion of Income Spend on Food per Household Deciles 1999
CONSUMPTION AS A PERCENTAGE OF INCOME
0%
10%
20%
30%
40%
50%
60%
70%
80%
90%
100%
d0 d1 d2 d 3 d 4 d 5 d6 d7 d8 d91 d921 d922 d923 d924
HOUSEHOLD DECILE
C_FINAN
C_BUS
C_HOTEL
C_ELEGS
C_VEHIC
C_OTHCH
C_PETRO
C_APPAR
C_BEV&T
C_FOODC_AGRI
Source: 1999 Thurlow and Van Seventer (2002) Zero-rating Value Added Tax (VAT) on food can possibly reduce poverty and also inequality by reducing the regressiveness of the VAT system in South Africa: because poor households spend a larger proportion of their income, they also spend a larger proportion of their income on VAT. Zero-rating food should also be considered against the background of the recent high increase in food prices. An increase in food prices effects the poor especially as they spend a larger portion of their income on food. It is therefore expected that low -income households would be more adversely effected by increases in food prices, relative to high-income households. However, it should also be recognized that zero-rating food will only lead to a once off drop in prices and not necessarily to a sustained change in the inflation rate. At the same time zero-rating food can provide immediate poverty relief. On the other hand, zero rating of foodstuffs will lead to a loss in revenue for government. This paper investigates the zero-rating of food and the implications of alternative sources that can be utilized to compensate the loss in revenue for government. Possible alternatives are increasing direct taxes, or applying higher VAT rates to other commodities and/or services. The impact of zero-rating foodstuffs and the use of alternative sources of government revenue is analyzed using a Computable General Equilibrium (CGE) model. The incidence of zero-rating food, combined with an increase in taxes elsewhere, are analyzed in terms of changes in the regressiveness of VAT, the progressiveness of the complete tax structure, income distribution, the change in real consumption expenditure, and overall welfare. The impact on welfare is measured with an equivalent variation measurement. The impact on economic growth, trade and other economic variables are also observed.
3
2. Restructuring Value Added Tax The plan to change from general sales tax (GST) to value added tax was announced in the early 90s. VAT was implemented on 30 September 1991 at a rate of 10 percent. The economic debate on VAT mainly focused on the redistributive nature of VAT. VAT is in nature regressive unless specific steps, like zero-rating essential foodstuff, are taken. This is the reason why initially when VAT was imposed certain food items were zero-rated. Brown bread, maize meal, samp, mealie rice, dried mealies, dried beans, lentils, pilchards, milk powder, milk, rice, unprocessed vegetables and fruit, vegetable oil, and eggs are some of the food items zero-rated. (SA Tax, 2001:Schedule 2 Part B). The latest zero-rating was paraffin in 2001, to further assist poor households (RSA, 2001). However, the fiscal authorities stated early 2002, that there is no real evidence that the advantages of zero rating paraffin actually reached poor households as it is intended to. It was also indicated that (at that time) no additional social grant scheme or direct transfers to poor households would take place, as it was not clear that this would be financially sustainable (Finansies & Tegniek, 2002). Fourie and Owen (1993) came to the conclusion that VAT is mildly regressive, and that zero rating, or applying differential VAT rates for different goods will reduce some of the regressiveness. On the other hand, the advantages of such a tax system must not be eroded by administrative complications, or practical applicability that differential rates or zero-rating would impose. Zero-rating or differential rates might also create non-compliance and tax evasion. Lastly Fourie and Owen (1993), stressed that direct social transfers can achieve the social goals of zero rating, instead. Other authors such as Sartorius von Bach and Van Zyl (1994) also indicated that zero rating foodstuffs could achieve higher equality. However, zero-rating all foodstuffs, in addition to those already zero rated, will result in a loss in revenue for government. VAT is an important revenue source for government. It is the second most significant revenue source for the government after direct income tax and in 2002 contributed 25 percent to total tax revenue (SARB, 2003: S-54). Also, the government sees VAT as a dependable and broad base tax revenue source (RSA, 2002: 17). Therefore, it is important to off-set any losses in revenue due to the zero rating of foodstuffs, by alternative sources. Alternative sources that will be investigated in this paper are increasing direct taxes and increasing VAT on other services. Direct taxes will be proportionally changed (increased) with an equal percentage, keeping the progressiveness of direct taxes in tact. Another alternative that is investigated is applying higher VAT rates to commodities or services that are consumed mainly by higher income groups. Although various authors suggest that zero-rating food would reduce the regressiveness of VAT and result in greater equality, the issue has not been investigated in an economy-wide framework. This paper will investigate whether or not zero-rating food can provide immediate poverty relief, whether or not this would reduce regressiveness and inequality (especially when combined with other taxes), as well as the overall impact of such a policy measure on welfare. The impact of zero-rating on the economy at large and industry is also assessed.
4
3. Using a Computable General Equilibrium Model to Simulate Changes in
VAT A computable general equilibrium (CGE) model is used to measure the impact of changes in VAT on the economy, and specifically income distribution. CGE models link prices with taxes making them useful for the purpose of evaluating changes in the tax structure. They also allow for the evaluation of the impact of policy on distribution, because of the disaggregation of households in the model. 3.1. The Model In this paper a CGE model developed by Thurlow and van Seventer (2002) will be used.1 The model is based on a standard CGE model developed by Löfgren et al (2001). It follows the neoclassical-structuralist modeling tradition that was originally presented by Dervis, de Melo and Robinson (1982). The model employs the disaggregation of commodities, activities, factors and households as specified in a 1999 social accounting matrix (SAM) of South Africa, developed specifically for the model. The SAM identifies for 43 commodities and activities at industry level; factors included are capital, high-skilled- , semi-skilled-, and unskilled labor. The households are broken dow n into ten income deciles, with the tenth decile divided further into a 5 percent group and 4 groups representing 1.25% of the income earning households. Other institutions included in the SAM are firms, the government and the rest of the world. 3.2. Additions to the Model for the Purpose of this Paper The South African model includes commodity taxes in an aggregate form. However, for the purpose of this paper it is necessary to isolate VAT, as the aim is to zero-rate VAT on food. VAT data for 1999 was obtained from the South African Standard Industry Database (TIPS, 2003). The first step is adjusting the SAM to separate VAT and other commodity taxes. Next, the CGE model is adjusted to include a separate specification of VAT. To do the simulation in this study it is necessary to include a statutory VAT rate variable, as well as a suitable equation linking the statutory VAT rate with the actual VAT (collection) rate. The following adjustments to the model were made: 1. The following equation is added:
)(*)()( cleakagecstatvatctvat =
where
)(ctvat is the actual VAT rate
1 For a detailed discussion of the South African CGE model see Thurlow and van Seventer (2002).
5
)(cstatvat is the statutory VAT rate )(cleakage is the ratio of the actual VAT rate to the statutory VAT rate
The parameter )(ctq in the model is now equal to other commodity taxes (excluding VAT). Other commodity taxes specific to South Africa would include the fuel levy, excise duties, and other taxes on products.
2. )(cstatvat is introduced in the model as a variable, since some simulations
required the statutory VAT rate on certain commodities to adjust to absorb the loss in revenue due to the zero-rating of food. )(cstatvat is, however, fixed (i.e., a fixed variable) so that it behaves as a parameter in the model.
The last step is calibrating the new parameter )(cleakage and variable )(cstatvat . The VAT data included in the SAM is actual VAT receipts and therefore the VAT rate calibrated in the model would be an actual (or effective) value-added tax rate.
)(cleakage is calibrated as a ratio of the value of VAT revenues to total consumption expenditure divided by )(cstatvat the statutory VAT rate, which is initially set equal to 14 percent for all commodities. Finally, VAT is now also identified separately in the expenditures on commodities by households as well as in government revenue. 3.3. The Simulations Zero-rating occurs when the rate of tax applied to sales is set to zero, though credit is still given for taxes paid on inputs. (Ebrill et al, 2001: 3, Davis and Kay, 1985: 5, SARS, 2003). When the commodity is zero-rated, the producers are still allowed to receive a credit for inputs and VAT is still equivalent to a consumption tax (Gottfried and Wiegard, 1990: 2). For the purpose of this paper, however, VAT is modeled as a consumption tax, as it is levied on final demand. First the impact of zero-rating food without any compensating tax adjustment is simulated under the heading: ZEROFOOD. We then simulate zero-rating food with alternatives to offset the loss in revenue for government. The following alternatives are investigated: (1) Direct Taxes, labeled: ZERODIRECT Food is zero-rated and direct taxes are proportionally increased with an equal percentage. Increasing direct taxes with an equal percentage points lead to a smaller absolute increase for lower-income groups, and a higher increase for higher-income groups, thereby maintaining progressiveness in the tax system.
6
(2) Increased VAT rate on Commodities Intensively Used by High-Income Households (ZEROBUS and ZEROFIN)
As can be seen in Figure 1, high-income groups spend a larger portion of their income on business services and financial service compared to low-income groups. Increasing VAT on business services or alternatively financial services can possibly lead to equity gains. This approach is followed as an alternative to taxing luxury items at a higher rate. Examples of business services include accounting, bookkeeping, legal services, engineering, marketing, and consulting services. Financial services are not easily taxed since it is difficult to determine the value of the transactions. In South Africa not all financial services are taxable under VAT. Some of the services included are the sale of cheque book covers, charges for the provision of information to third parties, installation and rental of electronic payment devices, brokerage fees on derivative trading, cash value of rental agreements and vehicle maintenance agreements, rental of safety deposit boxes, bureau fees on payroll services (International VAT Monitor, 1995: 376). The list is not exhaustive. However, increased VAT receipts on financial services can also be achieved by broadening the VAT base, including more services in the tax base. (3) Statutory VAT Rate Increase (ZEROVAT) Another option is increasing the statutory VAT rate on all commodities not already zero-rated or excluded. Since this scenario does not allow for further exemption of specific commodities consumed by poor households we would expect a more regressive outcome in terms of welfare compared to the other scenarios mentioned above. 3.4. Economy wide adjustment mechanisms A number of economy wide adjustment mechanisms (rules or constraints) are imposed on the model to achieve macroeconomic consistency. The choice of constraints will determine how the macroeconomic variables adjust in the modeled economy (Thurlow and van Seventer, 2002: 19). The South African CGE model allows one to specify different adjustment mechanisms for factor markets, the rest of the world, the government balance as well as domestic savings and investment. With respect to factor markets: capital and high-skilled labor will be assumed fully employed and activity specific, while unskilled and semi-skilled labor will be assumed unemployed and mobile. For capital and high-skilled labor the adjusting variable is wages; while for semi- and unskilled labor the adjustment takes place by employment, with wages rates assumed fixed. With respect to the rest of the world: the exchange rate will be assumed flexible, while foreign savings are fixed. This adjustment rule follows from observations made by Davies & van Seventer (2003) who noted that foreign savings as defined by the national accounts behaved relatively constant over the last 10 years.
7
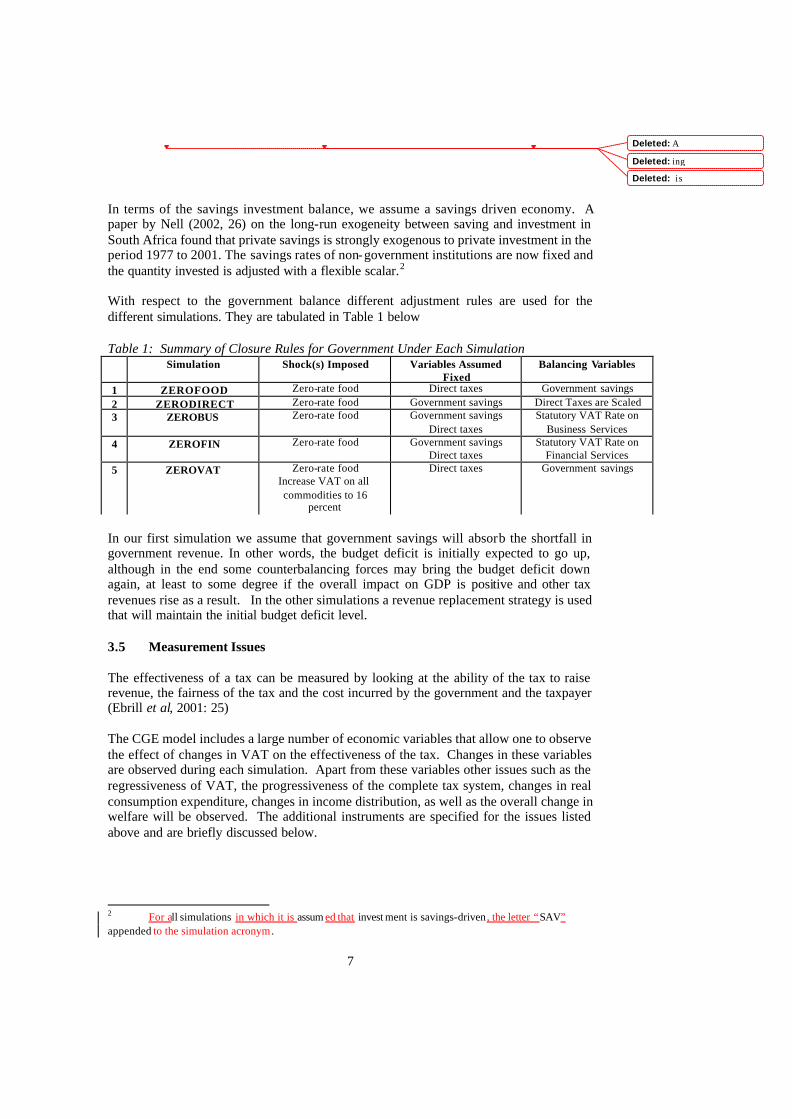
In terms of the savings investment balance, we assume a savings driven economy. A paper by Nell (2002, 26) on the long-run exogeneity between saving and investment in South Africa found that private savings is strongly exogenous to private investment in the period 1977 to 2001. The savings rates of non-government institutions are now fixed and the quantity invested is adjusted with a flexible scalar.2 With respect to the government balance different adjustment rules are used for the different simulations. They are tabulated in Table 1 below Table 1: Summary of Closure Rules for Government Under Each Simulation
Simulation Shock(s) Imposed Variables Assumed Fixed
Balancing Variables
1 ZEROFOOD Zero-rate food Direct taxes Government savings 2 ZERODIRECT Zero-rate food Government savings Direct Taxes are Scaled 3 ZEROBUS Zero-rate food Government savings
Direct taxes Statutory VAT Rate on
Business Services 4 ZEROFIN
Zero-rate food Government savings
Direct taxes Statutory VAT Rate on
Financial Services 5 ZEROVAT Zero-rate food
Increase VAT on all commodities to 16
percent
Direct taxes Government savings
In our first simulation we assume that government savings will absorb the shortfall in government revenue. In other words, the budget deficit is initially expected to go up, although in the end some counterbalancing forces may bring the budget deficit down again, at least to some degree if the overall impact on GDP is positive and other tax revenues rise as a result. In the other simulations a revenue replacement strategy is used that will maintain the initial budget deficit level. 3.5 Measurement Issues The effectiveness of a tax can be measured by looking at the ability of the tax to raise revenue, the fairness of the tax and the cost incurred by the government and the taxpayer (Ebrill et al, 2001: 25) The CGE model includes a large number of economic variables that allow one to observe the effect of changes in VAT on the effectiveness of the tax. Changes in these variables are observed during each simulation. Apart from these variables other issues such as the regressiveness of VAT, the progressiveness of the complete tax system, changes in real consumption expenditure, changes in income distribution, as well as the overall change in welfare will be observed. The additional instruments are specified for the issues listed above and are briefly discussed below.
2 For all simulations in which it is assum ed that invest ment is savings-driven, the letter “SAV” appended to the simulation acronym.
Deleted: A
Deleted: ing
Deleted: is
8
3.5.1 Regressiveness Regressiveness is measured by taking each household group’s expenditure on VAT as a percentage of their total income respectively. The total expenditure on VAT for each household will be calculated by the CGE model as follows:
Regress(h) )(
)(*)(*)(*),(
hYI
cleakagecstatvatcPQhcQHc
∑=
where
Regress(h) measures the regressiveness of commodity taxes for each
household ),( hcQH is the quantity of commodity c consumed by household h
)(cPQ is the composite price of commodity c )(cstatvat is the statutory VAT rate for commodity c )(cleakage is the actual VAT receipts for commodity c
)(hYI is the total income of households.
In other words, the actual payment of VAT by a household is calculated by taking the sum of the quantity c onsumed by that household of a specific commodity and multiplying it with the output price (before taxes) as well as the actual VAT rate on that commodity. The actual payment of VAT by a household category is then divided by the total income of that household to get the measure of regressiveness. 3.5.2 Progressiveness The progressiveness of the complete tax system is measured by taking the total payment of taxes by each household as a percentage of total income.
Progress(h) )(
)(*)()))()(*)((*)(*),((
hYI
hYIhtinsctqcleakagecstatvatcPQhcQHc
++=
∑
where
Progress(h) measures the regressiveness of VAT for each household
),( hcQH is the quantity of commodity c consumed by household h )(cPQ is the composite price of commodity c
)(cstatvat is the statutory VAT rate for commodity c )(cleakage is the actual VAT receipts for commodity c
)(hYI is the total income of households )(htins is the average income tax rate of households

9
3.5.3 Distribution A set of Gini Coefficients is used to measure the impact of policy changes on distribution. A Gini Coefficient measures the distance between the relevant Lorenz curve and the 45º line of equal distribution (Creedy, 2001: 25). The value of a Gini coefficient lies between 0 and 1 where 0 indicates perfect equality and 1 perfect inequality. (Shoven and Whalley, 1992: 130-131). The Gini Coefficient can also be measured as follows:
∑
−+−+=
N
i
iy
y
yiN
NNGini )1(
211
2
where
yGini is obtained by ranking incomes according to values iy
iy is the ranked income level of observation i
y is the mean level of income N is the number of (household) observations (Creedy, 2001: 25) The ability of a tax structure to redistribute can be summarized using a L-measure. The L-measure is also called the Reynolds-Smolensky measure and is calculated as follows:
ydy GiniGiniL −=
where
yGini is the pre-tax Gini Coefficient
ydGini is the post-tax Gini Coefficient The L-measure gives the extent of the change in inequality arising from the tax system. (Creedy, 2001: 25-26). 3.5.4 Welfare With CGE models an exact welfare comparison between two equilibrium situations can be achieved. The equivalent variation (EV) (as initially defined by Hicks (1939)) is often used to determine the welfare effect. The equivalent variation asks the question: “How much money is a particular change equivalent to?” The equivalent variation measures the amount after the price change that the household would be prepared to pay to return to old prices (Creedy, 1999: 12). The South African CGE model includes an indirect compensation (IC) and EV measurement. IC measures the income needed at base prices to generate same welfare as before the simulation while EV measures the income change that, at base prices, would be equivalent to the change calculated for the simulation (Löfgren et al, 2001). The standard model also gives the EV value as a percentage of the
10
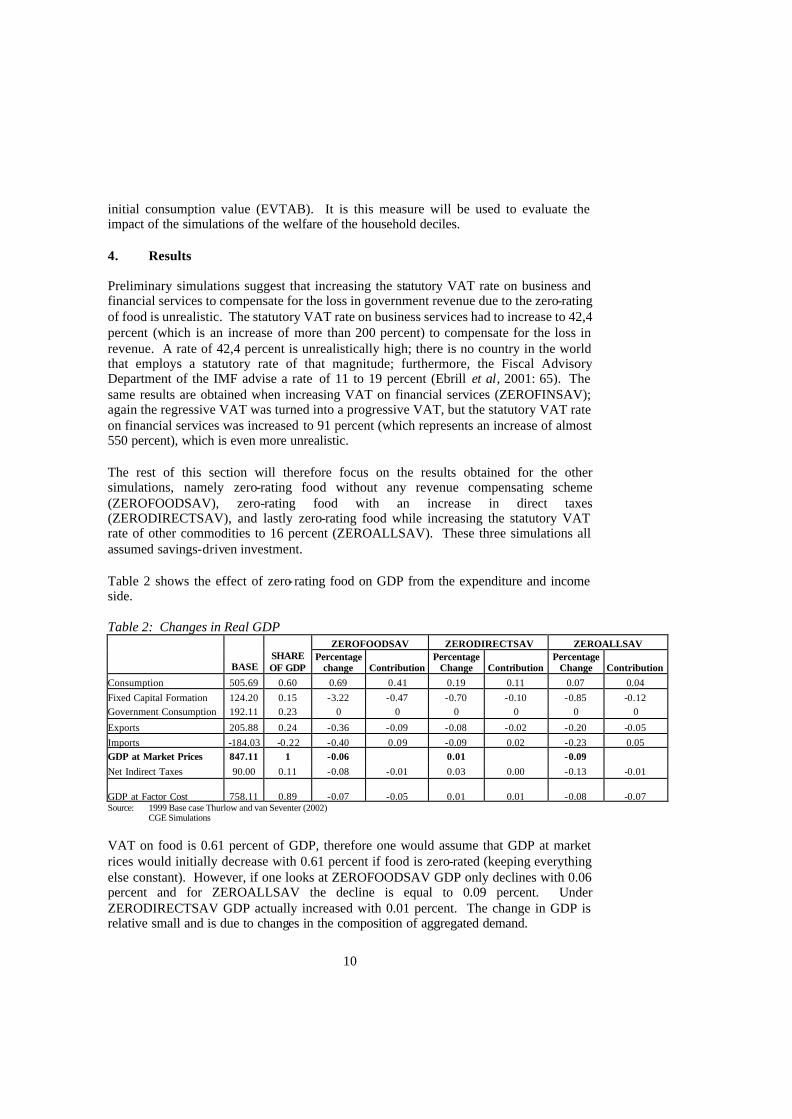
initial consumption value (EVTAB). It is this measure will be used to evaluate the impact of the simulations of the welfare of the household deciles. 4. Results Preliminary simulations suggest that increasing the statutory VAT rate on business and financial services to compensate for the loss in government revenue due to the zero-rating of food is unrealistic. The statutory VAT rate on business services had to increase to 42,4 percent (which is an increase of more than 200 percent) to compensate for the loss in revenue. A rate of 42,4 percent is unrealistically high; there is no country in the world that employs a statutory rate of that magnitude; furthermore, the Fiscal Advisory Department of the IMF advise a rate of 11 to 19 percent (Ebrill et al, 2001: 65). The same results are obtained when increasing VAT on financial services (ZEROFINSAV); again the regressive VAT was turned into a progressive VAT, but the statutory VAT rate on financial services was increased to 91 percent (which represents an increase of almost 550 percent), which is even more unrealistic. The rest of this section will therefore focus on the results obtained for the other simulations, namely zero-rating food without any revenue compensating scheme (ZEROFOODSAV), zero-rating food with an increase in direct taxes (ZERODIRECTSAV), and lastly zero-rating food while increasing the statutory VAT rate of other commodities to 16 percent (ZEROALLSAV). These three simulations all assumed savings-driven investment. Table 2 shows the effect of zero- rating food on GDP from the expenditure and income side. Table 2: Changes in Real GDP
ZEROFOODSAV ZERODIRECTSAV ZEROALLSAV
BASE SHARE OF GDP
Percentage change Contribution
Percentage Change Contribution
Percentage Change Contribution
Consumption 505.69 0.60 0.69 0.41 0.19 0.11 0.07 0.04 Fixed Capital Formation 124.20 0.15 -3.22 -0.47 -0.70 -0.10 -0.85 -0.12 Government Consumption 192.11 0.23 0 0 0 0 0 0
Exports 205.88 0.24 -0.36 -0.09 -0.08 -0.02 -0.20 -0.05 Imports -184.03 -0.22 -0.40 0.09 -0.09 0.02 -0.23 0.05 GDP at Market Prices 847.11 1 -0.06 0.01 -0.09 Net Indirect Taxes 90.00 0.11 -0.08 -0.01 0.03 0.00 -0.13 -0.01
GDP at Factor Cost 758.11 0.89 -0.07 -0.05 0.01 0.01 -0.08 -0.07 Source: 1999 Base case Thurlow and van Seventer (2002) CGE Simulations VAT on food is 0.61 percent of GDP, therefore one would assume that GDP at market rices would initially decrease with 0.61 percent if food is zero-rated (keeping everything else constant). However, if one looks at ZEROFOODSAV GDP only declines with 0.06 percent and for ZEROALLSAV the decline is equal to 0.09 percent. Under ZERODIRECTSAV GDP actually increased with 0.01 percent. The change in GDP is relative small and is due to changes in the composition of aggregated demand.
11
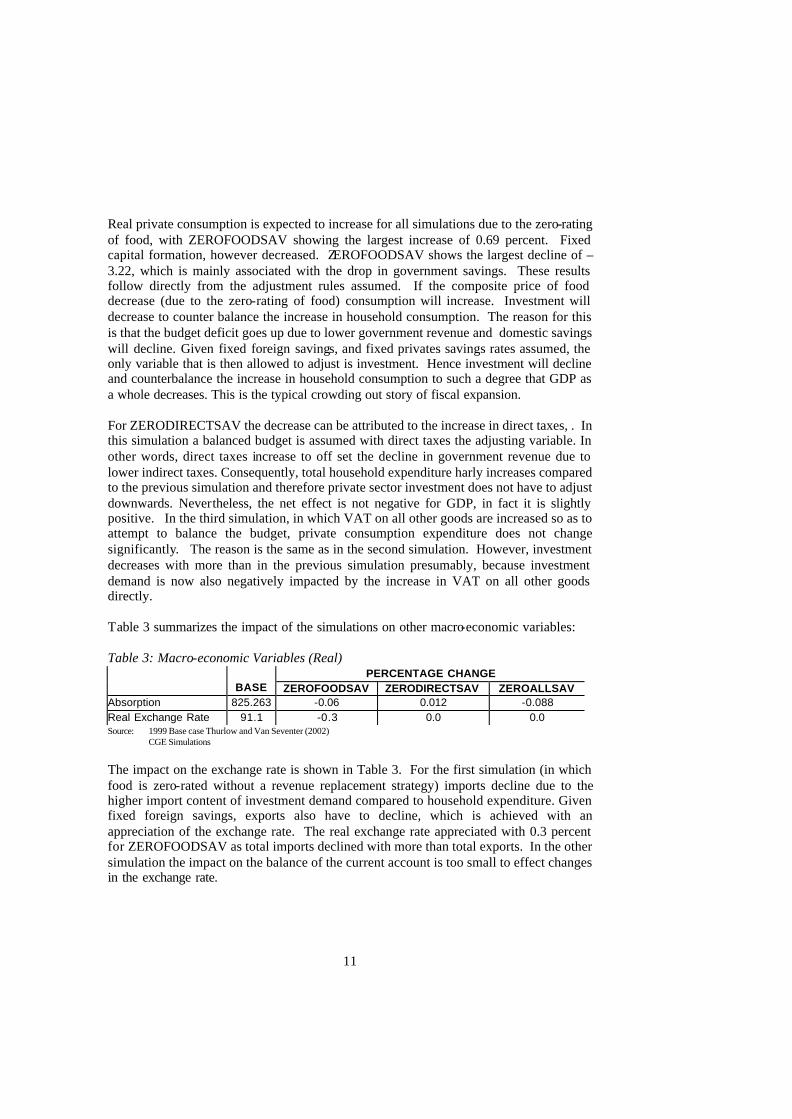
Real private consumption is expected to increase for all simulations due to the zero-rating of food, with ZEROFOODSAV showing the largest increase of 0.69 percent. Fixed capital formation, however decreased. ZEROFOODSAV shows the largest decline of –3.22, which is mainly associated with the drop in government savings. These results follow directly from the adjustment rules assumed. If the composite price of food decrease (due to the zero-rating of food) consumption will increase. Investment will decrease to counter balance the increase in household consumption. The reason for this is that the budget deficit goes up due to lower government revenue and domestic savings will decline. Given fixed foreign savings, and fixed privates savings rates assumed, the only variable that is then allowed to adjust is investment. Hence investment will decline and counterbalance the increase in household consumption to such a degree that GDP as a whole decreases. This is the typical crowding out story of fiscal expansion. For ZERODIRECTSAV the decrease can be attributed to the increase in direct taxes, . In this simulation a balanced budget is assumed with direct taxes the adjusting variable. In other words, direct taxes increase to off set the decline in government revenue due to lower indirect taxes. Consequently, total household expenditure harly increases compared to the previous simulation and therefore private sector investment does not have to adjust downwards. Nevertheless, the net effect is not negative for GDP, in fact it is slightly positive. In the third simulation, in which VAT on all other goods are increased so as to attempt to balance the budget, private consumption expenditure does not change significantly. The reason is the same as in the second simulation. However, investment decreases with more than in the previous simulation presumably, because investment demand is now also negatively impacted by the increase in VAT on all other goods directly. Table 3 summarizes the impact of the simulations on other macro-economic variables: Table 3: Macro-economic Variables (Real)
PERCENTAGE CHANGE BASE ZEROFOODSAV ZERODIRECTSAV ZEROALLSAV
Absorption 825.263 -0.06 0.012 -0.088 Real Exchange Rate 91.1 -0.3 0.0 0.0 Source: 1999 Base case Thurlow and Van Seventer (2002) CGE Simulations The impact on the exchange rate is shown in Table 3. For the first simulation (in which food is zero-rated without a revenue replacement strategy) imports decline due to the higher import content of investment demand compared to household expenditure. Given fixed foreign savings, exports also have to decline, which is achieved with an appreciation of the exchange rate. The real exchange rate appreciated with 0.3 percent for ZEROFOODSAV as total imports declined with more than total exports. In the other simulation the impact on the balance of the current account is too small to effect changes in the exchange rate.
12
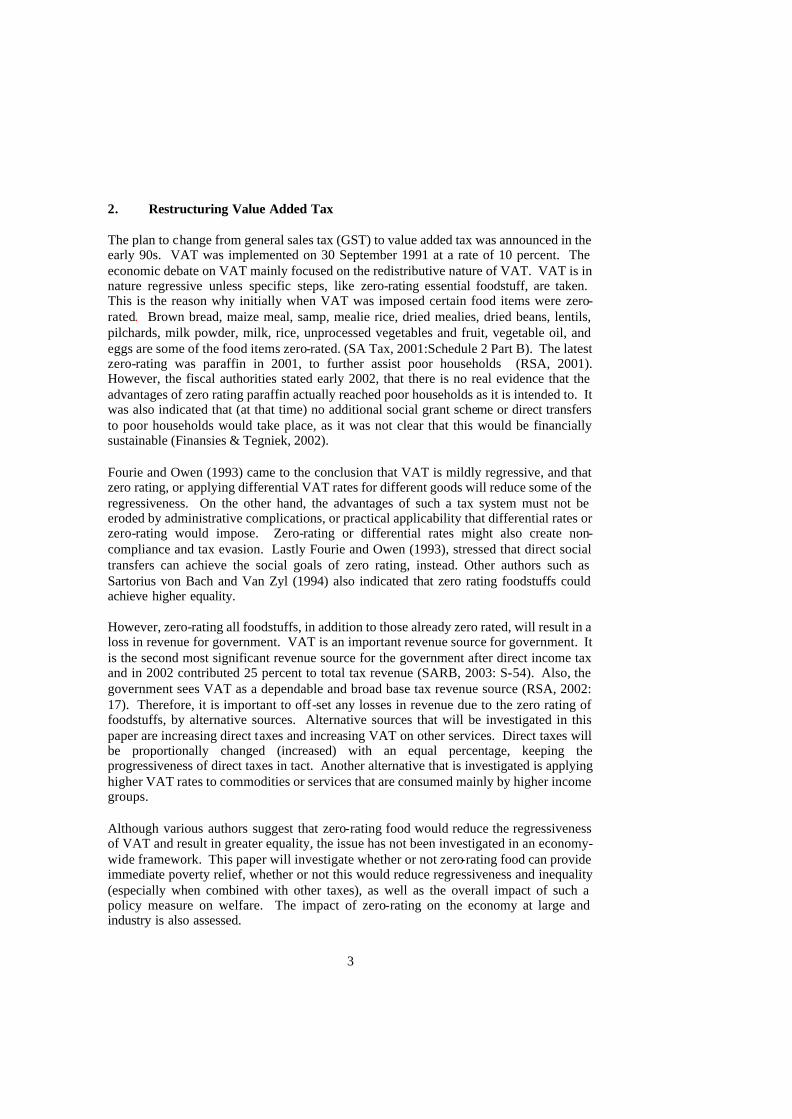
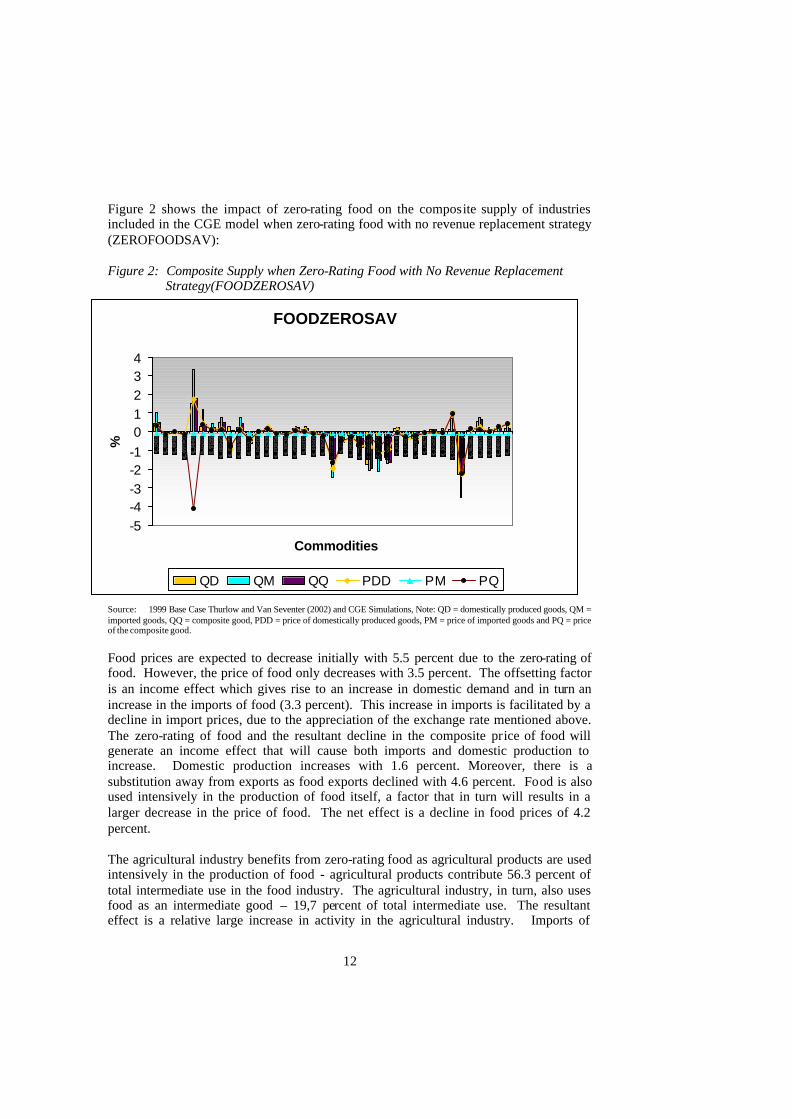
Figure 2 shows the impact of zero-rating food on the composite supply of industries included in the CGE model when zero-rating food with no revenue replacement strategy (ZEROFOODSAV): Figure 2: Composite Supply when Zero-Rating Food with No Revenue Replacement Strategy(FOODZEROSAV)
Source: 1999 Base Case Thurlow and Van Seventer (2002) and CGE Simulations, Note: QD = domestically produced goods, QM = imported goods, QQ = composite good, PDD = price of domestically produced goods, PM = price of imported goods and PQ = price of the composite good. Food prices are expected to decrease initially with 5.5 percent due to the zero-rating of food. However, the price of food only decreases with 3.5 percent. The offsetting factor is an income effect which gives rise to an increase in domestic demand and in turn an increase in the imports of food (3.3 percent). This increase in imports is facilitated by a decline in import prices, due to the appreciation of the exchange rate mentioned above. The zero-rating of food and the resultant decline in the composite price of food will generate an income effect that will cause both imports and domestic production to increase. Domestic production increases with 1.6 percent. Moreover, there is a substitution away from exports as food exports declined with 4.6 percent. Food is also used intensively in the production of food itself, a factor that in turn will results in a larger decrease in the price of food. The net effect is a decline in food prices of 4.2 percent. The agricultural industry benefits from zero-rating food as agricultural products are used intensively in the production of food - agricultural products contribute 56.3 percent of total intermediate use in the food industry. The agricultural industry, in turn, also uses food as an intermediate good – 19,7 percent of total intermediate use. The resultant effect is a relative large increase in activity in the agricultural industry. Imports of
FOODZEROSAV
-5-4-3-2-101234
Commodities
%
QD QM QQ PDD PM PQ
13
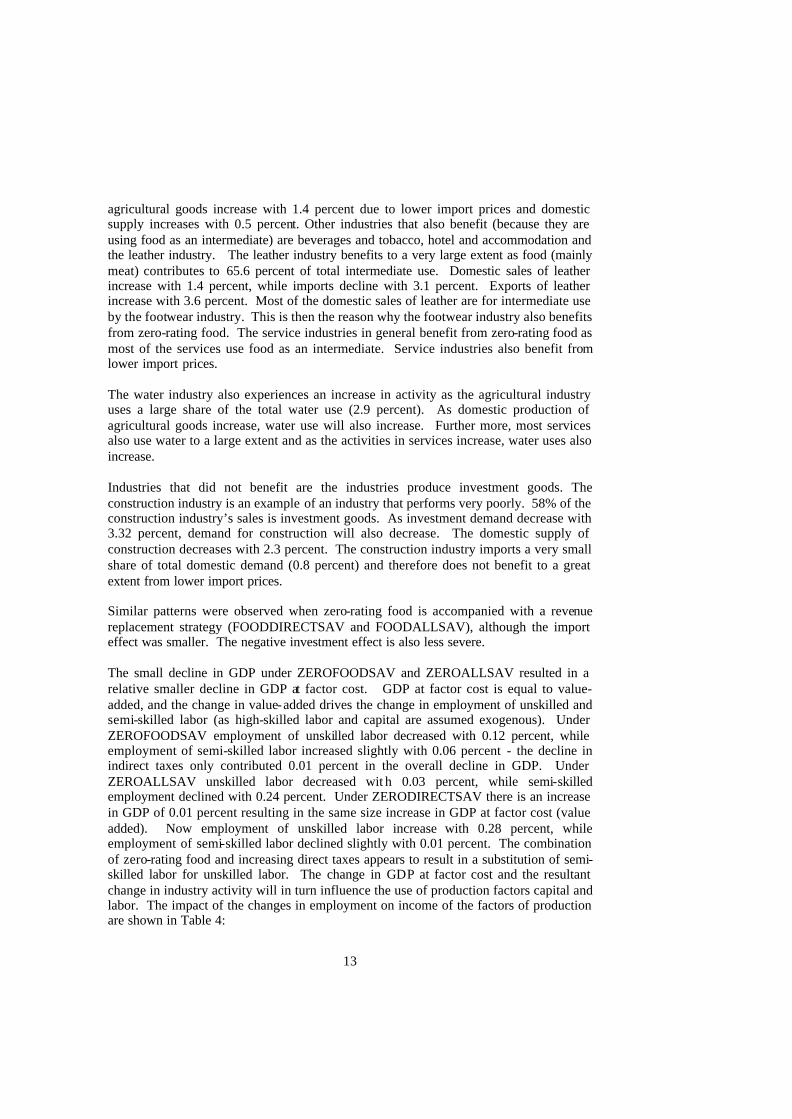
agricultural goods increase with 1.4 percent due to lower import prices and domestic supply increases with 0.5 percent. Other industries that also benefit (because they are using food as an intermediate) are beverages and tobacco, hotel and accommodation and the leather industry. The leather industry benefits to a very large extent as food (mainly meat) contributes to 65.6 percent of total intermediate use. Domestic sales of leather increase with 1.4 percent, while imports decline with 3.1 percent. Exports of leather increase with 3.6 percent. Most of the domestic sales of leather are for intermediate use by the footwear industry. This is then the reason why the footwear industry also benefits from zero-rating food. The service industries in general benefit from zero-rating food as most of the services use food as an intermediate. Service industries also benefit from lower import prices. The water industry also experiences an increase in activity as the agricultural industry uses a large share of the total water use (2.9 percent). As domestic production of agricultural goods increase, water use will also increase. Further more, most services also use water to a large extent and as the activities in services increase, water uses also increase. Industries that did not benefit are the industries produce investment goods. The construction industry is an example of an industry that performs very poorly. 58% of the construction industry’s sales is investment goods. As investment demand decrease with 3.32 percent, demand for construction will also decrease. The domestic supply of construction decreases with 2.3 percent. The construction industry imports a very small share of total domestic demand (0.8 percent) and therefore does not benefit to a great extent from lower import prices. Similar patterns were observed when zero-rating food is accompanied with a revenue replacement strategy (FOODDIRECTSAV and FOODALLSAV), although the import effect was smaller. The negative investment effect is also less severe. The small decline in GDP under ZEROFOODSAV and ZEROALLSAV resulted in a relative smaller decline in GDP at factor cost. GDP at factor cost is equal to value-added, and the change in value-added drives the change in employment of unskilled and semi-skilled labor (as high-skilled labor and capital are assumed exogenous). Under ZEROFOODSAV employment of unskilled labor decreased with 0.12 percent, while employment of semi-skilled labor increased slightly with 0.06 percent - the decline in indirect taxes only contributed 0.01 percent in the overall decline in GDP. Under ZEROALLSAV unskilled labor decreased wit h 0.03 percent, while semi-skilled employment declined with 0.24 percent. Under ZERODIRECTSAV there is an increase in GDP of 0.01 percent resulting in the same size increase in GDP at factor cost (value added). Now employment of unskilled labor increase with 0.28 percent, while employment of semi-skilled labor declined slightly with 0.01 percent. The combination of zero-rating food and increasing direct taxes appears to result in a substitution of semi-skilled labor for unskilled labor. The change in GDP at factor cost and the resultant change in industry activity will in turn influence the use of production factors capital and labor. The impact of the changes in employment on income of the factors of production are shown in Table 4:
14
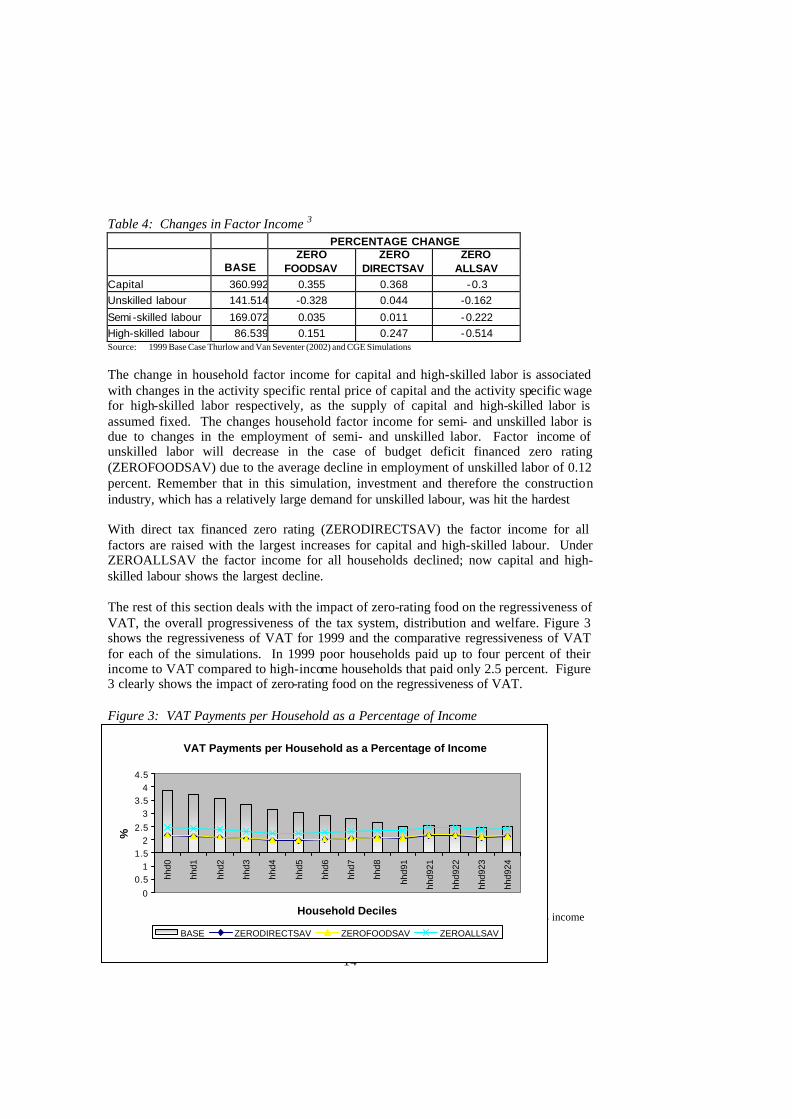
Table 4: Changes in Factor Income 3
PERCENTAGE CHANGE
BASE ZERO
FOODSAV ZERO
DIRECTSAV ZERO
ALLSAV Capital 360.992 0.355 0.368 -0.3 Unskilled labour 141.514 -0.328 0.044 -0.162
Semi -skilled labour 169.072 0.035 0.011 -0.222 High-skilled labour 86.539 0.151 0.247 -0.514 Source: 1999 Base Case Thurlow and Van Seventer (2002) and CGE Simulations The change in household factor income for capital and high-skilled labor is associated with changes in the activity specific rental price of capital and the activity specific wage for high-skilled labor respectively, as the supply of capital and high-skilled labor is assumed fixed. The changes household factor income for semi- and unskilled labor is due to changes in the employment of semi- and unskilled labor. Factor income of unskilled labor will decrease in the case of budget deficit financed zero rating (ZEROFOODSAV) due to the average decline in employment of unskilled labor of 0.12 percent. Remember that in this simulation, investment and therefore the construction industry, which has a relatively large demand for unskilled labour, was hit the hardest With direct tax financed zero rating (ZERODIRECTSAV) the factor income for all factors are raised with the largest increases for capital and high-skilled labour. Under ZEROALLSAV the factor income for all households declined; now capital and high-skilled labour shows the largest decline. The rest of this section deals with the impact of zero-rating food on the regressiveness of VAT, the overall progressiveness of the tax system, distribution and welfare. Figure 3 shows the regressiveness of VAT for 1999 and the comparative regressiveness of VAT for each of the simulations. In 1999 poor households paid up to four percent of their income to VAT compared to high-income households that paid only 2.5 percent. Figure 3 clearly shows the impact of zero-rating food on the regressiveness of VAT. Figure 3: VAT Payments per Household as a Percentage of Income
3 The factor income referred to here are income paid out by domestic activities and ignores income earned abroad.
VAT Payments per Household as a Percentage of Income
0
0.51
1.52
2.5
33.5
44.5
hhd0
hhd1
hhd2
hhd3
hhd4
hhd5
hhd6
hhd7
hhd8
hhd9
1
hhd9
21
hhd9
22
hhd9
23
hhd9
24
Household Deciles
%
BASE ZERODIRECTSAV ZEROFOODSAV ZEROALLSAV
15
Source: 1999 Base Case Thurlow and Van Seventer (2002)
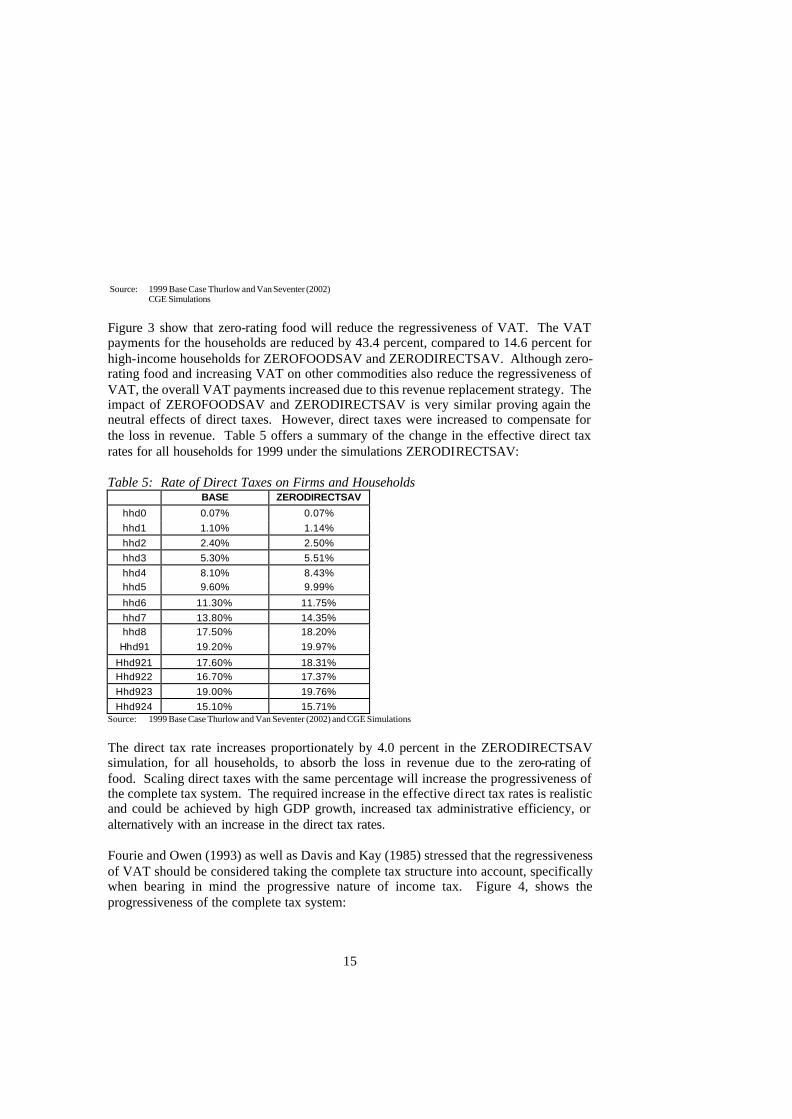
CGE Simulations Figure 3 show that zero-rating food will reduce the regressiveness of VAT. The VAT payments for the households are reduced by 43.4 percent, compared to 14.6 percent for high-income households for ZEROFOODSAV and ZERODIRECTSAV. Although zero-rating food and increasing VAT on other commodities also reduce the regressiveness of VAT, the overall VAT payments increased due to this revenue replacement strategy. The impact of ZEROFOODSAV and ZERODIRECTSAV is very similar proving again the neutral effects of direct taxes. However, direct taxes were increased to compensate for the loss in revenue. Table 5 offers a summary of the change in the effective direct tax rates for all households for 1999 under the simulations ZERODIRECTSAV: Table 5: Rate of Direct Taxes on Firms and Households
BASE ZERODIRECTSAV
hhd0 0.07% 0.07% hhd1 1.10% 1.14% hhd2 2.40% 2.50% hhd3 5.30% 5.51% hhd4 8.10% 8.43% hhd5 9.60% 9.99%
hhd6 11.30% 11.75% hhd7 13.80% 14.35% hhd8 17.50% 18.20%
Hhd91 19.20% 19.97%
Hhd921 17.60% 18.31% Hhd922 16.70% 17.37% Hhd923 19.00% 19.76% Hhd924 15.10% 15.71%
Source: 1999 Base Case Thurlow and Van Seventer (2002) and CGE Simulations The direct tax rate increases proportionately by 4.0 percent in the ZERODIRECTSAV simulation, for all households, to absorb the loss in revenue due to the zero-rating of food. Scaling direct taxes with the same percentage will increase the progressiveness of the complete tax system. The required increase in the effective direct tax rates is realistic and could be achieved by high GDP growth, increased tax administrative efficiency, or alternatively with an increase in the direct tax rates. Fourie and Owen (1993) as well as Davis and Kay (1985) stressed that the regressiveness of VAT should be considered taking the complete tax structure into account, specifically when bearing in mind the progressive nature of income tax. Figure 4, shows the progressiveness of the complete tax system:
16
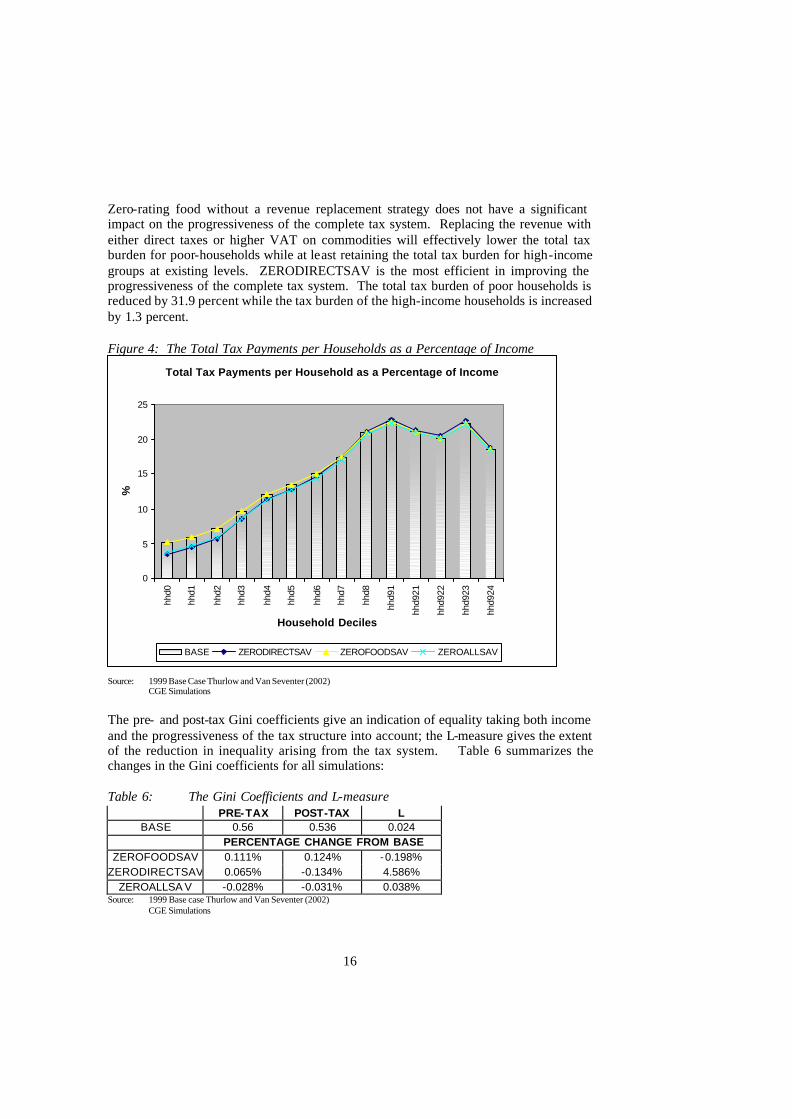
Zero-rating food without a revenue replacement strategy does not have a significant impact on the progressiveness of the complete tax system. Replacing the revenue with either direct taxes or higher VAT on commodities will effectively lower the total tax burden for poor-households while at least retaining the total tax burden for high-income groups at existing levels. ZERODIRECTSAV is the most efficient in improving the progressiveness of the complete tax system. The total tax burden of poor households is reduced by 31.9 percent while the tax burden of the high-income households is increased by 1.3 percent. Figure 4: The Total Tax Payments per Households as a Percentage of Income
Source: 1999 Base Case Thurlow and Van Seventer (2002) CGE Simulations The pre- and post-tax Gini coefficients give an indication of equality taking both income and the progressiveness of the tax structure into account; the L-measure gives the extent of the reduction in inequality arising from the tax system. Table 6 summarizes the changes in the Gini coefficients for all simulations: Table 6: The Gini Coefficients and L-measure
PRE-TAX POST-TAX L BASE 0.56 0.536 0.024
PERCENTAGE CHANGE FROM BASE ZEROFOODSAV 0.111% 0.124% -0.198%
ZERODIRECTSAV 0.065% -0.134% 4.586% ZEROALLSA V -0.028% -0.031% 0.038%
Source: 1999 Base case Thurlow and Van Seventer (2002) CGE Simulations
Total Tax Payments per Household as a Percentage of Income
0
5
10
15
20
25
hhd0
hhd1
hhd2
hhd3
hhd4
hhd5
hhd6
hhd7
hhd8
hhd9
1
hhd9
21
hhd9
22
hhd9
23
hhd9
24
Household Deciles
%
BASE ZERODIRECTSAV ZEROFOODSAV ZEROALLSAV

17
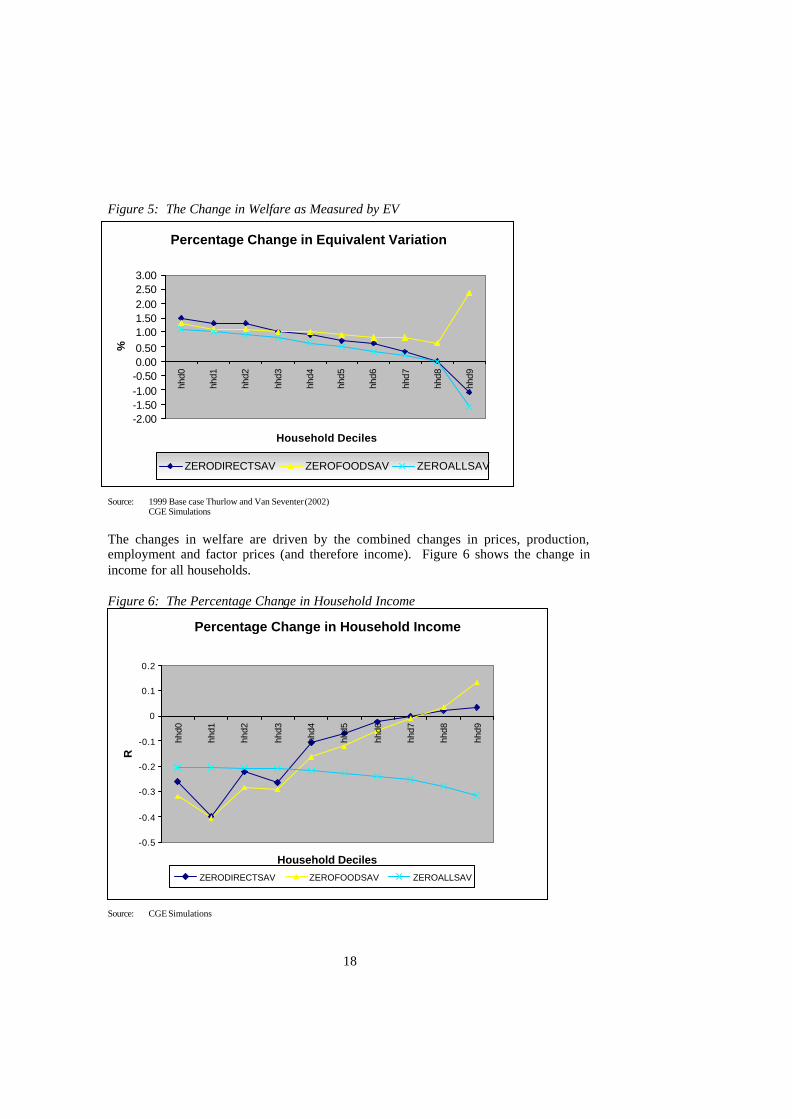
The 1999 pre-tax Gini Coefficient of 0.56 is comparable with a Gini Coefficient of 0.59 published by Statistics South Africa based on the 1995 household survey, and taking income and expenditure into account (Stats SA, 2000: 83). The difference is attributed to the aggregated nature of the household data contained in the SAM. Table 6 shows that ZEROALLSAV (the simulations where VAT on all commodities is increased to 16 percent) is the only simulation that generated a pre-tax equity gain. Both ZEROFOODSAV and ZERODIRECTSAV appear to result in a higher level of inequality pre-tax. Low -income households provide mainly unskilled and semi-skilled labor, which are more adversely effected by zero-rating food. In the deficit financing simulation this result can be traced back to the loss of unskilled factor income due to the decline in investment demand and hence construction services, while in the case of the direct tax financed zero rating simulation, capital and high skilled labour appear to benefit more than unskilled labour. However, ZERODIRECTSAV results in the largest post-tax equity gains. Again, the ability of direct taxes to generate progressiveness is illustrated. The L-measure gives the combined change in income distribution. Therefore, zero-rating food, while increasing direct taxes proportionately can improve the inequality of income distribution in South Africa. The overall impact on welfare is measured with an equivalent variation measurement. Figure 6 gives an illustration of the consumption value at base-year prices in the BASE case and for the simulations the equivalent variation as a percentage of the base consumption value. A positive EV result indicates an improvement in consumption value, which in turn indicates an overall improvement in welfare. A negative indicates an overall decline in welfare. Figure 6 shows that zero-rating food leads to an improvement in the consumption value of low- income households – the EV increased with up to 1.5 percent under ZERODIRECTSAV. Without a revenue replacement strategy the consumption value of high-income households is increased with up to 2.4 percent; with a revenue replacement strategy the EV value for high-income groups decline. When increasing VAT on other commodities the EV value decline with 1.5 percent. The main reason for this can be seen from Table 4. Factor income of high-skilled labor and capital decline to a large extent and as high- income households receive the largest percentage of their income from high-skilled labor and capital it impacts most on this group.
18
Figure 5: The Change in Welfare as Measured by EV
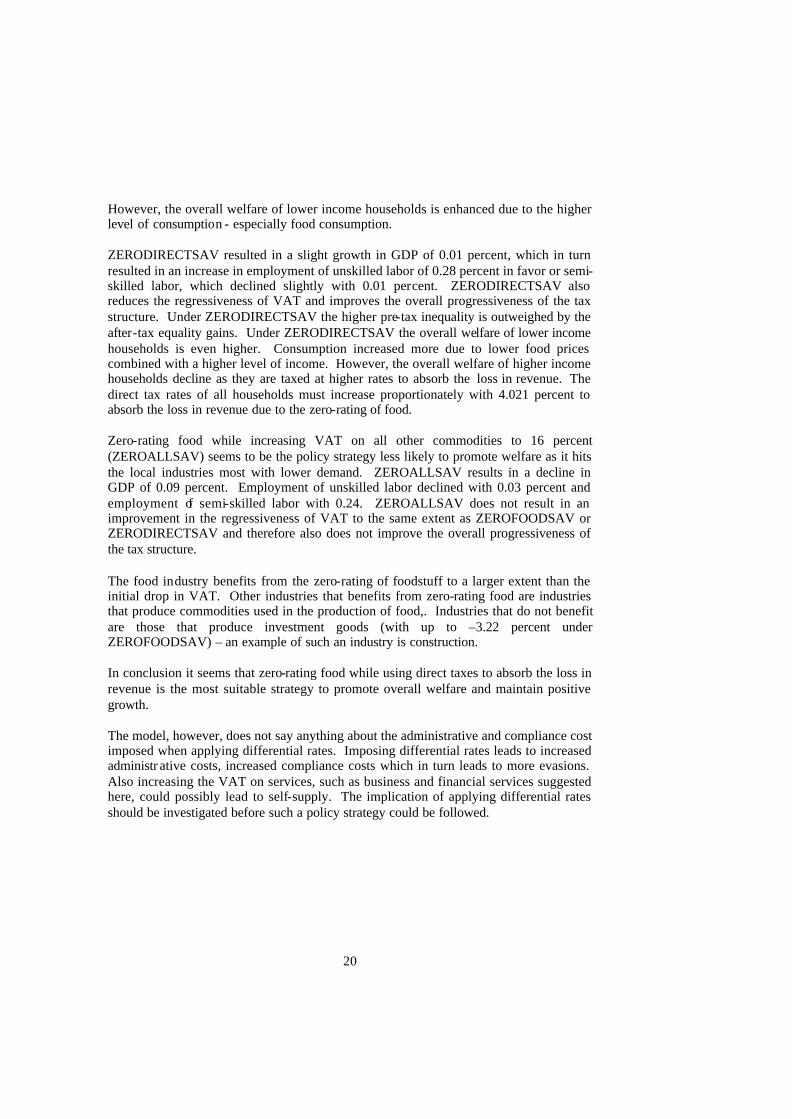
Source: 1999 Base case Thurlow and Van Seventer (2002) CGE Simulations The changes in welfare are driven by the combined changes in prices, production, employment and factor prices (and therefore income). Figure 6 shows the change in income for all households. Figure 6: The Percentage Change in Household Income
Source: CGE Simulations
Percentage Change in Equivalent Variation
-2.00-1.50-1.00-0.500.000.501.001.502.002.503.00
hhd0
hhd1
hhd2
hhd3
hhd4
hhd5
hhd6
hhd7
hhd8
hhd9
Household Deciles
%
ZERODIRECTSAV ZEROFOODSAV ZEROALLSAV
Percentage Change in Household Income
-0.5
-0.4
-0.3
-0.2
-0.1
0
0.1
0.2
hhd0
hhd1
hhd2
hhd3
hhd4
hhd5
hhd6
hhd7
hhd8
hhd9
Household Deciles
R
ZERODIRECTSAV ZEROFOODSAV ZEROALLSAV

19
Zero-rating food will result in a decline in income for poor households compared to high-income households. Under ZEROFOODSAV and ZERODIRECTSAV the decline in employment for unskilled and semi-skilled labor results in a decline in income for low-income households. On the other hand there is an average increase in the activity wages of high-skilled labor and on the activity rental price of capital. Although the income of poor households decline, their overall welfare improves as the price effect of zero-rating food outweighs the decline in income. 5. What The Model Does Not Say The zero-rating of food, while increasing VAT on other commodity or services will introduce more statutory VAT rates. Applying differential VAT rates carries cost in terms of increased administration as well as compliance cost. It also makes politicians, or the government, vulnerable to lobbying and the political powers of producers and other interest groups. (Ebrill et al, 2001: 80). The administration and compliance cost of VAT increases when applying differential rates because it complicates the taxpayers’ books and invoices, it also complicates audits, creates scope for argument and creates incentive for deliberate misclassification of items. With a multiple VAT rate system the compliance cost rises as the tax forms become more complex and accounting records need to be more complete (Agha and Haughton, 1996: 304). The administrative and compliance cost of VAT is not measured within the CGE model, and to incorporate these costs a function form of some sort must be specified accordingly and data on these issues should be applied. Also taxing services more, as was hinted at earlier, is likely to lead to self-supply, which is not the case with commodities. (Kay and Davis, 1986). The model also does not include a function that specifies the substitutability between services obtained and services being self-supplied. 6. Conclusion Zero-rating food can reduce poverty by lowering food prices and at the same time lowering the regressiveness of VAT. Initial simulations not shown suggest that zero-rating food and simultaneously increasing the statutory VAT rate on either business or financial services (ZEROBUSSAV and ZEROFINSAV) seems most effective in turning a regressive VAT into a progressive VAT. However, the required increase in the statutory VAT rate for business or financial services is 42,4 and 91 percent respectively. These rates are unrealistically high. More realistic revenue replacement strategies are increasing direct taxes to absorb the loss or alternatively increasing VAT on all commodities. Zero-rating foodstuffs without a revenue replacement strategy (ZEROFOODSAV) will result in a decline in real GDP of 0.06 percent. The decline in GDP results in a decline in employment of unskilled labor equal to 0.12 percent and a slight increase in semi-skilled labor of 0.06 percent. ZEROFOODSAV reduces the regressiveness of VAT and improves the overall progressiveness of the tax structure. ZEROFOODSAV shows higher pre-tax inequality mainly due to the decline in employment of unskilled labor.
20
However, the overall welfare of lower income households is enhanced due to the higher level of consumption - especially food consumption. ZERODIRECTSAV resulted in a slight growth in GDP of 0.01 percent, which in turn resulted in an increase in employment of unskilled labor of 0.28 percent in favor or semi-skilled labor, which declined slightly with 0.01 percent. ZERODIRECTSAV also reduces the regressiveness of VAT and improves the overall progressiveness of the tax structure. Under ZERODIRECTSAV the higher pre-tax inequality is outweighed by the after-tax equality gains. Under ZERODIRECTSAV the overall welfare of lower income households is even higher. Consumption increased more due to lower food prices combined with a higher level of income. However, the overall welfare of higher income households decline as they are taxed at higher rates to absorb the loss in revenue. The direct tax rates of all households must increase proportionately with 4.021 percent to absorb the loss in revenue due to the zero-rating of food. Zero-rating food while increasing VAT on all other commodities to 16 percent (ZEROALLSAV) seems to be the policy strategy less likely to promote welfare as it hits the local industries most with lower demand. ZEROALLSAV results in a decline in GDP of 0.09 percent. Employment of unskilled labor declined with 0.03 percent and employment of semi-skilled labor with 0.24. ZEROALLSAV does not result in an improvement in the regressiveness of VAT to the same extent as ZEROFOODSAV or ZERODIRECTSAV and therefore also does not improve the overall progressiveness of the tax structure. The food industry benefits from the zero-rating of foodstuff to a larger extent than the initial drop in VAT. Other industries that benefits from zero-rating food are industries that produce commodities used in the production of food,. Industries that do not benefit are those that produce investment goods (with up to –3.22 percent under ZEROFOODSAV) – an example of such an industry is construction. In conclusion it seems that zero-rating food while using direct taxes to absorb the loss in revenue is the most suitable strategy to promote overall welfare and maintain positive growth. The model, however, does not say anything about the administrative and compliance cost imposed when applying differential rates. Imposing differential rates leads to increased administr ative costs, increased compliance costs which in turn leads to more evasions. Also increasing the VAT on services, such as business and financial services suggested here, could possibly lead to self-supply. The implication of applying differential rates should be investigated before such a policy strategy could be followed.
21
LIST OF SOURCES AGHA, A. and Haughton, J. 1996. Designing VAT Systems: Some Efficiency Considerations. The Review of Economics and Statistics, 58(2): 303-308. CREEDY, J. 1999. Modelling Indirect Tax Reform in Australia: Should Tax Rates Be Uniform? Melbourne Institute Working Paper Series. Melbourne Institute of Applied Economic and Social Research, 6/99. CREEDY, J. 2001. Taxation and Economic Behaviour. An Introduction in Surveys in Economics. Vol I. UK: Edward Elgar. DAVIES, R. and VAN SEVENTER, D.E. 2003. A Gap and Macro Decomposition Analysis for South Africa, 1993-2002. http://www.tips.org.za DAVIS, E.H. and Kay, J.A. 1985. Extending the VAT Base: Problems and Possibilities. Fiscal Studies, 6(1): 1-16. EBRILL, L., Keen, M., Bodin, J. and Summers, V. 2001. The Modern VAT. Washington D.C: International Monetary Fund. 2001. FINANSIES & TEGNIEK. 2002. Trevor Manuel Justifies VAT. 22 February 2002. http://www.fnt.co.za FOURIE, F.C.v.N. and Owen, A. 1993. Value-added Tax and Regressivity in South Africa. South African Journal of Economics, 61(4). December 1993. GOTTFRIED, P. and Wiegard, W. 1990. Exemption versus Zero Rating: A Hidden Problem of VAT. Paper presented at the Applied General Equilibrium Modelling Workshop. Washington D.C: World Bank. INTERNATIONAL VAT MONITOR. 1995. South Africa. Services Rendered by Financial Services Intermediaries, Additional Information. 6(6) November/December 1995. KAY, J.A. and Davis, E.H. 1986. The VAT and Services. Paper Presented at The Conference on Value Added Taxation in Developing Countries. Washington D.C: The World Bank. April 1986. LÖFGREN, H., Harris, R.L., and Robinson, S. 2001. A Standard Computable General Equilibrium (CGE) Model in GAMS. Discussion Paper No. 75. May 2001. Trade and Macroeconomics Division International Food Policy Research Institute. pp. 8-19. McDONALD, S., Piesse, J. and Van Zyl, J. 2000. Exploring the Distribution of Household Income in South Africa. The South African Journal of Economics, 68(3): 423-454. September 2000. NELL, K.S. 2002. Long-Run Exogeneity Between Saving and Investment: Evidence from South Africa. TIPS Working Paper, 2-2003. Internet: http://www.tips.org.za REPUBLIC OF SOUTH AFRICA. 2001. Budget Speech. Minister Trevor Manuel. http://www.gov.za REPUBLIC OF SOUTH AFRICA. 2002. Budget Speech. Minister Trevor Manuel. http://www.gov.za SARB. 2003. Quarterly Bulletin. March 2003. SARS. 2003. General Guidelines for VAT. Internet: http://www.sars.gov.za/v_a_t/ S.A. TAX. 2000-2001. Income Tax, Value-Added Tax, Estate Duty and Transfer Duty. Compiled by ROELEVELD, J. 4th ed. 2001. Cape Town: Kadimah Trading.
22
SARTORIUS VON BACH, H.J. and Van Zyl, J. 1994. Effects of Value-added Tax (VAT) on Inequality of Agrarian Household Expenditures: Evidence from Lebowa, Venda and Kangwane. South African Journal of Economic and Management Sciences, 14. Summer 1994. SHOVEN, J.B. AND Whalley, J. 1992. Designing an applied general equilibrium model, Chapter 4 in Applying General Equilibrium, Cambridge surveys of economic literature, Cambridge. Pp. 71-102. STARR, R.M. 1997. General Equilibrium Theory. An Introduction. UK: Cambridge University Press. STATISTICS SOUTH AFRICA. 2000. Measuring poverty in South Africa. Internet: http://www.statssa.gov.za STATISTICS SOUTH AFRICA. Time Series Data. http://www.statssa.gov.za THURLOW, J. and Van Seventer, D. 2002. A Standard Computable General Equilibrium Model for South Africa. Internet: http://www.tips.org.za TIPS. South Africa Standard Industry Database. http://www.tips.org.za VAN RENSBURG, T. 2003. Discussion on Gini Coefficient. Excel Calculation. Washington D.C. World Bank. WORLD BANK SIMPOSIUM. 1990. Value-Added Taxation in Developing Countries. Edited by Gillis, M., Shoup, C.S. And Sicat, G.P. Washington D.C: The World Bank.