the return to retail and the performance of u.s. banks · traditional banking activities like...
TRANSCRIPT

The Return to Retail and the Performance of U.S. Banks
Beverly J. Hirtle
and
Kevin J. Stiroh∗
First Draft: November 2005 This Draft: September 2006
Abstract The U.S. banking industry is experiencing a renewed focus on retail banking, a trend often attributed to the stability and profitability of retail activities. This paper examines the impact of banks’ retail intensity on performance from 1997 to 2004 by developing three complementary definitions of retail intensity (retail loan share, retail deposit share, and branches per dollar of assets) and comparing these measures with both equity market and accounting measures of performance. We find that an increased focus on retail banking across U.S. banks is linked with significantly lower equity market and accounting returns for all banks, but lower volatility for only the largest banking companies. We conclude that retail banking may be a relatively stable activity, but it is also a low return one.
∗Hirtle: Vice President, Federal Reserve Bank of New York; phone: (212) 720-7544; email: [email protected]. Stiroh: Assistant Vice President, Federal Reserve Bank of New York; phone: (212) 720-6633; email: [email protected]. We thank Matt Botsch, Tim Clark, Astrid Dick, and Robard Williams for helpful discussions and comments. The views expressed in this paper are the authors’ only and do not necessarily reflect those of the Federal Reserve Bank of New York or the Federal Reserve System.

I. Introduction
U.S. banks, particularly the largest, have dramatically expanded their retail banking
operations over the last few years. This increased focus has been widely noted with industry
observers emphasizing the critical importance of deposit-taking via a strong branch network,
while extolling retail’s virtue in terms of returns, stability, and growth potential.
Standard & Poor’s concluded that “an increasing emphasis on the retail sector has
become the stand-out characteristic supporting the success of these institutions” (in reference
to six of the largest U.S. bank holding companies)1, while Business Week noted that “after
years of envying investment banks, many lenders have decided the traditional banking biz
ain’t so bad after all.”2 Similarly, The American Banker concludes that “retail makes an
above-average contribution to most banks’ P/E and market-to-book ratios”3 and a study by
Morgan Stanley and Mercer Oliver Wyman describes retail banking as the “Cinderella of U.S.
financial services…high margins, stable income, and modest capital consumption.”4 This is
in sharp contrast to the late 1990s when many large banks shifted their focus toward less
traditional banking activities like investment banking and insurance, and attempted to shift
consumers out of the branch and into alternative delivery channels like automated teller
machines, electronic banking, and telephone call centers.
This paper examines the link between retail banking activity and performance for U.S.
banks from 1997 to 2004 to better understand the drivers and the impact of the renewed focus
on retail banking. In particular, we compare both equity market returns and accounting
profits to measures of retail banking intensity. This allows us to evaluate the conventional
wisdom that has emerged in the last few years that retail banking offers stable revenue flows
and also relatively high returns. This study is the first, to our knowledge, to systematically
examine the risk and return of the retail-based banking strategies that have emerged in recent
years.
1Standard & Poor’s, “Retail Sector Anchors Large Complex Banks in U.S.,” October 4 2004. 2Business Week, “Banking and Securities: Back to Main Street,” January 13, 2003, 110-111. 3American Banker, “Comment: Why Banks are Getting the Urge to Merge in ‘04,” February 10, 2004. 4Morgan Stanley, Mercer Oliver Wyman, “US Retail Banking and Consumer Credit: An Agenda for Growth”, August 2004.

2
One difficulty, however, is that there is no single definition that consistently delineates
retail banking from other financial activities. In annual reports, for instance, some define
retail as deposit-taking activity, consumer lending, and small business lending, while others
include national credit card operations or mortgage businesses. An important contribution of
our paper, therefore, is to develop three metrics of retail banking focus that can be
consistently generated from bank regulatory reports. These measures are the retail loan share,
the deposit retail share, and branches per dollar of assets. These metrics cover several
complementary aspects of a bank’s retail banking activities, one based on the asset side, one
based on liabilities, and the third based on a key retail banking delivery channel. These
measures are correlated, so we also extract the first principal component to develop a single
measure of retail banking intensity. This summary measure has risen substantially since
1999, after declining during the previous five years, which supports the notion of a renewed
focus on retail banking activities.
Our empirical approach for understanding the relative risks and return of retail
banking is straightforward. We regress ex post measures of performance like return on equity
(ROE), stock market returns, and stock market volatility on these metrics, controlling for a
broad set of other factors that might affect performance. Our sample includes 3110 annual
observations for 708 distinct institutions that operated between 1997 and 2004, a period that
includes a wide range of economic and financial conditions.
We find that the data are not fully consistent with the perceived wisdom about the
relative stability and higher returns associated with retail banking. Greater retail banking
intensity, for example, tends to lower equity market volatility only for the very largest bank
holding companies (assets exceeding $10 billion). For small and mid-sized bank holding
companies, the relationship between retail banking intensity and market volatility is weak.
A key factor in this result is the role of branches: greater branching intensity leads to
lower volatility for large banking organizations, but to higher volatility for smaller ones. Our
interpretation is that large branch networks for the biggest banks are more likely to span many
markets and thus provide the benefits of geographic diversification, a result consistent with
the overall benefits of geographic diversification in Morgan and Samolyk (2005). In addition,
branch-based retail activities may be a more potent hedge for the relatively high-risk activities
like trading and capital market services that the largest banks pursue. In either case, we note

3
that analysts typically focused on large institutions, our finding does lend some support to the
claim that branch-based activities are relatively stable. Regardless of organization size,
however, higher retail banking intensity is also consistently associated with lower average
returns, measured both with market and accounting data.
Our bottom line conclusion is that that while retail banking may be a relatively stable
activity, particularly for the largest banks, it is also a relatively low return one. This is
completely reasonable from a traditional finance perspective where firms trade off risk and
expected return, but counters the perception of some that retail activities offer the possibility
of both high returns and low risk. Given the historical shifts in strategies among banks, one
implication is that the current focus on retail may simply be a cyclical response to the low-
returns and turbulence in capital market activities after 1998.5 If so, we may expect waning
interest in retail as relative returns rise in other activities.
II. The Return to Retail Banking
The U.S. banking industry has undergone considerable changes over the last two
decades in response to major deregulation, financial innovation, and technological advance.
This section discusses one recent trend – the return to retail banking – and places it in the
larger context of the evolving banking industry. To do so, we reviewed analyst reports,
industry commentary, and the statements of bankers to better understand the underlying
motivation and rationale for this trend. While this information is in some sense “soft,” it does
provide a useful and novel perspective on the evolution of banking strategies.
Our discussion begins in the mid-1990s with the well-known Riegle-Neal Act of 1994,
which allowed banking and branching on a nationwide scale. There is considerable evidence
that this law, which capped a period of deregulation that fundamentally changed the way
banks operate, altered the competitive dynamics of the industry and directly impacted
economic outcomes across U.S. states.6
At the same time, there were fundamental changes in strategy among U.S. banks.
Within traditional banking, many banks attempted to shift consumers out of the bank branch
5See Houston and Stiroh (2006) for an analysis of the increased financial sector volatility. 6See Strahan (2003) for a summary of that research.

4
and toward alternative distribution channels such as telephone, automated teller machines
(ATMs), and electronic delivery. For example, one executive argued that branches could
“eventually be supplemented by videoconferencing kiosks where customers talk to bank
officers”7 and another stated that “as soon as we really do have a choice for the customer to
make that’s realistic, then he will move away from branches.”8 Electronic banking was seen
as a low-cost alternative to high-cost branches, and some banks imposed fees on seeing
branch tellers to facilitate the substitution towards alternative channels. This focus on
electronic banking continued through the late 1990s and may have peaked with Bank One’s
introduction of Wingspanbank.com, an internet-only banking subsidiary, on June 29, 1999.
A second major strategic shift in the late 1990s was the move to create more
diversified financial service firms that could reap cross-selling and diversification gains in a
more deregulated environment. The late 1990s saw several large deals across traditional
industry lines that created large, well-diversified financial firms. These include
BankAmerica’s purchase of Robertson Stephens, an investment bank boutique (announced
June 1997), Nationsbank purchase of Montgomery Securities (announced June 1997), the
Travelers/Citicorp merger that created Citigroup (announced April 1998), and
ChaseManhattan’s purchase of Hambrecht and Quist (announced September 1999). These
deals were generally well-regarded by the investment community. For the largest deal,
Citicorp and Travelers, for example, one analyst report headlined “You Gotta Like It,” and
praised the deal as enhancing “longer term growth via improved cross-sales” and raising
“hopes for revenue enhancements and unprecedented diversification in financial services.”9
The focus on the diversified model, however, was short-lived. By 2002 the U.S.
economy had experienced the bursting of the NASDAQ bubble, the events of September 11
2001, and a massive decline in capital market activity. One observer concluded that “the
initial hope of many financial companies that welding brokerage, insurance, and retail
banking businesses would create sales synergies just didn’t pan out.”10 At a fundamental
level, this reflected the growing attractiveness of consumer lending and refinancing; increased
7Business Week, “Industry Outlook, Finance: Banking, Another Year in ‘Bank Heaven?,” January 10, 1994, 103. 8Business Week, “Industry Outlook, Finance: Banking, A Few New Blots on the Ledger,” January 8, 1996, 114. 9Merrill Lynch, “Citicorp: You Gotta Like It,” April 7, 1998.

5
realization of the risks associated with less traditional operations, e.g., volatility in capital
markets and regulatory reform like Sarbanes-Oxley; and operational difficulties with the
diversified model, e.g., culture clashes between commercial and investment banking and
operational risk.11
In response, a renewed focus on retail emerged, particularly branch and deposit-based
activities. Standard & Poor’s, for example, noted that “an increasing reliance on the retail
sector has become the stand-out characteristics supporting the success”12 of the largest banks
and that these institutions “changed their business mix dramatically from the days when they
were “money center” banks.”13 Similarly, Moody’s observed that the “core of the banks’
franchises is the low-coupon deposit business”14 and a typical commentary was that “banks
have concluded that businesses with no deposits may also have no returns.”15 Finally,
Barron’s stated that that after trying to enter brokerage, equities, and M&A advisory in the
late 1990s, “good, old-fashioned commercial banking is looking attractive again” after fraud
and turmoil in capital markets.16
This shift was largely motivated by the belief that deposit-based, retail banking
operations offered a more attractive risk/return combination than other capital-market based
activities. The American Banker concluded that “retail makes an above-average contribution
to most banks’ P/E and market-to-book ratios,”17 while a major consulting firm described
retail banking as the “Cinderella” of US financial services with “high margins, stable income,
and modest capital consumption” and concluded that “retail-focused institutions have
historically delivered superior shareholder value creation.”18 Finally, one analyst concluded
“there has been a realization that retail is actually a big driver of earnings and value.”19 An
10Business Week, “Citi: A Whole New Playbook,” February 14, 2005, 72-74. 11Stiroh (2004) documents the relative volatility of noninterest income and less traditional banking activities. 12Standard & Poor’s, “Retail Sector Anchors Large Complex Bank in US,” October 4, 2004. 13Standard & Poor’s, “The Dark Side of Bank Consolidation,” December 6, 2004. 14 Moody’s Investors Service, “Banking System Outlook,” May 2002. 15Business Week, “Banking and Securities: Back to Main Street,” January 13, 2003, 110-111. 16Barron’s, “Clean Machine: Bank of America is Poised to Prosper as the Economy Turns,” August 26, 2002. 17American Banker, “Comment: Why Banks are Getting the Urge to Merge in ’04,” February 10, 2004. 18Morgan Stanley, Mercer Oliver Wyman, “US Retail Banking and Consumer Credit: An Agenda for Growth,” August 2004. 19SNL Securities, “Q&A: Mercer Oliver Wyman MD Michael Poulos on the Outlook for Retail Banks and Specialty Lenders,” March 01, 2005.

6
important component of the recent return to retail was the perception that retail banking
provides more stability than other financial activities. For example, S&P wrote that “as large
complex banks have added retail banking to their business mix over the last 10 years, this
focus on consumer services has created a level of profitability to counter the volatility of other
areas, such as corporate lending.”20
These trends and perceptions are apparent in the motivation and discussion of large
bank mergers, particularly since the First Union and Wachovia deal in 2001. In an analysis of
the BankAmerica and Fleet merger in 2003, for example, one commentary observed that “the
deal spotlights a growing trend, as many banks return to their consumer roots after years of
getting rid of branches while pursuing corporate clients…plain-vanilla products have turned
out to be much more reliable sources of profits…big banks that have made bold moves into
investment banking during the bull market, including Fleet Boston, have scaled back those
operations since the stock-market collapse.”21 Similarly, the JPMorgan Chase acquisition of
Bank One, announced in January 2004, was lauded for the development of a retail banking
presence that added a “less combustible mix of businesses”22 and a “lower risk earnings
mix.”23 Another analyst remarked that “the new JP Morgan will be an enormous national
player in many retail and product areas and the new combined entity promises to greatly
mitigate old JPMs’ historically unpredictable earnings… by adding One’s stable source of
retail-oriented earnings.”24 Finally, a summary of market trends described the merger as a
“bid to diversify into a hot business, consumer banking services.”25
There was similar action on the divestiture side. For example, FleetBoston announced
plans to sell Robertson Stephens in 2002 as part of a plan to generate “a more consistent,
lower-risk business model.”26 Citigroup’s sale of its Travelers Life and Annuity business was
20Standard & Poors, “Retail Sector Anchors Large Complex Banks in U.S.,” October 4, 2004. 21Wall Street Journal, “Branching Out: Bank of America Bets on Consumer,” October 28, 2003, A1. 22Merrill Lynch, “J.P. Morgan Chase, Real Promise… But Will Management Mesh?” April 2 2004. 23Citigroup SmithBarney, “JPM/ONE Creates Value with Earnings Accretion and Valuation Lift,” January 16 2004. 24Deutsche Bank Securities Inc., “Bank One Sells Out to JP Morgan in Strategic Merger – Initial Thoughts,” January 15 2004. 25American Banker, “A Blockbuster Deal of a Rather Different Kind,” February 10, 2004. 26FleetBoston, “Fleet’s Gifford Announces Strategic Actions,” News Release, April 16, 2002.
7
viewed as part of “a large step in moving Citigroup away from becoming a one-stop financial
shop” and part of a “larger vision to get back to basics.”27
Two factors make this increased focus on retail activities particularly interesting.
First, there has been a clear shift in the view on what is the most effective and profitable retail
banking distribution channel. The mid- to late-1990s were focused on replacing branches
with high-tech, low-cost alternatives, while the recent retail expansion is based on a much
more branch-centric conception, including in-store branches. Recent evidence suggests that
branches remain the primary point of contact, e.g., 86% of bank customers use a branch once
a month compared to 36% for internet banking.28 The conclusion is that “after experimenting
with pushing customers to the internet and the call center to control expenses, banks are now
taking a second look at their branch networks and investing heavily in them” and one banker
laments that “as an industry, for years we’ve been driving customers away from the
branch…the customer frankly sees this as an annoyance.”29 Speiker (2004) reports that bank
branches are a highly effective and profitable distribution channel for retail services relative to
other methods like the internet or call centers.
Second, the very largest banks have been heavily involved in branch acquisition and
now earn substantial revenue from retail activities (Hirtle and Metli (2004)). Standard &
Poor’s, for example, reports that the retail banking businesses now account for 50-70% of
earnings of the very largest banks.30 This increased focus on retail activities has come despite
the broadening of permissible financial activities after Gramm-Leach-Bliley and reflects an
important strategic shift for the largest banks from the days when many strove to become
financial supermarkets. We document these changes in focus in the next section of the paper.
This return to “old retail” banking marks a major shift in the business model of U.S.
commercial banks and motivates our analysis of the risk and return of U.S. retail banking
activities. In particular, we examine whether the conventional wisdom that retail banking is a
relatively stable source of earning is supported by the data, whether a strong branch network
27Business Week, “Citi: A Whole New Playbook,” February 14, 2005, 72-74. 28American Banker, “More are Warming to the Idea of Cozier Branches,” November 17, 2004. American Banker, “Data Show New-Branch Talk Wasn’t Just Talk,” November 28, 2004. 29American Banker, “More are Warming to the Idea of Cozier Branches,” November 17, 2004. 30Standard & Poor’s, “The Dark Side of Bank Consolidation,” December 6, 2004.

8
leads to improved performance, and whether there are meaningful differences across size
groups.
III. Data and Performance Measure
a) Measuring Retail Intensity
A key difficulty in assessing the impact of retail activities on the risk and return of
banking organizations is the lack of a consistent metric of retail banking intensity. Without
such a metric, it is difficult to compare the extent of retail activities across institutions or over
time. Developing a metric of retail intensity requires both a definition of retail banking and
institution-level data consistent with that definition. An important first contribution of this
paper is to propose a definition of retail banking based on industry norms and then to generate
complementary metrics that can be blended into a single, consistently calculated measure of
retail banking intensity for a large number of banking organizations over time.
Although retail banking has received considerable attention in recent years, there is no
generally agreed upon definition among analysts or bankers. In annual reports and other
financial statements, large commercial banks frequently report results for retail-oriented
business segments that include consumer deposit-taking and lending and small business
financial services. These services are provided through a range of distribution channels, with
brick-and-mortar branches being the most prominent (others include internet sites and call
centers). Some institutions also have consumer credit businesses – particularly mortgage
origination and credit cards, both prime and sub-prime – that are provided on a national scale
that is separate from the firm’s branch-based retail activities. In some cases, these businesses
are grouped with branch-based activities into a single “retail” business segment, while in
other cases, they are reported as separate business lines in financial statements. Those
institutions that provide retail brokerage services almost universally include these activities in
a broader brokerage or asset management business line rather than in the “retail banking”
segment. Finally, at some institutions, the “retail” business segment also contains financial
services provided to middle-market corporate customers, though it is becoming increasingly
common for these activities to be grouped with services provided to larger corporations.31
31This discussion is based on readings of annual reports of many large banks.

9
Drawing from these sources, we propose a broad definition of retail banking that
encompasses deposit-taking, lending, and other financial services provided to consumers and
small businesses through all delivery channels, including branches, loan offices, call centers,
and the internet. Our definition encompasses national consumer credit businesses. The
diversity of customers, products and services, and delivery channels covered by this definition
suggests that a meaningful metric of retail banking intensity should be similarly broad.
Potential candidates might be the share of revenue or profit derived from these activities or
the share of risk capital allocated to these business units. Both measures are holistic, in that
they condense the full range of retail activities – both those that generate balance sheet
positions and those that do not – into a single measure that is comparable across business lines
in the firm.
Unfortunately, although a number of large bank holding companies report revenue,
profits, and risk capital figures for identifiable retail business lines in annual reports and other
public financial statements, such information is not readily available for most banking
companies and is not consistently defined. Instead, we turn to regulatory reports to generate
three complementary measures of retail banking intensity. In particular, we use balance sheet
and income statement data from the FR Y-9C reports filed quarterly with the Federal Reserve
by bank holding companies and from the Call Reports filed quarterly by all commercial
banks, and data on branch ownership from the Summary of Deposits reports filed annually
with the Federal Deposit Insurance Corporation (FDIC) by commercial banks and thrifts.32
The advantage of using regulatory report data is that they are available on a consistent basis
for all banking organizations over a relatively long period of time, going back to the mid-
1980s to mid-1990s, depending on the variable in question. The charts that follow include the
full available date range for each variable, which varies based on the underlying data, though
the regression analysis in Section IV is limited to a shorter horizon.
The first measure we generate is the retail loan share, defined as credit card, other
consumer, 1-to-4 family mortgage (including home equity), and small business loans as a
32The FR Y-9C data are available at http://www.chicagofed.org/economic_research_and_data/bhc_data.cfm. Call Report data are available at

10
share of all loans held on the balance sheet. Data on credit card, other consumer, and
mortgage loans are derived for bank holding companies from their year-end FR Y-9C reports,
while small business loan data are derived from the Call Reports filed by the banks within the
holding company.33 This measure covers loans to the consumer and small business customers
included in our definition of retail banking. It captures exposures held on the books of the
bank holding company, but excludes loans originated and later sold or securitized and lines of
credit granted but not yet drawn down. These exclusions mean that the retail loan share may
be understated for those banking companies that operate national credit card or mortgage
origination businesses, since these businesses tend to securitize a significant share of these
loans.
Figure 1 reports the overall retail loan share for the U.S. banking industry from 1993
to 2004. Clearly, this share has cycled over time, with the “return to retail” evident in the run-
up in the retail loan share since 2000. As Figure 2 illustrates, however, the movement in retail
loan share differs significantly by bank holding company asset size, with the recent increase
driven by institutions with assets of $10 billion or more, particularly the very largest of these.
In contrast, the retail loan share at smaller institutions has been falling since the mid-1990s.34
These contrasting trends have reversed the ordering of retail banking intensity across asset
size categories over the sample period, with the very largest institutions now having the
greatest focus on retail lending as indicated by this metric.
A similar picture emerges when we examine our second retail banking metric, the
retail deposit share. This measure is defined as NOW account, small time, and savings
account deposits as a share of total deposits. These deposits are the types most likely to be
held by consumers and, to a lesser extent, small businesses. Although consumers and small
http://www.chicagofed.org/economic_research_and_data/commercial_bank_data.cfm. The Summary of Deposit data are available at http://www2.fdic.gov/sod. 33Small business loans are defined as all loans to commercial and industrial borrowers with initial loan amounts of $1 million or less. Small business loan data are reported by commercial banks, but not by bank holding companies, once a year in the June Call Reports. To create small business loans at the bank holding company level, we add the small business loan volumes reported (as of June) for all commercial banks held by the holding company as of December. For some small bank holding companies, small business loans as of June exceeded total reported C&I loans as of December; in those cases, we took the smaller of June small business loans and December C&I loans as the small business loan figure.

11
business also hold non-interest-bearing demand deposits and large time deposits (those
exceeding $100,000), we exclude these balances from our retail deposit measure because a
significant portion are derived from non-retail customers, such as mid-sized and larger
businesses, especially at larger banks.35
Figure 3 presents the aggregate retail deposit share for the U.S. banking system over
the years 1986 to 2004. Like the retail loan share, this measure cycles over time, reaching a
recent peak in 2003. Further, as Figure 4 illustrates, the recent increase in retail deposit share
has been driven by the very largest banking organizations, whose retail deposit share has
increased steadily since the mid-1990s. In contrast, the retail deposit share has trended
slightly downward at smaller institutions over this period. While these smaller institutions
continue to have greater retail “intensity” by this measure, there has been notable convergence
across institutions of different asset sizes.
Our final metric of retail banking intensity departs from balance sheet measures of
retail activity and instead focuses on a key retail banking delivery channel, bank branches. As
noted above, despite considerable consolidation in the U.S. banking industry and the
technology-driven emergence of alternative, lower cost delivery channels, the number of
brick-and-mortar bank branches has increased steadily since the mid-1990s. A growing
proportion of these branches is held in large branch networks. As of mid-2003, nearly 25
percent of U.S. branches were held by the 10 bank and thrift holding companies with 1000 or
more branches, up from 11 percent in 1994 (Hirtle and Metli (2004)). This shift is consistent
with a greater focus on retail banking activities among the largest organizations, as suggested
by the retail loan share and retail deposit share variables.
Our third metric, therefore, is based on the number of branches held by each banking
organization. Because number of branches is highly correlated with institution size, we divide
the number of branches by total assets so that our measure captures differences in retail
banking intensity across organizations rather than merely differences in scale. Note that we
34These institutions are now holding higher shares of commercial real estate and construction and land development loans. 35Our retail deposit measure captures retail deposits held in domestic offices only. Regulatory reports contain information on deposits held in foreign offices, but do not break these deposits out by product type. While this

12
use overall asset size, rather than a measure of retail-related assets, to capture the size of the
branch network relative to the overall size of the institution; a branches-to-retail-assets
measure would reflect retail banking efficiency rather than the degree of institutional focus on
retail banking. The results discussed below are quite similar if we use alternative measures of
institutional scale, including total loans, equity capital, and revenue. The asset figures we use
are in billions of 2004 dollars.
Figure 5 presents our branches-to-assets measure for the aggregate U.S. banking
industry between 1994 and 2004. In contrast to our other retail banking metrics, this measure
has declined over time, falling from about 13 branches per billion dollars of assets to just
under eight. This indicates that the number of branches has grown more slowly than U.S.
banking system as a whole, a somewhat contrary finding to the “return to retail” focus in the
industry. Figure 6 presents this ratio by bank holding company asset size group. The figures
suggest a direct relationship between asset size and retail intensity as measured by branches-
to-assets, with smaller banks having significantly more branches per dollar of assets. The
downward trend in branches-to-assets is evident for each of the asset size groups.
The metrics discussed above capture three complementary aspects of a bank’s retail
activities - assets, liabilities, and the third based on a key retail banking delivery channel. An
important question is whether they can be combined in some way to provide a single, unified
measure of retail banking intensity. On a pair-wise, cross-sectional basis, the three measures
are significantly positively correlated: average correlation coefficients range between 21 and
41 percent (Table 1), with the strongest correlation between the retail deposit share and retail
loan share variables.36
Given the significant correlation among the three metrics, we extract the first principal
component of the cross-sectional variation to develop a single measure of retail banking
intensity. The first principal component captures about 50 percent of the variation, suggesting
may introduce some bias into our retail deposit measure, the bias is likely to be small, as few U.S. commercial banking organizations have significant foreign deposit-taking (branching) operations. 36These correlations are for the publicly traded bank holding companies used in the regressions in Section IV. Correlations for a broader sample including both publicly traded and non-publicly traded banking companies are also positive but lower, ranging between 10 and 30 percent. We also examined correlations across asset size classes and found that correlations were positive for each asset size class, with somewhat higher correlations for large institutions ($10 billion in assets or more) than for smaller ones.

13
a meaningful common component among our three metrics. Figure 7 presents this combined
retail intensity metric for the U.S. banking industry from 1994 to 2004, with the values for
individual bank holding companies are weighted by asset size. Like the retail deposit share
and retail loan share variables, the combined retail intensity metric cycles over time, with the
“return to retail” evidenced by the peak in 2004.
Figure 8 presents the metric by bank holding company asset size group. Once again,
the recent overall increase in the retail intensity metric is driven by the very largest bank
holding companies, where values have increased sharply since 1999. Overall, the figures
indicate considerable convergence across asset size groups in the average degree of retail
banking intensity as the largest banks shift their strategic focus.
Thus far, we have illustrated trends in our retail banking metrics for the U.S. banking
industry as a whole and for groups of institutions defined by asset size. While our measures
are useful for tracking developments at an aggregate level, it is also important to establish that
they capture cross-sectional differences in retail banking focus. As discussed above, there is
no independent “all-in” measure of retail banking intensity available for a large number of
banking institutions. However, several large bank holding companies report revenue and net
income in their public financial disclosures broken out by recognizable retail banking
business segments in ways that are consistent with our definition of retail banking. Using
these data, we can calculate the share of net income and revenue – defined as net interest
income plus non-interest income – from retail banking activities and examine the cross-
sectional correlation of these ratios with our retail banking metrics.
To do this, we collected data from annual reports and quarterly financial statements
for 12 large bank holding companies from 2001 through 2005:Q2.37 For each institution, we
used these data to calculate annual retail revenue and retail net income shares – defined as
37The BHCs are Bank of America, Bank of New York, Bank One, Citigroup, FleetBoston Financial, J.P. Morgan Chase, M&T, National City, SunTrust, U.S. Bancorp, Wachovia, and Wells Fargo. These firms were selected based on asset size, branch network size, and on whether they reported business segment financial information that allowed us to identify a retail banking business line consistent with our definition. This group does not necessarily represent an exhaustive list of bank holding companies for which such information may be available, but it is a representative sample spanning a range of asset sizes and extent of retail focus. Most other banks do not provide the necessary detail on business segments in their financial statements, instead reporting information for a “general bank” business segment that includes both retail activities and corporate lending. Of necessity, then, this analysis is limited to a small sample of institutions.

14
revenue or net income from retail banking business segments as a share of the institution’s
aggregate revenue or net income. We then matched these revenue and net income shares with
regulatory report data on retail loan share, retail deposit share, and branches scaled by assets
from the previous year-end. Due to mergers and changes in financial statement reporting that
make cross-year comparisons difficult, we lose some observations, resulting in a final sample
of 52 BHC-year observations.
Table 2 reports the results of some simple regression analysis examining the cross-
sectional correlation of the retail revenue and net income shares and our retail banking
metrics. The regressions include year dummy variables and are estimated with robust
standard errors that take account of the possibility of clustering by bank holding company.
The results suggest a positive and significant correlation between the shares of
revenue and net income accounted for by retail banking business lines and our retail banking
metrics. The correlation is strongest for the retail loan share metric and for the first principal
component of the three metrics and is weakest for the retail deposit share, but it is certainly
evident for all the measures, both individually and jointly. Overall, this evidence supports the
contention that our three retail banking metrics and their first principal component track cross-
sectional differences in retail banking intensity among these large institutions, as reflected in
the “all-in” activity measures of revenue and net income.
Taken together, the retail banking intensity measures are consistent with the general
view of the increased importance of retail activities in the U.S. banking industry. The
balance-sheet-based measures suggest that this growth has been driven primarily by large
bank holding companies, resulting in considerable convergence among institutions of
different asset sizes. Somewhat in contrast, the branch-based measure suggests a continued
differentiation across asset size categories in the degree of retail intensity. In the work that
follows, we will use these three measures, as well as their common component, to examine
the impact of differences in institution-level retail banking intensity on risk and return.
b) Measuring Return and Risk with Equity Market Data
Many observers have claimed that retail activities are less volatile than other forms of
banking activities like trading or underwriting. Theory, of course, suggests that high-risk
activities will demand a premium in the form of higher returns, so one needs to evaluate both

15
the risk and the return to judge relative performance across business lines.38 In this section,
we briefly discuss our measure of equity market return and risk.
We begin with daily equity market returns, including dividends and adjusted for splits,
for each bank and cumulate these into weekly measures. We then define the return for bank i
in a year t, Ri,t, as the mean of those weekly returns. We define the risk of the bank as the
standard deviation of those weekly returns in a year, ti,σ . We also calculate a measure of
risk-adjusted returns, RARi,t, as the ratio of average returns to the standard deviation of
returns. These three performance measures are calculated as:
(1) ( ) ( )
ti
titi
S
tstisiti
S
tssiti
RRAR
SRR
SRR
,
,,
2,,
2,
,,
1
σ
σ
=
−−=
=
∑
∑
∈
∈
where s is the weekly observation and S is the number of the bank’s weeks in a year.
One issue is whether our focus should be on the total risk of the bank (as above) or on
the idiosyncratic component that remains after common market forces have been controlled
for. That is, one could estimate a market model and decompose the variance of returns, “total
risk,” into the model-predicted component, “systematic risk,” and the variance of the
residuals, “idiosyncratic” or “firm-specific risk.”
All three measures are informative and the choice depends on the specific question
being addressed. For example, Demsetz and Strahan (1997) and Stiroh (2006) are interested
in questions about size-related diversification gains and theory suggests that idiosyncratic risk
is the appropriate measure. A large, internally diversified firm should be able to shed the
idiosyncratic component of it many exposures, so idiosyncratic risk should decline with size.
An investor, on the other hand, may care primarily about the systematic part if idiosyncratic
risk can be shed by holding a well-diversified portfolio.
38In practice, the link between risk and return has not been as tight as theory predicts (Fama and French (2004)).
16
Alternatively, regulators and supervisors will likely be interested in the total risk of a
banking institution because default and market disruption could result from either the
systematic or the idiosyncratic component. This can be seen in Merton-type portfolio models
of credit risk, developed by Merton (1974) and implemented in KMV risk models, which are
driven by assumptions about total asset return volatility and estimated using total equity return
volatility. Similarly, risk-adverse managers may care about total risk if a large portion of their
wealth is tied up in the firm’s equity (Stulz (1984)) or if they can’t diversify their skills or
human capital (Cummins et al. (1998)). Bank borrowers may care about the total risk of the
bank if failure breaks valuable, intangible banking relationships (Slovin et al. (1993)) or if
internal capital market frictions reduce lending and the efficient allocation of scarce capital
resources (Houston et al. (1997)). Finally, even shareholders will likely care about total
volatility (and not just the systematic component as finance theory implies) due to nonlinear
costs of external funds, non-traded risks, costs of financial distress, and the convexity in the
corporate tax code (Froot, Scharfstein, and Stein (1993) and Froot and Stein (1998)).
Our empirical work focuses on the total volatility of equity market returns as our
preferred measure of risk. This reflects the broad importance of equity market volatility to
regulators and supervisors, managers, borrowers, and investors. As robustness checks, we
examined the link between the systematic and idiosyncratic components of total risk and
found results that were broadly consistent.39
As a complement to market-based returns, we also examine average returns and return
volatility based on accounting data. We calculate the average return on equity (ROE) for each
bank holding company as the ratio of net income to end-of-period equity capital on a quarterly
basis, and average across the four quarters in a year to get an annual figure. The volatility of
returns is calculated as the standard deviation of quarterly ROE within a year. Risk-adjusted
ROE is calculated as the ratio of average ROE to the within-year volatility of ROE.
c) Data and Regression Sample Construction
Our data set consists of information on equity market returns, accounting returns,
balance sheet and income statement information, and branch data for publicly traded bank
39These results are available from the authors upon request.

17
holding companies over the years 1997 to 2004. This sample period is somewhat shorter than
the full time period when the retail banking intensity variables are available (1994 to 2004),
but it covers the recent cycle in retail intensity in the U.S. banking industry. Half the sample
years (1997 to 2000) are during the “downswing” of the retail cycle, while the remaining
years (2001 to 2004) constitute the “upswing.” Further, the sample period spans significant
variation in financial market and economic conditions, including the 2001 recession and the
financial market volatility of the late 1990s and early 2000s. Thus, the sample period allows
us to examine the impact of retail banking over a wide range of conditions. Finally, by
focusing on a relatively recent period, we are able to draw the most relevant conclusions
about retail banking.
Equity market data are obtained from the University of Chicago’s Center for Research
in Security Prices (CRSP) data for publicly-traded bank holding companies (BHCs) that
operated during our sample period. Publicly-traded BHCs were identified as those institutions
that appeared both in the Y-9C regulatory database and in CRSP, where the firms were linked
based on the CUSIP-identifier available from Compustat. We include only those BHCs with
at least thirty weekly observations in a given year.
These market data were matched with balance sheet and income statement data for
top-tiered bank holding companies (BHCs) from the “Consolidated Financial Statements for
Bank Holding Companies,” known as the FR Y-9C Reports, that BHCs file quarterly with the
Federal Reserve. Equity market data from one year are matched with accounting data from
the prior year’s FR Y-9C report, i.e., the BHC accounting data from 2000 were linked with
equity market data from 2001. The timing of the accounting-based return data matches that of
the market return data, however. Throughout the paper, the observation year refers to the
equity market or return data period and not the regulatory data period unless explicitly
mentioned. Accounting data are deflated with the CPI.
Finally, data on branch ownership is derived from the Summary of Deposits data
collected annually by the FDIC. The Summary of Deposits collects information on individual
branches as of June 30 of each year, including branch ownership, location, deposit amounts,
and the type of branch. We aggregate these to the bank holding company level to calculate
the number of full time, full service branches held by each organization. These data are then
matched with year-end BHC accounting data from the FR Y-9C reports.

18
The final data set consists of 3110 observations for 708 individual bank holding
companies over the years 1997 to 2004. The BHCs in the sample have a median asset size of
just over $1 billion, so they are large relative to the full range of organizations, as would be
expected since they are all publicly traded. That said, the sample contains BHCs with assets
as small as $150 million, so a wide range is represented in the sample. As a rough control for
the impact of significant mergers, we identify holding companies where year-over-year asset
growth is in the upper 5 percent tail for a particular year as “mergers” and create a new
holding company identifier for the post-merger period. The results discussed below are not
affected by this adjustment.
Table 3 presents some basic statistics of the regression data set. The first panel of the
table presents information on the three individual retail banking intensity metric – the retail
loan share, retail deposit share, and branches scaled by assets – as well as the first principal
component measure. The second panel of the table contains information on the market-based
and accounting-based return, return volatility, and risk-adjusted return measures, while the
final panel presents information on the control variables.
IV. Empirical Results
Our basic empirical approach is to regress market-based and accounting-based
measures of returns, return volatility, and risk-adjusted returns on our retail banking intensity
metrics, as well as on a series of control variables. We then test to see whether cross-sectional
differences in retail banking intensity are associated with higher returns and/or lower
volatility, as has been claimed by analysts and bankers. We perform this analysis for the
sample as a whole and for different sub-sets based on sample period and asset size.
The core regression equation is the following:
(2) tim
mmjti
J
jj
K
k
ktikti DZRETAILY ,
2004
1998,
11,0, εφγββ ++++= ∑∑∑
===
where Yi,t is one of the performance variables (market-based or accounting-based returns,
return volatility, or risk-adjusted returns) for BHC i in year t, RETAILk is one or more of the
retail intensity metrics, Z is a vector of J control variables, and Dm are a series of year dummy
variables to control for common factors like interest rates or macroeconomic conditions. We
estimate the equation with robust standard errors that take account of potential clustering in
the residuals by bank holding company.

19
These regressions, of course, are reduced form, so we include a set of control variables
to capture a range of institution-specific factors that might affect performance. These include
the log of BHC asset size and its square, the ratio of loans to assets, the ratio of deposits to
assets, the log of the equity capital ratio, and variables controlling for the composition of the
BHC’s loan portfolio and revenue stream. We divide the loan portfolio into four broad
categories – retail loans, non-retail C&I loans, non-retail real estate loans, and other loans –
and control for the share of loans in each category (non-residential real estate is the omitted
category in the regression), as well as concentration across the categories, measured as the
Herfindahl-Hirschman Index (HHI).40 We also control for the share of each BHC’s revenue
derived from non-interest income, as higher shares of non-interest income have been shown to
be associated with higher return volatility (Stiroh and Rumble (2006) and Stiroh (2006)).
Finally, we include a revenue HHI to control for concentration across the sources of each
BHC’s interest and non-interest income.41
a) Full Sample
Tables 4 to 6 present the estimation results using equity market returns, market
volatility, and risk-adjusted market returns, respectively, as the BHC performance measures.
The tables present specifications in which each of the three retail intensity metrics – retail
loan share, retail deposit share, and branches scaled by assets – is included separately, as well
as specifications where they are included together and in which the first principal component
of the three metrics is included. For comparison, we also report estimates of the equations
omitting the retail intensity variables. To conserve space, the coefficients on the year dummy
variables are not reported, though these variables are included in all specifications.
The results in Table 4 indicate that greater retail banking intensity is consistently
associated with lower average market returns. The coefficients on each of the three retail
intensity metrics is negative and statistically significant (columns (2) to (4)), and the
coefficients are negative and jointly significant when they are included together (column (5)).
40The HHI is calculated as the sum of the square of the shares of each category. As such, it ranges between 1.0 for a BHC with all its loans in a single category to 0.0 for a BHC with loans distributed evenly across a large number of categories. With 4 loan categories, the minimum value for the HHI is 0.25. 41We divide revenue into net interest income, and into 4 components on non-interest income: fees on deposit accounts, fiduciary income, trading income, and other non-interest income.

20
Finally, the coefficient on the first principal component is also negative and statistically
significant.
While the impact of increased retail intensity is statistically significant, the estimates
suggest that it is relatively small in economic terms. A one-standard-deviation increase in the
retail loan share variable, for instance, would result in just a 0.08 standard deviation decrease
in equity market returns (4.4 basis points). Even a simultaneous one-standard-deviation
increase in all three retail banking metrics would decrease equity market returns by only 0.12
standard deviations (6.9 basis points), all else equal. The small economic impact is also
reflected in the modest increase in overall explanatory power, e.g., the R-squared increases by
less than 1% when all three retail measures are included (column (1) vs. column (5)).
We also note several other interesting results. First, there is consistent hump-shaped
pattern between asset size and equity market returns with returns first rising and then falling
with size, which suggests the presence of eventual diminishing returns. Second, capital is
clearly important as banks with higher equity ratios show lower returns, on average. This
could reflect a direct leverage effect or be a proxy for risk, e.g., high-risk institutions may
hold less capital and earn higher returns. Third, non-interest revenue is typically insignificant
as in Stiroh (2006).
The picture is slightly more mixed with regard to the impact of retail banking
activities on the volatility of market returns (Table 5). The balance-sheet-based retail
intensity metrics – retail loan share and retail deposit share – suggest a negative relationship
between retail banking activities and market return volatility. However, there appears to be a
positive and marginally statistically significant relationship between branches scaled by assets
and volatility, especially when all three metrics are included in the specification (column (5)).
The coefficient on the principal component variable is negative (column (6)), suggesting that
the net effect of retail intensity on market return volatility may be negative, although the
coefficient is not statistically significant (see last row).
Given these differences in coefficient sign, the net impact of variation in retail banking
intensity on market volatility is quite small. The estimates imply that a simultaneous one-
standard-deviation increase in the three retail banking metrics would result in just a 0.040
standard deviation decrease in market volatility (6.2 basis points, as against a 1.56 percent
21
standard deviation). A one-standard-deviation increase in the first principal component would
result in a similarly sized impact on market volatility (7.4 basis points).
We also see no impact of size on volatility. Demsetz and Strahan (1997) argue that
large banks are internally diversified, which lowers idiosyncratic volatility, but exploit those
gains by holding lower capital ratios and making more high-risk loans. The net effect is that
overall volatility is unrelated to size, as shown here. We also find that commercial and
industrial loans are relatively high risk, as is common (Demsetz and Strahan (1997) and Stiroh
and Rumble (2006)). Finally, we see that concentration in both lending market and revenue
sources, as measured by HHIs, tends to increase volatility as one would expect if there are
diversification gains.
Combining the impact on returns and volatility in Table 6, we find a significant
negative relationship between retail banking intensity and risk-adjusted market returns. As
with unadjusted returns, each of the three metrics enters the equation with negative and
statistically significant coefficients, as does the first principal component (column (6)). This
summarizes our main conclusion that retail banking is not conditionally linked to improved
risk-adjusted returns.
As a robustness check on these basic results, Table 7 presents results using
accounting-based measures of returns (ROE) and return volatility as the BHC performance
variables. For conciseness, the table presents just the specifications that include all three
retail intensity metrics and the first principal component. The results based on accounting
data are generally consistent with those based on market return data. We see a negative and
statistically significant relationship between retail banking intensity and average returns,
though no significant relationship with return volatility or with risk-adjusted accounting
returns. Again, we find no evidence that retail intensity is associated with higher risk-
adjusted returns.
b) Split Sample
Our full sample covers periods of both declining and increasing focus on retail
banking in the U.S., as well as different financial market and economic conditions. In this
section, we examine whether the observed relationship between retail banking intensity and
performance is robust over time. To address this, we re-estimate the market return, market
volatility, and risk-adjusted market return equations after splitting the sample into two

22
periods: declining interest in retail banking from 1997 to 2000 and rising interest in retail
banking from 2001 to 2004. We selected this breakpoint based on industry trends in the retail
loan and retail deposit shares (Figures 1 and 3), both of which bottom out in 2000. In
addition, this generates nearly equally sized sub-samples.42
Table 8 reports estimates for market returns, market volatility, and risk-adjusted
market returns for two split periods (1997-2000 and 2001-2004) for two specifications
(including three retail measures and including the first principal component). The retail
banking coefficients appear quite stable across the two sub-periods and suggest that greater
retail banking intensity is associated with lower market returns and risk-adjusted market
returns. The impact on market volatility remains mixed with higher shares of retail loans and
retail deposits lowering volatility, but more branches per dollar of assets raising volatility.
In contrast, the coefficients on many of the control variables are quite sensitive to the
time period, particularly in the market returns and risk-adjusted market return equations. The
impact of asset size, portfolio composition, funding composition, capital strength, and revenue
composition and diversification all vary across the two sub-sample periods. These differences
likely reflect changes in the relative performance of various portfolios and business segments
over the two periods as economic and financial conditions evolved. For example, the stock
market boom of the late 1990s favored capital market-intensive banks. Nonetheless, our
primary conclusion about retail banking appears quite robust.
c) Size-Based Sub-Samples
The review of the retail intensity metrics in Section II suggests that there are important
differences among bank holding companies across sizes. To explore this observation further,
and to develop a better understanding of our core results, we divide our sample into sub-sets
by asset size and repeat the regression analysis. In particular, we separate the sample into
those BHCs with assets less than $1 billion (roughly half the sample), those with assets
between $1 and $10 billion, and the comparatively small number of very large BHCs (84)
with assets greater than $10 billion. These results are presented in Tables 9 to 11. Again,
we report only the regressions with all three retail metrics and the first principal component.
42The first principal component reaches a minimum in 1999 (Figure 7), so that is another possible break point.

23
The negative relationship between retail banking intensity and equity market returns is
evident within the sets of both larger and smaller BHCs (Table 9). The coefficients on the
retail loan share, retail deposit share, and branches scaled by assets variables are uniformly
negative in all three partitions of the sample, as are the coefficients on the first principal
components, though they are not always statistically significant. The results are strongest for
the $1-to-$10 billion sub-sample, where both the first principal component and three separate
retail banking metrics are statistically significant at high confidence levels (see the last row of
the table).43 The coefficients are somewhat less precisely estimated for the under-$1 billion
sub-sample, although the first principal component enters the equation with a statistically
significant coefficient. The coefficients are least precisely estimated for the sub-set of very
large bank holding companies (those with assets exceeding $10 billion), perhaps due to the
comparatively small sample size (just under 400 observations for 84 bank holding
companies). Higher branches-per-assets are significantly associated with lower returns for
this subset of institutions, however.
We also note differences in the impact of the control variables across size classes. For
example, the share of revenue from noninterest sources and revenue concentration are
negatively linked to returns only for the largest banks. This is also true for the revenue
concentration measure, which shows that increased concentration (higher revenue HHI) tends
to improve returns for banks in the $1B-$10B range, but lowers returns for the largest banks
with assets above $10B. Both of these results likely reflect the very different set of activities
in which larges banks engage, e.g., more proprietary trading and capital market activities, and
the different degree of intensity. In terms of concentration, for example, a mid-sized bank is
more likely to be concentrated in traditional banking activities, while if a very large bank is
concentrated, it is more likely to be concentrated in capital market activities.
As before, the results for the market volatility specification are a bit more complex
(Table 10). The first two columns suggest that the contrasting results for the overall sample –
increased retail loan and retail deposit shares associated with decreases in volatility, while
The results are quite similar if we split the sample in 1999.
24
increased branches-per-assets associated with increases in volatility – are driven primarily by
the smaller bank holding companies. The coefficients on retail loan share and retail deposit
share are negative and jointly statistically significant, while the coefficient on branches-per-
assets is positive and significant. The coefficient on the first principal component is not
significantly different from zero, consistent with the idea of no or a very small net impact of
increased retail intensity on market volatility for this group of institutions.
This pattern appears to reverse for larger bank holding companies, however. For mid-
sized BHCs, the coefficient on the retail loan share is negative and significant, while the
coefficients on the other variables are essentially zero. The coefficient on the first principal
component variable suggests a net negative impact of increased retail banking intensity for
these firms, but not precisely estimated. This negative impact is more marked for the set of
very large firms. Here, the coefficients on all three retail banking metrics are negative
(though not quite statistically significant), while the coefficient on the first principal
component is more than three times the size for the mid-sized BHCs and is significant at the 6
percent confidence level.
The most striking change in impact across BHC asset size groups is for the branch-
based retail banking metric. The coefficients on this variable go from large and positive in the
under $1-billion sample to large and negative in the over-$10 billion cohort. A one-standard
deviation increase in branches-per-assets would result in a 0.11 standard-deviation increase in
volatility in the under-$1 billion sub-sample as compared to a 0.11 standard deviation
decrease in volatility in the over-$10 billion group. These results suggest that for smaller
bank holding companies, greater emphasis on branch banking increases volatility, while
among large holding companies, the opposite is the case. A reasonable interpretation is that
large branch networks of the very large banks span many geographical markets and thus
provide important diversification benefits.
Table 11 illustrates the net effect of retail activity on equity market returns and
volatility by examining risk-adjusted returns. Risk-adjusted returns are negatively associated
43The three retail banking metrics are jointly statistically significant. In results not reported here, the coefficient on each variable is negative and statistically significant when they metrics are included in the specification individually.

25
with increased retail intensity for small and mid-sized bank holding companies. The
coefficients on the individual retail banking metrics are negative and jointly statistically
significant, as are the coefficients on the first principal component variable. For the very
largest bank holding companies, however, is no significant relationship between retail
banking intensity and risk-adjusted returns. While the coefficients are all negative, they are
not individually or jointly statistically significant. Evidently, any reduction in volatility
resulting from greater retail banking intensity is offset by a corresponding reduction in returns
for these institutions.
Our results suggest that retail banking is a relatively low return activity for the full
range of bank holding companies in our sample, but that these activities reduce institution-
level risk only among the very largest firms. This likely reflects the broader range of
activities pursued by large bank holding companies as compared to smaller ones, such as
trading and capital market services, some of which are comparatively high risk. In addition,
among large institutions, those with higher retail intensity may be diversified relative to the
norm, whereas among smaller BHCs, those with a higher degree of retail focus may actually
be more concentrated as retail activities tend to be more dominant for these firms. Whatever
the case, the net impact of greater retail intensity, in terms of risk-adjusted returns, is negative
for small and mid-sized BHCs and neutral for the very largest.
A key factor in these findings is the role of branches, which appear to have opposite
effect on market volatility for small and large banking companies. Greater branching
intensity leads to higher market volatility for smaller bank holding companies, but to
(marginally) lower volatility for large ones. The finding for large banks is consistent with
trends in branching, which have seen more concentration of branches at these large
institutions (Hirtle and Metli (2004)), and with the perception of analysts, who have focused
on larger institutions.
V. Conclusions
The U.S. banking industry has recently renewed its focus on retail banking. This can
be seen in the continued growth in bank branches, the motivation for recent large mergers,
and industry commentary from a broad range of sources. Our study is the first, to our
knowledge, to systematically examine the risk and return of retail-based strategies.

26
We conclude that a focus on retail activities is not associated with improved
performance, measured by equity market returns and volatility, for the largest banks, and may
actually lower performance for small and medium-sized institutions. For the largest banks
that dominate U.S. banking, both equity market returns and volatility tend to fall with retail
intensity. From a finance perspective, this is completely reasonable if consumer-driven retail
banking is simply a low-risk, low-return business, but it does counter the perception of some
that retail banking offers the advantages of both higher returns and higher risk.
Looking toward the future, we offer some speculation based the recent past. Our
examination of the industry trends and commentary suggests a cyclical nature to the interest
in retail activities. In this sense, the current level of focus may well be temporary as banks
react to the turbulence in capital markets since 2000. As technology continues to evolve and
relative returns in other financial activities improve, banks may once again switch their focus
to developing other businesses and shifting away from the branch-centric mode of retail
banking.

27
References
Cummins, J. David, Richard D. Phillips, and Stephen D. Smith. “The Rise of Risk Management.” Federal Reserve Bank of Atlanta Economic Review, First Quarter 1998, 30-40.
Demsetz, Rebecca S. and Philip E. Strahan. “Diversification, Size, and Risk at Bank Holding Companies.” Journal of Money, Credit and Banking, 29(3), August 1997, 300-313.
Froot, Kenneth A., David S. Scharfstein, and Jeremy C. Stein. “Risk Management: Coordinating Corporate Investment and Financing Policies.” Journal of Finance, XLVIII(5), December 1993, 1629-1658.
Froot, Kenneth A. and Jeremy C. Stein. “Risk Management, Capital Budgeting, and Capital Structure Policy for Financial Institutions: An Integrated Approach.” Journal of Financial Economics, 47, 1998, 55-82.
Hirtle, Beverly J. and Christopher Metli. “The Evolution of U.S. Bank Branch Networks: Growth, Consolidation, and Strategy,” Federal Reserve Bank of New York, Current Issues in Economic and Finance, July 2004, 10(8).
Houston, Joel, Christopher James, and David Marcus. “Capital Market Frictions and the Role of Internal Capital Markets in Banking,” Journal of Financial Economics, 46, 1997, 135-164.
Houston, Joel and Kevin J. Stiroh. “Thirty Years of Financial Sector Risk,” Working Paper, Federal Reserve Bank of New York, March 2006.
Merton, Robert C. “On the Pricing of Corporate Debt: The Risk Structure of Interest Rates,” Journal of Finance, 29(2), May 1974, 449-470.
Morgan Donald P. and Katherine Samolyk. “Bigger and Wider. The (Neglected) Benefits of Geographic Diversification in Banking.” Federal Reserve Bank of New York, mimeo, June 2005.
Slovin, Myron B., Marie E. Sushka, and John A. Polonchek. “The Value of Bank Durability: Borrowers as Bank Stakeholders,” The Journal of Finance, Vol. XLVIII, No. 1, March 1993, 247-266.
Spieker, Ronald. “Bank Branch Growth has Been Steady: Will it Continue?,” FDIC Draft FOB 2004-08.
Stiroh, Kevin J. “Diversification in Banking: Is Noninterest Income the Answer?,” Journal of Money, Credit, and Banking, 36(5), October 2004, 853-882.
Stiroh, Kevin J. “A Portfolio View of Banking with Interest and Noninterest Activities,” Journal of Money, Credit, and Banking, 38(5), August 2006, 1351-1361.
Stiroh, Kevin J. and Adrienne Rumble. “The Darkside of Diversification: The Case of U.S. Financial Holding Companies, Journal of Banking and Finance, 30(8), August 2006, 2131-2161.
Strahan, Philip E. “The Real Effects of U.S. Banking Deregulation,” Federal Reserve Bank of St. Louis, Review, July/August 2003, 111-128.
Stulz, Rene. “Optimal Hedging Policies.” Journal of Financial and Quantitative Analysis, 19, 1984, 127-140.

28
Table 1 Correlation of Retail Intensity Measures
Retail Loan Share Retail Deposit Share Branches per Assets
Retail Loan Share 1.000
Retail Deposit Share 0.406 (0.306 – 0.568)
1.000
Branches per Assets 0.212 (0.135 – 0.293)
0.307 (0.277 – 0.338)
1.000
This table reports the average annual correlation coefficients between the retail loan share, retail deposit share, and branches per assets measures of retail banking intensity. The top number is average of annual correlations fore each pair of retail intensity measures over the years 1997 to 2004. The figures in parentheses are the range of these annual correlations. The data are 3110 observations for 708 publicly traded bank holding companies from 1997 to 2004.

29
Table 2 Correlation of Retail Revenue and Profit Shares and Retail Banking Intensity Metrics
for Selected Large Bank Holding Companies
Retail Share of Revenue (1) (2) (3) (4) (5) Retail Loan Share 102.072*** 97.721*** (22.820)
(18.140)
Retail Deposit Share 47.338 2.046 (34.781)
(24.867)
Branches per Assets 1.937** 1.668 (0.833)
(0.984)
First Principal Component 9.565** (3.739)
Observations 52 52 52 52 52 R-squared 0.51 0.19 0.20 0.67 0.42 Sig. of Retail Variable(s) 0.00 0.20 0.04 0.00 0.03
Retail Share of Net Income (1) (2) (3) (4) (5) Retail Loan Share 100.660*** 96.299*** (22.323)
(18.899)
Retail Deposit Share 37.077 11.946 (34.443)
(22.537)
Branches per Assets 1.122 0.567 (1.037)
(1.018)
First Principal Component 8.133* (4.149)
Observations 52 52 52 52 52 R-squared 0.51 0.13 0.08 0.55 0.31 Sig. of Retail Variable(s) 0.00 0.30 0.30 0.00 0.08
This table reports the results of regressions of the share of revenues and profits from retail banking activities as reported in public financial statements on three measures of retail banking intensity derived from bank holding company regulatory reports. The data are for 12 large bank holding companies whose public financial statements report business segment information for identifiable retail banking business lines over the years 2001 to 2005. The regressions include year dummy variables and the standard errors have been corrected to reflect the possibility of clustering by bank holding company. The rows labeled “Sig. of Retail Variable(s)” reports the p-value of the test of statistical significance of the coefficients on the retail intensity measure(s). Robust standard errors are reported in parentheses. The symbols ***, **, and * indicate statistical significance at the 1%, 5%, and 10% levels, respectively.

30
Table 3
Basic Statistics of the Regression Data
Mean
Median Standard Deviation
Minimum
Maximum
Retail Intensity Variables Retail Loan Share
0.530
0.543
0.177
0.005
0.993
Retail Deposit Share
0.709
0.727
0.121
0.000
0.944
Branches per Million Dollars of Assets
0.020
0.019
0.010
0.0001
0.079
First Principal Component
0.000
0.165
1.273
-6.649
3.630
BHC Performance Variables Market Return
0.399
0.939
0.582
-2.984
3.027
Market Return Volatility
4.066
3.786
1.556
0.617
18.045
Risk-Adjusted Market Return
0.108
0.108
0.145
-0.400
0.727
Book Return on Equity (ROE)
12.625
13.228
7.218
-134.89
45.283
ROE Volatility
2.832
1.219
7.284
0.000
200.63
Risk-Adjusted ROE
16.809
10.316
23.005
-2.455
506.41
Control Variables Asset Size
12.127
1.028
64.295
0.156
1264.0
Loan-to-Asset Ratio
0.648
0.662
0.116
0.021
0.904
Deposit-to-Asset Ratio
0.765
0.787
0.106
0.088
0.936
Equity Capital Ratio
0.090
0.086
0.032
0.015
0.681
Non-retail C&I Loan Share
0.082
0.049
0.097
0.000
0.714
Non-retail Real Estate Loan Share
0.345
0.321
0.173
0.000
0.995
Other Loan Share
0.043
0.024
0.061
0.000
0.802
Loan Concentration (HHI)
0.483
0.468
0.115
0.258
0.989
Non-interest Income Share of Revenue
0.233
0.205
0.130
-0.560
0.984
Revenue Concentration (HHI)
0.647
0.653
0.133
0.271
2.767
Source: Equity market data as reported by the Center for Research in Securities Prices (CRSP). Bank holding company balance sheet and income statement data are from the Federal Reserve Y-9C reports, except for small business loan data, which are from the FFIEC Reports on Condition and Income for commercial banks. Branch data are from the FDIC’s Summary of Deposits database.

31
Table 4 Retail Activity and Equity Market Returns
(1) (2) (3) (4) (5) (6) Retail Variables Retail Loans/Loans -0.248*** -0.203*** (0.070)
(0.068)
Retail Deposits/ -0.221*** -0.107 Deposits (0.084)
(0.079)
Branches/Assets -2.926*** -2.040** (1.070)
(1.024)
First Principal -0.040*** Component
(0.010)
Log of Assets 0.233*** 0.221*** 0.254*** 0.207*** 0.216*** 0.230*** (0.067) (0.066)
(0.066) (0.067) (0.065) (0.066)
Log of Assets Squared -0.008*** -0.007*** -0.008*** -0.007*** -0.007*** -0.008*** (0.002) (0.002)
(0.002) (0.002) (0.002) (0.002)
Loans/Assets -0.039 -0.044 -0.036 -0.029 -0.035 -0.030 (0.075) (0.073)
(0.073) (0.074) (0.072) (0.072)
C&I Loans/Loans 0.136 0.017 0.063 0.046 -0.060 -0.063 (0.113) (0.114)
(0.125) (0.120) (0.125) (0.129)
Other Loans/Loans -0.161 -0.243 -0.148 -0.143 -0.210 -0.183 (0.193) (0.189)
(0.203) (0.186) (0.189) (0.196)
Loan Share HHI 0.126 0.268** 0.153 0.105 0.240** 0.215** (0.104) (0.115)
(0.105) (0.103) (0.116) (0.106)
Deposits/Assets 0.161* 0.142 0.164* 0.223** 0.190** 0.196** (0.094) (0.089)
(0.091) (0.097) (0.091) (0.090)
Log(Equity Capital -0.101** -0.093** -0.092** -0.092* -0.084* -0.082* Ratio) (0.047) (0.047)
(0.046) (0.047) (0.047) (0.046)
Non-interest Income/ 0.267** 0.237* 0.187 0.208 0.162 0.136 Revenue (0.130) (0.128)
(0.136) (0.134) (0.137) (0.138)
Revenue Share HHI 0.441*** 0.365*** 0.406*** 0.371*** 0.314** 0.322** (0.126) (0.128)
(0.130) (0.131) (0.135) (0.136)
Observations
3110
3110
3110
3110
3110
3110
R-squared
0.387 0.391 0.389 0.389 0.392 0.392
Sig. of Retail Variable(s) 0.00
0.01 0.01 0.00 0.00
This table reports the results of regressions of BHC equity market returns on measures of retail banking intensity derived from bank holding company regulatory reports. The data are for 708 bank holding companies over the years 1997 to 2004. The regressions include year dummy variables and the standard errors have been corrected to reflect the possibility of clustering by bank holding company. “Sig. Of Retail Variables(s)” reports the p-value of the test of statistical significance of the coefficient(s) on the retail banking intensity measure(s). Robust standard errors are reported in parentheses. The symbols ***, **, and * indicate statistical significance at the 1%, 5%, and 10% levels, respectively.

32
Table 5 Retail Activity and Market Return Volatility
(1) (2) (3) (4) (5) (6) Retail Variables Retail Loans/Loans -0.627** -0.600** (0.257)
(0.276)
Retail Deposits/ -0.688** -0.591 Deposits (0.331)
(0.379)
Branches/Assets 8.302 11.586* (5.895)
(6.052)
First Principal -0.051 Component (0.039)
Log of Assets -0.174 -0.202 -0.106 -0.103 -0.043 -0.177 (0.295) (0.291)
(0.290) (0.283) (0.271) (0.294)
Log of Assets Squared 0.003 0.004 0.001 0.001 -0.000 0.003 (0.009) (0.009)
(0.009) (0.009) (0.009) (0.009)
Loans/Assets 0.185 0.172 0.195 0.155 0.141 0.197 (0.361) (0.363)
(0.366) (0.359) (0.365) (0.363)
C&I Loans/Loans 2.168*** 1.867*** 1.939** 2.425*** 2.042*** 1.908** (0.690) (0.694)
(0.761) (0.719) (0.762) (0.760)
Other Loans/Loans 1.240* 1.032 1.279* 1.190* 1.006 1.211 (0.726) (0.751)
(0.751) (0.712) (0.754) (0.744)
Loan Share HHI 0.950** 1.308*** 1.032** 1.011** 1.449*** 1.065** (0.476) (0.479)
(0.472) (0.482) (0.493) (0.468)
Deposits/Assets -0.003 -0.052 0.006 -0.178 -0.286 0.043 (0.479) (0.469)
(0.472) (0.502) (0.489) (0.476)
Log(Equity Capital -1.191*** -1.171*** -1.162*** -1.218*** -1.185*** -1.165*** Ratio) (0.181) (0.180)
(0.179) (0.186) (0.182) (0.184)
Non-interest Income/ 3.009*** 2.931*** 2.758*** 3.177*** 2.953*** 2.838*** Revenue (0.597) (0.599)
(0.573) (0.593) (0.576) (0.580)
Revenue Share HHI 2.146*** 1.955*** 2.037*** 2.345*** 2.146*** 1.991*** (0.523) (0.515)
(0.508) (0.521) (0.502) (0.510)
Observations
3110
3110
3110
3110
3110
3110
R-squared
0.243 0.246 0.245 0.244 0.250 0.244
Sig. of Retail Variable(s)
0.02 0.04 0.16 0.01 0.19
This table reports the results of regressions of BHC equity market return volatility on measures of retail banking intensity derived from bank holding company regulatory reports. The data are for 708 bank holding companies over the years 1997 to 2004. The regressions include year dummy variables and the standard errors have been corrected to reflect the possibility of clustering by bank holding company. “Sig. Of Retail Variables(s)” reports the p-value of the test of statistical significance of the coefficient(s) on the retail banking intensity measure(s). Robust standard errors are reported in parentheses. The symbols ***, **, and * indicate statistical significance at the 1%, 5%, and 10% levels, respectively.

33
Table 6 Retail Activity and Risk-Adjusted Market Returns
(1) (2) (3) (4) (5) (6) Retail Variables Retail Loans/Loans -0.049*** -0.040*** (0.013)
(0.013)
Retail Deposits/ -0.046*** -0.024 Deposits (0.016)
(0.016)
Branches/Assets -0.538** -0.356 (0.233)
(0.228)
First Principal -0.008*** Component (0.002)
Log of Assets 0.052*** 0.049*** 0.056*** 0.047*** 0.049*** 0.051*** (0.014) (0.014)
(0.014) (0.014) (0.014) (0.014)
Log of Assets Squared -0.002*** -0.002*** -0.002*** -0.001*** -0.002*** -0.002*** (0.000) (0.000)
(0.000) (0.000) (0.000) (0.000)
Loans/Assets 0.001 -0.000 0.002 0.003 0.002 0.003 (0.017) (0.016)
(0.017) (0.017) (0.016) (0.016)
C&I Loans/Loans 0.008 -0.015 -0.007 -0.008 -0.030 -0.032 (0.019) (0.020)
(0.020) (0.022) (0.022) (0.022)
Other Loans/Loans -0.061* -0.077** -0.058* -0.058* -0.071** -0.065* (0.034) (0.035)
(0.035) (0.034) (0.035) (0.034)
Loan Share HHI 0.028 0.056*** 0.033 0.024 0.051** 0.046** (0.021) (0.021)
(0.021) (0.021) (0.021) (0.021)
Deposits/Assets 0.022 0.018 0.022 0.033 0.026 0.029 (0.020) (0.019)
(0.019) (0.021) (0.020) (0.019)
Log(Equity Capital -0.009 -0.007 -0.007 -0.007 -0.005 -0.005 Ratio) (0.008) (0.008)
(0.009) (0.009) (0.009) (0.009)
Non-interest Income/ 0.004 -0.002 -0.013 -0.007 -0.017 -0.023 Revenue (0.027) (0.027)
(0.028) (0.028) (0.030) (0.029)
Revenue Share HHI 0.062** 0.047 0.054* 0.049* 0.037 0.038 (0.027) (0.029)
(0.028) (0.029) (0.030) (0.030)
Observations
3110
3110
3110
3110
3110
3110
R-squared
0.501 0.504 0.502 0.502 0.504 0.504
Sig. of Retail Variable(s)
0.00 0.00 0.02 0.00 0.00
This table reports the results of regressions of BHC risk-adjusted equity market returns (average returns divided by the standard deviation of returns) on measures of retail banking intensity derived from bank holding company regulatory reports. The data are for 708 bank holding companies over the years 1997 to 2004. The regressions include year dummy variables and the standard errors have been corrected to reflect the possibility of clustering by bank holding company. “Sig. Of Retail Variables(s)” reports the p-value of the test of statistical significance of the coefficient(s) on the retail banking intensity variable(s). Robust standard errors are reported in parentheses. The symbols ***, **, and * indicate statistical significance at the 1%, 5%, and 10% levels, respectively.
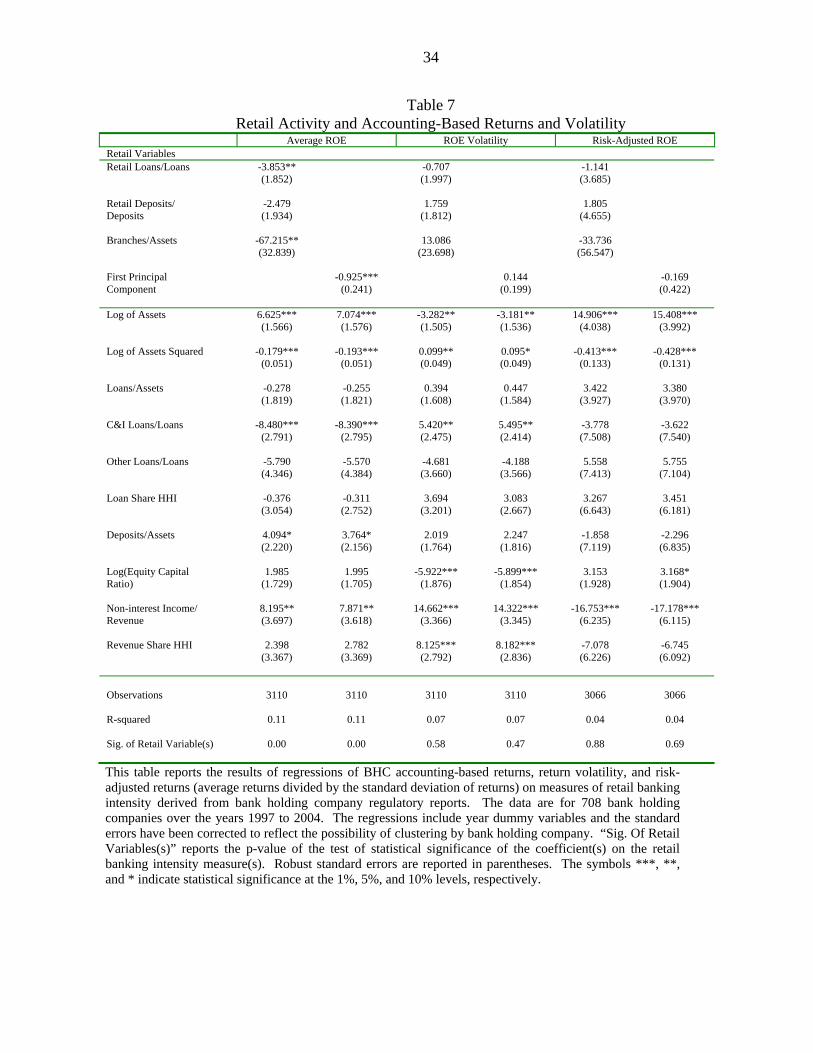
34
Table 7 Retail Activity and Accounting-Based Returns and Volatility
Average ROE ROE Volatility Risk-Adjusted ROE Retail Variables Retail Loans/Loans -3.853** -0.707 -1.141 (1.852)
(1.997) (3.685)
Retail Deposits/ -2.479 1.759 1.805 Deposits (1.934)
(1.812) (4.655)
Branches/Assets -67.215** 13.086 -33.736 (32.839)
(23.698) (56.547)
First Principal -0.925*** 0.144 -0.169 Component (0.241)
(0.199) (0.422)
Log of Assets 6.625*** 7.074*** -3.282** -3.181** 14.906*** 15.408*** (1.566)
(1.576) (1.505) (1.536) (4.038) (3.992)
Log of Assets Squared -0.179*** -0.193*** 0.099** 0.095* -0.413*** -0.428*** (0.051)
(0.051) (0.049) (0.049) (0.133) (0.131)
Loans/Assets -0.278 -0.255 0.394 0.447 3.422 3.380 (1.819)
(1.821) (1.608) (1.584) (3.927) (3.970)
C&I Loans/Loans -8.480*** -8.390*** 5.420** 5.495** -3.778 -3.622 (2.791)
(2.795) (2.475) (2.414) (7.508) (7.540)
Other Loans/Loans -5.790 -5.570 -4.681 -4.188 5.558 5.755 (4.346)
(4.384) (3.660) (3.566) (7.413) (7.104)
Loan Share HHI -0.376 -0.311 3.694 3.083 3.267 3.451 (3.054)
(2.752) (3.201) (2.667) (6.643) (6.181)
Deposits/Assets 4.094* 3.764* 2.019 2.247 -1.858 -2.296 (2.220)
(2.156) (1.764) (1.816) (7.119) (6.835)
Log(Equity Capital 1.985 1.995 -5.922*** -5.899*** 3.153 3.168* Ratio) (1.729)
(1.705) (1.876) (1.854) (1.928) (1.904)
Non-interest Income/ 8.195** 7.871** 14.662*** 14.322*** -16.753*** -17.178*** Revenue (3.697)
(3.618) (3.366) (3.345) (6.235) (6.115)
Revenue Share HHI 2.398 2.782 8.125*** 8.182*** -7.078 -6.745 (3.367)
(3.369) (2.792) (2.836) (6.226) (6.092)
Observations
3110
3110
3110
3110
3066
3066
R-squared
0.11 0.11 0.07 0.07 0.04 0.04
Sig. of Retail Variable(s)
0.00 0.00 0.58 0.47 0.88 0.69
This table reports the results of regressions of BHC accounting-based returns, return volatility, and risk-adjusted returns (average returns divided by the standard deviation of returns) on measures of retail banking intensity derived from bank holding company regulatory reports. The data are for 708 bank holding companies over the years 1997 to 2004. The regressions include year dummy variables and the standard errors have been corrected to reflect the possibility of clustering by bank holding company. “Sig. Of Retail Variables(s)” reports the p-value of the test of statistical significance of the coefficient(s) on the retail banking intensity measure(s). Robust standard errors are reported in parentheses. The symbols ***, **, and * indicate statistical significance at the 1%, 5%, and 10% levels, respectively.

35
Table 8
Retail Activity, Market Returns, and Risk Over the Retail Banking Cycle Market Return Market Volatility Risk-Adjusted Market Return
1997 - 2000 2001 - 2004 1997 - 2000 2001 - 2004 1997 - 2000 2001 - 2004 Retail Loans/Loans -0.293** -0.130* -1.128** -0.275 -0.052** -0.028* (0.133)
(0.074) (0.468)
(0.292) (0.024)
(0.016)
Retail Deposits/ 0.222 -0.189* 0.057 -0.978*** 0.016 -0.023 Deposits (0.160)
(0.098) (0.688)
(0.346) (0.028)
(0.023)
Branches/Assets -3.898*** -0.095 8.248 15.162* -0.594** -0.121 (1.375)
(1.977) (7.404)
(8.566) (0.297)
(0.414)
First Principal -0.030* -0.032*** -0.045 -0.042 -0.007** -0.006** Component (0.017)
(0.012) (0.054)
(0.048) (0.003)
(0.003)
Log of Assets 0.375*** 0.437*** 0.020 0.004 -0.701* -0.771* 0.361 0.147 0.109*** 0.117*** -0.015 -0.016 (0.109)
(0.113) (0.091) (0.088) (0.384) (0.432) (0.338) (0.360) (0.023) (0.022) (0.020) (0.020)
Log of Assets Squared -0.011*** -0.013*** -0.002 -0.002 0.023* 0.025* -0.015 -0.009 -0.003*** -0.003*** 0.000 0.000 (0.004)
(0.004) (0.003) (0.003) (0.013) (0.014) (0.011) (0.012) (0.001) (0.001) (0.001) (0.001)
Loans/Assets -0.264** -0.244** 0.012 0.019 0.024 0.064 0.033 0.128 -0.040 -0.037 0.010 0.011 (0.123)
(0.122) (0.099) (0.100) (0.506) (0.504) (0.422) (0.431) (0.025) (0.025) (0.023) (0.024)
C&I Loans/Loans 0.139 0.138 -0.281 -0.320 1.821** 1.805** 2.307** 1.953** 0.004 0.004 -0.071 -0.075* (0.157)
(0.176) (0.241) (0.229) (0.862) (0.908) (0.972) (0.921) (0.027) (0.027) (0.043) (0.041)
Other Loans/Loans 0.261 0.303 -0.699*** -0.681*** 0.356 0.644 1.431 1.523 -0.021 -0.014 -0.123** -0.117** (0.387)
(0.412) (0.236) (0.232) (0.836) (0.829) (0.975) (1.008) (0.054) (0.055) (0.053) (0.053)
Loan Share HHI 0.303 0.214 0.141 0.108 1.881** 1.052* 1.282** 0.960* 0.051 0.036 0.037 0.032 (0.206)
(0.168) (0.142) (0.137) (0.730) (0.619) (0.570) (0.559) (0.035) (0.031) (0.029) (0.028)
Deposits/Assets 0.610*** 0.543*** -0.220 -0.187 -0.295 0.000 -0.175 0.116 0.106*** 0.099*** -0.057* -0.052* (0.141)
(0.135) (0.144) (0.142) (0.644) (0.616) (0.580) (0.573) (0.028) (0.026) (0.031) (0.030)
Log(Equity Capital 0.068 0.072 -0.172** -0.169** -1.118*** -1.085*** -1.228*** -1.205*** 0.028** 0.029** -0.023* -0.022* Ratio) (0.055)
(0.055) (0.077) (0.076) (0.210) (0.207) (0.277) (0.282) (0.012) (0.012) (0.014) (0.013)
Non-interest Income/ 0.469** 0.417* 0.122 0.111 3.074*** 2.813*** 3.076*** 3.107*** 0.073* 0.065* -0.050 -0.054 Revenue (0.234)
(0.227) (0.239) (0.235) (0.972) (0.947) (0.686) (0.716) (0.038) (0.036) (0.058) (0.058)
Revenue Share HHI 0.551*** 0.614*** 0.315 0.298 1.758** 1.614** 2.800*** 2.674*** 0.100*** 0.107*** 0.029 0.027 (0.194) (0.197) (0.232) (0.232) (0.709) (0.733) (0.682) (0.681) (0.036) (0.034) (0.058) (0.058) Observations 1534 1534 1576 1576 1534 1534 1576 1576 1534 1534 1576 1576 R-squared 0.49 0.49 0.19 0.19 0.21 0.20 0.23 0.22 0.62 0.62 0.19 0.19 Sig. Of Retail Variables(s) 0.00 0.08 0.02 0.01 0.04 0.40 0.00 0.39 0.04 0.03 0.12 0.02
This table reports the results of regressions of BHC equity market returns, equity market volatility, and risk-adjusted equity market returns on measures of retail banking intensity derived from bank holding company regulatory reports. The data are for 708 bank holding companies over the years 1997 to 2000 and 2001 to 2004. The regressions include year dummy variables and the standard errors have been corrected to reflect the possibility of clustering by bank holding company. “Sig. Of Retail Variables(s)” reports the p-value of the test of statistical significance of the coefficient(s) on the retail banking intensity variable(s). Robust standard errors are reported in parentheses. The symbols ***, **, and * indicate statistical significance at the 1%, 5%, and 10% levels, respectively.

36
Table 9
Retail Activity and Equity Market Returns by BHC Asset Size
Less Than $1 Billion $1 to $10 Billion More than $10 Billion Retail Variables Retail Loans/Loans -0.128 -0.229*** -0.159 (0.112)
(0.082) (0.164)
Retail Deposits/ -0.117 -0.122 -0.002 Deposits (0.151)
(0.109) (0.189)
Branches/Assets -2.027 -1.258 -6.850** (1.371)
(1.385) (3.191)
First Principal -0.034* -0.039*** -0.034 Component (0.017)
(0.010) (0.030)
Log of Assets 0.643 0.673 0.952 1.015 -0.156 0.046 (1.463)
(1.463) (0.657) (0.669) (0.432) (0.398)
Log of Assets Squared -0.023 -0.024 -0.033 -0.035 0.002 -0.003 (0.056)
(0.056) (0.022) (0.023) (0.012) (0.011)
Loans/Assets -0.067 -0.066 -0.053 -0.057 -0.059 -0.069 (0.121)
(0.117) (0.101) (0.100) (0.168) (0.165)
C&I Loans/Loans -0.385 -0.400* 0.097 0.097 -0.195 -0.117 (0.243)
(0.240) (0.155) (0.160) (0.195) (0.205)
Other Loans/Loans -0.749** -0.741** 0.048 0.075 -0.142 -0.166 (0.309)
(0.310) (0.167) (0.174) (0.399) (0.390)
Loan Share HHI 0.018 0.021 0.282** 0.239* 0.334 0.343* (0.197)
(0.171) (0.142) (0.136) (0.203) (0.181)
Deposits/Assets 0.353** 0.341** 0.131 0.140 -0.075 -0.175 (0.154)
(0.137) (0.129) (0.128) (0.212) (0.221)
Log(Equity Capital -0.044 -0.044 -0.098** -0.094* 0.013 0.028 Ratio) (0.073)
(0.072) (0.049) (0.048) (0.107) (0.108)
Non-interest Income/ 0.159 0.149 0.269 0.243 -0.818*** -0.780*** Revenue (0.249)
(0.246) (0.179) (0.184) (0.205) (0.192)
Revenue Share HHI 0.320 0.324 0.529*** 0.538*** -1.185*** -1.046*** (0.210)
(0.209) (0.186) (0.189) (0.322) (0.324)
Observations
1513
1513
1203
1203
394
394
R-squared
0.42 0.42 0.42 0.42 0.53 0.53
Sig. of Retail Variable(s)
0.21 0.05 0.00 0.00 0.15 0.25
This table reports the results of regressions of BHC equity market returns on measures of retail banking intensity derived from bank holding company regulatory reports. The data are for 708 bank holding companies over the years 1997 to 2004, where the sample is split by BHC asset size in real (2004) dollars. The regressions include year dummy variables and the standard errors have been corrected to reflect the possibility of clustering by bank holding company. “Sig. Of Retail Variables(s)” reports the p-value of the test of statistical significance of the coefficient(s) on the retail banking intensity measure(s). Robust standard errors are reported in parentheses. The symbols ***, **, and * indicate statistical significance at the 1%, 5%, and 10% levels, respectively.

37
Table 10 Retail Activity and Market Return Volatility
by BHC Asset Size Less Than $1 Billion $1 to $10 Billion More than $10 Billion Retail Variables Retail Loans/Loans -0.446 -0.817** -1.259 (0.414)
(0.326) (0.897)
Retail Deposits/ -1.686*** 0.130 -0.396 Deposits (0.626)
(0.593) (0.547)
Branches/Assets 18.404** 4.490 -22.136 (8.422)
(6.133) (14.220)
First Principal -0.041 -0.052 -0.162* Component (0.064)
(0.046) (0.084)
Log of Assets -17.049*** -17.047*** 12.732*** 13.094*** -1.978 -1.460 (5.809)
(6.067) (2.722) (2.829) (1.464) (1.450)
Log of Assets Squared 0.653*** 0.651*** -0.436*** -0.449*** 0.055 0.041 (0.222)
(0.232) (0.092) (0.095) (0.040) (0.040)
Loans/Assets -0.351 -0.224 0.571 0.545 -0.296 -0.301 (0.537)
(0.530) (0.488) (0.512) (0.773) (0.778)
C&I Loans/Loans 1.284 1.433 2.485** 2.471** 0.198 0.770 (1.107)
(1.172) (1.039) (1.129) (0.960) (0.794)
Other Loans/Loans 1.195 1.292 1.434 1.599 2.490* 2.663** (1.483)
(1.563) (1.100) (1.153) (1.253) (1.237)
Loan Share HHI 1.552* 0.985 1.317** 0.988* 2.621** 2.181** (0.791)
(0.756) (0.596) (0.585) (1.017) (0.927)
Deposits/Assets -0.315 0.572 -0.823 -0.742 -0.123 -0.363 (0.791)
(0.760) (0.598) (0.592) (0.884) (0.826)
Log(Equity Capital -1.412*** -1.381*** -0.829*** -0.797*** -0.332 -0.311 Ratio) (0.286)
(0.291) (0.180) (0.184) (0.325) (0.335)
Non-interest Income/ 4.563*** 4.590*** 2.208*** 2.035*** -0.605 -0.348 Revenue (0.897)
(0.995) (0.649) (0.657) (1.068) (1.045)
Revenue Share HHI 3.163*** 2.976*** 1.481** 1.495** -1.461 -0.658 (0.771)
(0.816) (0.652) (0.683) (1.573) (1.414)
Observations
1513
1513
1203
1203
394
394
R-squared
0.21 0.19 0.33 0.32 0.70 0.69
Sig. of Retail Variable(s)
0.01 0.52 0.04 0.25 0.14 0.06
This table reports the results of regressions of BHC equity market return volatility on measures of retail banking intensity derived from bank holding company regulatory reports. The data are for 708 bank holding companies over the years 1997 to 2004, where the sample is split by BHC asset size in real (2004) dollars. The regressions include year dummy variables and the standard errors have been corrected to reflect the possibility of clustering by bank holding company. “Sig. Of Retail Variables(s)” reports the p-value of the test of statistical significance of the coefficient(s) on the retail banking intensity measure(s). Robust standard errors are reported in parentheses. The symbols ***, **, and * indicate statistical significance at the 1%, 5%, and 10% levels, respectively.

38
Table 11 Retail Activity and Risk-Adjusted Market Returns
by BHC Asset Size Less Than $1 Billion $1 to $10 Billion More than $10 Billion Retail Variables Retail Loans/Loans -0.034* -0.038** -0.006 (0.019)
(0.019) (0.049)
Retail Deposits/ -0.034 -0.018 -0.004 Deposits (0.027)
(0.022) (0.047)
Branches/Assets -0.366 -0.199 -1.439 (0.296)
(0.383) (0.944)
First Principal -0.008*** -0.006*** -0.006 Component (0.003)
(0.002) (0.007)
Log of Assets 0.554* 0.563* 0.033 0.044 -0.072 -0.032 (0.323)
(0.322) (0.182) (0.182) (0.112) (0.100)
Log of Assets Squared -0.021* -0.021* -0.001 -0.001 0.001 0.000 (0.012)
(0.012) (0.006) (0.006) (0.003) (0.003)
Loans/Assets -0.009 -0.008 -0.014 -0.015 0.013 0.008 (0.026)
(0.025) (0.024) (0.024) (0.051) (0.051)
C&I Loans/Loans -0.071 -0.075 -0.020 -0.020 -0.018 -0.012 (0.055)
(0.054) (0.028) (0.025) (0.056) (0.058)
Other Loans/Loans -0.115* -0.112* -0.074* -0.069* -0.102 -0.112 (0.068)
(0.067) (0.040) (0.038) (0.104) (0.099)
Loan Share HHI 0.043 0.041 0.029 0.022 0.011 0.031 (0.035)
(0.033) (0.029) (0.028) (0.060) (0.046)
Deposits/Assets 0.052 0.055* 0.017 0.018 -0.008 -0.031 (0.035)
(0.031) (0.028) (0.028) (0.058) (0.061)
Log(Equity Capital 0.003 0.004 -0.007 -0.007 -0.006 -0.003 Ratio) (0.013)
(0.012) (0.011) (0.011) (0.027) (0.028)
Non-interest Income/ -0.050 -0.053 0.033 0.029 -0.212*** -0.203*** Revenue (0.053)
(0.052) (0.036) (0.037) (0.060) (0.062)
Revenue Share HHI 0.017 0.017 0.103*** 0.105*** -0.288*** -0.268*** (0.050)
(0.050) (0.038) (0.038) (0.085) (0.085)
Observations
1513
1513
1203
1203
394
394
R-squared
0.52 0.52 0.54 0.54 0.64 0.64
Sig. of Retail Variable(s)
0.05 0.00 0.04 0.01 0.51 0.40
This table reports the results of regressions of BHC risk-adjusted equity market returns (average returns divided by the standard deviation of returns) on measures of retail banking intensity derived from bank holding company regulatory reports. The data are for 708 bank holding companies over the years 1997 to 2004, where the sample is split by BHC asset size in real (2004) dollars. The regressions include year dummy variables and the standard errors have been corrected to reflect the possibility of clustering by bank holding company. “Sig. Of Retail Variables(s) reports the p-value of the test of statistical significance of the coefficient(s) on the retail banking intensity measure(s). Robust standard errors are reported in parentheses. The symbols ***, **, and * indicate statistical significance at the 1%, 5%, and 10% levels, respectively.

39
Figure 1
.46
.48
.5.5
2.5
4
1993 1994 1995 1996 1997 1998 1999 2000 2001 2002 2003 2004
Credit Card, Other Consumer, Mortgage, and Small Business Loansas Share of Total Loans
Retail Loan Share
Figure 2
Under $1B
$1B to $10B$10B to $100B
Over $100B
.4.4
5.5
.55
.6
1993 1994 1995 1996 1997 1998 1999 2000 2001 2002 2003 2004
Credit Card, Other Consumer, Mortgage, and Small Business Loansas Share of Total Loans
Retail Loan Share by BHC Asset Size

40
Figure 3
.5.5
5.6
.65
1986 1988 1990 1992 1994 1996 1998 2000 2002 2004
NOW, Small Time, and Savings Deposits as Share of Total DepositsRetail Deposit Share
Figure 4
Under $1B
$1B to $10B$10B to $100B
Over $100B
.3.4
.5.6
.7.8
1986 1988 1990 1992 1994 1996 1998 2000 2002 2004
NOW, Small Time, and Savings Deposits as Share of Total DepositsRetail Deposit Share by BHC Asset Size

41
Figure 5
89
1011
1213
1994 1995 1996 1997 1998 1999 2000 2001 2002 2003 2004
Branches per Billion Dollars of Assets
Figure 6
Under $1B
$1B to $10B
$10B to $100B
Over $100B
510
1520
2530
1994 1995 1996 1997 1998 1999 2000 2001 2002 2003 2004
Branches per Billion Dollars of Assetsby BHC Asset Size

42
Figure 7
-2-1
.8-1
.6-1
.4-1
.2
1994 1995 1996 1997 1998 1999 2000 2001 2002 2003 2004First principal component of the retail loan share, retail deposit share,and branches per billion dollars of assets variables
Weighted by BHC Asset SizeRetail Intensity: First Principal Component
Figure 8
Under $1B
$1B to $10B
$10B to $100B
Over $100B
-3-2
-10
1
1994 1995 1996 1997 1998 1999 2000 2001 2002 2003 2004First principal component of the retail loan share, retail deposit share,and branches per billion dollars of assets variables
Weighted by BHC Asset SizeRetail Intensity by BHC Asset Size: First Principal Component