the relationships between needs assessment measures
TRANSCRIPT

The Relationships Between Needs Assessment Measures, Productivity Measures, and
Ethics in Developing a Budget Allocation Model for Higher Education
by
Mary Pate Barton
A dissertation submitted to the Graduate Faculty of
Auburn University
in partial fulfillment of the
requirements for the Degree of
Doctor of Philosophy
Auburn, Alabama
August 6, 2011
Keywords: Needs Assessment Measures, Productivity Measures, Ethics, Budget Allocation
Model, Higher Education
Copyright 2011 by Mary Pate Barton
Approved by
James E. Witte, Chair, Associate Professor of Educational Foundations, Leadership
and Technology
Ellen H. Reames, Assistant Professor of Educational Foundations, Leadership and Technology
Olin L. Adams, Associate Professor of Educational Foundations, Leadership and Technology

ii
Abstract
To maintain credibility, leaders entrusted with public funds need to ensure their decisions
regarding those funds are ethical and moral. The research investigating the relationships
between needs assessment measures, productivity measures, and ethics in developing budget
allocation models is lacking in academic institutions. The purpose of this study was to assess the
importance of needs assessment measures, productivity measures, and ethics in developing a
budget allocation model for Southern Regional Education Board (SREB) institutions. This study
also focused on developing a budget allocation model to assist administrators in making ethical
and moral funding decisions. The items included in the survey for this study were developed
using four categories: budget allocation preference items, needs assessment measures,
productivity measures, and demographic items.
This study was specifically designed to find the difference in the level of agreement in
needs assessment measures, productivity measures, and between needs assessment measures and
productivity measures. The repeated measure results yielded a statistical significance, indicating
the agreement level toward the needs assessment measures in a budget allocation model were
different. The Summer Budget Distribution is not as important as all the other needs assessment
items. Funds Requested are for Continuing Funds is more important than Funds Requested are
for One Time Funds and Summer Budget Distribution.
The repeated measure results yielded a statistical significance, indicating the agreement
level toward the productivity measures in a budget allocation model were different. The results

iii
indicated that Number of Degrees Granted is not as important as Full Time Equivalent Student
Units or Student Credit Hours.
The repeated measure results yielded a statistical significance, indicating the agreement
level toward the needs assessment measures and productivity measures in a budget allocation
model were different. The results indicated that needs assessment measures are not as important
as productivity measures.

iv
Acknowledgments
As with most any human endeavor, a doctoral dissertation can be completed only with
the help of others. Although responsibility for the content of this research is entirely mine, I
want to gratefully acknowledge a number of individuals who gave generously of their time and
expertise, and without whose help, this dissertation would not be possible.
I wish to acknowledge my dissertation committee members, Dr. Ellen H. Reames and Dr.
Olin L. Adams, for their care in assisting me through the maze of writing a dissertation. A
special recognition goes to Dr. James E. Witte, major professor and project director, for
countless hours of guidance, suggestions, and encouragement. I am indebted to Dr. Witte for
many things, including his friendship and patience in those moments when completing a PhD
while working full-time appeared to be ―interesting, but fantasy‖.
I owe a great deal to the methodological wizard who helped make statistical sense out of
my data. I would have been forever lost without the tireless assistance of Dr. Chih-hsuan Wang
for formatting data, running regressions, believing so strongly in the importance of nurturing
students, and helping me understand what all the numbers meant.
A special thanks to Ms. Kerry Ransel for serving as a panel member, scoring the q-sort
tests, proofreading the many drafts, and always finding time to care about my welfare.
Finally, to the three people in this world without whom this project would never have
taken place. To my children, Christopher A. Pate and Madison N. Pate, and my husband,
D. Mark Barton, I pledge my unending thanks and gratitude.

v
Table of Contents
Abstract ......................................................................................................................................... ii
Acknowledgments ....................................................................................................................... iv
List of Tables ............................................................................................................................... ix
List of Figures ............................................................................................................................... x
Chapter I. Introduction ................................................................................................................. 1
Introduction ....................................................................................................................... 1
Statement of the Problem .................................................................................................. 4
Purpose of the Research .................................................................................................... 5
Research Questions ........................................................................................................... 6
Significance of the Study .................................................................................................. 6
Assumptions of the Study ................................................................................................. 7
Limitations of the Study.................................................................................................... 7
Definition of Terms........................................................................................................... 8
Organization of the Study ............................................................................................... 12
Chapter II. Literature Review .................................................................................................... 13
Purpose ............................................................................................................................ 13
State Financing of Public Higher Education ................................................................... 13
Resource Allocation within Public Institutions .............................................................. 18
Ethics in Budget Allocation Processes ........................................................................... 26

vi
Accountability ..................................................................................................... 30
Transparency ....................................................................................................... 33
Historical Budget Processes at Public Institutions.......................................................... 36
Current Budget Processes at Public Institutions ............................................................. 40
What is Privatization? ......................................................................................... 40
Evidence of Privatization .................................................................................... 43
Cyclical or Long-Term Trend ............................................................................. 43
Consequences ...................................................................................................... 44
What Are Universities Doing to Cope? .............................................................. 45
What Are States Doing to Cope? ........................................................................ 46
Needs Assessment Measures .......................................................................................... 47
Productivity Measures .................................................................................................... 50
Budget Allocation Models .............................................................................................. 54
Summary ......................................................................................................................... 58
Chapter III. Methods .................................................................................................................. 64
Introduction ..................................................................................................................... 64
Purpose and Design of the Study .................................................................................... 65
Research Questions ......................................................................................................... 65
Population and Sample ................................................................................................... 66
Instrumentation ............................................................................................................... 67
Overview ............................................................................................................. 67
Survey Development and Survey Testing ........................................................... 70
Survey Development ............................................................................... 70

vii
Survey Testing ........................................................................................ 71
Validity ............................................................................................................... 72
Data Collection and Analysis Procedures ....................................................................... 72
Data Collection ................................................................................................... 72
Analysis Procedures ............................................................................................ 73
Summary ......................................................................................................................... 75
Chapter IV. Findings .................................................................................................................. 76
Purpose and Design of the Study .................................................................................... 76
Research Questions ......................................................................................................... 76
Demographic Characteristics .......................................................................................... 77
Frequency Distributions of the Data ............................................................................... 79
Results ............................................................................................................................. 82
Research Question 1 — Needs Assessment Measures ....................................... 82
Research Question 2 — Productivity Measures ................................................. 85
Research Question 3 — Needs Assessment Measures
and Productivity Measures ...................................................................... 88
Summary ......................................................................................................................... 90
Chapter V. Summary, Conclusions, Implications, and Recommendations ............................... 92
Purpose and Design of the Study .................................................................................... 92
Research Questions ......................................................................................................... 92
Summary ......................................................................................................................... 93
Conclusions ..................................................................................................................... 94
Implications................................................................................................................... 104
Recommendations ......................................................................................................... 105

viii
References ................................................................................................................................. 108
Appendix A Permission to Administer a Survey for IRB Protocol Form ............................. 121
Appendix B Follow-up (Email) Request – Permission to Administer a Survey ................... 122
Appendix C Survey Development Test Group ...................................................................... 124
Appendix D Four Member Q-Sort Panel ............................................................................... 126
Appendix E Q-Sort Instruction Sheet ................................................................................... 127
Appendix F Three Specified Categories and Corresponding Statements ............................. 128
Appendix G Survey Instrument ............................................................................................. 129
Appendix H Participant Email and Information Letter ......................................................... 134
Appendix I Participant Follow-up Email Reminder and Information Letter ....................... 137

ix
List of Tables
Table 1 Frequency Distribution of Demographic Questions ................................................. 79
Table 2 Frequency Distribution of Budget Allocation Preference Items ............................... 80
Table 3 Frequency Distribution of Needs Assessment Items ................................................ 81
Table 4 Frequency Distribution of Productivity Items .......................................................... 82
Table 5 Means and Standard Deviations for Needs Assessment Measures ........................... 83
Table 6 Pairwise Comparisons of Needs Assessment Measures ........................................... 84
Table 7 Means and Standard Deviations for Productivity Measures ..................................... 86
Table 8 Pairwise Comparisons of Productivity Measures ..................................................... 87
Table 9 Means and Standard Deviations for Needs Assessment Measures
and Productivity Measures ........................................................................................ 89
Table 10 Budget Allocation Model with Needs Assessment Measures .................................. 96
Table 11 Budget Allocation Model with Productivity Measures—Instructional
Unit Costs, Research and Public Service Expenditures, 2007–2008 ...................... 100
Table 12 Budget Allocation Model with Productivity Measures—Credit Hours,
Course Sections, and FTE Students Taught by All Faculty Types, Fall 2007........ 102

x
List of Figures
Figure 1 Estimated Marginal Means for the Five Needs Assessment Items ........................... 85
Figure 2 Estimated Marginal Means for the Five Productivity Items ..................................... 88
Figure 3 Estimated Marginal Means for Needs Assessment Measures
and Productivity Measures ........................................................................................ 90

1
CHAPTER I. INTRODUCTION
Introduction
Fundamentals to consider in state financing of public higher education are general
factors, operating budget process, and capital budget process. In general, there is no perfect
system or process in state financing of public higher education, and institutional character
dictates the financing or budgeting approach. Institutional character is defined, in part, by its
culture, climate, history, size, and mission. Whether or not the institution has centralized or
decentralized governance and administration, is public or private, and is affiliated or independent
also defines institutional character.
The processes and decisions of leaders, especially those in public institutions entrusted
with public funds, should be very transparent to their stakeholders. To maintain their credibility,
leaders entrusted with public funds need to ensure their decisions regarding those funds are
ethical and moral. A steward of public funds cannot afford to have his or her credibility
damaged or even appear to be damaged. Efficiency was the key word of the 1980s, quality was
the touchstone of the 1990s, and quality control with accountability has become the leadership
philosophy of the new millennium (Milliken & Colohan, 2004). The leaders—top administrators
at public universities—are stewards of taxpayers‘ dollars. According to Senge, et al. (2000), one
of the three primary tasks of leadership includes leader as steward.
Professors at business schools know how to train people in accounting, finance,
management, and marketing. However, with regard to educating students in ethical and moral

2
decision making, faculty at colleges and universities have failed (Boyer, 1986). This failure is
evident in the frequent media reports concerning corruption in business, government, and
colleges and universities.
Joanne Ciulla (2004) argues that the definition of leadership studies is not really about the
question, ―What is leadership?‖ (p. 17–18). It is about the question, ―What is good leadership?‖
By good, she means morally good and effective. This is why she thinks it is fair to say that
ethics lies at the heart of leadership. Researchers in the field of leadership need to have an
understanding of the ethical elements of leadership in order to be clear on what the term
leadership implies. In higher education institutions, morally good and effective leaders need to
have several methods in which to make decisions. According to Gini (2004), perhaps the best
method suited to the general needs of the ethical enterprise is a modified version of the scientific
method.
A modified version of the scientific method includes: observation, inquiry, hypothesis or
research questions, experimentation, and evaluation. Observation is the recognition of a problem
or conflict. Inquiry is a critical consideration of the facts and issues involved. Hypothesis or
research questions are the formulation of a decision or plan of action consistent with the known
facts. Experimentation and evaluation are the implementation of the decision or plan in order to
see if it leads to the resolution of the problem (Gini, 2004).
This modified version of the scientific method could be applied in higher education
financing. An emphasis on the scientific method and data driven decision making has grown as
technology has made the access and use of data easier (Data-driven decision-making, 2004). But
what has really driven the use of data in education has been its impact (Banta, Busby, Kahn,
Black, & Johnson, 2007). The scientific method could provide colleges and universities data for

3
academic planning and management, assessment and evaluation services, and progress reports on
mission-critical goals. The scientific method and data driven decision making could help
institutions respond to a fiscal crisis and support long-range financial planning. The scientific
method could be used in budget allocation decisions at higher education institutions where this
method could foster ethical and moral decision making.
The first step in the scientific method is observation. Observation is the recognition of a
problem or conflict. The problem with current budget allocation practices is the lack of
transparency, accountability, and moral decision making. To maintain credibility, leaders
entrusted with public funds need to make sure their decisions regarding those funds are ethical
and moral.
The second step in the scientific method is inquiry. Inquiry is a critical consideration of
the facts and issues involved. The purpose of this study is to design a budget allocation model to
assess the importance of needs assessment measures and productivity measures in developing a
budget allocation model for Southern Regional Education Board (SREB) institutions. This
comprehensive, objective model addresses both needs assessment measures and productivity
measures.
The third step in the scientific method is hypothesis or research questions. The following
research questions guided this study: What is the relationship between needs assessment
measures in a budget allocation model? What is the relationship between productivity measures
in a budget allocation model? What is the difference in the level of agreement between needs
assessment and productivity in a budget allocation model?
The fourth step in the scientific method is experimentation. The purpose of the survey in
this study is to assess the importance of needs assessment measures and productivity measures in

4
developing a comprehensive, objective budget allocation model. The comprehensive, objective
model would address budget allocation preference items, needs assessment measures,
productivity measures, and demographic items.
The fifth step in the scientific method is evaluation. The purpose of this study is to assess
the importance of needs assessment measures and productivity measures in developing a budget
allocation model for Southern Regional Education Board (SREB) institutions. The
comprehensive, objective model would address both needs assessment measures and
productivity measures. The evaluation would answer the three research questions.
In summary, leadership ethics can also serve as a critical theory that opens up new kinds
of dialogues among researchers and practitioners. Work in leadership ethics should generate
different ways of thinking about leadership and new ways of asking research questions. To some
extent, the ideas of servant leadership and transforming leadership have already done this. The
territory of ethics lies at the heart of leadership studies and has veins that run through all
leadership research. Ethics also extends to lands waiting to be explored. As an area of applied
ethics, leadership ethics needs to take into account research on leadership, and it should be
responsible to the pressing ethical concerns of society (Gini, 2004).
Statement of the Problem
Public colleges and universities are responsible, in part, for educating their citizens and
improving the local and state economies. States are responsible, in part, for funding the public
colleges and universities. This university-state relationship is eroding. This is seen by drastic
cuts in state appropriations over the last two and a half decades. Although there are many factors
contributing to the nationwide decline in state support for public colleges and universities, the

5
major reason is due to economic recessions that have occurred over the last 25 years (Weerts &
Ronca, 2006).
According to Engle (2010), annual budgets are invaluable because they provide
administrators with a tool to allocate resources, communicate the institution‘s strategy, and
monitor the strategy‘s results. Budgets determine in advance where scarce resources will be
spent. Budgeting is most effective when it reflects the institution‘s strategic plan, is realistic,
includes flexibility, and is evaluated against performance measures.
To maintain credibility, leaders entrusted with public funds need to make sure their
decisions regarding those funds are ethical and moral. The research investigating the
relationships between needs assessment measures, productivity measures, and ethics in
developing budget allocation models is lacking in academic institutions. This study focused on
developing a budget allocation model to assist administrators in being able to make ethical and
moral funding decisions at public colleges and universities.
Purpose of the Research
The purpose of this study was to assess the importance of needs assessment measures,
productivity measures, and ethics in developing a budget allocation model for Southern Regional
Education Board (SREB) institutions. This comprehensive, objective model addresses both
needs assessment measures and productivity measures. The independent variable is a traditional,
subjective budget allocation model. The dependent variables are needs assessment variables and
productivity variables. The items on the survey for this study were developed using four
categories: budget allocation preference items, needs assessment measures, productivity
measures, and demographic items.

6
Research Questions
The following research questions guided this study:
1. What is the relationship between needs assessment measures in a budget
allocation model?
2. What is the relationship between productivity measures in a budget allocation
model?
3. What is the difference in the level of agreement between needs assessment
measures and productivity measures in a budget allocation model?
Significance of the Study
The key challenge to academic leadership is to restructure the allocation of academic
assets (Rich, 2006). Higher education is in the midst of a transformation that has altered
requirements for success in university administration. Across the nation, the political priority of
higher education has declined. For most universities, public funding has eroded. At the same
time, public demands have intensified to restrain increases in tuition and fees. These factors are
restructuring the underlying political environment of higher education. This creates pressures to
change how higher education values and priorities are established and promoted, how the
resources to support higher education are generated and allocated, and how and by whom
academic programs are provided and assessed. This creates pressure to change the practice of
academic administration (Rich, 2006).
A leader‘s decision making process, especially those in public institutions entrusted with
public funds, should be transparent to his stakeholders. Leaders entrusted with public funds need
to make sure their decisions regarding those funds are ethical and moral. A steward of public
funds cannot afford to have his or her credibility damaged or even appear to be damaged.

7
Accountability has become the leadership philosophy of the new millennium. The leaders, top
administrators at public universities, are stewards of taxpayers‘ dollars. A comprehensive,
objective budget allocation model addressing budget allocation preferences, needs assessment
measures, and productivity measures may be a method to ethically and morally allocate public
resources in public institutions.
Assumptions of the Study
The following assumptions were made:
1. Because only 6 of the 16 institutions asked to participate in the survey agreed to
participate, the chief financial officers in the sample are not representative of the
chief financial officers in the population.
2. The budgeting processes at the 6 SREB institutions are fundamentally similar.
3. Participants answered the survey honestly, thoughtfully, and consistently.
Limitations of the Study
This was an exploratory study limited to six schools in the Southeast region of the United
States. Therefore, conclusions cannot be generalized from the target population to other
populations. Also, all survey data was self-reported with results based on the assumptions that
the respondents were thoughtful and honest when giving responses.
The research was designed to email the survey to the sample population. Jaeger (1984)
named several disadvantages to issuing a survey. First, participants may not respond because of
a lack of interest in the topic. Second, surveys often have a low rate of return. Third, sometimes
it is unclear to the participants who should respond. Fourth, many times the respondents do not
open the survey because it appears to be junk mail.
In order to address the disadvantages of surveys the following precautions were taken:

8
1. The titles/job responsibilities of the sample were verified prior to being sent the
survey.
2. The email addresses of the chief financial officers were verified prior to being
sent the survey electronically.
3. The non-respondents were sent a second request to complete the survey.
4. The email, cover letter, and survey contained information (i.e., institutional
affiliation, purpose of the study, significance of the study, and contact
information) to exhibit the survey was legitimate and not junk mail.
Definition of Terms
For the purpose of this study, the following terms are described conceptually followed by
operational definitions. Reference books, selected documents, and personal interpretation from
the literature serve as the source for these definitions.
Assessment Instrument: For this study, assessment instrument refers to the rating scale
(survey) used for this study to assess items that could be used in developing a budget allocation
model for public institutions of higher education.
Budget Allocation Model: A budget allocation model reflects the allocation of funds to
meet the institution's program and facilities commitments in support of the institution‘s strategic
plan.
Chief Financial Officers: For this study, a chief financial officer is defined as a provost,
vice president of business and finance, dean, director, or department head or chair.
Ethics: Ethics is a branch of philosophy which seeks to address questions about morality.
This study is concerned with applied ethics or how a moral outcome can be achieved in specific
budget decision situations.

9
Needs Assessment Measures: In this study, needs assessment is defined as a structured
process to determine the financial needs of a college or university. The needs assessment
variables in this study are One Time Funds, Continuing Funds, Reserve Amount to the Base
Amount (as a percent), Summer Budget Distribution, and Summer Budget Distribution per
Student.
One Time Funds: In higher education, in this study, one time funds are dollars that are
received one time and are not guaranteed to recur, although the funds may be allocated
for a few years. A current example of one time funds is the State Fiscal Stabilization
Fund. These funds were received by the states from the Federal government for years
2010 and 2011. These funds will not be given for year 2012.
Continuing Funds: In higher education, in this study, continuing funds are dollars that
are guaranteed to recur. An example of continuing funds is state appropriations.
Reserve Amount to the Base Amount (as a percent): In this study, reserve amount is
the amount of funds remaining at the end of the fiscal year. Base amount is the amount
of dollars allocated from the state at the beginning of the fiscal year. An example of a
reserve amount to the base amount (as a percent) is: $100,000 (reserve amount) divided
by $1,000,000 (base amount) equals 10% [reserve amount to the base amount (as a
percent)]. $100,000 and 10% are the dollar amount and percent of the funds carried over
to the next year as one time funds.
Summer Budget Distribution: In higher education, in this study, summer budget
distribution is the amount of funds earned and distributed for teaching courses in the
summer.

10
Summer Budget Distribution per Student: In this study, summer budget distribution
per student is the amount of funds earned and distributed for teaching courses in the
summer per student. An example of this would be: $446,000 (summer budget
distribution) divided by 892 (students) equals $500 (summer budget distribution per
student).
Productivity Measures: Productivity is an efficiency measure. It measures the ratio of
outputs over inputs. The productivity variables in this study are Full Time Equivalent Student
Units, Number of Degrees Granted, Student Credit Hours, Full Time Equivalent Faculty Units,
and Cost of Instruction.
Full Time Equivalent Student (FTES) Units: In this study, full-time equivalent
students (FTES) is different from the number of students attending the university who are
enrolled ―full-time‖. Historically, FTES has been a measurement of enrollment derived
by dividing total student credit units for a term by 15, both for the undergraduate and
graduate level. Since Fall 2006, a new re-benched FTES calculation specifies that
graduate student units get divided by 12 instead of 15.
There are two methods used to calculate FTES (taken and taught), each producing
entirely different results. For budget and resource purposes, the calculation for FTES is
always done using course enrollments (FTES Taught). For instance, FTES for a
particular department is based on all units taken in all courses offered by the department.
This is the most commonly used method.
Number of Degrees Granted: In this study, the number of degrees granted is defined as
the number of degrees granted in the academic year.

11
Student Credit Hours: In this study, one credit hour is worth 50 minutes of
contact/lecture time per week. For example, a 3 credit-hour course meets for 150 minutes
every week for ten weeks of classes.
Full Time Equivalent (FTE) Faculty Units: In this study, budgeted full-time equivalent
faculty is the sum of the appointment percentages of all faculty in a particular
department, college, or other unit. To calculate budgeted FTE faculty for a particular
program, such as Instruction, each appointed percentage is multiplied by the percent of
the individual's salary paid from that program, and then summed. For example, a
professor in a full-time appointment who receives one-half of his salary from Instruction
and one-half from Organized Research would be counted as one (1.00) budgeted FTE
faculty member with one-half (0.50) budgeted FTE to Instruction and one-half (0.50)
budgeted FTE to Organized Research.
Cost of Instruction: In this study, cost of instruction is defined as expenditures per
student where ―expenditures‖ is defined as total state appropriations.
Southern Regional Educational Board (SREB): Founded in 1948, the Southern
Regional Education Board is a nonprofit, nonpartisan organization that works with leaders and
policy-makers in 16 member states to improve pre-K through postsecondary education. The 16
member states are Alabama, Arkansas, Delaware, Florida, Georgia, Kentucky, Louisiana,
Maryland, Mississippi, North Carolina, Oklahoma, South Carolina, Tennessee, Texas, Virginia,
and West Virginia. Of these 16 member states, 6 chose to participate. The 6 universities that
chose to participate were the University of Virginia, University of Maryland, University of
Mississippi, University of North Carolina, University of Oklahoma, and University of South
Carolina.

12
Strand: A strand is a means of identification of items for a budget allocation model,
which aid in defining and organizing the model. Specific strands for this study are: budget
allocation preferences, needs assessment measures, and productivity measures.
Organization of the Study
Chapter I introduces the study by presenting a statement of the problem, purpose of the
research, research questions, significance of the study, assumptions of the study, limitations of
the study, definition of terms, and organization of the study. Chapter II contains a review of the
related literature concerning state financing of public higher education, resource allocation
within public institutions, ethics in budget allocation processes (including accountability and
transparency), historical budget processes at public institutions, current budget processes at
public institutions, needs assessment measures, productivity measures (including financial
outputs and student outputs), budget allocation models, and a summary. Chapter III addresses
the procedures used in this study, including an introduction; purpose and design; population and
sample; instrumentation; data collection procedures and analysis; and a summary. Chapter IV
presents the findings of the study and an interpretation of the data. Chapter V offers a summary
of the study, conclusions, implications, and recommendations for further practice and research.
13
CHAPTER II. LITERATURE REVIEW
Purpose
To maintain credibility, leaders entrusted with public funds need to make sure their
decisions regarding those funds are ethical and moral. The research investigating the
relationships between needs assessment measures, productivity measures, and budget allocation
models is lacking in academic institutions. The purpose of this study was to assess the
importance of needs assessment measures, productivity measures, and ethics in developing a
budget allocation model for Southern Regional Education Board (SREB) institutions. This study
focused on developing a budget allocation model to assist administrators in being able to make
ethical and moral funding decisions at state colleges and universities.
State Financing of Public Higher Education
Public colleges and universities are responsible, in part, for educating their citizens and
improving the local and state economies. States are responsible, in part, for funding the public
colleges and universities. This university-state relationship is eroding. This is seen by drastic
cuts in state appropriations over the last two and a half decades. Although there are many factors
contributing to the nationwide decline in state support for public colleges and universities, the
major reason is due to economic recessions that have occurred over the last 25 years (Weerts &
Ronca, 2006).
Increased state-funding needs for Medicaid, elementary and secondary education, and the
criminal justice system have put increasing pressure on state tax revenue (Ehrenberg, 2006;

14
Hovey, 1999; Kane, Orszag, & Gunter, 2003). The consequence has been that there have not
been sufficient revenues available to fund public higher education to their pre-1970s levels.
Over the last 25 years there have been dramatic reductions in the share of state budgets devoted
to higher education (Ehrenberg, 2006). According to Mortenson (2004), state appropriations for
higher education (adjusted for inflation) have declined 40% since 1978. Even today the states
provide over four dollars of support for higher education expenses for every dollar of federal
subsidy. Yet public effort in support of higher education has been in decline for the last quarter
century. Aggregate state effort has fallen by 30% since the late 1970s (Archibald & Feldman,
2006).
Public higher education‘s changing financial environment is well documented (Archibald
& Feldman, 2006; Hossler, Lund, Ramin, Westfall, & Irish, 1997; Kane et al., 2003; Rizzo,
2004; Slaughter & Leslie, 1997; Toutkoushian & Hollis, 1998; Weerts & Ronca, 2006). With
shrinking budgets, competing priorities, public resistance to increasing state taxes, and
prohibitions on deficit spending, state legislators find themselves in the position of debating how
essential each state service is, including postsecondary education. As a result of this debate,
postsecondary education, which is most often a discretionary budget item, has often been moved
to the end of the state funding list of priorities. This results in state governments allocating a
smaller share of their spending to higher education (Kane et al., 2003; Rizzo, 2004).
Due to decreased spending on higher education, the purchasing power of state
appropriations per full-time equivalent student in 2003–2004 reached its lowest point in the 30-
year period ending in 2004. Periods of growth and decline in state appropriations occurred as the
economy fluctuated, but the declines were generally larger than the recoveries (Cheslock &
Gianneschi, 2008). State appropriations were slashed $650 per student between FY2001 and

15
2004, a period marked by widespread fiscal crisis among states (Jenny & Arbak, 2004). For a
variety of reasons, (increases in state-funding expenditures for Medicaid, elementary and
secondary education, and the criminal justice system) the purchasing power of state
appropriations to higher education may continue to decrease in the future (Hovey, 1999; Kane et
al., 2003).
Decreases in state support for discretionary programs such as higher education have also
been attributed to a shift in the federal government‘s role. During the last 25 years, the federal
government has transferred partial or full responsibility for many programs to the state level.
This shift in philosophy, known as ―new federalism‖, has resulted in steep cuts in federal and
state aid for municipal and county governments (Peterson, 1995). This shift has resulted in a
significant decrease in higher education appropriations for most states. The funding squeeze in
higher education has occurred because public universities are forced to compete more for dollars
with other state programs such as Medicaid, K–12 schools, social services, and corrections
(Schuh, 1993). As a larger share of public funds will be required to support the aging population
of Baby Boomers, Medicaid is forecasted to put an especially intense squeeze on higher
education (Kane et al., 2003).
Due to these economic and political factors, the relationship between states and public
higher education is changing across the country. This change is especially noticeable at major
public research universities which are increasingly becoming quasi-private institutions (Weerts
& Ronca, 2006).
Flat funding used to be a dirty word in public higher education. Today, chief financial
officers at public colleges and universities long for flat funding. According to Dillon (2005),
public support for public education, measured per student, has dropped more rapidly since 2001

16
than it has in the last two decades. Several university presidents are calling the decline in state
support and the increase in tuition a de facto privatization of the institutions that played a crucial
role in the creation of the American middle class. Many university presidents also believe that
higher tuition cost is a result of public higher education‘s slide toward privatization (Dillon,
2005).
Are we losing our public universities to de facto privatization? The historical role of
public institutions was to provide free public education to its citizens. As these public
institutions have to rely more on private sources of support, is their public mission at risk? These
changes did not emerge from public debate but from the need to alleviate the gap in public
funding. Some universities are shifting to greater reliance on private funding. Many states have
been encouraged or have been allowed to raise tuition which may reduce student access and
need-based aid. Some universities have sought agreements with private entities (Levin, 2007).
Levin (2007) argues that the privatization drift has been ongoing as budgetary pressures
push institutions toward solutions that involve greater privatization. The challenge arises
primarily from the decline in public funding, constrained tuition for state residents, and the loss
of faith in the public benefits of higher education. Most states have reduced their financing of
higher education funding over the last decade. Public universities used to get about 50 percent of
their budgets from state funds. Now they receive about 30 percent or less from state funds (Lyall
& Sell, 2006).
According to Ehrenberg (2006), increased state-funding needs for Medicaid, elementary
education, secondary education, and the criminal justice system have put increasing demands on
state tax revenues. As the share of public investment in public institutions declines, institutions

17
are required to function in the competitive marketplace and become privatized (Lyall & Sell,
2006).
Many state budgets are experiencing deficits in meeting their current demands
(Ehrenberg, 2006). Due to these deficits, there have not been sufficient funds to continue level
funding of public higher education. The amount of funds to support public higher education is
being reduced. State support for public higher education is one of the few discretionary
categories in state budgets. Higher education is one of the few state agencies that charges for its
services. As the amount of funds available to support public higher education institutions has
been decreasing, there has been increasing enrollment in public higher education institutions
(Ehrenberg, 2006).
This shift toward an increasingly ―private‖ public research university has been
accompanied by an increasing tension between higher education administrators and state
legislators (Weerts & Ronca, 2006). Mark Yudof, President of the University of Texas System,
has bemoaned the fact that the consortium that once governed states and public research
universities ―has withered, leaving public research universities in a purgatory of insufficient
resources and declining competitiveness‖ (Yudof, 2002, p. B24). Other public research
university presidents have echoed Yudof‘s concerns (Gose, 2002). Many universities have
resorted to tightening enrollments and significantly increasing tuition as a way to remain
competitive (Serban & Burke, 1998). Others have feared a shift toward privatization may
precipitate declining participation rates of low-income students and may adversely influence
research agendas, decision making, and salary gaps between the humanities and the sciences
(Gose, 2002). Accompanying these perspectives is a growing view among lawmakers that

18
higher education is a private good that should be supported more by students and donors, rather
than a public good supported by the state (Selingo, 2003).
Resource Allocation within Public Institutions
Decreases in state appropriations can substantially alter the distribution of resources
across institutions of higher education. Up until now, most of the attention has focused on the
growing inequality in resources between public and private institutions (Cheslock & Gianneschi,
2008).
In recent years, changing financial and political conditions have prompted many colleges
and universities to revise their internal management processes. There has been an increase in the
implementation of incentives-based budget systems (IBBS), which place greater authority but
also greater accountability at the academic department level within the college (Lang, 2001;
Massy, 1996a; Priest, Becker, Hossler, & St. John, 2002). Other popular titles for IBBS is
Responsibility Center Management (RCM) and Value Centered Management (VCM).
Responsibility Centered Management (RCM) is a management philosophy. RCM
focuses on operational decentralization and is designed to support achievement of primary
academic priorities. When using RCM budget follows priorities, aligns authority with
responsibility, and creates ―full cost‖ view of academic operations (Hearn et al., 2006).
Under the RCM model, operational authority is delegated to major academic units within
the university. The delegation is made to make progress towards achieving academic priorities,
and to maintain financial balance over time. RCM places a premium on institutional planning
(Hearn et al., 2006).
Under the principles of RCM, the degree of operational decentralization should be
proportional to the size and complexity of an organization. Higher education institutions are

19
complex organizations. Administrators at higher education institutions need to recognize
inherent responsibility for mission critical activities within academic units. The size of the
academic unit is always an issue (Hearn et al., 2006).
Under the principles of RCM, explicit organizational rules are required. Alignment of
authority and responsibility requires being explicit about who is responsible for what kinds of
decisions. An essential attribute of a responsibility center is that someone needs to be in charge.
This requires rethinking of fundamental roles of key university managers (executive, academic,
and support) (Hearn et al., 2006).
Operational decentralization requires shareable, timely management information. RCM
requires an information environment. The information must be timely. With RCM there can be
no data wars, shareable information is desired, and technology should facilitate sharing
management information (Hearn et al., 2006).
Under the principles of RCM, a stable environment is desired. If priorities constantly
change, there are no priorities. If rules constantly change, there are no rules. The budget must
follow already established priorities. Achievement of objectives may require a longer planning
horizon than a single fiscal period. Strive for total resource management (Hearn et al., 2006).
Under the principles of RCM, university leadership must retain sufficient leverage to
maintain overall balance of the institution. In a public university, leadership controls allocation
of governmental support. In a private university, leadership controls subvention (funds
generated through taxes to academic unit revenues). In addition RCM requires certain services
for the collective benefit of the university. Administrators of RCM need to determine which
services are to be treated as public utilities and which are discretionary. They need to establish
standards (Hearn et al., 2006).

20
The general purpose of all of these approaches is to integrate budgeting and management
decision-making more fully at the level of individual cost centers (departments, service centers,
programs, etc.) within institutions. The move to IBBS reflects the higher education institution‘s
interest in more decentralized management and budget approaches. Unfortunately, there has
been little research conducted on the benefits and challenges of the IBBS approach (Hearn,
Lewis, Kallsen, Holdsworth, & Jones, 2006).
The top priority for college and university administrators should be to ensure that their
instructional programs and their entire institutions are managed in the most efficient and
effective manner possible (Zumeta, 2007). Proper management of fiscal resources determines
the degree to which institutions are open and affordable. Appropriate program management is
paramount because, though there is an increasing demand for postsecondary education in
America, the availability of resources to support instructional demand is lagging. When the
demand for programs outstrips the ability of an institution to deliver, decisions about the use of
available resources must be made (Henry, 2007). Traditional nonprofit colleges and universities
are challenged to find new ways to make resource allocation decisions, given their personnel
policies and their social, cultural, political, and organizational traditions (Sayers, 2006).
According to Engle (2010), annual budgets are invaluable because they provide
administrators with a tool to allocate resources, communicate the institution‘s strategy, and
monitor the strategy‘s results. Budgets determine in advance where scarce resources will be
spent. Budgeting is most effective when it reflects the institution‘s strategic plan, is realistic,
includes flexibility, and is evaluated against performance measures.
To be effective, the budget must be realistic, which begins with the revenue forecast. The
current business climate makes forecasting more difficult. Inflation, asset values, the cost and

21
availability of capital, employment, and savings rates have all changed dramatically. Realism
also applies to expenses. The long-term trend indicates that inflation averages 2 percent to 3
percent per year and has for the last 50 years (Engle, 2010). Flexibility is required because
market conditions and competition change quickly. Some institutions hold resources in reserve
in case of an unforeseen opportunity or threat. The institution‘s management must monitor the
budget against actual results so they can adjust and measure the company‘s performance against
the strategic plan (Engle, 2010).
Typically, an institution‘s strategic plan is a three to five year plan for achieving the
organization‘s long-term goals and objectives. The organization‘s strategic plan usually includes
achieving financial benchmarks through revenue growth and improved efficiencies. Budgeting
allows its resources to be allocated in the areas of the institution that will produce the desired
results. Increased staffing and expense rates are provided to areas that have the greatest impact
on improved results (Engle, 2010).
According to Shuppy (2006), downturns in the U.S. national economy cause states to cut
higher education appropriations, which contributes to increases in tuition that are not matched by
growth in family income and student aid. She explains that even after U.S. states recover from
economic downturns, access to higher education continues to suffer because appropriations for
colleges and financial aid do not recover as quickly as the states‘ economies.
―As an enterprise that relies heavily on state funding, public higher education has long
seen its support rise and fall with the boom-and-bust cycle of the economy‖ (Kirwan, 2007, p.
41). Kirwan (2007) returned to the University System of Maryland (USM) knowing that the
economic downturn opening the twenty-first century would be drastically different from years
past. Several factors were in play that would dramatically alter public higher education both
22
internally and externally. Internally, in addition to budget cuts, they were forced to grapple with
surging enrollment. In addition, the ―new economy brought increased demands from the
business community in need of more well educated, highly skilled workers. Externally, even as
the state budget recovered, obligations for Medicare, statutory commitments to elementary and
secondary education, and public safety costs put pressure on state resources (Kirwan, 2007).
The combination of these internal and external developments led to the conclusion that
the UMS and many in public higher education needed to take on much more responsibility in
terms of their own success. The needs and expectations were growing and the resources were
simply not going to be available to generously fund public higher education. The metric that
many had come to expect — ride out the storm until we are able to return to business as usual —
is no longer operative. The lasting seriousness of these circumstances prompted the USM to
undertake revolutionary change: a top-to-bottom reengineering of how they operated. This
reengineering was not simply to get them through the tough times but to reposition the USM to
thrive in this new era of permanently diminished resources and escalating demands (Kirwan,
2007).
The totality of these circumstances prompted the University System of Maryland (USM)
to undertake revolutionary change, embrace a flurry of cost-effective activities, make a conscious
effort to shift support to need-based financial aid, implement a groundbreaking Effectiveness and
Efficiency (E&E) Initiative, and place emphasis on accountability (Kirwan, 2007).
The impetus of this revolutionary change is in how the USM addressed the state budget
cuts. The USM faced a $206 million budget gap brought about by the combination of an 18
percent cut in the State General Fund base and an increase in unfunded mandated costs. The
USM took action to cover nearly two-thirds of the budget gap through expenditure reduction and

23
cost containment, with the remainder (just over one-third) covered by tuition increases. The
USM eliminated nearly eight hundred positions, froze salaries, implemented a hiring freeze for
all but essential personnel, reduced academic offerings at some institutions and eliminated low
productivity programs, and hired less costly part-time faculty in lieu of full-time faculty (Kirwan,
2007).
Beyond the initial cost-cutting and cost-containment actions, the USM embraced a flurry
of cost-effective activities. The USM is home to the University of Maryland University College
(UMUC), the leader in the development of online education. With more than 150,000 course
registrations, UMUC has the largest number of online enrollments in the world. It will soon be
the largest university in the system not just by head count but in FTE students. UMUC entered
into an agreement with community colleges in Maryland. Under this agreement, a community
college and UMUC can guarantee students enrolling in the community college that if they
complete the two-year college preparatory curriculum, they can complete a four-year degree
from UMUC drawing upon UMUC‘s online and onsite course delivery capabilities (Kirwan,
2007).
To expand access, the USM intensified their focus on financial aid, with a conscious
effort to support need-based aid. The USM conducted a study to determine the debt load of their
graduates. They learned that their poorest students were graduating with the most debt. That
was not the intention when financial aid programs were created several decades ago. The USM‘s
board of regents adopted a new financial aid policy which mandated by the 2008-09 year their
lowest-income students must graduate with a debt burden that is 25 percent below the average or
less. This required a huge shift in their distribution of financial aid from merit-based to need-
based programs (Kirwan, 2007).

24
As vital as these steps were in their drive to contain costs, expand access, and enhance
quality, this was merely a precursor to the USM‘s groundbreaking Effectiveness and Efficient
(E&E) Initiative. E&E has come to be recognized as a model for enhancing productivity,
ensuring cost containment, and elevating accountability, all while improving access and
maintaining quality in higher education. Led by the board of regents, E&E required the broadest
possible involvement: the regents, presidents, vice presidents, provosts, faculty, staff, and
students came to the table. They recognized their obligation to rework, reexamine, and
reengineer their academic and administrative process to address the three key issues of quality,
affordability, and capacity given the changing landscape of state funding. Through system wide
and campus-based efforts, E&E has taken tens of millions of dollars directly out of costs and
avoided tens of millions in expenses. Quality has been not only protected but also enhanced
(Kirwan, 2007).
The final element of USM‘s E&E is emphasis on accountability. Students and parents
have every right to expect easy access to information such as costs, degree offerings, graduate
placement statistics, graduation rates, transfer rates, average test scores, and GPAs. There is also
a need to measure and report how higher education institutions fare in meeting the big three core
educational outcomes: critical thinking, analytical reasoning, and written communication skills.
The USM has developed a series of performance measures called dashboard indicators that
enable the USM community to readily assess the system and its thirteen individual institutions.
Among the core dashboard indicators for many of the system institutions are average SAT
scores; graduation, retention, and freshmen acceptance rates; minorities as percentage of total
undergraduates; total R&D expenditure per full-time faculty; facilities utilization; and teaching
workload. Given the differences in size, scope, mission, and focus of our nation‘s colleges and

25
universities, there will never be a one-size-fits-all approach. A relatively standardized,
transparent, accessible system that answers the questions stakeholders want makes common
sense and in today‘s environment is a must (Kirwan, 2007).
The key challenge to academic leadership is to restructure the allocation of academic
assets (Rich, 2006). Higher education is in the midst of a transformation that has altered
requirements for success in university administration. Across the nation, the political priority of
higher education has declined. For most universities, public funding has eroded. At the same
time, public demands have intensified to restrain increases in tuition and fees. ―Political and
ideological intrusiveness has increased, and universities have been pressured to demonstrate
greater accountability on issues of access, cost containment, and learning outcomes‖ (Rich, 2006,
p. 37).
These factors are restructuring the underlying political environment of higher education.
This creates pressures to change how higher education values and priorities are established and
promoted, how the resources to support higher education are generated and allocated, and how
and by whom academic programs are provided and assessed. This creates pressure to change the
practice of academic administration, thereby altering what may attract faculty to and repel them
from becoming administrators (Rich, 2006).
The new political economy encourages administrators to view the challenges to higher
education as business problems requiring business solutions. Although copying private sector
business practices is not new, the scale and priority being given to marketing and
commercialization efforts by universities is now much greater than before. As a result,
university administration appears better suited to those with business skill than to those with
academic talents. Yet this appearance is deceiving (Rich, 2006).
26
Because the environment presses for a greater focus on market competitiveness,
university administrators are needed who can keep focused on core academic priorities while still
responding effectively to the new political environment of higher education. Universities must
succeed as businesses or they will not succeed for long. But they also cannot succeed if they
greatly compromise the basic priorities that constitute the academic bottom line. The academic
bottom line is how to strengthen the key ingredients of academic success, promote the highest
level of educational attainment for all students, and support excellence in teaching, scholarship,
and public service. The key restructuring needs to be in the allocation of the most important and
most expensive academic assets, the faculty, in ways that better serve emerging societal and
scholarly needs (Rich, 2006).
Ethics in Budget Allocation Processes
Kuhn (1996) defines a paradigm in the hard sciences as ―work that has been done once
and for all‖ (p. 23). A paradigm in social science is the term used to describe a set of
experiences, beliefs, and values. A paradigm affects the way an individual perceives reality and
responds to that perception (Shapiro & Stefkovich, 2005). According to Shapiro and
Stefkocvich (2005), there are four paradigms of ethical leadership. The four paradigms are the
ethic of justice, the ethic of critique, the ethic of care, and the ethic of the profession.
The ethic of justice addresses what is fair; issues of equity and equality; fairness of rules,
laws, and policies. The ethic of justice examines whether laws are absolute and the rights of
individuals versus the greater good of the community (Shapiro & Stefkovich, 2005). The ethic
of justice focuses on rights and laws and is part of a liberal democratic tradition that, according
to Delgado (1995), ―is characterized by incrementalism, faith in the legal system, and hope for
progress‖ (p. 1). The liberal part of this tradition is defined as a ―commitment to human

27
freedom,‖ and the democratic aspect implies ―procedures for making decisions that respect the
equal sovereignty of the people‖ (Strike, 1991, p. 415). Kohlberg (1981) believes justice is not a
set of rules but is a moral principle. Sergiovanni (1992) believes educational leaders are
stewards of students, teachers, administrators, families, and community.
When examining the ethic of critique many writers and activists are not convinced by the
analytic and rational approach of the justice paradigm. Some of these scholars find a tension
between the ethic of justice, rights, and laws and the concept of democracy. In response, they
raise difficult questions by critiquing both the laws themselves and the process used to
determine if the laws are just (Shapiro & Stefkovich, 2005).
Rather than accepting the ethic of those in power, these scholars challenge the status quo
by seeking an ethic that will deal with inconsistencies, formulate the hard questions, and debate
and challenge the issues. Their intent is to awaken us to our own unstated values and make us
realize how frequently our own morals may have been modified and possibly even corrupted
over time. Not only do they force us to rethink important concepts such as democracy, but they
also ask us to redefine and reframe other concepts such as privilege, power, culture, language,
and even justice (Shapiro & Stefkovich, 2005).
Some theorists ask how I/we can make the world a better place. Giroux (1994) asked
educators to understand their classrooms are political as well as educational and can serve as
locations which can fight social injustices. When developing curriculum, oversight committees
could also look at societal issues and concerns and how those can be addressed and changed
(Greene, 1998). According to Parker and Shapiro (1993), educational leaders could give more
attention to social class in the preparation of principals and superintendents.

28
Roland Martin (1993) believes the ethic of care involves caring, concern, and connection.
Some feminist scholars have challenged the dominant, and what they consider to be often
patriarchal, ethic of justice in our society by turning to the ethic of care for moral decision
making. Attention to this ethic can lead to other discussions of concepts such as loyalty, trust,
and empowerment. Similar to critical theorists, these feminist scholars emphasize social
responsibility, frequently discussed in the light of injustice, as a pivotal concept related to the
ethic of care (Shapiro & Stefkovich, 2005).
In her classic book, In a Different Voice, Gilligan (1982) introduced the ethic of care by
discussing a definition of justice different from Kohlberg‘s in the resolution of moral dilemmas.
In her research, Gilligan discovered that, unlike the males in Kohlberg‘s studies who adopted
rights and laws for the resolution of moral issues, women and girls frequently turned to another
voice — that of care, concern, and connection — in finding answers to their moral dilemmas.
Starratt (1991) said education is a human enterprise. This is an especially important concept for
educational leaders who were taught the military or business models of leadership. Beck (1994)
emphasized relationships and connections and said it is essential for educational leaders to move
away from a top-down model of leadership.
Considering the ethic of profession, Starratt (1994b) postulated that the ethics of justice,
care, and critique are not incompatible, but rather complementary, the combination of which
results in a richer, more complete, ethic. Shapiro and Stefkovich (2005) agree with Starratt.
But, they have also come to believe that, even taken together, the ethics of justice, critique, and
care do not provide an adequate picture of the factors that must be taken into consideration as
leaders strive to make ethical decisions within the context of educational settings. What is
missing — that is, what these paradigms tend to ignore — is a consideration of those moral

29
aspects unique to the profession and the questions that arise as educational leaders become more
aware of their own personal and professional codes of ethics. To fill this gap, Shapiro and
Stefkovich (2005) add a fourth to the three ethical frameworks described in this chapter, a
paradigm of professional ethics.
In summary, Shapiro and Stefkovich (2005) have described a paradigm for the profession
that expects its leaders to formulate and examine their own professional codes of ethics in light
of individual personal codes of ethics, as well as standards set forth by the profession, and then
calls on them to place students at the center of the ethical decision-making process. It also asks
them to take into account the wishes of the community. As such, the professional paradigm the
authors are proposing is dynamic-not static-and multidimensional, recognizing the complexities
of being an educational leader in today‘s society.
Thus, taking all these factors into consideration, this ethic of the profession would ask
questions related to justice, critique, and care posed by the other ethical paradigms, but would go
beyond these questions to inquire: What would the profession expect me to do? What does the
community expect me to do? And what should I do based on the best interests of the students,
who may be diverse in their composition and their needs.
Joanne Ciulla (2004, p. 17–18) argues that the definition of leadership studies is not
really about the question, ―What is leadership?‖ It is about the question, ―What is good
leadership?‖ By good, she means morally good and effective. This is why she thinks it is fair to
say that ethics lies at the heart of leadership. Researchers in the field need to have an
understanding of the ethical elements of leadership in order to be clear on what the term
leadership implies. In higher education institutions, morally good and effective leaders need to
have several methods in which to make decisions. According to Gini (2004), perhaps the best

30
method suited to the general needs of the ethical enterprise is a modified version of the scientific
method.
The first step in the scientific method is observation. Observation is the recognition of a
problem or conflict. The problem with current budget allocation practices is the lack of
transparency, accountability, and moral decision making. To maintain credibility, leaders
entrusted with public funds need to make sure their decisions regarding those funds are ethical
and moral. The second step in the scientific method is inquiry. Inquiry is a critical consideration
of the facts and issues involved. The third step in the scientific method is hypothesis or research
questions. The fourth step in the scientific method is experimentation. The fifth step in the
scientific method is evaluation. The evaluation would be: Did the study answer the research
questions? What were the conclusions, discussion, and recommendations found with this study?
Leadership ethics can also serve as a critical theory that opens up new kinds of dialogues
among researchers and practitioners. Work in leadership ethics should generate different ways
of thinking about leadership and new ways of asking research questions. To some extent, the
ideas of servant leadership and transforming leadership have already done this. The territory of
ethics lies at the heart of leadership studies and has veins that run through all leadership research.
As an area of applied ethics, leadership ethics needs to take into account research on leadership,
and it should be responsible to the pressing ethical concerns of society (Gini, 2004).
Accountability
Calls from tax payers and legislators for accountability in higher education have become
more frequent in the last several decades (Achtemeier & Simpson, 2005). The idea of
accountability implies policy ―designed to make institutions accountable to some higher
authority, typically the governor and state legislature‖ (Nettles, Cole, & Sharp, 1997, p. 24).

31
―Accountability is on the higher education policy agenda in many systems‖ (Huisman & Currie,
2004, p. 529). Analysts of accountability generally agree that it is the ―answerability for
performance‖ (Romzek, 2000, p. 22) or ―the obligation to report to others, to explain, to justify,
to answer questions about how resources have been used, and to what effect‖ (Trow, 1996, p.
310).
Romzek (2000) identifies four basic types of accountability relationships: hierarchical,
legal, professional, and political. The last two types, professional and political, are more often
found in higher education. Romzek explains that the difference between professional and
political accountability is the source of the stand for performance. ―Professional accountability
systems are reflected in work arrangements that afford high degrees of autonomy to individuals
who base their decision-making on internalized norms of appropriate practice‖ (2000, p. 26).
Political accountability relationships afford managers the discretion or choice to be responsive to
the concerns of key interest groups, such as elected officials, clientele groups, and the general
public (Huisman & Currie, 2004).
Trow (1996) points to the functions of accountability and more specifically focuses on
the higher education context. He first maintains that accountability is a constraint on arbitrary
power, thereby discouraging fraud and manipulation, and strengthening the legitimacy of
institutions that are obligated to report to appropriate groups. Second, accountability is claimed
to sustain or raise the quality of performance by forcing those involved to examine their
operations critically and to subject them to critical review from outside the institution. Third,
accountability can be used as a regulatory device through the kind of reports and the explicit and
implicit criteria to be reported to the institutions.

32
A transformation of the definition and substance of state-level accountability in higher
education is under way and is likely to profoundly affect future policy (Ewell & Jones, 2006).
The established model of accountability for American higher education emerged in the 1960s
and 1970s. The focus was: Were public institutions abiding by established regulations, and were
monies being spent for intended purposes? The task of the state was to ensure that public funds
were spent efficiently and that the opportunity to benefit was available to all citizens.
Accountability in this period rested primarily on annual institutional compliance reporting. A
change in this pattern occurred between 1985 and 1989 when many states enacted assessment
mandates. These mandates brought results in the form of learning outcomes to the accountability
table for the first time. Some of the change in accountability was attributed to the need for new
state policy strategies for higher education in a severely constrained fiscal operating environment
(Ewell & Jones, 2006).
According to Wellman, ―higher education accountability has public trust dimensions that
require communicating in ways the public can understand‖ (2006, p. 111). The notion of public
accountability for the public trust begins with the meaning of the public trust for higher
education and how that term has evolved from a traditional focus on the institution, to the
intersection of higher education and society, to the public agenda for higher education.
Communication to the general public is one aspect of improved accountability for the public
agenda.
Wellman (2006) explores the notion of public accountability for the public trust. Public
trust in higher education has evolved from a traditional focus on the institution to the intersection
of higher education and society to the public agenda for higher education. Developers of a
public agenda for higher education argue that the country needs new comprehensive strategies to

33
increase production, quality, and efficiency across the education pipeline (Wellman, 2006).
According to Carey (2007), accountability in American higher education is largely a myth. He
claims higher education needs accountability in more than name. It needs accountability that is
real. Carey (2007) claims the two elements of real accountability are truth and action. The
degree to which an institution has fulfilled its purpose is the truth element. Real accountability
systems push institutions to act on that information in a manner that is designed to change what
they do in order to make them more successful than they would otherwise be. Real
accountability systems matter.
Transparency
The National Commission on the Future of Higher Education met six times between
October 2005 and August 2006 (Commission on the Future of Higher Education, 2006). One
recurring theme in its deliberations was higher education‘s aversion to transparency and
accountability (Kuh, 2007). According to Kuh (2007), to balance the demands of public interest
and institutional autonomy, administrators need to determine the legitimate applications of
common-reporting templates. A common reporting template is intended to serve three general
purposes: improvement, transparency, and accountability. Information collected through
common-reporting templates should be used to guide policy and improvement. Otherwise,
collecting and reporting information is a hollow exercise (Kuh, 2007).
In an effort to become more transparent and accountable, institutions of higher education
must change from a system based on reputation to one based on performance. The Department
of Education should collect and provide information on institutional outcomes and student
performance, provide annual reports on college revenues and expenditures, and establish a
privacy-protected information system that collects and analyzes student-level data. This data

34
could be used as a tool for accountability, policy making, and consumer choice (Lingenfelter,
2007).
―All of the states in the union have had at least three decades of experience with legally
mandated openness in their public-sector institutions, including public higher education
institutions‖ (McLendon & Hearn, 2006, p. 675). In the latter half of the 20th
century the states
moved to expand public access to information about state governmental activity, including
public higher education institutions, through adoption of open-meetings and records laws. These
laws are known as sunshine laws. State sunshine laws are widely viewed as an accepted and
largely healthy element in the institutionalized structure of campus relations with external
bodies. Though sometimes these laws are perceived as time-consuming and a hindrance to quick
action, there is substantial consensus that the benefits of mandated openness and transparency
outweigh the costs (McLendon & Hearn, 2006).
―The aim of quality assurance codes of practice and guidelines is, in theory, to give a
clear indication to stakeholders, governments, financers, partners and the public at large about
the various course providers and the level of education they offer‖ (Aelterman, 2006, p. 227).
Greater transparency improves the understanding and interpretation of qualifications and
competencies. Transparency of qualifications and competences can be described either as a
political problem needing a technical solution, or a technical problem needing a political
solution. While progress has been made both at political and technical levels, there is still quite
some way to go in implementing the solutions, especially at the national level (Deane, 2005).
Accountability pressures in higher education are not new. What is relatively new is the
prominent place that issues of accountability and transparency now occupy on the nation‘s
higher education agenda (McCormick, 2009). An example is the 2006 report of the Secretary of

35
Education‘s Commission on the Future of Higher Education (Spellings Commission), A Test of
Leadership:
Colleges and universities must become more transparent about cost, price, and student
success outcomes, and must willingly share this information with students and
families…. This information should be made available to students, and reported publicly
in aggregate form to provide consumers and policy makers an accessible, understandable
way to measure the relative effectiveness of different colleges and universities. (p. 4)
Reforms in the accreditation system have also played a role in the emphasis on
accountability and transparency for student outcomes (McCormick, 2009). Accreditation is an
accountability system, although the mechanism for accountability is grounded in peer review
rather than public reporting (Burke, 2005). Accreditation has shifted its emphasis away from
demonstrating that an institution satisfies minimum capacity and infrastructure standards towards
a focus on an institution‘s plans and processes for the assessment and improvement of
educational effectiveness (Eaton, 2001).
According to McCormick (2009), there is an important difference between accountability
articulated by the accrediting agencies and the Spellings Commission. Accrediting agencies
operate under the guide that educational assessment and improvement is an internal matter, and
that accountability is accomplished through the approval of accrediting bodies (McCormick,
2009). The focus of the Spellings Commission is on public disclosure and transparency in the
interest of providing consumer information. Under the Spellings Commission, accountability is
accomplished by the marketplace which rewards and punishes institutions based on publicly
reported performance information (Burke, 2005).

36
Historical Budget Processes at Public Institutions
There are several historical budget processes at public institutions. A number of these
processes are incremental budgeting, zero based budgeting, line item budgeting, program
budgeting, static budgeting, flexible budgeting, and capital budgeting.
Incremental budgeting is used most often in historical budget processes at public
institutions (Massy, 1996b). Incremental budgeting uses a budget prepared using a previous
period‘s budget or actual performance as a base, with incremental amounts added for the new
budget period. The allocation of resources is based upon allocations from the previous period.
This approach is not recommended as it fails to take into account changing circumstances.
Moreover, it encourages ―spending up to the budget‖ to ensure a reasonable allocation in the next
period. It leads to a ―spend it or lose it‖ mentality (Massy, 1996b).
Some advantages of incremental budgeting are the budget is stable and change is gradual,
managers can operate their departments on a consistent basis, the system is relatively simple to
operate and easy to understand, conflicts are avoided when departments appear to be treated
similarly, coordination between budgets is easier to achieve, and the impact of change can be
seen quickly (Massy, 1996b). Some disadvantages of incremental budgeting are it assumes
activities and methods of working will continue in the same way, no incentive for developing
new ideas, no incentive to reduce costs, encourages spending up to the budget in order that the
budget is maintained next year, the budget may become out-of-date and no longer relate to the
level of activity or type of work being carried out, the priority for resources may have changed
since the budgets were originally set, and there may be budgetary slack built into the budget
which is never reviewed. Managers might have overestimated their requirements in the past in

37
order to obtain a budget which is easier to work within, and which will allow them to achieve
favorable results (Massy, 1996b).
Zero based budgeting requires a rigorous review and approach to budgeting. In
traditional incremental budgeting, departmental managers justify only increases over the
previous year budget and what has been already spent is automatically sanctioned. By contrast,
in zero-based budgeting, every department function is reviewed comprehensively and all
expenditures must be approved, rather than only increases. No reference is made to the previous
level of expenditure. Zero based budgeting requires the budget request be justified in complete
detail by each division manager starting from the zero base (Massy, 1996b).
Line item budgeting is a budget that lists the individual costs of all budgeted items such
as personnel participating in the project, fringe benefits, travel, equipment, and supplies. A line
item budget should always be separate from the budget narrative and identify each budget period
separately. A line item budget is a highly detailed budget often adopted with the idea of greater
control over expenditures. Its name is derived from the fact that it expresses each kind and
quantity of expenditures and revenues as a single item on one line of the budget (Dongsung,
2005). Line item budgeting or earmarking can also be an attempt to garner additional public
resources. Through this device, an institution receives a specified amount directly from the
government‘s budget without any intervening decisions by the institution (Schuster, 1990).
Program budgeting is a better approach than incremental budgeting, zero based
budgeting, or line item budgeting. This approach to budgeting is more encompassing and
flexible. Program budgeting is the budgeting system that, contrary to conventional budgeting,
describes and gives the detailed costs of every activity or program that is to be carried out in a
budget. Program budgeting is budgeting for the delivery of a particular program. The focus of

38
program budgeting is on the purpose of the program and its outcome rather than the components
of the program (as is the case in line item budgeting). Less attention is paid to the specific
spending items of the program and more on its expected output (Wooldridge, Garvin, & Miller,
2001).
Static budgeting is a budget based in a fixed set of assumptions. For example, the
manufacturing division establishes a budget at the start of the fiscal period that cannot be altered,
no matter what occurs with respect to prices, demand, or the economy. Static budgeting is one
based on a single level of activity (e.g., a particular volume of sales or production). It has two
characteristics: (1) it is geared toward only one level of activity, and (2) actual results are
compared against budgeted (standard) costs only at the original budget activity level (Webster,
1993).
A flexible (variable) budget differs from a static budget on both scores. First, it is not
geared to only one activity level, but rather, toward a range of activity. Second, actual results
are not compared against budgeted costs at the original budget activity level. Managers look at
what activity level was attained during a period and then turn to the flexible budget to determine
what costs should have been at that actual level of activity. A flexible budget is a projection of
costs and revenues at various levels of output and revenue. Flexible budgeting is a more
impartial way to budget (Webster, 1993).
Capital budgeting is budgeting for long term assets (e.g., land, buildings, etc.) and has to
account for the time value of money. Under capital budgeting it is difficult to compare total
costs to total benefits. Capital budgeting is the process in which an institution determines
whether projects such as building a new plant or investing in a long-term venture are worth
pursuing. Oftentimes, a prospective project‘s lifetime cash inflows and outflows are assessed in

39
order to determine whether the returns generated meet a sufficient target benchmark
(Wooldridge, Garvin, & Miller, 2001).
Ideally, institutions should pursue all capital budgeting projects and opportunities that
enhance shareholder value. However, because the amount of capital available at any given time
for new projects is limited, management needs to use capital budgeting techniques to determine
which projects will yield the most return over an applicable period of time. Popular methods of
capital budgeting include net present value (NPV), internal rate of return (IRR), discounted cash
flow (DCF) and payback period (Wooldridge, Garvin, & Miller, 2001).
The literature on budgeting within organizations is relatively limited (Pondy, 1970).
According to Pfeffer and Moore (1980),
One of the central issues in budgeting research is the extent to which a political model
accounts for observed outcomes in contrast to a rational or bureaucratic model, and the
conditions under which the political model is more or less likely to hold. (p. 637)
Pfeffer and Salancik (1974) argued that organizational budgeting was a political process. For
example, they and others found that power and social-influence processes were more important
in decision situations characterized by uncertainty (Pfeffer, Salancik, & Leblebici, 1976;
Salancik & Pfeffer, 1978), scarcity and criticalness (Hills & Mahoney, 1978; Salancik & Pfeffer,
1974), and in decision situations in which information used to make the decisions and the
decision outcomes themselves were secret (Pfeffer & Moore, 1980, p. 637; Salancik & Pfeffer,
1978).
A second issue was what determined the power of departments within the organization.
In their study of the University of Illinois, Salancik and Pfeffer (1974) found that power accrued
to the academic departments that provided grants and contracts for the organization. Hills and

40
Mahoney (1978) observed a significant relationship between an academic department having an
outside advisory board and its ability to obtain incremental budget. Freeman and Hannan (1975)
argued that position in the decision-making process affected power. For example, administrators
at the head of the decision-making and information systems could protect themselves better from
cutbacks under declining enrollments than lower-level groups.
A third issue concerned how to distinguish power from other related concepts (such as
size), how to measure it in a social system, and how to assess the validity of political models
versus alternatives. March (1966) argued that power was often incorrectly attributed. In social-
process models of decision making, March (1966) maintained that much of what occurs in
organizations is accidental rather than the result of interests being pursued by powerful
organizational actors.
Pfeffer and Moore (1980) examined the determinants of power and budget allocations on
two campuses of a large, state university system. As in previous studies, it was determined that
faculty positions and budget allocations were a function of student enrollment and departmental
power, and departmental power was related to the amount of a department‘s grant and contract
funds as well as enrollment. In a comparison of resource allocation on the two campuses, it was
found that for the campus that faced less scarcity of resources, enrollment was more highly
related and departmental power less strongly related to allocations (Pfeffer & Moore, 1980).
Current Budget Processes at Public Institutions
What is Privatization?
Privatization occurs when state support of public higher education institutions declines,
forcing public institutions to seek support from the private sector. When this occurs,
stakeholders share in public higher education shift from the state to other supporters or

41
stakeholders. Some private sector supporters are parents, alumni, donors (private and public),
cities, and other institutions of higher education (Lyall & Sell, (2006).
Privatization of public higher education is when students are forced to pay increased
amounts for tuition and fees when state appropriations per student decreases. According to
Tooley and Dixon (2006), there are three types of privatization: demand-side financing, reforms
to the educational supply side, and de facto privatization.
Lyall and Sell (2005) suggest in terms of numbers of students served per dollar of public
investment, the public university has kept pace with productivity increase in the private sector.
The problems with this measure (number of students served per dollar of public investment) are
the use of more part-time faculty, larger classes, and online courses. These have reduced costs
but have not been evaluated for their effectiveness. According to Lyall and Sell (2005), the
proposed solution is a deliberate effort to form a new kind of public purpose institution. These
new quasi-public institutions would have better business practices and planning, more
collaboration with other institutions, and more responsibility to broaden their boards to represent
a wide range of public interests. Public support would be 30 percent of costs; student tuition
would be 20 percent of costs; and income from donors, alumni, and others the remaining 50
percent. Student access would be a top priority. Also, the institution would have a greater
responsibility to state economic and labor markets. The public purpose university would not
give up its mission to research but would shift to more applied research that would better benefit
the state. This would mean that fewer public universities would make it into the top research
rankings (Lyall & Sell, 2005).
Lyall‘s and Sell‘s (2005) plan looks somewhat like the restructuring of Virginia‘s public
education system. All of Virginia‘s higher education institutions are eligible for three

42
differentiated levels of increased autonomy. The increased autonomy would be in exchange for
agreeing to meet specific performance goals regarding student access, institutional collaboration,
student transfers from two- to four-year institutions, and systematic and strategic planning.
Financial incentives are provided for performance on these measures. The incentives are an
exchange of greater flexibility and autonomy from the state for meeting responsibilities and
levels of public performance (Lyall & Sell, 2005).
According to Levin (2007), there are two elements missing in the book by Lyall and Sell.
The first is that costs of education will continue to rise. There is no evidence that this cost has
been stemmed by rising productivity in higher education even when technology, online learning,
large class sizes, and where more part-time faculty members are added. There is little evidence
that quality has been maintained, and there have been reports of deterioration in student
outcomes. Second, the book does not explain who will pay for the rising costs of tuition in a
nation of stagnant earning levels for much of the parent population. The financing of student
costs is still the issue that has not been addressed in the public purpose university (Levin, 2007).
America is privatizing public higher education institutions without serious public policy
analysis or debate. Much of the support and influence for higher education institutions have
shifted to parents, donors, alumni, and corporations (Lyall & Sell, 2006). Lyall and Sell (2006)
ask the following questions regarding de facto privatization in American public higher education:
What is privatization? What is some evidence of privatization? Is privatization a cyclical or
long-term trend? What are some consequences of privatization? What are universities doing to
cope with privatization? What are states doing to cope with privatization? What will happen
next with privatization? and, What to do next about privatization?

43
Evidence of Privatization
Some evidence of privatization, according to Lyall and Sell (2006), are the state
appropriation per student, the share of state budgets spent on higher education, and the
investment per $1,000 of state income devoted to higher education have all been declining for
more than a decade. Public colleges and universities enroll about 77 percent of American
college students. In 1980, the state support for these public institutions was around 50 percent.
Today, state support for these public institutions is down to approximately 30 percent. At some
of the top ranked public universities state support is only around 10 percent. To offset this
reduction at public institutions, tuition rates have had to be increased. These increased rates can
negatively impact access and quality of instruction (Lyall & Sell, 2006).
To offset this negative impact, public colleges and universities have been diversifying
revenues, streamlining costs, and adopting technology. As a result of diversifying revenue
streams, a shift has occurred in the claims and constituencies to which university presidents,
faculty, and staff are responsible. At many public institutions the financial support provided by
students, alumni, and donors exceed public support. Annual budget decisions made by
legislatures undercut their roles to control the plans of college and universities (Lyall & Sell,
2006).
Cyclical or Long-Term Trend
Lyall and Sell (2006) believe that a shift to privatization is not cyclical but a long-term
trend. It is due in part to a profound change in political philosophy. This new political
philosophy shifts the burden and responsibility from the public sector (state) to the private sector
(parents, donors, corporations, etc.). This is happening when an education beyond high school is
essential. State lawmakers perceive there is an easy availability of an alternative source of

44
revenue (tuition). Added to these burdens is the federal tendency to shift to the states
responsibility for meeting increased domestic needs such as Medicare and homeland security. In
addition to this, is a profound change in our sense of obligation to future generations (large tax
debt burdens) (Lyall & Sell, 2006).
Consequences
Some of the consequences of privatization are viewed as good, bad, and mixed. The
consequences of privatization viewed as good are public institutions will have to increase
efficiency and pay more attention to consumer preferences. Public universities will have to
focus their resources on the services that the consumers want and are willing to pay for, and less
on what the universities would like to produce. The states‘ outdated operating systems will have
to transform themselves into market place competitors. For some public institutions, the
diversification of revenues may help to make institutions less vulnerable to shifts in state
economic conditions. Finding a new balance among the new and different stakeholders is a very
large task requiring realistic public-policy dialogue (Lyall & Sell, 2006).
The consequences of privatization viewed as bad are access for low- and moderate-
income students is declining as tuition rises, and financial aid fails to keep up with need. The
main federal need-based aid program (Pell Grants) covered 35 percent of costs at four-year
public universities in 1980–1981 and 23 percent in 2003–2004. Privatization also increases the
risk of conflict of interests with corporations and research sponsors. The market dictates that
expensive research results from labs often be sold, and not given away for the public good. Also,
it is not clear if public colleges and universities will continue to educate teachers, nurses,
physical therapists, and social workers. These professions have essential skills, but modest
market rewards. Privatization also weakens the public service component of land-grant

45
universities such as extending knowledge to farmers, start-up businesses, community service
organizations, and state and local governments (Lyall & Sell, 2006).
According to Lyall and Sell (2006), if the capacity to produce college educated citizens
declines there will be an adverse effect on both the economic opportunity and the social mobility
on which democracy depends and the knowledge and skills that are essential to the economy.
According to an Organisation for Economic Co-operation and Development (OECD) report, that
is already occurring; the United States has 32.5 percent of 20- to 24-year olds participating in
college as compared to 37.2 in other OECD countries. This will profoundly change our nation‘s
economic and political future.
There are some of the consequences of privatization that are viewed as mixed or unclear.
Privatization may impose greater accountability on universities to students, donors, and alumni.
The pressures of the market may force accountability goals that may be at odds with public
purposes. Market-led missions may limit the role of public universities as instruments for social
critique, social justice, and economic change. The move to privatization shifts the emphasis
away from the collective advantages of an educated population (reduced lifelong healthcare
costs, reduced criminal activity, greater labor market efficiency, and better child-rearing skills)
toward individual benefits of increased incomes (Lyall & Sell, 2006).
What Are Universities Doing to Cope?
Some ways that public universities are coping with privatization are increasing tuition
and fees, stepping up organized fundraising campaigns to boost endowments and support
building needs and scholarships, and finding new partners in the corporate sector to support
research and economic development initiatives. They are reducing costs, redesigning courses
and programs to make better use of online technologies, and deferring the replacement of

46
classroom technology and capital maintenance. The primary contribution universities can make
is through economic growth driven by educated citizens and new knowledge, and not through
cutting these outcomes for short term savings (Lyall & Sell, 2006).
What Are States Doing to Cope?
States budget decisions have become short-term and one-time actions rather than well
thought out long-term solutions. This is apparent in the states decisions to make across the board
budget cuts and the elimination of arbitrary numbers of state employees. Some states have
undertaken significant experiments to restructure the relationship between the state and its public
institutions.
One example of what states are doing to cope is charter universities of various types. It
gives public universities greater operating autonomy in exchange for meeting specified state
performance goals. This relationship recognizes the state‘s minority stakeholder status and frees
the university to realize management efficiencies outside the contractual constraints of state
government. This will help to ensure that core public purposes are defined and achieved.
Hybrid universities operate with a mix of publicly-supported and privately-endowed units within
the same university structure. Hybrid structures enable the state to focus scarce funding on
programs that are of critical public interest while leaving the operating and funding of the
remaining units to the university operating as a private entity. Full cost pricing experiments
entail setting tuition to cover the full costs of operation. Financial aid set aside from the tuition
revenues are then used to ensure access for low-income students. Vouchers for higher education
shifts whatever state funding is available for institutions to individuals. This system intensifies
the competition for students. The impact of this strategy will depend on the size of the vouchers

47
in relation to the total cost of educating students and the reactions of citizens to changes in
voucher amounts (Lyall & Sell, 2006).
Needs Assessment Measures
Needs assessment is a process for determining and addressing needs, or ―gaps‖ between
current conditions and desired conditions, often used for improvement in individuals,
education/training, organizations, or communities. The idea of needs assessment, as part of the
planning process, has been used under different names for a long time. In the past 50 years, it
has been an essential element of educational planning. Over the past four decades, there has been
a proliferation of models for needs assessment with dozens of models from which to choose.
Considered the ―father of needs assessment,‖ Roger Kaufman first developed a model for
determining needs defined as a gap in results (Kaufman & English, 1979). This particular
emphasis in results focuses on the outcomes (or ends) that result from an organization‘s
products, processes, or inputs (the means to the ends). Kaufman and English (1979) argue that
an actual need can only be identified independently of premature selection of a solution (wherein
processes are defined as means to an end, not an end unto themselves). To conduct a quality
needs assessment, according to Kaufman and English (1979), first determine the current results,
articulate the desired results, and the distance between results is the actual need. Once a need is
identified, then a solution can be selected that is targeted to closing the gap. Kaufman‘s model in
particular, identifies gaps in needs at the societal level, what Kaufman calls ―Mega‖ planning,
along with gaps at the Macro (or organizational) and Micro level (Kaufman, 2006).
A needs assessment is the process of collecting information about an expressed or
implied organizational need. The need can be a desire to improve current performance or to
correct a deficiency. A deficiency is performance that does not meet the current standard. It

48
means there is a prescribed or best way of doing a task and that variance from it is creating a
problem. Assessments can be formal (using survey and interview techniques) or informal
(asking questions of those involved). Needs assessment often involves the use of more than one
type of analysis (Barbazette, 2006).
Needs assessment can also be defined as a gap analysis. A gap analysis is a technique for
determining the steps to be taken in moving from a current state to a desired future-state. It
begins with (1) listing of characteristic factors (such as attributes, competencies, performance
levels) of the present situation (―what is‖), (2) cross-listing factors required to achieve the future
objectives (―what should be‖), and then (3) highlighting the ‗gaps‘ that exist and need to be
‗filled.‘ This process is also called need-gap analysis, needs analysis, and needs assessment
(Barbazette, 2006).
The purpose of a needs assessment is to answer some familiar questions: why, who, how,
what, and when. Why should the organization conduct a needs assessment? Who is involved in
the needs assessment? How can the deficiency be fixed? What is the best way to conduct the
needs assessment? When is the best time to conduct the needs assessment? Conducting a needs
assessment protects the assets of an organization and assures that resources that are set aside for
a specific purpose are conserved and used only for that purpose (Barbazette, 2006).
A needs assessment is a systematic exploration of the current state and the way it should
be. The current state is usually associated with organizational and/or individual performance
(Stout, 1995). According to Stout (1995), a needs assessment is conducted to find out what
learning will be accomplished, what changes in behavior and performance are expected, what are
the desired results and will they be achieved, and what are the expected economic costs and
benefits of any projected solutions. The four steps to conducting a needs assessment are to
49
perform a ―gap‖ analysis, identify priorities and importance, identify causes of performance
problems and/or opportunities, and identify possible solutions and growth opportunities (Stout,
1995).
The first step is to check the actual performance of the organizations and the people
against existing standards, or to set new standards. There are two parts to this: current situation
and desired or necessary situation. Current situation is to determine the current state of skills,
knowledge, and abilities of the current and/or future institution or employees. This analysis also
should examine organizational goals, climate, and internal and external constraints. Desired or
necessary situation means to identify the desired or necessary conditions for organizational and
personal success. This analysis focuses on the necessary job tasks/standards, as well as the
skills, knowledge, and abilities needed to accomplish these successfully. It is important to
identify the critical tasks necessary, and not just observe current practices (Stout, 1995). The
first step should produce a large list of needs for training and development, career development,
organization development, and/or other interventions.
The second step is to identify priorities and importance. Next, examine these in view of
their importance to organizational goals, realities, and constraints. Then, determine if the
identified needs are real, if they are worth addressing, and specify their importance and urgency
in view of organizational needs and requirements (Stout, 1995).
The third step is to identify causes of performance problems and/or opportunities. After
prioritizing and focusing on critical organizational and personal needs, the next step is to identify
specific problem areas and opportunities in the organization. If appropriate solutions are to be
applied, performance requirements must be known (Stout, 1995).

50
The fourth step is to identify possible solutions and growth opportunities. If people and
institutions are doing their jobs effectively, leave well enough alone. However, some training
and/or other interventions might be called for if sufficient importance is attached to moving
people and/or institutions and their performance in new directions (Stout, 1995).
According to the Delaware Study of Instructional Costs and Productivity, examples of
needs assessment measures in higher education are One Time Funds, Continuing Funds, Number
of Students, Budget per Student, Reserve Amount to the Base Amount (as a %), Reserve Amount
per Student, Summer Budget Distribution, Summer Budget Distribution per Student, and Prior
Two Year Budget Allocations (Middaugh, Graham, & Shahid, 2003). This study focuses on five
needs assessment measures: One Time Funds, Continuing Funds, Reserve Amount to the Base
Amount (as a %), Summer Budget Distribution, and Summer Budget Distribution per Student.
Productivity Measures
Productivity is a measure of output from a production process, per unit of input. For
example, labor productivity is typically measured as a ratio of output per labor-hour, an input.
Productivity may be conceived of as a metric of the technical or engineering efficiency of
production. As such, the emphasis is on quantitative metrics of input, and sometimes output.
Productivity is distinct from metrics of allocative efficiency, which take into account both the
monetary value (price) of what is produced and the cost of inputs used, and also distinct from
metrics of profitability, which address the difference between the revenues obtained from output
and the expense associated with consumption of inputs (Kurosawa, 1975).
Throughout the research productivity literature, scholars have used a wide range of
methods for determining productivity, have most often focused on assessing institutional as
opposed to individual productivity, and have tended to limit the scope of productivity scores to

51
specific time periods and specific journal publications (Duffy, Martin, Bryan, & Raque-Bogdan,
2008). The importance of studying productivity can be considered on an institutional and an
individual level. Institutional assessments of productivity within a field are typically computed
by assessing the individual productivity of institution members, most often through journal
publications, and summing these together for an overall score. Most frequently, these
assessments have been used to develop productivity rankings of institutions within a subfield
(Duffy et al., 2008).
Rhoades‘ (2001) aim is to affect institutions of higher educations‘ conceptualization of
productivity in four areas. The first area is who is focused upon in efforts to increase
productivity. The second area is which unit of analysis or organizational level is addressed. The
third area is what functions or organizational roles are considered. The fourth area is whose
interests are invoked and served in designing productivity initiatives.
In discussing the productivity of whom (first area) Rhoades (2001), starts with faculty
and extends to non-faculty professionals and to their involvement in production activities. In
discussing productivity for which unit of analysis (second area) Rhoades (2001), looks beyond
individual faculty and standardized models of production. He points to the importance of
looking laterally and vertically in the organization. Looking laterally, production takes place in
departments and colleges which have different production functions. Looking vertically,
production takes place at various institutional levels. In discussing productivity according to
what functions are considered (third area), Rhoades (2001) begins with the functions most
commonly identified with colleges and universities — teaching and research. In discussing
productivity in whose interest (fourth area), Rhoades (2001) begins with two categories that are
invoked in discussions of stakeholders — faculty and students. Rhoades (2001) offers general

52
principles to inform the perception of ―the problem,‖ leaving it to administrators to apply those
principles to develop policies and practices appropriate to their context.
With students, parents, and government seeking proof of a return on their investment and
efficient management of fiscal and human resources, it is essential to have access to appropriate
and useful data when researching the operation of an institution and its faculty. Given the central
role of the faculty and their involvement with students in and outside the classroom, it is critical
to understand faculty work in order to assess institutional effectiveness. Institutional researchers
need to use measurements that generate more particular and narrower results within the area of
faculty workload and productivity if they are to meet the managerial needs of our institutional
administrators and financial planners (Middaugh, Kelly, & Walters, 2008).
In 2003, the Office of Institutional Research and Planning at the University of Delaware
received a contract from the National Center for Education Statistics to examine factors that
contribute to increases in the cost of higher education at four year institutions in the United
States. The University of Delaware was selected because the Office of Institutional Research
and Planning has been the analytical center for the Delaware Study of Instructional Costs and
Productivity since 1992. The Delaware Study annually collects detailed information on faculty
teaching loads, instructional costs, and externally funded scholarship, all at the academic
discipline level of analysis. Since its inception, more than five hundred institutions have
participated in the Delaware Study (Middaugh, Graham, & Shahid, 2003).
According to the Delaware Study of Instructional Costs and Productivity, examples of
productivity measures in higher education are Full Time Equivalent Student Units, Declared
Majors, Number of Degrees Granted, Student Credit Hours, Full Time Equivalent Faculty Units,
Fiscal Data, Research and Service Expenditures, Cost of Instruction and Revenue Measures

53
(Middaugh, Graham, & Shahid, 2003). This study focuses on five productivity measures: Full
Time Equivalent Student Units, Number of Degrees Granted, Student Credit Hours, Full Time
Equivalent Faculty Units, and Cost of Instruction.
The field of counseling psychology has an established history of examining research
productivity as a means of engaging in self reflection, quality assessment, correction, and growth
(Kahn, 2005; Spengler, Neville, & Hoffman, 2005). Periodic review of research, recognized as
one of counseling psychology‘s greatest strengths, has allowed the field to assess quality within
and between programs and has offered counseling psychology programs the opportunity to
examine their research agendas (Spengler et al., 2005). Throughout the research literature,
scholars have used a wide range of methods for determining productivity, have most often
focused on assessing institutional as opposed to individual productivity, and have tended to limit
the scope of productivity scores to specific time periods and/or specific journal publications
(Duffy, Martin, Bryan, & Raque-Bogdan, 2008). Research productivity, as one aspect of
scholarly work, is defined differently across academic fields but generally relates to publications
in books and journals, publication citations, research grants, awards, and professional service
(Print & Hattie, 1997). The importance of studying productivity can be considered on an
institutional and an individual level (Duffy et al., 2008).
Institutional assessments of productivity within a field are typically computed by
assessing the individual productivity of institution members, most often through journal
publications, and summing these together for an overall score. These measurements of research
productivity allow specific institutions within a field to compare their productivity to one
another. Most frequently, these assessments have been used to develop productivity rankings of

54
institutions within a subfield, and they have a rich history in the field of counseling psychology
(Duffy et al., 2008).
In contrast to this body of research, relatively fewer studies have addressed productivity
at the individual level. Researchers have investigated such questions as where authors received
their graduate degree, who typically gains fellowship in Division 17 of the American
Psychological Association, who has been cited in textbooks and Annual Review of Psychology
chapters, who has published the most psychotherapy process articles with the Journal of
Counseling Psychology or the Journal of Consulting and Clinical Psychology, who are the top
20 individual contributors to Journal of Counseling Psychology on the basis of author-weighted
scores from 1973–1998, and who has published the most research on ethnic and minority
populations (Duffy et al., 2008).
Budget Allocation Models
A new strategic plan, an additional one hundred faculty members, a new financial model,
an incentive compensation plan, a new $200 million research building, closing one
professional school and repositioning assets to help another, redirecting net revenues
from two parking garages, and a building renewal and replacement plan — are all
outcomes of a strategic planning and budgeting process. (Haberaecker, 2004, p. 71)
George Keller (1999–2000) suggested that strategic planning is increasingly about organizational
learning and creativity, and that there is a need to change existing structures and processes.
The topic of cost of instruction is sometimes overlooked in the broader context of
discussions about affordability, cost, price, and the economics and finance of higher education.
There is, however, a distinct though relatively small knowledge base of literature and research
about cost of instruction. The language of cost is ―used constantly in higher education and has

55
many different meanings. Cost information abounds, yet … it is seldom what it appears to be‖
(Jenny, 1996, p. xv). Jenny (1996) explains that:
… higher education accounting is not organized to answer questions concerning the full
costs of teaching a conventional course, conducting a seminar, admitting a freshman
class, or managing the institution‘s heating and cooling system.… Sometimes the normal
accounting system is so far removed from what is needed that elaborate new stand-alone
costing models must be constructed. (p. 93)
Any state involvement in the financing of higher education necessitates a method to
channel support to higher education institutions. Public funding, through resource allocation
models, influences the functioning of higher education institutions according to how funding
reaches them and therefore resource allocation models are a mechanism to stimulate desirable
behavior (Orr, Jaeger, & Schwarzenberger, 2007). However, under any allocation system,
funders (whether they are state, private, contract/grant, etc.) of higher education institutions must
be accountable for their actions and their spending. Thus, resource allocation and accountability
are intertwined (Nkrumah-Young, 2005). There are two dominant perspectives on resource
allocation models — one takes a governance and accountability perspective, and the other takes
a management and accountability perspective (Nkrumah-Young & Powell, 2008).
―A major challenge in the formulation of optimization models for large-scale, complex
operational problems is that some data are impossible or uneconomical to collect, producing a
cost model that suffers from incomplete information‖ (Marar, Powell, & Kulkarni, 2006, p. 159).
This is true when formulating a budget allocation model for large-scale, complex institutions of
higher education. Budget allocation model frameworks are designed to solve resource allocation
problems with incomplete information. This situation is characterized by the inability of the

56
modeler to express all operational behavior in terms of cost functions due to missing elements of
data (strategic plan, needs assessment measures, productivity measures, etc.).
Budget allocation models are mechanisms for linking strategic plans with operational
plans. Designing a budget allocation model requires integrated planning and collaborative
thinking. The elements that factor into integrated planning vary with the domain. However, in
principle, the impetus for integrated planning is consistent: to explicitly relate strategic
organizational decisions that affect one another but that might otherwise be dealt with through
separate processes (Sandmeyer, Dooris, & Barlock, 2004).
Integrated planning is emerging in higher education. The National Association of
College and University Business Officers (NACUBO) has begun offering a continuing
professional education course entitled ―Integrated Planning and Budgeting‖. Integrated planning
is becoming an explicit part of some university strategic plans. In higher education, integrated
planning draws together strategic planning, capital and operating budgeting, enrollment
management, and human resource planning. Integrated planning usually means enhancing
collaboration of operating units — academic schools and colleges — with support functions such
as the budget office and physical plant. It may push planning across multiple levels of the
institution, including central university and unit-specific decision making. Integrated planning
also extends over a multiyear time frame of about three to five years (Sandmeyer et al., 2004).
Many of the challenges with integrated planning involve data definitions and
discrepancies. The integrated planning process shows that not all campuses use the same
working definitions and conventions, even for measures that are frequently used (for example,
the calculation for an FTE faculty member or FTE student). Although having stated this, campus
executives have noted that integrated planning promotes critical and collaborative thinking, and

57
it reinforces the university‘s expectation that strategic planning will be firmly rooted in data and
data driven decisions. Integrated planning can be a mechanism for linking strategic plans with
operational plans, and it can serve as a vehicle for testing assumptions and projecting scenarios
(Sandmeyer et al., 2004).
A strategic planning process typically takes one of two forms. The process can redirect
or recast the institution in fundamental ways, or it can focus on the things it is doing especially
well and organize the future around them. Both of these require a budget allocation model that
responds to changes in activity levels (for instance enrollments) within colleges, reward revenue
generation and cost containment, move accountability and authority to those closest to the
programs, support long range planning consistent with priorities, and free institutional leaders to
focus on wider issues associated with resource generation and allocation (Leitzel, Corvey, &
Hiley, 2004).
According to Leitzel, Corvey, and Hiley (2004), there are several elements critical to
success in strategic planning and developing a budget allocation model to support that plan.
These elements are leadership, consensus about need for change, process design, patience and
flexibility, values and vision, and communications strategy.
Strategic planning and resource allocation requires a highly collaborative team of senior
administrative leaders who believe that change is both needed and possible. In the academic
area, college deans, school and center directors, and program heads have to be open to
developing an institutional framework that can provide a context for unit planning without
negating the unit‘s plans. The process design should be as inclusive as possible in order to
guarantee the buy-in of key constituencies and to bring in the expertise needed for effective
decision making. The challenge in process design is to take full advantage of every piece of

58
good luck, to be open to possibilities that are not in the original blueprints, to be nimble and
creative in responding to possibilities, and to try to create a culture where enlightened
opportunistic behavior is embraced. It is important to be patient and flexible in accommodating
the deep reservations many individuals have about change. A consensus of values and vision
provides a foundation for setting goals and priorities. A good communications strategy should
inform constituencies at every phase of the process (Leitzel et al., 2004).
Performance based funding is sometimes used as an instrument of competition. Basing
funding allocations on comparative performance is one way of setting an incentive for
competitive practice within and among universities. Reforms in funding at both the state and
university levels have concentrated on indicator-based models. Indicator-based models‘
structure suggests a ‗tool box‘ of indicators. Performance based funding only determines a
marginal part of total budget allocations. Discretionary, incremental funding continues to
dominate (Orr, Jaeger, & Schwarzenberger, 2007).
Summary
Public colleges and universities are responsible, in part, for educating their citizens and
improving the local and state economies. Increased state-funding needs for Medicaid,
elementary and secondary education, and the criminal justice system have put increasing
pressure on state tax revenue (Ehrenberg, 2006; Hovey, 1999; Kane, Orszag, & Gunter, 2003).
With shrinking budgets, competing priorities, public resistance to increasing state taxes, and
prohibitions on deficit spending, state legislators find themselves in the position of debating how
essential each state service is, including postsecondary education. Due to these economic and
political factors, the relationship between states and public higher education is changing across
the country. Several university presidents are calling the decline in state support and the increase

59
in tuition a de facto privatization of the institutions that played a crucial role in the creation of the
American middle class.
Decreases in state appropriations can substantially alter the distribution of resources
across institutions of higher education. In recent years, changing financial and political
conditions have prompted many colleges and universities to revise their internal management
processes. The top priority for college and university administrators should be to ensure that
their instructional programs and their entire institutions are managed in the most efficient and
effective manner possible (Zumeta, 2007). According to Engle (2010), annual budgets are
invaluable because they provide administrators with a tool to allocate resources, communicate
the institution‘s strategy, and monitor the strategy‘s results. Typically, an institution‘s strategic
plan is a three to five year plan for achieving the organization‘s long-term goals and objectives.
The key challenge to academic leadership is to restructure the allocation of academic assets
(Rich, 2006). These factors are restructuring the underlying political environment of higher
education. Because the environment presses for a greater focus on market competitiveness,
university administrators are needed who can keep focused on core academic priorities while still
responding effectively to the new political environment of higher education.
According to Shapiro and Stefkocvich (2005), there are four paradigms of ethical
leadership: the ethic of justice, the ethic of critique, the ethic of care, and the ethic of the
profession. Rather than accepting the ethic of those in power, these scholars challenge the status
quo by seeking an ethic that will deal with inconsistencies, formulate the hard questions, and
debate and challenge the issues. According to Gini (2004), perhaps the best method suited to the
general needs of the ethical enterprise is a modified version of the scientific method. Tax payers
and legislators‘ call for accountability in higher education has become more frequent in the last

60
several decades (Achtemeier & Simpson, 2005). In an effort to become more transparent and
accountable, institutions of higher education must change from a system based on reputation to
one based on performance.
There are several historical budget processes at public institutions: incremental
budgeting, zero based budgeting, line item budgeting, program budgeting, static budgeting,
flexible budgeting, and capital budgeting. Incremental budgeting is used most often in historical
budget processes at public institutions (Massy, 1996b). Zero based budgeting requires the
budget request be justified in complete detail by each division manager starting from the zero
base (Massy, 1996b). Line item budgeting is a budget that lists the individual costs of all
budgeted items such as personnel participating in the project, fringe benefits, travel, equipment,
and supplies. Program budgeting is budgeting for the delivery of a particular program. Static
budgeting is a budget based in a fixed set of assumptions. Capital budgeting is budgeting for
long term assets (e.g., land, buildings, etc.) and has to account for the time value of money.
Under capital budgeting it is difficult to compare total costs to total benefits.
Privatization occurs when state support of public higher education institutions declines
forcing public institutions to seek support from the private sector. Some private sector
supporters are parents, alumni, donors (private and public), cities, and other institutions of higher
education (Lyall & Sell, 2006). According to Tooley and Dixon (2006), there are three types of
privatization: demand-side financing, reforms to the educational supply side, and de facto
privatization. According to Lyall and Sell (2005), the proposed solution is a deliberate effort to
form a new kind of public purpose institution. These new quasi-public institutions would have
better business practices and planning, more collaboration with other institutions, and more
responsibility to broaden their boards to represent a wide range of public interests. The public
61
purpose university would not give up its mission to research but would shift to more applied
research that would better benefit the state.
Needs assessment is a process for determining and addressing needs, or ―gaps‖ between
current conditions and desired conditions, often used for improvement in individuals,
education/training, organizations, or communities. To conduct a quality needs assessment,
according to Kaufman and English (1979), first determine the current results, articulate the
desired results, and the distance between results is the actual need. Once a need is identified,
then a solution can be selected that is targeted to closing the gap. The need can be a desire to
improve current performance or to correct a deficiency. Assessments can be formal (using
survey and interview techniques) or informal (asking questions of those involved). Needs
assessment often involves the use of more than one type of analysis (Barbazette, 2006). The four
steps to conducting a needs assessment are to perform a ―gap‖ analysis, identify priorities and
importance, identify causes of performance problems and/or opportunities, and identify possible
solutions and growth opportunities (Stout, 1995). This study focuses on five needs assessment
measures: One Time Funds, Continuing Funds, Reserve Amount to the Base Amount (as a %),
Summer Budget Distribution, and Summer Budget Distribution per Student.
Productivity is a measure of output from a production process, per unit of input.
Throughout the research productivity literature, scholars have used a wide range of methods for
determining productivity, have most often focused on assessing institutional as opposed to
individual productivity, and have tended to limit the scope of productivity scores to specific time
periods and specific journal publications (Duffy, Martin, Bryan, & Raque-Bogdan, 2008).
Rhoades‘ (2001) aim is to affect institutions of higher educations‘ conceptualization of
productivity in four areas. The first area is who is focused upon in efforts to increase

62
productivity. The second area is which unit of analysis or organizational level is addressed. The
third area is what functions or organizational roles are considered. The fourth area is whose
interests are invoked and served in designing productivity initiatives.
With students, parents, and government seeking proof of a return on their investment and
efficient management of fiscal and human resources, it is essential to have access to appropriate
and useful data when researching the operation of an institution and its faculty. This study
focuses on five productivity measures: Full Time Equivalent Student Units, Number of Degrees
Granted, Student Credit Hours, Full Time Equivalent Faculty Units, and Cost of Instruction.
The field of counseling psychology has an established history of examining research
productivity as a means of engaging in self reflection, quality assessment, correction, and growth
(Kahn, 2005; Spengler, Neville, & Hoffman, 2005). Periodic review of research, recognized as
one of counseling psychology‘s greatest strengths, has allowed the field to assess quality within
and between programs and has offered counseling psychology programs the opportunity to
examine their research agendas (Spengler et al., 2005). Institutional assessments of productivity
within a field are typically computed by assessing the individual productivity of institution
members, most often through journal publications, and adding these together for an overall score.
In contrast to this body of research, relatively fewer studies have addressed productivity at the
individual level.
Any state involvement in the financing of higher education necessitates a method to
channel support to higher education institutions. Budget allocation models are mechanisms for
linking strategic plans with operational plans. In higher education, integrated planning draws
together strategic planning, capital and operating budgeting, enrollment management, and human
resource planning.

63
Many of the challenges with integrated planning involve data definitions and
discrepancies. Integrated planning requires a budget allocation model that responds to changes
in activity levels (for instance enrollments) within colleges, rewards revenue generation and cost
containment, moves accountability and authority to those closest to the programs, supports long
range planning consistent with priorities, and frees institutional leaders to focus on wider issues
associated with resource generation and allocation (Leitzel, Corvey, & Hiley, 2004). According
to Leitzel, Corvey, and Hiley (2004), there are several elements critical to success in strategic
planning and developing a budget allocation model to support that plan. These elements are
leadership, consensus about need for change, process design, patience and flexibility, values and
vision, and communications strategy.

64
CHAPTER III. METHODS
Introduction
Fundamentals to consider in state financing of public higher education are general
factors, operating budget process, and capital budget process. In general, there is no perfect
system or process in state financing of public higher education, and institutional character
dictates the financing or budgeting approach. Institutional character is defined, in part, by its
culture, climate, history, size, and mission. Whether or not the institution has centralized or
decentralized governance and administration, is public or private, and is affiliated or independent
also defines institutional charter.
The processes and decisions of leaders, especially those in public institutions entrusted
with public funds, should be very transparent to their stakeholders. To maintain their credibility,
leaders entrusted with public funds need to ensure their decisions regarding those funds are
ethical and moral. A steward of public funds cannot afford to have his or her credibility
damaged or even appear to be damaged. Efficiency was the key word of the 1980s, quality was
the touchstone of the 1990s, and quality control with accountability has become the leadership
philosophy of the new millennium (Milliken & Colohan, 2004). The leaders, top administrators
at public universities, are stewards of taxpayers‘ dollars. According to Peter Senge et al. (2000),
one of the three primary tasks of leadership includes: leader as steward.
Professors at business schools know how to train people in accounting, finance,
management, and marketing. However, with regard to educating students in ethical and moral

65
decision making, faculty at colleges and universities have failed (Boyer, 1986). This failure is
evident in the frequent media reports concerning corruption in business, government, and
colleges and universities.
Purpose and Design of the Study
To maintain credibility, leaders entrusted with public funds need to make sure their
decisions regarding those funds are ethical and moral. The research investigating the
relationships between needs assessment measures, productivity measures, and ethics in
developing budget allocation models is lacking in academic institutions. The purpose of this
study was to assess the importance of needs assessment measures, productivity measures, and
ethics in developing a budget allocation model for Southern Regional Education Board (SREB)
institutions. This study focused on developing a budget allocation model to assist administrators
in being able to make ethical and moral funding decisions at state colleges and universities. The
items included in the survey for this study were developed using four categories: budget
allocation preference items, needs assessment measures, productivity measures, and
demographic items.
Research Questions
The following research questions guided this study:
1. What is the relationship between needs assessment measures in a budget
allocation model?
2. What is the relationship between productivity measures in a budget allocation
model?
3. What is the difference in the level of agreement between needs assessment
measures and productivity measures in a budget allocation model?

66
Population and Sample
The population was chief financial officers who are responsible for budget allocations at
four-year, public institutions in the Southern Regional Education Board (SREB). The Southern
Regional Education Board was chosen as the population because it is a nonprofit, nonpartisan
organization that works with 16 member states to improve public pre-K–12 and higher
education. Founded by the region‘s governors and legislators in 1948, the SREB was America‘s
first interstate compact for education. Today it is the only regional education compact that works
directly with state leaders, schools, and educators to improve teaching, learning, and student
achievement at every level of education. From Texas to Delaware, these efforts are paying off.
When the SREB began, statewide prekindergarten was nonexistent. Few adults in the region had
college degrees. Today, SREB‘s member states lead the nation in public prekindergarten
enrollment. High school graduation rates have gone up in most SREB states over the last
decade. About one in four adults in the region has a bachelor‘s degree, and the momentum
continues to grow (SREB Fact Book on Higher Education, 2009).
Half of the nation‘s population growth from 2008 to 2018 is expected to be in the 16
SREB states — an increase of 13.1 million. More than ever, education pays. Adults with high
school diplomas or GED credentials in 2007 earned 48 percent more than those with no high
school attendance and 35 percent more than those who attended high school but did not earn
diplomas or GED credentials. In 2008, the cost of one year of attendance at a four-year public
college or university (tuition, required fees, room, and board) was 30 percent of annual income
for middle-income households — 12 percentage points more than in 1988. For students in the
lowest fifth of incomes, one year‘s costs were a staggering 131 percent of income — 56
percentage points greater than in 1988 (SREB Fact Book on Higher Education, 2009). Now

67
more than ever a budget allocation model that addresses needs assessment measures,
productivity measures, and ethics is needed in the SREB states with the expected population
growth, the expected increase in the cost of a four-year public education, and the expected
decrease in funding.
The 16 member states of the Southern Regional Education Board are Alabama, Arkansas,
Delaware, Florida, Georgia, Kentucky, Louisiana, Maryland, Mississippi, North Carolina,
Oklahoma, South Carolina, Tennessee, Texas, Virginia, and West Virginia. An initial request
(email dated March 22, 2010) was sent asking permission from the provosts at the 16 SREB
schools to administer a survey to their deans, directors, and department heads. The email, dated
March 22, 2010, is in Appendix A. From the initial request: three provosts responded yes, five
provosts responded no, and eight provosts did not respond. A follow up request (email dated
April 1, 2010) was sent to the eight provosts that did not respond to the first request stating:
―This is a follow up request to my email sent on March 22, 2010. Your positive consideration
would be greatly appreciated.‖ The follow up email (dated April 1, 2010) is in Appendix B.
From the second request three provosts responded yes, one provost responded no, and four
provosts did not respond. Four participating institutions are needed to validate the study;
permission was received from six. Of these 16 member states, six universities agreed to
participate: University of Virginia, University of Maryland, University of Mississippi, University
of North Carolina, University of Oklahoma, and University of South Carolina.
Instrumentation
Overview
The purpose of the survey was to assess the importance of needs assessment measures
and productivity measures in developing a comprehensive, objective budget allocation model.

68
The comprehensive, objective budget allocation model addressed budget allocation preference
items, needs assessment measures, productivity measures, and demographic items. The
statements and questions on the survey were developed using those four categories: budget
allocation preference items, needs assessment items, productivity items, and demographic items.
Sections two and three on the survey addressed the three research questions. Sections
one and four addressed descriptive statistics and demographic variables respectively.
The first section addressed to what extent chief financial officers disagree or agree with
budget allocation preference items in a budget allocation model. The objective is to identify the
top design based on their responses. Traditional procedures are conservative and inefficient
(Chen, He, Fu, & Lee, 2008). The literature on budgeting within organizations is relatively
limited (Pondy, 1970). ―One of the central issues in budgeting research is the extent to which a
political model accounts for observed outcomes in contrast to a rational or bureaucratic model,
and the conditions under which the political model is more or less likely to hold‖ (Pfeffer &
Moore, 1980, p. 637). Pfeffer and Salancik (1974) argued that organizational budgeting was a
political process.
The second section addressed to what extent chief financial officers disagree or agree
with needs assessment measures in a budget allocation model. Needs assessments can be useful
for obtaining information about current conditions in a defined population, including problems or
service needs and the resources and approaches being used to address them (de Palomo & Luna,
2000). To conduct a quality needs assessment, according to Kaufman and English (1979), first
determine the current results, articulate the desired results, and the distance between results is the
actual need. Once a need is identified, then a solution can be selected that is targeted to closing
the gap.

69
The third section addressed to what extent chief financial officers disagree or agree with
productivity measures in a budget allocation model. With students, parents, and government
seeking proof of a return on their investment and efficient management of fiscal and human
resources, it is essential to have access to appropriate and useful data when researching the
operation of an institution and its faculty. To indicate the importance of productivity measures
Congress required the National Center for Education Statistics (NCES) conduct a study of
expenditures in higher education (Middaugh, Graham, & Shahid, 2003). In addition to the
NCES study, the Delaware Study annually collects detailed information on faculty teaching
loads, instructional costs, and externally funded scholarships, all at the academic discipline level
of analysis.
The fourth section addressed demographic items designed to determine how certain
demographic items affect the budget allocation model. The demographic questions were asked
to determine what variables are important to each group of chief budget officers: provost, chief
financial officer, dean, director, or department head. The demographic items addressed
enrollment, state appropriations, tuition, contracts and grants, and the chief financial officer‘s roll
at their universities.
The budget allocation preference items were developed to discover the chief budget
officers‘ allocation preferences. They were asked to what extent they disagreed or agreed with
each item related to budget allocation preferences. The needs assessment items were developed
to determine how the needs assessment items affect the budget allocation model. The chief
budget officers were asked to what extent they disagreed or agreed each variable to be important.
The productivity items were developed to determine how productivity affects the budget
allocation model. The budget officers were asked to what extent they disagreed or agreed each

70
variable to be important. The demographic questions were asked to determine their effect on
developing a budget allocation model.
Survey Development and Survey Testing
The survey instrument was developed and tested with a test group and further tested by a
four member q-sort panel. The survey development test group is in Appendix C. The four
member q-sort panel is in Appendix D. The test group consisted of the following Auburn
University employees: a Humana-Germany-Sherman Distinguished Professor in the Department
of Educational Foundations, Leadership, and Technology, the Provost and Vice President of
Academic Affairs, the Executive Vice President of Business and Finance, and the Budget
Advisory Committee (BAC). The BAC consists of 26 members and is charged with developing
recommendations for the President of Auburn University regarding the preparation of the annual
budget for the University. The Humana-Germany-Sherman Distinguished Professor in the
Department of Educational Foundations, Leadership, and Technology is an expert in survey
instrument design. The Provost and Vice President of Academic Affairs, the Executive Vice
President of Business and Finance, and the BAC are content experts on budget allocation
decisions. The Provost and Vice President of Academic Affairs and the Executive Vice
President of Business and Finance are the ultimate decision makers for budget allocations at
Auburn University.
Survey development. The survey was developed with input from the test group at
Auburn University. The test group considered 10 statements related to budget allocation
preference items. The 10 preference items were reviewed/rewritten and shortened to five
statements which are included in the survey. These five statements are in section I on the survey.
The test group considered 10 statements related to needs assessment items. The 10 needs

71
assessment items were reviewed/rewritten and shortened to five statements which are included in
the survey. These five statements are in section II on the survey. The test group considered 10
statements related to productivity measure items. The 10 productivity measure items were
reviewed/rewritten and shortened to five statements which are included in the survey. These five
statements are in section III on the survey. The test group considered 10 questions related to
demographics. The ten demographics items were reviewed/rewritten and shortened to five
questions that are included in the survey. These five statements are in section IV on the survey.
Survey testing. A q-sort technique was used as a further test of the 40 original proposed
questions on the survey instrument. When using the technique: ―An individual is given a set of
items or statements, usually on cards, and asked to place them into specified categories so that
each category contains some minimum of cards‖ (Gay, 1980, p. 121).
The four q-sort panel members identified in Appendix D were given an instruction sheet,
a set of three specified categories, and a set of corresponding statements. The instruction sheet is
in Appendix E. The three specified categories and set of corresponding statements are in
Appendix F. The three specified categories were: items related to budget allocation preferences,
items related to need in a budget allocation model, and items related to productivity in a budget
allocation model. The panel members were then asked to place the statements within the
appropriate specified category. Upon completion, they were asked to array the corresponding
statements from highest to lowest. The resulting specified categories and the corresponding
statements were reviewed for agreement. Revisions were made, as required, and the process
repeated until 90% or higher agreement was reached among the panel members.
The final survey design was developed using SurveyMonkey, an online survey
development tool. The final survey the budget officers were asked to complete was made

72
available via a link on the Budget Allocation Model Survey email. The survey instrument is in
Appendix G. Data was collected and stored in SurveyMonkey. According to SurveyMonkey‘s
privacy policy, the data collected was kept private and confidential. The data collected in
SurveyMonkey was copied into SPSS, ―the most powerful and easiest-to-use data analysis
package available (Green & Salkind, 2005).
Validity
Survey instrument validity was a key issue in this study. According to Borg and Gall
(1989), content validity is defined as ―the degree to which the sample of test items represents the
content that the test is designed to measure‖ (p. 250). Validity can be defined as the extent to
which the research instrument measures what it is supposed to measure. The instrument should
appear valid to the respondents and yield information that reflects the attribute, trait, attitude, or
opinion that is being measured. The survey instrument in this study has content validity because
the items on it reflect the content being measured: budget allocation preferences, needs
assessment measures, and productivity measures in a budget allocation model. This instrument
has face validity because all items were reviewed by a test group who are content experts in
budget allocation decisions and q-sort panel members. The test group and panel members
generally felt that the survey measured what it was supposed to measure. The consensus
acceptance of the survey instrument constituted the degree of validity.
Data Collection and Analysis Procedures
Data Collection
Once the Institutional Review Board at Auburn University approved this research
protocol, an email was sent on September 20, 2010 to 673 email addresses of the provosts, chief
financial officers, deans, directors, and department heads at the six participating SREB

73
institutions. The email, dated September 20, 2010 is in Appendix H. A follow-up email
reminder was sent on September 23, 2010. This email, dated September 23, 2010, is in
Appendix I. The email addresses were obtained directly from the institutions‘ web sites. Since
the email addresses were taken directly from the web sites of the participating institutions, the
email addresses were assumed to be valid. The email contained a cover letter and information
letter inviting the recipients to participate in the study by completing a survey. There was a link
in the email on the cover letter directing the participants to the survey.
Thirty-six of the 673 email requests were answered completely. The response rate from
the survey instrument was 5%. Due to this response rate, the results of the analysis are for
descriptive purposes only.
Analysis Procedures
The 15 statements and five questions on the survey instrument were analyzed using
descriptive statistics. The purpose of descriptive statistics is to describe a variable or variables
(Ross & Shannon, 2008). Descriptive statistics is used only to identify studies describing
existing characteristics that are not case studies, developmental studies, or observational studies
(Hsu, 2005). The first section on the survey addressing to what extent chief financial officers
disagree or agree with budget allocation preference items in a budget allocation model was
analyzed using descriptive statistics. The second section on the survey addressing to what extent
chief financial officers disagree or agree with needs assessment measures in a budget allocation
model was analyzed using descriptive statistics. The third section on the survey addressing to
what extent chief financial officers disagree or agree with productivity measures in a budget
allocation model was analyzed using descriptive statistics. The fourth section on the survey

74
addressing demographic items designed to determine how certain demographic items affect the
budget allocation model was analyzed using descriptive statistics.
The first research question was: What is the relationship between needs assessment
measures in a budget allocation model? The second section on the survey addressed this
research question by determining to what extent chief financial officers disagree or agree with
needs assessment measures in a budget allocation model. The answers to these statements were
analyzed using repeated measures with five levels. The five levels were: Funds Requested are
for One Time Funds, Funds Requested are for Continuing Funds, Reserve Amount to the Base
Amount (as a percent), Summer Budget Distribution, and Summer Budget Distribution per
Student. The independent variable was needs assessment measures. The dependent variable was
the level of agreement between the independent variables.
The second research question was: What is the relationship between productivity
measures in a budget allocation model? The third section on the survey addressed this research
question by determining to what extent chief financial officers disagree or agree with
productivity measures in a budget allocation model. The answers to these statements were
analyzed using repeated measures with five levels. The five levels were: Full Time Equivalent
Student Units, Number of Degrees Granted, Student Credit Hours, Full Time Equivalent Faculty
Units, and Cost of Instruction. The independent variable was productivity measures. The
dependent variable was the level of agreement between the independent variables.
The third research question was: What is the difference in the level of agreement between
needs assessment measures and productivity measures in a budget allocation model? This
research question was analyzed using repeated measures with two levels. The two levels were
needs assessment measures and productivity measures. The independent variables were needs

75
assessment measures and productivity measures. The dependent variable was the level of
agreement between the independent variables.
Summary
The survey instrument, validated by a test group and panel members, produced a means
to gather data, which when analyzed, provided insight related to the importance of needs
assessment measures, productivity measures, and ethics in developing a budget allocation model
for Southern Regional Education Board (SREB) institutions. This study focused on developing a
budget allocation model to assist administrators in being able to make ethical and moral funding
decisions at state colleges and universities. Further, differences in demographics rendered
additional clarification of how these demographics affect the development of a budget allocation
model. The results of this study established a basis for expanded application of the survey
instrument and provided a basis for further research and study.

76
CHAPTER IV. FINDINGS
Purpose and Design of the Study
To maintain credibility, leaders entrusted with public funds need to make sure their
decisions regarding those funds are ethical and moral. The research investigating the
relationships between needs assessment measures, productivity measures, and ethics in
developing budget allocation models is lacking in academic institutions. The purpose of this
study was to assess the importance of needs assessment measures, productivity measures, and
ethics in developing a budget allocation model for Southern Regional Education Board (SREB)
institutions. This study focused on developing a budget allocation model to assist administrators
in being able to make ethical and moral funding decisions at state colleges and universities. The
items included in the survey for this study were developed using four categories: budget
allocation preference items, needs assessment measures, productivity measures, and
demographic items.
Research Questions
The following research questions guided this study:
1. What is the relationship between needs assessment measures in a budget
allocation model?
2. What is the relationship between productivity measures in a budget allocation
model?

77
3. What is the difference in the level of agreement between needs assessment
measures and productivity measures in a budget allocation model?
The findings of this study representing the three major study components are reported in
the following sequence:
1. Demographic Characteristics
2. Frequency Distributions of the Data
3. Results:
a. Research Question 1 — Needs Assessment Measures
b. Research Question 2 — Productivity Measures
c. Research Question 3 — Needs Assessment Measures and Productivity
Measures
Demographic Characteristics
The Southern Regional Education Board was chosen as the population because it is a
nonprofit, nonpartisan organization that works with 16 member states to improve public pre-K–
12 and higher education. Founded by the region‘s governors and legislators in 1948, the SREB
was America‘s first interstate compact for education. Today it is the only regional education
compact that works directly with state leaders, schools, and educators to improve teaching,
learning, and student achievement at every level of education. From Texas to Delaware, these
efforts are paying off. When the SREB began, statewide prekindergarten was nonexistent. Few
adults in the region had college degrees. Today, SREB‘s member states lead the nation in public
prekindergarten enrollment. High school graduation rates have gone up in most SREB states
over the last decade. About one in four adults in the region has a bachelor‘s degree, and the
momentum continues to grow (SREB Fact Book on Higher Education, 2009).

78
The population was chief financial officers who are responsible for budget allocations at
four year, public institutions in the Southern Regional Education Board (SREB). For this study,
a chief financial officer is defined as a provost, vice president of business and finance, dean,
director, or department head or chair. The sample was the chief financial officers at the six
SREB institutions that choose to participate in the study. Thirty six of the 673 email requests
were answered, n = 36. The response rate from the survey instrument was 5%. Due to this
response rate, the results of the analysis are for descriptive purposes only.
The fourth section on the survey posed questions to the survey participants asking for
some demographic information. The demographic information questions were: what is the
enrollment in your academic unit, what percent of your academic unit‘s budget is from state
appropriations, what percent of your academic unit‘s budget is from tuition, what percent of your
academic unit‘s budget is from contracts/grants, and what is your role at your university. These
items were analyzed using descriptive statistics. The frequency distribution of this data is shown
in Table 1.

79
Table 1
Frequency Distribution of Demographic Questions
Less than
500
500–999 1,000–1,499 1,500–
1,999
2,000 or
More
Missing
Data
What is the enrollment in
your academic unit?
12
(33.3%)
5
(13.9%)
2
(5.6%)
2
(5.6%)
11
(30.6%)
4
(11.1%)
Less than
25%
25%–49% 50%–74% 75% or
More
Missing
Data
What percent of your academic
unit‘s budget is from state
appropriations?
24
(66.7%)
5
(13.9%)
1
(2.8%)
2
(5.6%)
4
(11.1%)
What percent of your academic
unit‘s budget is from tuition?
10
(27.8%)
12
(33.3%)
4
(11.1%)
6
(16.7%)
4
(11.1%)
What percent of your academic
unit‘s budget is from
contracts/grants?
16
(44.4%)
7
(19.4%)
4
(11.1%)
5
(13.9%)
4
(11.1%)
Chief Financial
Officer
Provost Dean Department
Head/Chair
Director Missing
Data
What is your role at
your university?
0
(0%)
1
(2.8%)
4
(11.1%)
19
(52.8%)
8
(22.2%)
4
(11.1%)
Frequency Distributions of the Data
The first section on the survey addressed to what extent chief financial officers disagreed
or agreed with items related to budget allocation preferences in a budget allocation model. The
budget allocation preference items were: ethics, needs assessment, productivity, objectivity, and
subjectivity. These items were analyzed using descriptive statistics. The frequency distribution
of this data is shown in Table 2.
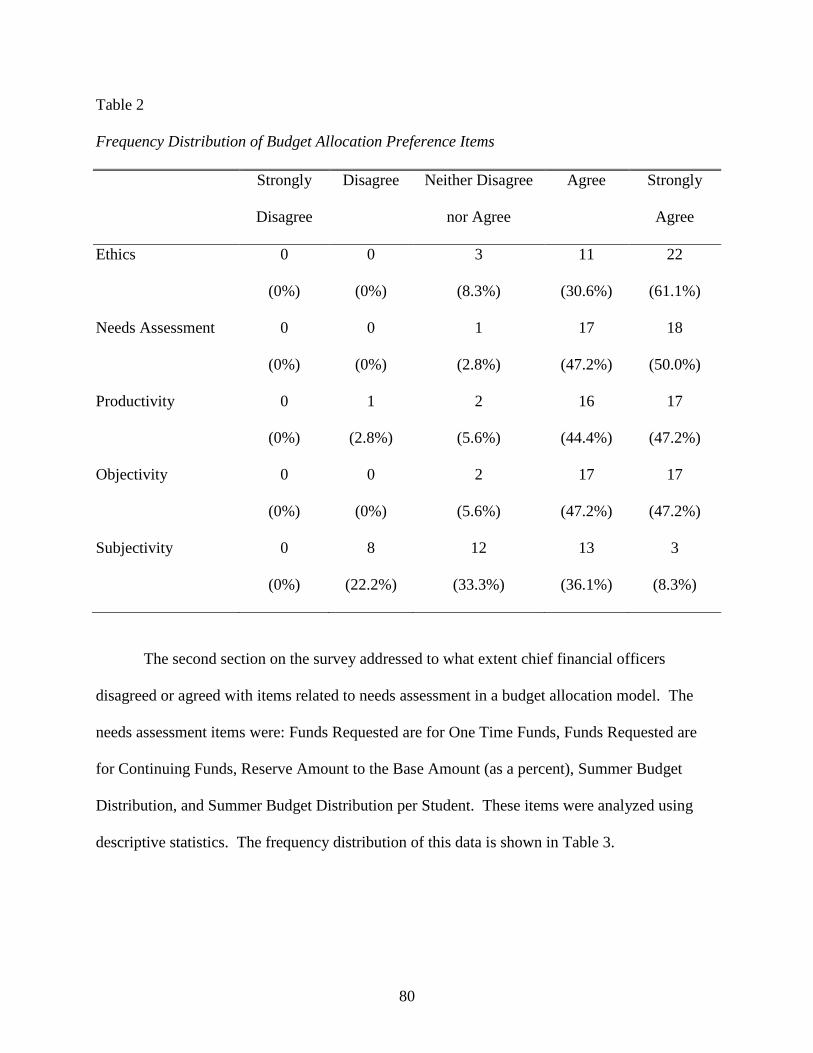
80
Table 2
Frequency Distribution of Budget Allocation Preference Items
Strongly
Disagree
Disagree Neither Disagree
nor Agree
Agree Strongly
Agree
Ethics 0
(0%)
0
(0%)
3
(8.3%)
11
(30.6%)
22
(61.1%)
Needs Assessment 0
(0%)
0
(0%)
1
(2.8%)
17
(47.2%)
18
(50.0%)
Productivity 0
(0%)
1
(2.8%)
2
(5.6%)
16
(44.4%)
17
(47.2%)
Objectivity 0
(0%)
0
(0%)
2
(5.6%)
17
(47.2%)
17
(47.2%)
Subjectivity 0
(0%)
8
(22.2%)
12
(33.3%)
13
(36.1%)
3
(8.3%)
The second section on the survey addressed to what extent chief financial officers
disagreed or agreed with items related to needs assessment in a budget allocation model. The
needs assessment items were: Funds Requested are for One Time Funds, Funds Requested are
for Continuing Funds, Reserve Amount to the Base Amount (as a percent), Summer Budget
Distribution, and Summer Budget Distribution per Student. These items were analyzed using
descriptive statistics. The frequency distribution of this data is shown in Table 3.

81
Table 3
Frequency Distribution of Need Assessment Items
Strongly
Disagree
Disagree Neither Disagree
nor Agree
Agree Strongly
Agree
Funds Requested are for One
Time Funds
1
(2.8%)
2
(5.6%)
12
(33.3%)
14
(38.9%)
7
(19.4%)
Funds Requested are for
Continuing Funds
0
(0%)
1
(2.8%)
8
(22.2%)
12
(33.3%)
15
(41.7%)
Reserve Amount to the Base
Amount (as a percent)
0
(0%)
4
(11.1%)
9
(25.0%)
15
(41.7%)
8
(22.2%)
Summer Budget Distribution 1
(2.8%)
1
(2.8%)
16
(44.4%)
11
(30.6%)
7
(19.4%)
Summer Budget Distribution
per Student
1
(2.8%)
5
(13.9%)
20
(55.6%)
7
(19.4%)
3
(8.3%)
The third section on the survey addressed to what extent chief financial officers disagreed
or agreed with items related to productivity in a budget allocation model. The productivity items
were: Full Time Equivalent Student Units, Number of Degrees Granted, Student Credit Hours,
Full Time Equivalent Faculty Units, and Cost of Instruction. These items were analyzed using
descriptive statistics. The frequency distribution of this data is shown in Table 4.

82
Table 4
Frequency Distribution of Productivity Items
Strongly
Disagree
Disagree Neither Disagree
nor Agree
Agree Strongly
Agree
Full Time Equivalent
Student Units
0
(0%)
1
(2.8%)
5
(13.9%)
15
(41.7%)
14
(38.9%)
Number of Degrees
Granted
0
(0%)
3
(8.3%)
6
(16.7%)
16
(44.4%)
10
(27.8%)
Student Credit Hours 0
(0%)
1
(2.8%)
4
(11.1%)
15
(41.7%)
15
(41.7%)
Full Time Equivalent
Faculty Units
0
(0%)
1
(2.8%)
5
(13.9%)
13
(36.1%)
16
(44.4%)
Cost of Instruction 0
(0%)
1
(2.8%)
2
(5.6%)
21
(58.3%)
11
(30.6%)
Results
Research Question 1 — Needs Assessment Measures
Question 1: What is the relationship between needs assessment measures in a budget
allocation model? The results for research question 1 are presented in this section. The means
and standard deviations for needs assessment measures are displayed in Table 5.

83
Table 5
Means and Standard Deviations for Need Assessment Measures
Means Standard Deviations
Funds Requested are for One Time Funds 3.67 .956
Funds Requested are for Continuing Funds 4.14 .867
Reserve Amount to the Base Amount (as a percent) 3.75 .937
Summer Budget Distribution 3.61 .934
Summer Budget Distribution per Student 3.17 .878
Data were analyzed using one-way, repeated measures analysis of variance (ANOVA)
and eta-squared effect size. Mauchly‘s test of sphericity was significant (Mauchly‘s W = 0.471,
df = 9, p < 0.01) thus the more conservative Greenhouse-Geisser test was used for the analyses.
The repeated measure results yielded a statistical significance (F(2.897, 101.384) = 6.049, p =
.001), indicating that the agreement level toward the needs assessment measures in a budget
allocation model were different. This effect size is large (partial eta-squared = 0.147).
Post-hoc comparisons were conducted as needed in the form of pair-wise contrasts
between the degree to which chief financial officers disagreed or agreed with items related to
needs assessment items in a budget allocation model. The Summer Budget Distribution is not as
important as all the other needs assessment items (p = .006). Funds Requested are for
Continuing Funds is more important than Funds Requested are for One Time Funds and Summer
Budget Distribution (p = .005). The pairwise comparisons are presented in Table 6 and Figure 1.

84
Table 6
Pairwise Comparisons of Needs Assessment Measures
Mean
Difference
p-value
Funds Requested are for
One Time Funds
Funds Requested are for Continuing Funds
Reserve Amount to the Base Amount
(Percent)
Summer Budget Distribution
Summer Budget Distribution per Student
-.472
-.083
.056
.500
.005**
.731
.797
.045*
Funds Requested are for
Continuing Funds
Reserve Amount to the Base Amount
(Percent)
Summer Budget Distribution
Summer Budget Distribution per Student
.389
.528
.972
.104
.004**
.000***
Reserve Amount to the
Base Amount (Percent)
Summer Budget Distribution
Summer Budget Distribution per Student
.139
.583
.483
.002**
Summer Budget
Distribution
Summer Budget Distribution per Student .444 .006**
p < 0.05*
p < 0.01**
p < 0.001***

85
Needs Assessment Item 1 – Funds Requested are for One Time Funds
Needs Assessment Item 2 – Funds Requested are for Continuing Funds
Needs Assessment Item 3 – Reserve Amount to the Base Amount (as a percent)
Needs Assessment Item 4 – Summer Budget Distribution
Needs Assessment Item 5 – Summer Budget Distribution per Student
Figure 1. Estimated Marginal Means for the Five Needs Assessment Items
Research Question 2 — Productivity Measures
Question 2: What is the relationship between productivity measures in a budget allocation
model? The results for research question 2 are presented in this section. The means and
standard deviations for needs assessment measures are displayed in Table 7.

86
Table 7
Means and Standard Deviations for Productivity Measures
Means Standard Deviations
Full Time Equivalent Student Units 4.20 .797
Number of Degrees Granted 3.94 .906
Student Credit Hours 4.26 .780
Full Time Equivalent Faculty Units 4.26 .817
Cost of Instruction 4.20 .677
Data were analyzed using one-way, repeated measures analysis of variance (ANOVA)
and eta-squared effect size. Mauchly‘s test of sphericity was significant (Mauchly‘s W = 0.269,
df = 9, p < 0.01) thus the more conservative Greenhouse-Geisser test was used for the analyses.
The repeated measure results yielded a statistical significance (F(2.502, 85.067) = 1.714, p =
.001), indicating that the agreement level toward the productivity measures in a budget allocation
model were different. This effect size is medium (partial eta-squared = 0.048).
Post-hoc comparisons were conducted as needed in the form of pair-wise contrasts
between the degree to which chief financial officers disagreed or agreed with items related to
productivity items in a budget allocation model. The results indicated that Number of Degrees
Granted is not as important as Full Time Equivalent Student Units (p = 0.048), or Student Credit
Hours (p = 0.014). The pairwise comparisons are presented in Table 8 and Figure 2.

87
Table 8
Pairwise Comparisons of Productivity Measures
Mean
Difference
p-value
Full Time Equivalent student units Number of Degrees Granted
Student Credit Hours
Full Time Equivalent Faculty units
Cost of Instruction
.257
-.057
-.057
.000
.048*
.422
.757
1.000
Number of Degrees Granted Student Credit Hours
Full Time Equivalent Faculty units
Cost of Instruction
-.314
-.314
-.257
.014*
.086
.059
Student Credit Hours Full Time Equivalent Faculty units
Cost of Instruction
.000
.057
1.000
.661
Full Time Equivalent faculty units Cost of Instruction .057 .644
p < 0.05*
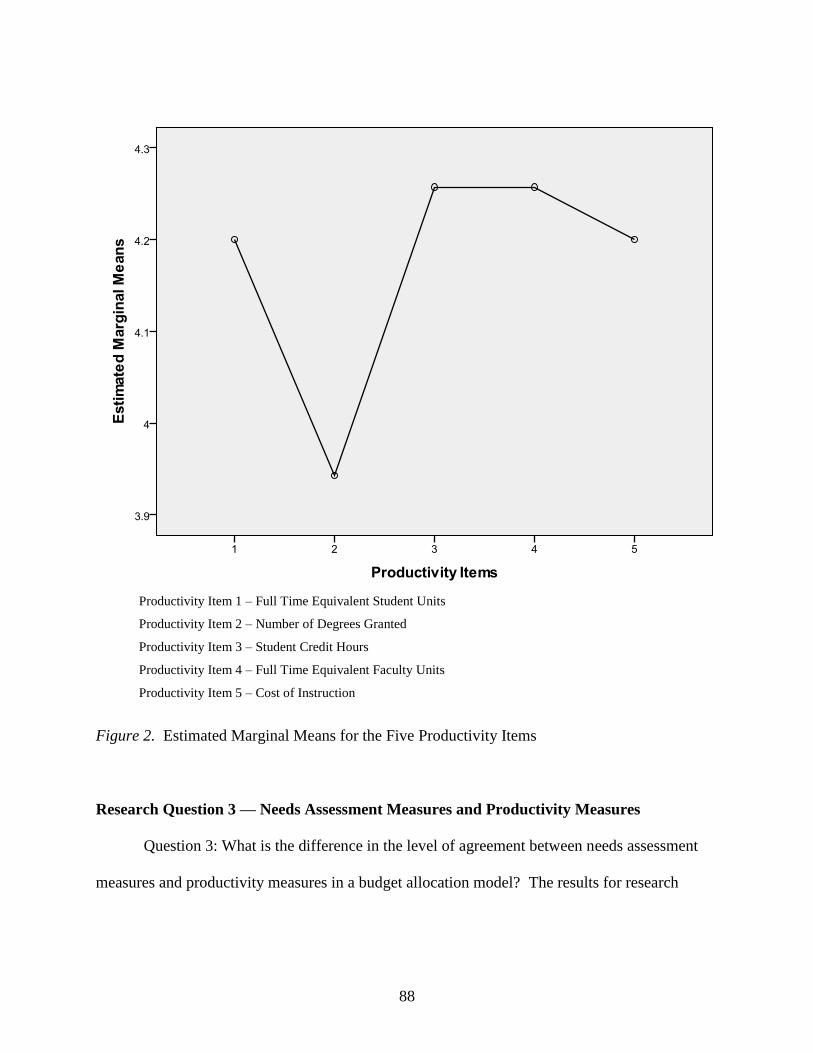
88
Productivity Item 1 – Full Time Equivalent Student Units
Productivity Item 2 – Number of Degrees Granted
Productivity Item 3 – Student Credit Hours
Productivity Item 4 – Full Time Equivalent Faculty Units
Productivity Item 5 – Cost of Instruction
Figure 2. Estimated Marginal Means for the Five Productivity Items
Research Question 3 — Needs Assessment Measures and Productivity Measures
Question 3: What is the difference in the level of agreement between needs assessment
measures and productivity measures in a budget allocation model? The results for research

89
question 3 are presented in this section. The means and standard deviations for needs assessment
measures and productivity measures are displayed in Table 9.
Table 9
Means and Standard Deviations for Needs Assessment Measures and Productivity Measures
Means Standard Deviations
Needs assessment measures 18.2857 2.58470
Productivity measures 20.8571 2.99158
Data were analyzed using one-way, repeated measures analysis of variance (ANOVA)
and eta-squared effect size. The repeated measure results yielded a statistical significance (F(1,
34) = 115.174, p < 0.001), indicating that the agreement level toward the needs assessment
measures and productivity measures in a budget allocation model were different. This effect size
is large (partial eta-squared = 0.309). The estimated marginal means for needs assessment
measures and productivity measures are presented in Figure 3.

90
Item 1 – Needs Assessment Measures
Item 2 – Productivity Measures
Figure 3. Estimated Marginal Means for Needs Assessment Measures and Productivity Measures
Summary
This study was specifically designed to find the difference in the level of agreement in
needs assessment measures, productivity measures, and between needs assessment measures and
productivity measures in a budget allocation model. The repeated measure results yielded a
statistical significance, indicating that the agreement level toward the needs assessment measures
in a budget allocation model were different. This effect size is large. The Summer Budget

91
Distribution is not as important as all the other needs assessment items. Funds Requested are for
Continuing Funds is more important than Funds Requested are for One Time Funds and Summer
Budget Distribution.
The repeated measure results yielded a statistical significance, indicating that the
agreement level toward the productivity measures in a budget allocation model were different.
This effect size is medium. The results indicated that Number of Degrees Granted is not as
important as Full Time Equivalent Student Units or Student Credit Hours.
The repeated measure results yielded a statistical significance, indicating that the
agreement level toward the needs assessment measures and productivity measures in a budget
allocation model were different. This effect size is large. No other main effects or interaction
effects were found.

92
CHAPTER V. SUMMARY, CONCLUSIONS, IMPLICATIONS, AND
RECOMMENDATIONS
Purpose and Design of the Study
To maintain credibility, leaders entrusted with public funds need to make sure their
decisions regarding those funds are ethical and moral. The research investigating the
relationships between needs assessment measures, productivity measures, and ethics in
developing budget allocation models is lacking in academic institutions. The purpose of this
study was to assess the importance of needs assessment measures, productivity measures, and
ethics in developing a budget allocation model for Southern Regional Education Board (SREB)
institutions. This study focused on developing a budget allocation model to assist administrators
in being able to make ethical and moral funding decisions at state colleges and universities. The
items included in the survey for this study were developed using four categories: budget
allocation preference items, needs assessment measures, productivity measures, and
demographic items. This chapter includes a summary, conclusions, implications, and
recommendations.
Research Questions
The following research questions guided this study:
1. What is the relationship between needs assessment measures in a budget
allocation model?

93
2. What is the relationship between productivity measures in a budget allocation
model?
3. What is the difference in the level of agreement between needs assessment
measures and productivity measures in a budget allocation model?
Summary
This study was specifically designed to find the difference in the level of agreement in
needs assessment measures, productivity measures, and between needs assessment measures and
productivity measures in a budget allocation model. The first major component of this study was
to find the difference in the level of agreement in needs assessment measures in a budget
allocation model. The repeated measure results yielded a statistical significance, indicating that
the agreement level toward the needs assessment measures in a budget allocation model were
different. This effect size is large. The Summer Budget Distribution is not as important as all
the other needs assessment items. Funds Requested are for Continuing Funds is more important
than Funds Requested are for One Time Funds and Summer Budget Distribution.
The second major component of this study was to find the difference in the level of
agreement in productivity measures in a budget allocation model. The repeated measure results
yielded a statistical significance, indicating that the agreement level toward the productivity
measures in a budget allocation model were different. This effect size is medium. The results
indicated that Number of Degrees Granted is not as important as Full Time Equivalent Student
Units or Student Credit Hours.
The third major component of this study was to find the difference between needs
assessment measures and productivity measures in a budget allocation model. The repeated
measure results yielded a statistical significance, indicating that the agreement level toward the

94
needs assessment measures and productivity measures in a budget allocation model were
different. This effect size is large. The results indicated that needs assessment measures are not
as important as productivity measures. No other main effects or interaction effects were found.
Conclusions
In general, there is no perfect system or process in state financing of public higher
education and institutional character dictates the financing or budgeting approach. Institutional
character is defined, in part, by its culture, climate, history, size, and mission. Whether or not the
institution has centralized or decentralized governance and administration, is public or private,
and is affiliated or independent also defines institutional character.
The process of decision making a leader chooses, especially those in public institutions
entrusted with public funds, should be very transparent to their stakeholders. Leaders entrusted
with public funds need to ensure their decisions regarding those funds are ethical and moral. A
steward of public funds cannot afford to have his or her credibility damaged or even appear to be
damaged. Accountability has become the leadership philosophy of the new millennium. The
leaders, top administrators at public universities, are stewards of taxpayers‘ dollars. A
comprehensive, objective budget allocation model addressing needs assessment measures,
productivity measures, and ethics may be a method by which to ethically and morally allocate
public resources in a public institution.
The first major component of this study was to find the difference in the level of
agreement in needs assessment measures in a budget allocation model. The repeated measure
results yielded that the agreement level toward the needs assessment measures in a budget
allocation model were different. Adding the percents for Agree and Strongly Agree for each
needs assessment measure from frequency distribution Table 3 resulted in ranking the five needs

95
assessment measures in the following order (five being the most important and one being the
least important): 5 = Funds Requested are for Continuing Funds (75%), 4 = Reserve Amount to
the Base Amount (as a percent) (63.9%), 3 = Funds Requested are for One Time Funds (58.3%),
2 = Summer Budget Distribution (50%), and 1 = Summer Budget Distribution per Student
(27.7%). An example of a budget allocation model containing needs assessment measures
shown with the rankings from this study is in Table 10.

Table 10
Budget Allocation Model with Needs Assessment Measures
Academic Unit
(3rd Priority)
One Time Amount
Requested
(1st Priority)
Continuing
Amount Requested
Current Year
Base Budget
Current Year #
of U & G
Students
Budget/
Students
Low to High
Budget/
Student Rank
AG 8,944,686 1,103 8,109 10
BUS 500,000 750,000 14,162,862 4,081 3,470 2
CADC 6,067,512 1,382 4,390 4
COSAM 1,000,000 2,000,000 22,089,652 2,772 7,969 9
ED 750,000 1,500,000 10,422,012 2,354 4,427 5
ENG 25,534,623 3,466 7,367 7
FOR 100,000 500,000 2,846,312 373 7,631 8
HUMSCI 750,000 500,000 4,930,309 1,197 4,119 3
LA 27,676,283 4,961 5,579 6
NURS 232,307 1,433,981 1,448,320 540 2,682 1
PHARM 5,216,518 518 10,070 11
VETMED 18,586,121 427 43,527 12
3,332,307 6,683,981
96

Table 10 (continued)
Academic Unit
Unrestricted Prior
Year Reserves
Unrestricted Current
Year Reserves
Current Year
Reserves/Base Budget
(3rd Priority)
Current Year Reserves/
Students
Low to High Reserves/
Student Rank
AG 3,268,466 3,830,692 0.43 3,473 9
BUS 2,821,601 2,766,910 0.20 678 2
CADC 1,252,145 955,677 0.16 692 3
COSAM 5,113,084 4,160,053 0.19 1,501 8
ED 2,286,798 2,555,550 0.25 1,086 5
ENG 4,060,762 4,623,095 0.18 1,334 6
FOR 1,905,229 1,875,446 0.66 5,028 10
HUMSCI 1,417,056 1,275,990 0.26 1,066 4
LA 3,465,159 3,234,579 0.12 652 1
NURS 766,236 731,178 0.50 1,354 7
PHARM 3,384,852 5,424,209 1.04 10,471 12
VETMED 1,081,782 3,090,366 0.17 7,237 11
93
97

Table 10 (continued)
Academic Unit
(4th Priority)
Summer Budget
Distribution
(5th Priority)
Summer Budget
Distribution
Per Student
Low to High
Summer $/
Student Rank
Composite Rank
of 3 Scores
Overall Need
Ranking
One Time Funded
Requests
Continuing
Funded Requests
AG 401,237 364 5 8 7
BUS 722,065 177 2 2 1 158,681 85,794
CADC 576,342 417 9 5 4
COSAM 1,144,179 413 8 8 7 1,110,769 600,560
ED 830,956 353 4 5 4 634,725 343,177
ENG 1,412,301 407 7 7 6
FOR 0 0 6 5 793,406 428,972
HUMSCI 351,020 293 3 3 2 317,363 171,589
LA 1,874,559 378 6 4 3
NURS 24,621 46 1 3 2 317,363 171,589
PHARM 270,858 523 10 11 8
VETMED 0 0 8 7
21* 3,332,307 1,801,681
* Overall Need Ranking of those academic units requesting funds
Budget Requests: Dollars Available in the Provost Office to Fund Requests:
One Time $ 3,332,307 One Time – Budget Reserve $ 4,883,919
Continuing – Permanent 6,683,981 Continuing – Permanent 1,801,681
$ 10,016,288 $ 6,685,600
94
98

99
The second major component of this study was to find the difference in the level of
agreement in productivity measures in a budget allocation model. The repeated measure results
yielded that the agreement level toward the productivity measures in a budget allocation model
were different. Adding the percents for Agree and Strongly Agree for each productivity measure
from frequency distribution Table 4 resulted in ranking the five productivity measures in the
following order (five being the most important and one being the least important): 5 = Cost of
Instruction (88.9%), 4 = Student Credit Hours (83.4%), 3 = Full Time Equivalent Student Units
(80.6%), 2 = Full Time Equivalent Faculty Units (80.5%), and 1 = Number of Degrees Granted
(72.2%). Four of the five productivity measures from this study are shown in Table 11 and
Table 12. Tables 11 and 12 compare productivity measures from XYZ University with national
norms from a Delaware National Study. This comparison, along with the rankings above, can be
combined to produce a budget allocation model.

Table 11
Budget Allocation Model with Productivity Measures—Instructional Unit Costs, Research and Public Service Expenditures, 2007–08
Discipline
XYZ
Code(s) CIP Direct Instructional Expenditures
Per SCH ($)
Per FTE Student ($)
XYZ Norm XYZ/Norm XYZ Norm XYZ/Norm
College of Education
Educational Administration and
Supervision
EFLT 13.04 $ 260 $ 409 64% $ 5,769 $ 7,687 75%
Special Education and Teaching RSED 13.10 $ 545 $ 335 163% $ 12,143 $ 7,999 152%
Student Counseling and Personnel
Services
COUN 13.11 $ 235 $ 349 67% $ 5,231 $ 7,372 71%
Teacher Education and Professional
Development, Specific Level
CTCH 13.12 $ 258 $ 324 80% $ 6,535 $ 8,266 79%
Teacher Education and Professional
Development, Specific Subject
KINE 13.13 $ 92 $ 235 39% $ 2,628 $ 6,128 43%
100
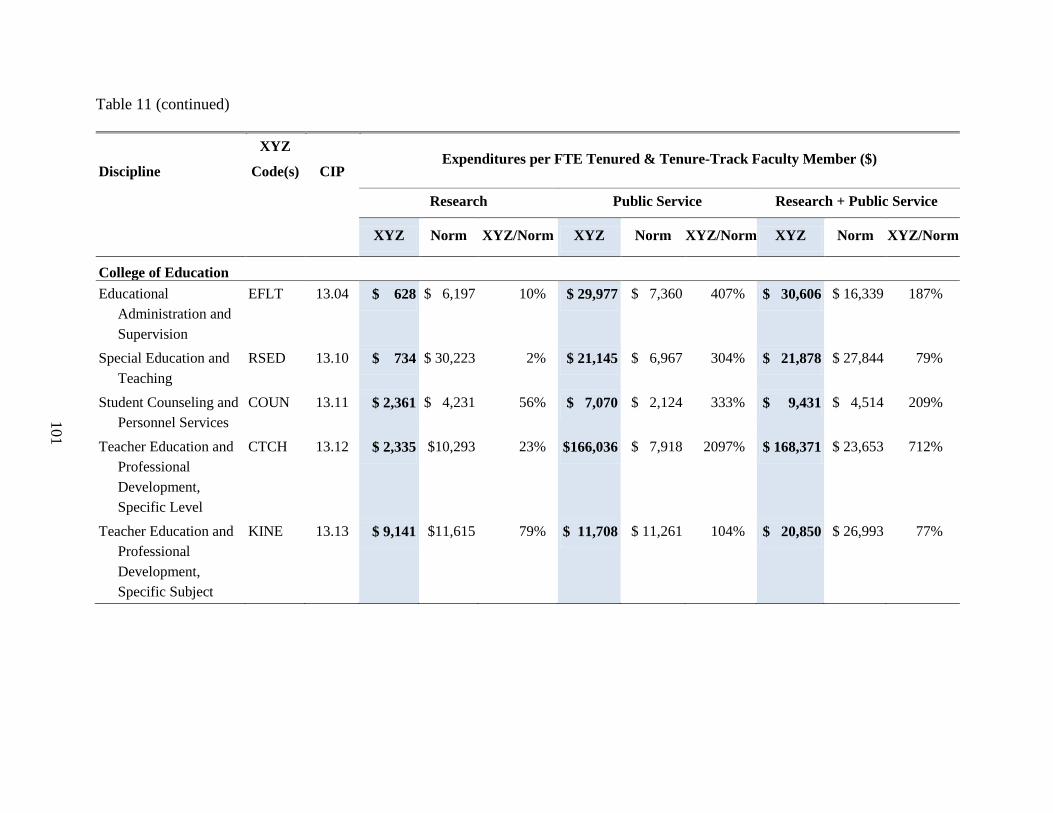
Table 11 (continued)
Discipline
XYZ
Code(s) CIP Expenditures per FTE Tenured & Tenure-Track Faculty Member ($)
Research Public Service Research + Public Service
XYZ Norm XYZ/Norm XYZ Norm XYZ/Norm XYZ Norm XYZ/Norm
College of Education
Educational
Administration and
Supervision
EFLT 13.04 $ 628 $ 6,197 10% $ 29,977 $ 7,360 407% $ 30,606 $ 16,339 187%
Special Education and
Teaching
RSED 13.10 $ 734 $ 30,223 2% $ 21,145 $ 6,967 304% $ 21,878 $ 27,844 79%
Student Counseling and
Personnel Services
COUN 13.11 $ 2,361 $ 4,231 56% $ 7,070 $ 2,124 333% $ 9,431 $ 4,514 209%
Teacher Education and
Professional
Development,
Specific Level
CTCH 13.12 $ 2,335 $10,293 23% $166,036 $ 7,918 2097% $ 168,371 $ 23,653 712%
Teacher Education and
Professional
Development,
Specific Subject
KINE 13.13 $ 9,141 $11,615 79% $ 11,708 $ 11,261 104% $ 20,850 $ 26,993 77%
101

Table 12
Budget Allocation Model with Productivity Measures—Credit Hours, Course Sections, and FTE Students Taught by All Faculty
Types, Fall 2007
Unit Identification
Student Credit-Hours and
Organized Course Sections (excluding labs)
per FTE Faculty Member (all types of faculty included)
UNDERGRADUATE GRADUATE
Discipline
XYZ
Code(s) CIP
Credit Hrs/
FTE Faculty
Course Sections/
FTE Faculty
Credit Hrs/
FTE Faculty
Course Sections/
FTE Faculty
XYZ Norm XYZ Norm XYZ Norm XYZ Norm
College of Education
Educational
Administration and
Supervision
EFLT 13.04 63 32 0.9 0.4 46 91 1.0 1.8
Special Education and
Teaching
RSED 13.10 69 91 1.0 1.0 51 51 1.0 1.2
Student Counseling and
Personnel Services
COUN 13.11 73 67 1.4 1.0 37 74 1.1 1.7
Teacher Education and
Professional
Development,
Specific Level
CTCH 13.12 96 120 1.3 1.6 19 30 0.6 0.8
Teacher Education and
Professional
Development,
Specific Subject
KINE 13.13 215 161 3.2 2.4 15 28 0.4 0.6
102

Table 12 (continued)
Unit Identification
Student Credit-Hours and Organized Course Sections (excluding labs)
per FTE Faculty Member (all types of faculty included)
TOTAL
Discipline XYZ
Code(s)
CIP Credit Hrs/FTE Faculty Course Sections/FTE Faculty FTE Students per FTE Faculty
(excluding labs) (including labs)
XYZ Norm XYZ Norm XYZ Norm XYZ Norm XYZ/Norm
College of Education
Educational
Administration
and Supervision
EFLT 13.04 108 120 1.9 2.2 1.9 2.2 9.2 12.2 75%
Special Education and
Teaching
RSED 13.10 120 137 2.0 2.3 2.0 2.4 10.3 11.7 88%
Student Counseling
and Personnel
Services
COUN 13.11 109 131 2.5 2.9 2.5 3.0 8.9 12.0 74%
Teacher Education
and Professional
Development,
Specific Level
CTCH 13.12 115 154 1.9 2.3 1.9 2.5 8.5 11.7 73%
Teacher Education
and Professional
Development,
Specific Subject
KINE 13.13 230 192 3.6 3.3 3.6 3.8 16.0 14.2 113%
103

104
The third major component of this study was to find the difference between needs
assessment measures and productivity measures in a budget allocation model. The repeated
measure results yielded that the agreement level toward the needs assessment measures and
productivity measures in a budget allocation model were different. The results indicated that
needs assessment measures are not as important as productivity measures.
Implications
The major implications from this study were that there are differences in the level of
agreement in needs assessment measures, productivity measures, and between needs assessment
measures and productivity measures. Under needs assessment measures, Summer Budget
Distribution is not as important as all the other needs assessment items. Funds Requested are for
Continuing Funds is more important than Funds Requested are for One Time Funds and Summer
Budget Distribution. Under productivity measures, Number of Degrees Granted is not as
important as Full Time Equivalent Student Units or Student Credit Hours. Between needs
assessment measures and productivity measures, needs assessment measures are not as important
as productivity measures.
This study assessed the differences among five needs assessment measures and five
productivity measures. There are other needs assessment measures that could be evaluated based
on an institution‘s character, politics, and priorities. Some examples of other needs assessment
measures are Number of Students, Budget per Student, Reserve Amount per Student, and Prior
Two Year Budget Allocations. There are other productivity measures that could be evaluated
based on an institution‘s character, politics, and priorities. Some examples of other productivity
measures are Declared Majors, Fiscal Data, Research and Service Expenditures, and Revenue
Measures.

105
The first section on the survey in this study began by asking the chief financial officers
how important they believed budget allocation preference items to be. The survey is shown in
Appendix G. The budget allocation preference items were: ethics is important in budget
allocation decisions, needs assessment is important in budget allocation decisions, productivity is
important in budget allocation decisions, objectivity is important in budget allocation decisions,
and subjectivity is important in budget allocation decisions. The responses from this section are
shown in Table 2, Frequency Distribution Table of Budget Allocation Preference Items. A topic
of additional research in developing budget allocation models may be to determine how the
different attitudes toward these budget allocation preference items relate to the answers on the
rest of the survey instrument.
The last section on the survey in this study asked the chief financial officers for
demographic information. The survey is shown in Appendix G. The demographic information
requested was ―What is the enrollment in your academic unit?‖, ―What percent of your academic
unit‘s budget is from state appropriations?‖, ―What percent of your academic unit‘s budget is
from contracts/grants?‖, and ―What‘s your role at your institution?‖ A topic of additional
research in developing budget allocation models may be to determine how the different answers
to these demographic questions relate to the answers on the rest of the survey instrument.
Recommendations
Currently, state legislatures seem unwilling to address the basic structural budget
problems faced by state public higher education. Increasing demand will pressure public
colleges and universities to expand enrollment over the next five years without adequate funding
to meet the needs of the additional students. Without a new model of public-purpose institution
some public universities will decline in quality, smaller ones will eventually close, and the nation

106
will drop farther down the list of countries with college-educated populations. Flagship
institutions will rebalance their roles between research and instruction to focus on those portions
of their mission that can be self-sustaining. Two- and four-year comprehensive state universities
that have fewer, less affluent alumni will experience intensified enrollment pressures and quality
erosion. This survival of the fittest approach may save the institutions best adapted to the
market, but it will weaken the affordable, high-quality post secondary institutions and reduce the
number of Americans with college opportunities (Lyall & Sell, 2006).
What is urgently needed, according to Lyall and Sell (2006), is a bi-partisan public policy
dialogue about what states and their colleges and universities want from each other. States need
to understand what benefits public dollars are buying and what benefits are foregone when such
funding is reduced. Institutions need to collaborate to share responsibility for sustaining the
most important purposes of public higher education. This discussion must start assuming that
states will not restore funds lost to higher education over the past decade or pretending that
universities can make up these amounts from tuition increases alone. One question that must be
asked is: What is a sustainable level of public support? Another question is: What is a
reasonable sharing of costs by students? Public colleges and universities must realize they
cannot expand access without the resources to serve students effectively. Learning outcomes and
student success matter as much as access (Lyall & Sell, 2006).
Basic elements of any new policy must include the agreed upon public purposes for
higher education, a strategy for a sustainable level of public support per student, an alignment of
tuition with financial aid policy, the necessary management flexibilities to compete in the
market, accountability measures for both the state and the institution, and agreement on how
productivity savings are to be shared. This is an opportunity to move beyond partisan politics,

107
outdated instructional methods, and finger pointing to employ the best talents in public
universities and public servants to redesign higher education for the future. The future of our
country depends on this being done well (Lyall & Sell, 2006).

108
REFERENCES
Achtemeier, S. D., & Simpson, R. D. (2005, August). Practical considerations when using
benchmarking for accountability in higher education. Innovative Higher Education,
30(2), 117–128. doi:10.1007/s10755-005-5014-3.
Aelterman, G. (2006, November). Sets of standards for external quality assurance agencies: A
comparison. Quality in Higher Education, 12(3), 227–233.
doi:10.1080/13538320601050996.
Archibald, R. B., & Feldman, D. H. (2006, July/August). State higher education spending and
the tax revolt. The Journal of Higher Education, 77(4), 618–644. Retrieved July 13,
2009, from Academic Search Premier database.
Banta, T. W., Busby, A. K., Kahn, S., Black, K. E., & Johnson, J. N. (2007, April). Responding
to a fiscal crisis: A data-driven approach. Assessment & Evaluation in Higher Education,
32(2), 183–194. doi:10.1080/02602930600801944.
Barbazette, J. (2006). Training needs assessment: Methods, tools, and techniques. San Francisco,
CA: Pfeiffer.
Beck, L. G. (1994). Reclaiming educational administration as a caring profession. New York:
Teachers College Press.
Borg, W., & Gall, M. (1989). Educational research: An introduction. New York: Longman.
Boyer, E. L. (1986). College: The undergraduate experience in America. The Carnegie
Foundation for the Advancement of Teaching.

109
Burke, J. C. (2005). The many faces of accountability. In J. C. Burke (Ed.), Achieving
accountability in higher education: Balancing public, academic, and market demands
(pp. 1–24). San Francisco: Jossey-Bass.
Carey, K. (2007). Truth without action, The myth of higher-education accountability. Change,
39(5), 24–29. Retrieved July 21, 2009 from Academic Search Premier database.
Chen, C-H., He, D., Fu, M., & Lee, L. H. (2008). Efficient simulation budget allocation for
selecting an optimal subset. INFORMS Journal on Computing, 20(4), 579–595.
Cheslock, J. J., & Gianneschi, M. (2008). Replacing state appropriations with alternative revenue
sources: The case of voluntary support. The Journal of Higher Education, 79(2), 208–
229. Retrieved July 14, 2009, from Academic Search Premier database.
Ciulla, J. B. (Ed.). (2004). Ethics, the heart of leadership. Westport, CT: Praeger.
Commission on the Future of Higher Education. (2006). A test of leadership: Charting the future
of U.S. higher education. Washington, DC: U.S. Department of Education.
Data-driven decision-making. (2004, July). The Journal. Retrieved July 26, 2009 from Academic
Search Premier database.
de Palomo, F. B., & Luna, E. (2000). The needs assessment: Tools for long-term planning. AED
Center for Community-Based Health Strategies.
Deane, C. (2005). Transparency of qualifications: Are we there yet? European Journal of
Education, 40(3), 279–293. doi:10.1111/j.1465-3435.2005.00226.x.
Delgado, R. (1995). Critical race theory: The cutting edge. Philadelphia: Temple University
Press.
Dillon, S. (2005, October 16). At public universities, warnings of privatization. New York Times,
p. 12.

110
Dongsung, K. (2005). Performance-based budgeting: The U.S. experience. Public Organization
Review, 5(2), 91–107. doi:10.1007/s11115-005-1782-6.
Duffy, R., Martin, H., Bryan, N., & Raque-Bogdan, T. (2008). Measuring individual research
productivity: A review and development of the integrated research productivity index.
Journal of Counseling Psychology, 55(4), 518–527. Retrieved from ERIC database.
Eaton, J. S. (2001). Regional accreditation reform: Who is served? Change, 33(2), 38–45.
Ehrenberg, R. G. (2006). The perfect storm and the privatization of public higher education.
Change, 38(1), 46–53. Retrieved July 14, 2009, from Academic Search Premier database.
Engle, P. (2010). The budgeting process. Industrial Engineer: IE, 42(10), 20. Retrieved from
Academic Search Premier database.
Ewell, P. T., & Jones, D. P. (2006, Fall). State-level accountability for higher education: On the
edge of a transformation. New Directions for Higher Education. doi:10.1002/he.222.
Freeman, J., & Hannan, M. T. (1975). Growth and decline processes in organizations. American
Sociological Review, 40, 215–228.
Gay, L. R. (1980). Educational evaluation and measurement. Columbus, OH: Merrill.
Gilligan, C. (1982). In a different voice. Cambridge, MA: Harvard University Press.
Gini, A. (2004). Moral leadership and business ethics. In J. B. Ciulla (Ed.), Ethics, the heart of
leadership (p. 25–43). Westport, CT: Praeger.
Giroux, H. A. (1994). Educational leadership and school administrators: Rethinking the meaning
of democratic public culture. In T. Mulkeen, N. H. Cambrone-McCabe, & B. Anderson
(Eds.), Democratic leadership: The changing context of administrative preparation (p.
31–47). Norwood, NJ: Ablex.

111
Goodstein, L. D. (1963). The institutional sources of articles in the Journal of Counseling
Psychology. Journal of Counseling Psychology, 10, 94–95.
Gose, B. (2002). The fall of the flagships: Do the best state universities need to privatize to
thrive? Chronicle of Higher Education, 48(43), A19.
Green, S. B., & Salkind, N. J. (2005). Using SPSS for windows and macintosh: Analyzing and
understanding data. Upper Saddle River, NJ: Pearson Prentice Hall.
Greene, M. (1998). The dialectic of freedom. New York: Teachers College Press.
Haberaecker, H. J. (2004, Fall). Strategic planning and budgeting to achieve core missions. New
Directions for Institutional Research, 2004(123), 71–87. Retrieved July 2, 2009, from
Academic Search Premier database.
Hearn, J. C., Lewis, D. R., Kallsen, L., Holdsworth, J. M., & Jones, L. M. (2006). Incentives for
managed growth: A case study of incentives-based planning and budgeting in a large
public research university. Journal of Higher Education, 77(2), 286–316. Retrieved July
2, 2009, from Academic Search Premier database.
Henry, T. C. (2007). Assessing and improving institutional performance. New Directions for
Higher Education, 140, 51–62.
Hills, F. S., & Mahoney, T. A. (1978). University budgets and organizational decision making.
Administrative Science Quarterly, 23, 454–465.
Hossler, D., Lund, J., Ramin, J., Westfall, S., & Irish, S. (1997). State funding for higher
education: The sisyphean task. Journal of Higher Education, 68(2), 160–190.
Hovey, H. A. (1999). State spending for higher education in the next decade: The battle to
sustain current support. National Center for Public Policy and Higher Education Report
No. 99-3. San Jose, CA: National Center for Public Policy and Higher Education.

112
Hsu, T-c. (2005). Research methods and data analysis procedures used by educational
researchers. International Journal of Research & Method in Education, 28(2), 109–133.
doi:10.1080/01406720500256194.
Huisman, J., & Currie, J. (2004, December). Accountability in higher education: Bridge over
troubled water? Higher Education, 48(4), 529–551. Retrieved July 22, 2009, from
Academic Search Premier database.
Jaeger, R. (1984). Sampling in education and the social sciences. New York: Longman.
Jenny, H. H. (1996). Cost accounting in higher education: Simplified macro – and micro-costing
techniques. Washington, DC: National Association of College and University Business
Officers.
Jenny, N. W., & Arbak, E. (2004, March). Challenges for financing public higher education.
Retrieved April 27, 2010, from the Rockefeller School of Government Web site:
http://rockinst.org/publications/state_fiscal_news.html
Kahn, J. H. (2005). Institutional research productivity, use of theory-driven research, and
statistical application in counseling psychology: Examining the research base. The
Counseling Psychologist, 33, 340-348.
Kane, T. J., Orszag, P. R., & Gunter, D. L. (2003). State fiscal constraints and higher education
spending: The roll of Medicaid and the business cycle. Urban-Brookings Tax Policy
Center Discussion Paper No. 11. Washington, DC: Urban Institute.
Kaufman, R. (2006). Change, choices, and consequences: A guide to mega thinking and
planning. Amherst, MA: HRD Press Inc.
Kaufman, R., & English, F. W. (1979). Needs assessment: Concept and application. Englewood
Cliffs, NJ: Educational Technology Publications.

113
Keller, G. (1999–2000). The emerging third stage in higher education planning. Planning for
Higher Education, 28(2), 1–7.
Kirwan, W. E. (2007). Top to bottom reengineering: University System of Maryland enhances
productivity, improves accountability, and maintains quality. New Directions for Higher
Education, (140), 41–49. doi:10.1002/he.279.
Kohlberg, L. (1981). The philosophy of moral development: Moral stages and the idea of justice
(Vol. 1). San Francisco: Harper & Row.
Kuh, G. D. (2007). Risky business, promises and pitfalls of institutional transparency. Change,
39(5), 30–35. Retrieved July 22, 2009, from Academic Search Premier database.
Kuhn, T. S. (1996). The structure of scientific revolutions (3rd
ed.). Chicago: The University of
Chicago Press.
Kurosawa, K. (1975). An aggregate index for the analysis of productivity. Omega, 3(2): 157–
168.
Lang, D. W. (2001). A primer on responsibility centre budgeting and responsibility center
management. In J. L. Yeager, G. M. Nelson, E. A. Potter, J. C. Weidman, & T. G. Zullo
(Eds.), ASHE reader on finance in higher education (2nd
ed., pp. 568–590). Boston:
Pearson Custom Publishing. (Reprinted from the CSSHE Professional File #117, Winter
1999, No. 17).
Leitzel, J., Corvey, C., & Hiley, D. (2004). Integrated planning and change management at a
research university. Change, 36(1), 36–43. Retrieved July 2, 2009, from Academic
Search Premier database.
Levin, H. M. (2007). Going quasi-public. Academe, 93(1), 83–84.

114
Lingenfelter, P. E. (2007). How should states respond to a test of leadership? Change, 39(1), 13–
19. Retrieved July 22, 2009, from Academic Search Premier database.
Lyall, K. C., & Sell, K. R. (2005). The true genius of America at risk: Are we losing our public
universities to de facto privatization? Westport, CT: Praeger Publishers.
Lyall, K. C., & Sell, K. R. (2006). The de facto privatization of American public higher
education. (Cover story). Change, 38(1), 6–13. Retrieved July 14, 2009, from Academic
Search Premier database.
Marar, A., Powell, W. B., & Kulkarni, S. (2006). Combining cost-based and rule-based
knowledge in complex resource allocation problems. IIE Transactions, 38(2), 159–172.
doi:10.1080/07408170500333384.
March, J. G. (1966). The power of power. In D. Easton (Ed.), Varieties of political theory (pp.
167–185). Englewood Cliffs, NJ: Prentice-Hall.
Massy, W. F. (1996a). Resource allocation in higher education. Ann Arbor, MI: The University
of Michigan Press.
Massy, W. F. (1996b). Reengineering resource allocation systems. In W.F. Massy (Ed.)
Resource allocation in higher education (pp. 15–48). Ann Arbor, MI: The University of
Michigan Press.
McCormick, A. (2009). Toward reflective accountability: Using NSSE for accountability and
transparency. New Directions for Institutional Research, 2009(141), 97–106. Retrieved
from Academic Search Premier database.
McLendon, M. K., & Hearn, J. C. (2006). Mandated openness in public higher education: A field
study of state sunshine laws and institutional governance. The Journal of Higher

115
Education, 77(4), 645–683. Retrieved July 22, 2009, from Academic Search Premier
database.
Middaugh, M. F., Graham, R., & Shahid, A. A. (2003). A study of higher education instructional
expenditures: The Delaware study of instructional costs and productivity. NCES 2003-
161 Report. Washington, DC: U.S. Department of Education.
Middaugh, M. F., Kelly, H. A., & Walters, A. M. (2008, Spring). The role of institutional
research in understanding and describing faculty work. New Directions for Higher
Education, 141, 41–56. doi:10.1002/he.292.
Milliken, J., & Colohan, G. (2004). Quality or control? Management in higher education.
Journal of Higher Education Policy & Management, 26(3), 381–391.
Mortenson, T. (2004, January). State tax fund appropriations for higher education, FY1961–
FY2004. Postsecondary Education Opportunity (No. 139). Oskaloosa, IA: Mortenson
Research Seminar on Public Policy Analysis of Opportunity for Postsecondary
Education. Retrieved from http://www.postsecondary.org/ti/ti_43.asp
Nettles, M. T., Cole, J. J. K., & Sharp, S. (1997). Benchmarking assessment. Assessment of
teaching and learning in higher education and public accountability: State governing,
coordinating board & regional accreditation association policies and practices.
Stanford, CA: National Center for Postsecondary Improvement.
Nkrumah-Young, K. K. (2005). Exploring financing options for higher education in Jamaica.
Unpublished DBA thesis. Bath, UK: University of Bath.
Nkrumah-Young, K. K., & Powell, P. (2008). Resource allocation models and accountability: A
Jamaican case study. Journal of Higher Education Policy and Management, 30(3), 245–
259. Retrieved from EBSCOhost.

116
Orr, D., Jaeger, M., & Schwarzenberger, A. (2007). Performance-based funding as an instrument
of competition in German higher education. Journal of Higher Education Policy and
Management, 29(1), 3–23. doi:10.1080/13600800600980072.
Parker, L., & Shapiro, J. P. (1993). The context of educational administration and social class. In
C. A. Capper (Ed.), Educational administration in a pluralistic society (p. 36–65).
Albany, NY: State University of New York Press.
Peterson, P. E. (1995). The price of federalism. Washington, DC: Brookings Institution.
Pfeffer, J., & Moore, W. L. (1980). Power in university budgeting: A replication and extension.
Administrative Science Quarterly, 25(4), 637–653. Retrieved June 16, 2009 from
Education Research Complete database.
Pfeffer, J., & Salancik, G. R. (1974). The effect of uncertainty on the use of social influence in
organizational decision making. Administrative Science Quarterly, 19, 135–151.
Pfeffer, J., Salancik, G. R., & Leblebici, H. (1976). The effect of uncertainty on the use of social
influence in organizational decision making. Administrative Science Quarterly, 21, 227–
245.
Pondy, L. R. (1970). Toward a theory of internal resource-allocation. In M. N. Zald (Ed.), Power
in organizations (p. 270–311). Nashville: Vanderbilt University Press.
Priest, D. M., Becker, W. E., Hossler, D., & St. John, E. P. (Eds.). (2002). Incentive-based
budgeting systems in public universities. Northampton, MA: Edward Elgar.
Print, M., & Hattie, J. (1997). Measuring quality in universities: An approach to weighting
research productivity. Higher Education, 33, 453–469.
Rhoades, G. (2001). Managing productivity in an academic institution: Rethinking the whom,
which, what, and whose of productivity. Research in Higher Education, 42(5), 619–632.

117
Rich, D. (2006). Academic leadership and the restructuring of higher education. New Directions
for Higher Education, (134), 37–48. doi:10.1002/he.215.
Rizzo, M. J. (2004). A (less than) zero sum game? State funding for public higher education:
How public higher education institutions have lost. Unpublished doctoral dissertation,
Cornell University.
Roland Martin, J. (1993). Becoming educated: A journey of alienation or integration? In S. H.
Shapiro & D. E. Purpel (Eds.), Critical social issues in American education: Toward the
21st century (p. 137–148). New York: Longman.
Romzek, B. S. (2000). Dynamics of public accountability in an era of reform. International
Review of Administrative Sciences, 66(1), 21–44.
Ross, M. E., & Shannon, D. M. (2008). Applied quantitative methods in education. Dubuque, IA:
Kendall/Hunt Publishing Company.
Salancik, G. R., & Pfeffer, J. (1974). The bases and use of power in organizational decision
making: The case of a university. Administrative Science Quarterly, 19, 453–473.
Salancik, G. R., & Pfeffer, J. (1978). Uncertainty, secrecy, and the choice of similar others.
Social Psychology, 41, 246–255.
Sandmeyer, L. E., Dooris, M. J., & Barlock, R. W. (2004). Integrated planning for enrollment,
facilities, budget, and staffing: Penn State University. New Directions for Institutional
Research, 2004(123), 89–96. Retrieved July 2, 2009, from Academic Search Premier
database.
Sayers, K. W. (2006). Information and inattentiveness in higher education planning. College and
University Journal, 81(3), 45–50.

118
Schuh, J. H. (1993). Fiscal pressures on higher education and student affairs. In M. J. Barr (Ed.),
The handbook of student affairs administration (pp. 49–68). San Francisco: Jossey-Bass.
Schuster, J. (1990). Resource allocation to the arts. Society, 27(6), 21–24. Retrieved from
Academic Search Premier database.
Selingo, J. (2003, February 28). The disappearing state in public higher education. The Chronicle
of Higher Education, 49(25), A25.
Senge, P., Cambron-McCabe, N., Lucas, T., Smith, B., Dutton, J., & Kleiner, A. (2000). Schools
that learn: A fifth discipline fieldbook for educators, parents, and everyone who cares
about education. New York: Doubleday.
Serban A. M., & Burke J. C. (1998, July). The impact of state budget reductions in the 1990s: A
view of public higher education in six states. Paper presented at the annual meeting of the
Society for College and University Planning, Vancouver, Canada.
Sergiovanni, T. J. (1992). Moral leadership: Getting to the heart of school improvement. San
Francisco: Jossey-Bass.
Shapiro, J. P., & Stefkovich, J. A. (2005). Ethical leadership and decision making in education:
Applying theoretical perspectives to complex dilemmas. Mahwah, NJ: Lawrence Erlbaum
Associates, Inc.
Shuppy, A. (2006). Ways and means. The Chronicle of Higher Education, 53(12), A22–A23.
Retrieved July 23, 2009, from Academic Search Premier database.
Slaughter, S., & Leslie, L. L. (1997). Academic capitalism: Politics, policies, and the
entrepreneurial university. Baltimore: Johns Hopkins University Press.
Southern Regional Education Board (SREB) Fact Book on Higher Education. (2009).

119
Spengler, P. M., Neville, H. A., & Hoffman, M. S. (2005). Introduction to perspectives on
research in counseling psychology: Furthering the tradition of self-examination. The
Counseling Psychologist, 33, 265–268.
Starratt, R. J. (1991). Building an ethical school: A theory for practice in educational leadership.
Educational Administration Quarterly, 27(2), 185–202.
Starratt, R. J. (1994b). Building an ethical school: A practical response to the moral crisis in
schools. London: Falmer Press.
Stout, D. (1995). Performance analysis for training. Niagara, WI: Niagara Paper Company.
Strike, K. A. (1991). The moral role of schooling in liberal democratic society. In G. Grand
(Ed.), Review of research in education (p. 413–483). Washington, DC: American
Educational Research Association.
Tooley, J., & Dixon, P. (2006). ‗De facto‘ privatization of education and the poor: Implications
of a study from sub-Saharan Africa and India. Compare: A Journal of Comparative
Education, 36(4), 443–462.
Toutkoushian, R. K., & Hollis, P. (1998). Using panel data to examine legislative demand for
higher education. Education Economics, 6(2), 141–157.
Trow, M. (1996). Trust, markets and accountability in higher education: A comparative
perspective. Higher Education Policy 9(4), 309–324.
Webster, J. (1993). Allocating library acquisitions budgets in an era of declining or static
funding. Journal of Library Administration, 19(2), 57. Retrieved from Academic Search
Premier database.
Weerts, D. J., & Ronca, J. M. (2006). Examining differences in state support for higher
education: A comparative study of state appropriations for research I universities. The

120
Journal of Higher Education, 77(6), 935–967. Retrieved July 8, 2009, from Academic
Search Premier database.
Wellman, J. V. (2006). Accountability for the public trust. New Directions for Higher Education,
135, 111–118. doi:10.1002/he.234.
Wooldridge, S., Garvin, M., & Miller, J. (2001). Effects of accounting and budgeting on capital
allocation for infrastructure projects. Journal of Management in Engineering, 17(2), 86.
Retrieved from Academic Search Premier database.
Yudof, M. G. (2002, January 11). Is the public research university dead? Chronicle of Higher
Education, 48(18), B24.
Zumeta, W. (2007). The new accountability. National Crosstalk, 15(1), 12.

121
Appendix A
Permission to Administer a Survey for IRB Protocol Form
March 22, 2010
Dear Provost (Name),
My name is Jenny Barton and I am a doctoral candidate in the College of Education
(Administration of Higher Education) at Auburn University. I am writing to ask your permission
to administer a survey to your department heads and chairs entitled, ―Surveying the Importance
of Needs Assessment and Productivity Measures in a Budget Allocation Model.‖ This research
will be approved in advance by the Auburn University Institutional Review Board for research
involving human subjects.
Department heads and chairs were selected to participate in this survey because they are the chief
financial officers for their units. Their responses will provide valuable feedback that will add to
the body of knowledge on this topic and possibly help shape future budget allocation models.
Please be assured their identity and any information they provide will be kept confidential. The
survey results will only be presented in a group format and will never be reported in a way that
would allow identification of any individual.
It would also be very beneficial if your office would provide me with an email list of your
department heads and chairs. Please feel free to contact me with any questions related to this
survey.
Thank you,
Jenny Barton
Mary J. (Jenny) Barton
Executive Assistant to the Provost, Budget
Doctoral Candidate, Administration of Higher Education
Office of the Provost & V.P. for Academic Affairs
208 Samford Hall
Auburn University, AL 36849-5108
(334) 844-0280 Phone

122
Appendix B
Follow Up Request – Permission to Administer a Survey
April 1, 2010
Dear Provost (Name),
This is a follow up request to my email sent on 3/22/10. Your positive consideration would be
greatly appreciated.
My name is Jenny Barton and I am a doctoral candidate in the College of Education
(Administration of Higher Education) at Auburn University under the supervision of Dr. James
Witte. I am writing to ask your permission to administer a survey to your department heads and
chairs entitled, ―Surveying the Importance of Needs Assessment and Productivity Measures in a
Budget Allocation Model.‖ This research will be approved in advance by the Auburn University
Institutional Review Board for research involving human subjects.
The survey contains 20 questions. It will only take your department heads/chairs about 15
minutes to complete this survey. The consent form and survey will be administered via email and
the internet.
Department heads and chairs were selected to participate in this survey because they are the chief
financial officers for their units. Their responses will provide valuable feedback that will add to
the body of knowledge on this topic and possibly help shape future budget allocation models.
Please be assured their identity and any information they provide will be kept confidential. The
survey results will only be presented in a group format and will never be reported in a way that
would allow identification of any individual.
123
It would also be very beneficial if your office would provide me with an email list of your
department heads and chairs. Please feel free to contact me or Dr. James Witte, dissertation
committee chair, with any questions related to this survey.
Thank you,
Jenny Barton
Mary J. (Jenny) Barton
Executive Assistant to the Provost, Budget
Doctoral Candidate, Administration of Higher Education
Office of the Provost & V.P. for Academic Affairs
208 Samford Hall
Auburn University, AL 36849-5108
(334) 844-0280 Phone
James Witte, Ph.D.
334-844-3054

124
Appendix C
Survey Development Test Group
Humana-Germany-Sherman Distinguished Professor
David Shannon, Ph.D.
Educational Foundations, Leadership, and Technology
4028 Haley Center
Auburn University, Alabama 36849
Provost and Vice President of Academic Affairs, Retired
John G. Heilman, Ph.D.
Office of the Provost
208 Samford Hall
Auburn University, Alabama 36849
Executive Vice President of Business and Finance
Don L. Large, Ed.D.
Office of the Executive Vice President
107 Samford Hall
Auburn University, Alabama 36849
2008–2009 Auburn University Budget Advisory Committee (BAC)
Don Large (Executive Vice President) – Chair
John Heilman (Provost)
John Mason (Associate Provost and Vice President for Research)
Jeffrey Sibley (Graduate School)
Jim Hansen (Honors College)
Lee Evans (Pharmacy)
Anne-Katrin Gramberg (Liberal Arts)
Stewart Schneller (Science and Mathematics)
Glenn Anderson (Library)
Chris Roberts (Engineering)
Greg Somers (Forestry and Wildlife Sciences)
Joe Touchton (Agriculture)
John Hathcock (Clinical Sciences)
Constance Hendricks (Nursing)
David Hinson (Architecture)
Jennifer Mueller (Accounting)

125
Tom Smith (Human Development and Family Studies)
Paula Sullenger (Library)
Kim Walls (Education)
Bob Locy (Biological Sciences)
David King (Geology and Geography) – Senate Faculty Salaries Committee Chair
Todd Storey (Auburn University Aviation) – A&P Assembly Chair
April Staton (Pharmacy Practice) – A&P Assembly Chair-elect
Valerie Morns-Riggins (Contracts Admin. Asst. – Space Res.) – Staff Council Chair
Judy Woodrow (Clinical Sciences) – Staff Council Chair-elect
Lindsay Stevenson (GSC President)
Lauren Hayes ([email protected]– SGA President) – 2009

126
Appendix D
Four Member Q-Sort Panel
James E. Witte, Ph.D.
Department of Educational Foundations, Leadership, and Technology
4036 Haley Center
Auburn University, Alabama 36849
Ellen H. Reames, Ed.D.
Department of Educational Foundations, Leadership, and Technology
4036 Haley Center
Auburn University, Alabama 36849
William I. Sauser, Ph.D.
Department of Management
408 Lowder Business Building
Auburn University, Alabama 36849
Kerry A. Ransel, M.S.
Office of the Provost
208 Samford Hall
Auburn University, Alabama 36849

127
Appendix E
Q-Sort Instruction Sheet
Thank you for agreeing to perform a Q-Sort test with proposed category names and survey items
from a survey instrument I developed. I plan to use this instrument in gathering data for my
dissertation. As content experts your input in invaluable to my research efforts.
Below please see a definition of a Q-Sort test:
In a Q-Sort test participants are provided with a predetermined set of category names. They then
assign the survey items to these fixed categories. This helps reveal the degree to which the
participants agree on which items belong under each category.
A Q-Sort test is evaluative; it is typically used to judge whether a given set of category names
provides an effective way to organize a given collection of content.
In the large envelop you will find three legal size envelopes and 15 strips of paper. A category
name is written on the front of each of the three envelopes. The 15 strips of paper contain the 15
survey items. Based on the category name on each envelope, please place the 15 survey items in
the envelope to which you believe they belong. Once you have completed the Q-Sort test, please
call me or email me to pick up the envelope.
Thank you,
Jenny Pate Barton
334-319-2025

128
Appendix F
Three Specified Categories with Corresponding Statements
Three specified categories:
Items Related to Budget Allocation Preferences
Items Related to Need in a Budget Allocation Model
Items Related to Productivity in a Budget Allocation Model
Corresponding statements:
Ethics is important in budget allocation decisions.
Need is important in budget allocation decisions.
Productivity is important in budget allocation decisions.
Objectivity is important in budget allocation decisions.
Subjectivity is important in budget allocation decisions.
It is important if the funds requested are for one time funds.
It is important if the funds requested are for continuing funds.
The reserve amount to the base amount (as a %) is important.
The summer budget distribution is important.
The summer budget distribution per student is important.
Full time equivalent student units are important.
The number of degrees granted is important.
Student credit hours are important.
Full time equivalent faculty units are important.
Cost of instruction is important.
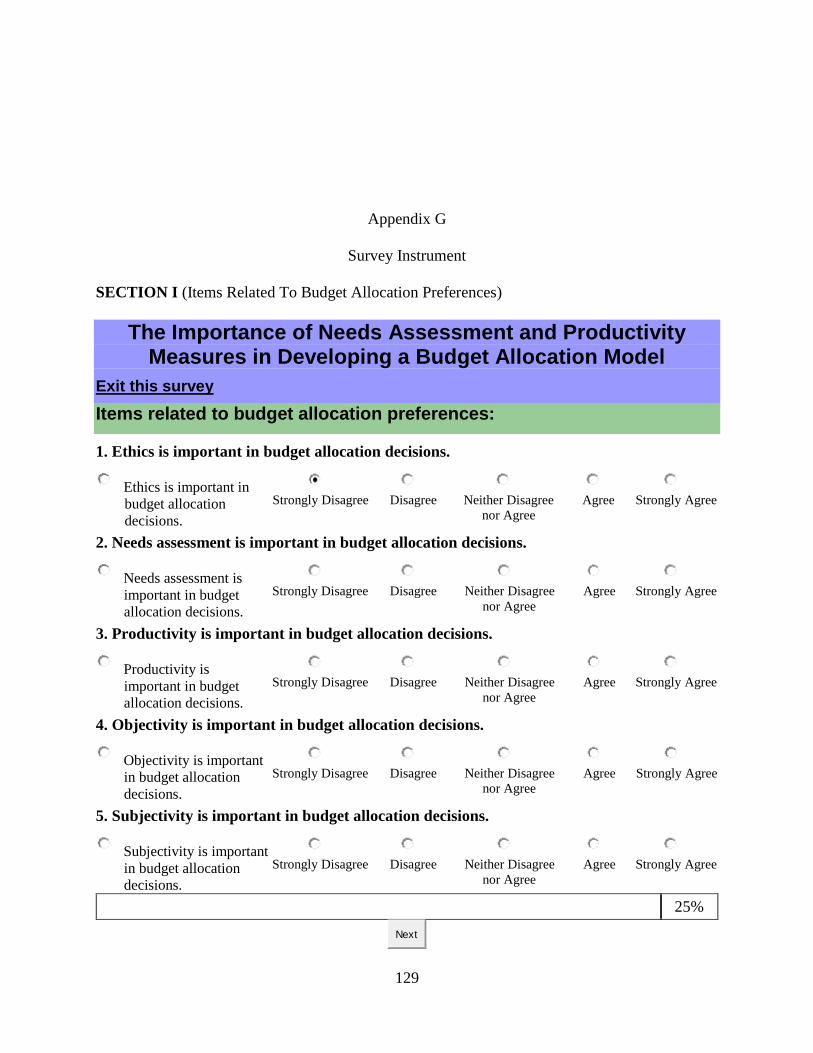
129
Appendix G
Survey Instrument
SECTION I (Items Related To Budget Allocation Preferences)
The Importance of Needs Assessment and Productivity Measures in Developing a Budget Allocation Model
Exit this survey
Items related to budget allocation preferences:
1. Ethics is important in budget allocation decisions.
Ethics is important in
budget allocation
decisions.
Strongly Disagree
Disagree
Neither Disagree
nor Agree
Agree
Strongly Agree
2. Needs assessment is important in budget allocation decisions.
Needs assessment is
important in budget
allocation decisions.
Strongly Disagree
Disagree
Neither Disagree
nor Agree
Agree
Strongly Agree
3. Productivity is important in budget allocation decisions.
Productivity is
important in budget
allocation decisions.
Strongly Disagree
Disagree
Neither Disagree
nor Agree
Agree
Strongly Agree
4. Objectivity is important in budget allocation decisions.
Objectivity is important
in budget allocation
decisions.
Strongly Disagree
Disagree
Neither Disagree
nor Agree
Agree
Strongly Agree
5. Subjectivity is important in budget allocation decisions.
Subjectivity is important
in budget allocation
decisions.
Strongly Disagree
Disagree
Neither Disagree
nor Agree
Agree
Strongly Agree
25%
Next

130
SECTION II (Items Related to Needs Assessment in a Budget Allocation Model)
The Importance of Needs Assessment and Productivity Measures in Developing a Budget Allocation Model
Exit this survey
Items related to needs assessment in a budget allocation model:
6. It is important if the funds requested are for one time funds.
It is important if the funds requested are for one time funds.
Strongly Disagree
Disagree
Neither Disagree
nor Agree
Agree
Strongly Agree
7. It is important if the funds requested are for continuing funds.
It is important if the funds requested are for continuing funds.
Strongly Disagree
Disagree
Neither Disagree
nor Agree
Agree
Strongly Agree
8. The reserve amount to the base amount (as a %) is important.
The reserve amount to the base amount (as a %) is important.
Strongly Disagree
Disagree
Neither Disagree
nor Agree
Agree
Strongly Agree
9. The summer budget distribution is important.
The summer budget distribution is important.
Strongly Disagree
Disagree
Neither Disagree
nor Agree
Agree
Strongly Agree
10. The summer budget distribution per student is important.
The summer budget distribution per student is important.
Strongly Disagree
Disagree
Neither Disagree
nor Agree
Agree
Strongly Agree
50%
Prev Next

131
SECTION III (Items Related to Productivity in a Budget Allocation Model)
The Importance of Needs Assessment and Productivity Measures in Developing a Budget Allocation Model
Exit this survey
Items related to productivity in a budget allocation model:
11. Full time equivalent student units are important.
Full time equivalent student units are important.
Strongly Disagree
Disagree
Neither Disagree
nor Agree
Agree
Strongly Agree
12. The number of degrees granted is important.
The number of degrees granted is important.
Strongly Disagree
Disagree
Neither Disagree
nor Agree
Agree
Strongly Agree
13. Student credit hours are important.
Student credit hours are important.
Strongly Disagree
Disagree
Neither Disagree
nor Agree
Agree
Strongly Agree
14. Full time equivalent faculty units are important.
Full time equivalent faculty units are important.
Strongly Disagree
Disagree
Neither Disagree
nor Agree
Agree
Strongly Agree
15. Cost of instruction is important.
Cost of instruction is important.
Strongly Disagree
Disagree
Neither Disagree
nor Agree
Agree
Strongly Agree
75%
Prev Next

132
SECTION IV (Items Related To Demographic Information)
The Importance of Needs Assessment and Productivity Measures in Developing a Budget Allocation Model
Exit this survey
Items related to demographic information:
16. What is the enrollment in your academic unit?
What is the enrollment in your academic unit?
Less than 500
500 – 999
1,000 – 1,499
1,500 – 1,999
2,000 or more
17. What percent of your academic unit’s budget is from state appropriations?
What percent of your academic unit’s budget is from state appropriations?
Less than 25%
25% – 49%
50% – 74%
75% or more
18. What percent of your academic unit’s budget is from tuition?
What percent of your academic unit’s budget is from tuition?
Less than 25%
25% – 49%
50% – 74%
75% or more

133
19. What percent of your academic unit’s budget is from contracts/grants?
What percent of your academic unit’s budget is from contracts/grants?
Less than 25%
25% – 49%
50% – 74%
75% or more
20. What is your role at your university?
What is your role at your university?
Chief Financial Officer
Provost
Dean
Department Head/Chair
Director
Thank you for completing this survey!
100%
Prev Done

134
Appendix H
Participant Email and Information Letter
From: ―Mary Pate Barton‖ <[email protected]>
To: Survey Email List
Date: 9/20/2010 10:20 AM
Subject: Budget Allocation Model Survey
Surveying the Importance of Needs Assessment Measures and Productivity Measures in
Developing a Budget Allocation Model
Dear Provost, Chief Financial Officer, Dean, or Department Head/Chair,
As a budget officer at your institution, your opinion is important to this study. I would like to
invite you to take part in a study by completing a survey.
I encourage you to complete this survey and tell me how important a budget allocation model
based on traditional, subjective measures compares to a budget allocation model based on
comprehensive, objective measures. You were selected to participate in this study because you
are the chief financial officer for your unit. Your response will provide valuable feedback to this
study and help shape future budget allocation models.
Please read the Information Letter below containing more information regarding participation in
this study. The link to the survey is at the bottom of the Information Letter.
Thank you in advance for taking part in this important and timely study.
Sincerely,
Mary Pate Barton

135
Auburn University College of Education
Department of Educational Foundations, Leadership, and Technology
(NOTE: DO NOT AGREE TO PARTICIPATE UNLESS IRB APPROVAL INFORMATION
WITH CURRENT DATES HAS BEEN ADDED TO THIS DOCUMENT.)
INFORMATION LETTER
for a Research Study entitled
―The Relationships between Needs Assessment Measures, Productivity Measures, and Ethics in
Developing a Budget Allocation Model for Higher Education‖
You are invited to participate in a research study to assess the importance of needs
assessment measures and productivity measures in developing a budget allocation model for
institutions of higher education. The objectives are to find out what are the relationships between
needs assessment measures, productivity measures, and needs assessment and productivity
measures in a budget allocation model. The study is being conducted by Mary Pate Barton,
doctoral candidate (education), under the direction of Dr. James E. Witte, Associate Professor, in
the Auburn University Department of Educational Foundations, Leadership, and Technology.
You were selected as a possible participant because you are the chief financial officer for your
academic unit and are age 19 or older.
What will be involved if you participate? Your participation is completely voluntary. If you
decide to participate in this research study, you will be asked to complete a survey containing 20
questions. Your total time commitment will be approximately 20 minutes.
Are there any risks or discomforts? There are no risks or discomforts associated with this
study.
Are there any benefits to yourself or others? If you participate in this study, you can expect to
receive no direct benefits. Your responses will provide valuable data. This data will contribute to
the general body of knowledge related to needs assessment measures, productivity measures, and
ethics. This knowledge may be used in developing future budget allocation models for higher
education.
Will you receive compensation for participating? No compensation or incentives will be given
for participating.
If you change your mind about participating, you can withdraw at any time by closing your
browser window. If you choose to withdraw, your data can be withdrawn as long as it is
identifiable. Once you‘ve submitted anonymous data, it cannot be withdrawn since it will be
unidentifiable. Your decision about whether or not to participate or to stop participating will not
jeopardize your future relations with Auburn University, the Department of Educational
Foundations, Leadership, and Technology or Dr. James E. Witte.

136
Any data obtained in connection with this study will remain anonymous. We will protect
your privacy and the data you provide by using SurveyMonkey. As stated in SurveyMonkey‘s
privacy policy, they will not use your data for their own purposes. The data collected is kept
private and confidential. SurveyMonkey will be set so as not to collect email or IP addresses. I
will be the owner of data collected or uploaded in the survey. SurveyMonkey does offer SSL
encryption for the survey link and survey pages during transmission. SurveyMonkey is located in
the U.S. and all surveys and data are stored on their servers. Information collected through your
participation may be used to fulfill the educational requirement of research and writing my
dissertation, published in a professional journal, and/or presented at a professional meeting.
If you have questions about this study, please contact Mary Pate Barton at
[email protected] or (334) 844-0280 or Dr. James E. Witte at [email protected] or
(334) 844-3054.
If you have questions about your rights as a research participant, you may contact the
Auburn University Office of Human Subjects Research or the Institutional Review Board by
phone (334)-844-5966 or e-mail at [email protected] or [email protected]
HAVING READ THE INFORMATION ABOVE, YOU MUST DECIDE IF YOU WANT
TO PARTICIPATE IN THIS RESEARCH PROJECT. IF YOU DECIDE TO
PARTICIPATE, PLEASE CLICK ON THE LINK BELOW. YOU MAY PRINT A COPY
OF THIS LETTER TO KEEP.
The Auburn University Institutional Review Board has approved this document for use from
July 14, 2010 to July 13, 2011. Protocol #10-165 EX 1007.
http://www.surveymonkey.com/s/GWDS9VY

137
Appendix I
Participant Follow-up Email Reminder and Information Letter
From: ―Mary Pate Barton‖ <[email protected]>
To: Survey Email List
Date: 9/23/2010 10:20 AM
Subject: Budget Allocation Model Survey--Reminder
Surveying the Importance of Needs Assessment Measures and Productivity Measures in
Developing a Budget Allocation Model
Dear Provost, Chief Financial Officer, Dean, or Department Head/Chair,
I do understand that fall semester is the busiest time of the year. While you have great demands
on your time, I hope you will make time to participate in this very important and timely study by
completing this survey. You will find the link to the survey at the bottom of the Information
Letter.
As a budget officer at your institution, your opinion is important to this study. I would like to
invite you to take part in a study by completing a survey.
I encourage you to complete this survey and tell me how important a budget allocation model
based on traditional, subjective measures compares to a budget allocation model based on
comprehensive, objective measures. You were selected to participate in this study because you
are the chief financial officer for your unit. Your response will provide valuable feedback to this
study and help shape future budget allocation models.
Please read the Information Letter below containing more information regarding participation in
this study. The link to the survey is at the bottom of the Information Letter.
Thank you in advance for taking part in this important and timely study.
Sincerely,
Mary Pate Barton

138
Auburn University College of Education
Department of Educational Foundations, Leadership, and Technology
(NOTE: DO NOT AGREE TO PARTICIPATE UNLESS IRB APPROVAL INFORMATION
WITH CURRENT DATES HAS BEEN ADDED TO THIS DOCUMENT.)
INFORMATION LETTER
for a Research Study entitled
―The Relationships between Needs Assessment Measures, Productivity Measures, and Ethics in
Developing a Budget Allocation Model for Higher Education‖
You are invited to participate in a research study to assess the importance of needs
assessment measures and productivity measures in developing a budget allocation model for
institutions of higher education. The objectives are to find out what are the relationships between
needs assessment measures, productivity measures, and needs assessment and productivity
measures in a budget allocation model. The study is being conducted by Mary Pate Barton,
doctoral candidate (education), under the direction of Dr. James E. Witte, Associate Professor, in
the Auburn University Department of Educational Foundations, Leadership, and Technology.
You were selected as a possible participant because you are the chief financial officer for your
academic unit and are age 19 or older.
What will be involved if you participate? Your participation is completely voluntary. If you
decide to participate in this research study, you will be asked to complete a survey containing 20
questions. Your total time commitment will be approximately 20 minutes.
Are there any risks or discomforts? There are no risks or discomforts associated with this
study.
Are there any benefits to yourself or others? If you participate in this study, you can expect to
receive no direct benefits. Your responses will provide valuable data. This data will contribute to
the general body of knowledge related to needs assessment measures, productivity measures, and
ethics. This knowledge may be used in developing future budget allocation models for higher
education.
Will you receive compensation for participating? No compensation or incentives will be given
for participating.
If you change your mind about participating, you can withdraw at any time by closing your
browser window. If you choose to withdraw, your data can be withdrawn as long as it is
identifiable. Once you‘ve submitted anonymous data, it cannot be withdrawn since it will be
unidentifiable. Your decision about whether or not to participate or to stop participating will not
jeopardize your future relations with Auburn University, the Department of Educational
Foundations, Leadership, and Technology or Dr. James E. Witte.

139
Any data obtained in connection with this study will remain anonymous. We will protect
your privacy and the data you provide by using SurveyMonkey. As stated in SurveyMonkey‘s
privacy policy, they will not use your data for their own purposes. The data collected is kept
private and confidential. SurveyMonkey will be set so as not to collect email or IP addresses. I
will be the owner of data collected or uploaded in the survey. SurveyMonkey does offer SSL
encryption for the survey link and survey pages during transmission. SurveyMonkey is located in
the U.S. and all surveys and data are stored on their servers. Information collected through your
participation may be used to fulfill the educational requirement of research and writing my
dissertation, published in a professional journal, and/or presented at a professional meeting.
If you have questions about this study, please contact Mary Pate Barton at
[email protected] or (334) 844-0280 or Dr. James E. Witte at [email protected] or
(334) 844-3054.
If you have questions about your rights as a research participant, you may contact the
Auburn University Office of Human Subjects Research or the Institutional Review Board by
phone (334)-844-5966 or e-mail at [email protected] or [email protected].
HAVING READ THE INFORMATION ABOVE, YOU MUST DECIDE IF YOU WANT
TO PARTICIPATE IN THIS RESEARCH PROJECT. IF YOU DECIDE TO
PARTICIPATE, PLEASE CLICK ON THE LINK BELOW. YOU MAY PRINT A COPY
OF THIS LETTER TO KEEP.
The Auburn University Institutional Review Board has approved this document for use from
July 14, 2010 to July 13, 2011. Protocol #10-165 EX 1007.
http://www.surveymonkey.com/s/GWDS9VY