the relationship between immigration to australia and … · web viewthis is most likely a result...
TRANSCRIPT


ã Commonwealth of Australia 2016
Except for the Commonwealth Coat of Arms and content supplied by third parties, this copyright work is licensed under a Creative Commons Attribution 3.0 Australia licence. To view a copy of this licence, visit http://creativecommons.org/licenses/by/3.0/au. In essence, you are free to copy, communicate and adapt the work, as long as you attribute the work to the Productivity Commission (but not in any way that suggests the Commission endorses you or your use) and abide by the other licence terms.
Use of the Commonwealth Coat of ArmsFor terms of use of the Coat of Arms visit the ‘It’s an Honour’ website: http://www.itsanhonour.gov.au
Third party copyrightWherever a third party holds copyright in this material, the copyright remains with that party. Their permission may be required to use the material, please contact them directly.
An appropriate reference for this publication is:Breunig, R., Deutscher, N. and To, H.T. 2016, ‘The relationship between immigration to Australia and the labour market outcomes of Australian workers’, Technical Supplement A to the Productivity Commission Inquiry Report Migrant Intake into Australia, Canberra, April.
Publications enquiriesMedia and Publications, phone: (03) 9653 2244 or email: [email protected]
The Productivity Commission
The Productivity Commission is the Australian Government’s independent research and advisory body on a range of economic, social and environmental issues affecting the welfare of Australians. Its role, expressed most simply, is to help governments make better policies, in the long term interest of the Australian community.
The Commission’s independence is underpinned by an Act of Parliament. Its processes and outputs are open to public scrutiny and are driven by concern for the wellbeing of the community as a whole.
Further information on the Productivity Commission can be obtained from the Commission’s website (www.pc.gov.au).

The relationship between immigration to Australia and the labour market outcomes of Australian workers
Robert Breunig, Nathan Deutscher and Hang Thi To*Australian National University15 January 2016
Abstract
We examine the relationship between immigration to Australia and labour market outcomes of the Australian-born and previous immigrant cohorts. We use immigrant supply changes in skill groups — defined by education and experience — to identify the impact of immigration on the labour market. We find that immigrants flow into those skill groups that have the highest earnings and lowest unemployment. Once we control for the impact of experience and education on labour market outcomes, we find almost no evidence that immigration has harmed, over the decade since 2001, the aggregate labour market outcomes of those born in Australia (natives) as well as incumbents (natives and previous immigrants).
Keywords: immigration; Australia; native labour market outcomes; incumbent labour market outcomes.
JEL Codes: J21,J31,J61,F22
A.1 Introduction
The impact of immigration on Australians, particularly on their wages and their employment prospects, is a question that can provoke heated and emotional debate.
* We gratefully acknowledge financial support from the Productivity Commission in preparing this manuscript. This paper uses unit record data from the Household, Income and Labour Dynamics in Australia (HILDA) Survey. The HILDA Project was initiated and is funded by the Australian Government Department of Social Services (DSS) and is managed by the Melbourne Institute of Applied Economic and Social Research (Melbourne Institute). The findings and views reported in this paper, however, are those of the author and should not be attributed to either DSS, the Melbourne Institute or the Productivity Commission. All errors are those of the authors.
IMMIGRATION TO AUSTRALIA AND THE LABOUR MARKET OUTCOMES 1
Anecdote and visceral impressions can easily dominate either side of the public conversation. In this paper, we look carefully at the data to see if we can discern an effect of immigration on the labour market outcomes of Australian workers. We look at outcomes for two groups: those born in Australia (natives) as well as natives and previous immigrants (incumbents).
A standard competitive labour market model suggests that immigration should have a negative impact on wages. An influx of immigrants shifts the supply curve to the right, depressing wages. This simple theoretical model, however, may fail to capture a variety of other economic phenomena that may offset the negative wage effect.
One possibility is that the immigrant influx is part of a demand shift in the overall economy. The demand shift would have the effect of raising wages and could dominate the supply shift, resulting in higher wages for all. Another possibility is that immigrants may fill roles that would otherwise be unfilled (e.g. mine workers, nurses or fruit pickers) and the presence of these workers actually lifts the productivity (and wages) of incumbent workers in related employment. The supply of capital, the characteristics of these new workers and the structure of technology will all matter in determining the overall effect of immigration on wages across the economy.
Congruent with this muddy theoretical picture, the literature paints a very mixed picture of the effect of immigration on labour market outcomes of both natives and the broad group of incumbent workers. Early literature in the United States pointed towards very small effects of immigration on natives in that country (Friedberg and Hunt 1995 and Smith and Edmonston 1997). Using a novel approach that moved away from geographical identification and more towards skill-based identification, Borjas (2003) finds that the employment opportunities of US natives have been harmed by immigration. More recently, Ottaviano and Peri (2012) and Manacorda, Manning and Wadsworth (2012), extending and refining Borjas’ work, find evidence for varying effects across population subgroups in the US and UK respectively, with at times positive effects for native-born workers as a whole sitting alongside negative effects for less educated natives and past migrants.
The above papers differ in their assumptions about the changing nature of capital, the definition and size of skill groups and the substitutability of different types of labour. Varying these assumptions appears to have a significant impact on the measured effects of immigrants on labour market outcomes.
In this paper, we employ the approach of Borjas (2003). We divide the national labour market into skill groups based upon education and experience. We examine whether changes in the fraction of immigrants in skill groups are associated with labour market outcomes for those working in Australia, after controlling for other factors. There are two main advantages of our approach. First, it is data-driven and asks a simple correlation question in a non-parametric way. Second, it allows for geographic mobility in labour
2 MIGRANT INTAKE INTO AUSTRALIA – TECHNICAL SUPPLEMENT A

markets, which is ruled out in approaches that use the spatial distribution of immigrants for identification.
We take two distinct approaches to defining the distinction between immigrants and Australian workers, varying in their treatment of earlier migrants. This difference is important, since around one-quarter of the Australian population is born overseas.
We first define immigrants as anyone born outside of Australia and focus on the labour market outcomes of the Australian-born. We then consider the relationship between outcomes for incumbents (those born in Australia plus those who migrated to Australia five or more years previously) and recent (less than five years in Australia) migrants. We examine a variety of outcomes: weekly earnings, annual earnings, hourly wage, weekly hours worked, labour force participation and employment.
The analysis in this paper is restricted to considering effects of immigration on the labour market outcomes of Australian workers, not their welfare more broadly considered. Such an analysis is well beyond the scope of this paper.
We use three different data sets for our analysis. In one set of analysis we use the Australian Bureau of Statistics (ABS) series of Surveys of Income and Housing (SIH) to estimate the number of migrants and non-migrants in each skill group. We use the same data to measure the labour market outcomes of the Australian born. In a second set of analysis, we match census data to the Household, Income and Labour Dynamics in Australia (HILDA) survey. In this case we use HILDA to estimate many of the labour market outcomes of the Australian born but use complete census data to determine the number of migrants and non-migrants in different skill groups. Results across both sets of data are quite similar.
We find strong evidence of immigrant selection. That is, immigration flows into skill groups where wages and employment are high. This is most likely a result of both government policy and of the labour market decisions of immigrants. We find almost no evidence that outcomes for those born in Australia have been harmed by immigration, with the most statistically significant associations being with stronger labour market outcomes for the Australian born. For incumbents, we find a negative relationship between immigration and incumbent wages. However, this relationship is driven entirely by highly-educated female workers with 10 years or less experience. This effect disappears when we consider more precise skill groupings. Considered overall, the evidence suggests that incumbent labour market outcomes have been neither helped nor harmed by immigration.
In the next section, we discuss the definition of skill groups and the methodology that we use. In section 3, we present the data. Empirical results are in section 4. As is the case with all empirical work, the results are subject to certain caveats and these are discussed in detail in section 5. We also provide some conclusions in this last section.
IMMIGRATION TO AUSTRALIA AND THE LABOUR MARKET OUTCOMES 3

A.2 Methodology and related Australian literature
Our analysis examines the effect of immigration on labour market outcomes of Australian workers using the national labour market approach (e.g. Borjas, 2003, 2006). In our implementation of this approach, individuals are classified into five distinct educational groups:
high school dropouts (persons whose highest level of education was year 11 or below);
high-school graduates (persons whose highest level of education was year 12);
diploma graduates without year 12 education (persons who obtained a certificate or a diploma but did not complete year 12);
diploma graduates after completing year 12 (persons who obtained a certificate or a diploma after having completed year 12); and
university graduates (persons whose highest education was either a undergraduate or post-graduate degree, or a graduate diploma certificate, after having completed year 12).
Individuals are also classified into eight experience groups based on the number of years that have elapsed since the person completed school.1 We assume that the age of entry into the labour market is:
17 for a typical high school dropout;
19 for a typical high-school graduate as well as for a typical diploma graduate without year 12 education;
21 for a diploma graduate after completing year 12; and
23 for a typical university graduate after completing year 12.
The work experience is then given by the age of the individual minus the age at which the individual entered the labour market. We restrict our analysis to people who have between 1 and 40 years of experience and aggregate the data into eight experience groups with five-year experience intervals such as 1 to 5 years of experience, 6 to 10 years of experience, and so on.
The individual data is aggregated into different education-experience cells. For each of these cells, the share of immigrants in the population is given by:
pijt=M ijt
M ijt+N ijt
1 In essence, we measure potential experience. This will be different for people of the same age depending upon the age at which they finished their schooling/education. We refer to this as experience throughout.
4 MIGRANT INTAKE INTO AUSTRALIA – TECHNICAL SUPPLEMENT A

where Mijt is the number of immigrants in cell (i, j, t), and N ijt is the number of Australia- born individuals in cell (i, j, t).
We estimate the following specification:
y ijt=θpijt+si+x j+π t+(s¿¿ i× x j)+( s i× π t )+( x j × π t )+εijt ¿ (1)
where:
yijt is the mean value of a particular labour market outcome for Australia-born workers in cell (i, j, t);
si is a vector of dummy variables for education groups (i=1 to 5);
xj is a vector of dummy variables for experience groups (j=1 to 8);
π t is vector of dummy variables for time (5 time periods for the SIH data and 3 time periods for the matched HILDA / census data);
ε ijtis a normally distributed random error.
The model includes time dummies to account for changes in the macroeconomic environment that affect all groups. By including dummies for education and experience and their interaction, we account for the supply and demand factors specific to each skill group that determine the overall level of labour market outcomes for that skill group.2 Interacting education and experience with time dummies allows the profile of skill groups to evolve differently over time.
Identification in the model comes from changes within skill groups over time.3 Differences in the changes in the proportion of immigrants within cells are related to differential changes in labour market outcomes. The approach is non-parametric in the sense that we are allowing the data to relate changes in immigration to changes in labour market outcomes without imposing any structural restrictions on this relationship. (We do not estimate a wage equation, for example.) There is no need to control for other characteristics such as average occupation or industry within a cell since these effects and their evolution over time are perfectly captured by the fixed effects and the interactions.
One previous Australian paper used this approach. Bond and Gaston (2011) used only the HILDA data to assess the effects of immigration on weekly earnings and weekly hours worked of Australian-born workers. They found that immigrant share has a positive effects on Australian-born workers’ earnings and weekly hours worked. Their approach is flawed however because they used HILDA for both the outcome data and the immigrant share data.
2 These dummies allow the observed equilibrium outcomes to differ for each skill group. These observed equilibrium outcomes could be driven by both demand and supply factors.
3 Using a model specified in first-differences gives similar results for the key coefficient, . IMMIGRATION TO AUSTRALIA AND THE LABOUR MARKET OUTCOMES 5

Since HILDA is a panel with an initial sample chosen in 2001, there is no inflow of migrants into the sample.4 The year-on-year change in the share of immigrants in the HILDA sample is driven by two factors: differential sample attrition of migrants and non-migrants and a small number of migrants who join the sample because they partner with a continuing sample member (or join the HILDA sample through one of the other following rules of the data). Overall, population immigrant flows cannot be captured in any meaningful sense through this panel data set.
Sinning and Vorell (2011) investigate attitudes towards, and the effects of, immigration on the labour market and crime. They estimate the effect of immigration on SLA median income and unemployment and LGA crime rates. They use data from 1996, 2001 and 2006 Censuses and crime statistics. To address selection issues, they instrument immigration stock in a period with a counterfactual immigration stock created under the assumption that new immigrants settle according to the last-period distribution of immigrants. The second stage regressions include regional controls such as median age, population size, educational and occupational distributions and region and time fixed-effects. In neither of these preferred models is the immigration coefficient statistically significant. However, their instrument is weak, with a first stage F-statistic below 10 when both period and time fixed effects are included, clouding the interpretation of these results.
The geographic approach of Sinning and Vorell (2011) (and many others) has come under increasing attack since Borjas (2003). The approach assumes that geographic labour markets are fixed and distinct. Yet, we know that there are important movements of both firms and workers that tend to equalize economic conditions across cities and regions. In Australia, this trend is strongly seen in a shift of innovative activity and employment from Victoria and New South Wales to Queensland and Western Australia during the time of our data window.
Our approach allows for a national-level labour market but assumes no substitutability across skill groups. Essentially, we assume fixed and distinct labour markets defined by skill groups (rather than by sub-national geographic). Workers and firms are assumed to be unable to change the skill group in which they supply or demand labour in response to prices. Given that skill groups are defined broadly and in terms of experience and education levels that are not able to be altered by workers, this assumption seems less problematic than strict geographical segregation. Mobility across occupations, industries and regions does not affect identification. The restriction that workers compete in skill groups defined by education and experience is an important one and is discussed further in sections 4.1 and 5.
4 Prior to the top up sample in 2011.6 MIGRANT INTAKE INTO AUSTRALIA – TECHNICAL SUPPLEMENT A

A.3 Data
Our analysis is grouped into two parts. In the first part, we use data drawn from the SIH conducted by the ABS. We use data from five biennial surveys from 2003 to 2012. The survey collects information from usual residents of private dwellings in urban and rural areas of Australia, covering about 98% of all people living in Australia. Private dwellings are houses, flats, home units, caravans, garages, tents and other structures that were used as places of residence at the time of interview. Long-stay caravan parks are also included. These are distinct from non-private dwellings, such as hotels, boarding schools, boarding houses and institutions, whose residents are excluded. The SIH contains a wide range of information on demographic and economic characteristics of individuals and households.
In the second part of our analysis, we use data drawn from the Household, Income and Labour Dynamics in Australia (HILDA) combined with data from the Australian Census of Population and Housing (Census).
The HILDA survey is a household-based panel study that collects information on respondents’ economic and demographic characteristics. The wave 1 HILDA survey was conducted in 2001 and has been conducted annually since. The vast majority of data was collected through face-to-face interviews and a small fraction of the data was collected through telephone interviews. 13 969 people were interviewed in wave one from 7682 households. The survey has grown slightly over time as all individual sample members and their children are followed. The sample was replenished in wave 11 with a top-up sample of 4009 people added in the survey.
The Australian Population and Housing Censuses provide information on the number of people in each part of Australia, what they do and how they live. The data record the details of all people (including visitors) who spend the night in each dwelling on Census Night. Immigrants are included in the census provided that they intend to stay in Australia for at least one year. The census data thus excludes those who intend to stay in Australia for less than one year.5 Census data contains information on topics such as age, gender, education, birthplace and employment status of all people in Australia on Census Night.6
In the first part of our analysis, we estimate the model of equation (1) using SIH data for five financial years 2003–2004, 2005–2006, 2007–2008, 2009–2010, 2011–2012. We only use data from 2003 onwards. Survey years prior to 2003-04 group education in broader
5 We thank Jenny Dobak of the ABS for clarifying this.
6 We use the entire census data to construct the fraction of immigrants in each skill group. For 2006 and 2011, this data is available online through ABS table builder. For 2001, the data was constructed for us by the ABS and provided through the Productivity Commission. We thank Meredith Baker and Troy Podbury of the Productivity Commission and Steve Gelsi and Dominique O’Dea of the ABS for their assistance in procuring the data. We also thank Sharron Turner at ANU for her assistance in helping us to access ABS data.
IMMIGRATION TO AUSTRALIA AND THE LABOUR MARKET OUTCOMES 7

categories that are different than those used in 2003-04 and onwards. This makes it impossible for us to extend our chosen skill group definitions further back in time than 2003.
We estimate the model for six different dependent variables relating to the labour market outcomes of Australian-born workers: annual earnings from wage and salary, weekly earnings from wage and salary, log hourly wage rate, weekly hours worked, the labour force participation rate and the unemployment rate. The key explanatory variable of interest, the share of immigrants in each education/experience cell, is also extracted from the SIH as the survey samples, properly weighted, are representative cross-sections in each year.
In the second part, we estimate the model of equation (1) using HILDA data combined with complete Census data for 2001, 2006 and 2011. The explanatory variable of interest, the share of immigrants in each skill group, is extracted from Census data. For the dependent variables (labour market outcomes) we use the Census data for the unemployment rate and the labour force participation rate of Australian-born workers. Data for weekly hours worked, weekly and annual earnings (i.e. labour income) and hourly wage rates are extracted from HILDA data as Census data do not provide individual earnings in continuous values. We use cross-sectional weights from HILDA to make the cell means representative. The weighted and unweighted means are almost identical. The necessity of using immigrant share from Census data comes from the fact that the share of immigrants in HILDA is not an appropriate indicator for the changing immigrant share in Australia over time, as discussed above.
Descriptive statistics, from the SIH, of the main variables used in the analysis are provided in figures A.1 to A.6. Figure A.1 presents the migrant share for each education-experience cell, grouped by education category. For young people, migrant shares are relatively higher in groups with university education compared to groups without university education. This reflects the shift towards a higher skill requirement in Australian immigration policy in recent years as well as strong labour market demand in Australia for highly educated people.
Figure A.2 presents the mean values of annual earnings of Australian-born workers by education and experience, grouped by education category. With the same experience, annual earnings are higher for people with higher educational attainment. Annual earnings increase faster for the young. The effect of experience is smaller after 20 years of experience. For all groups we see the usual inverted U-shape earnings/experience profile.
8 MIGRANT INTAKE INTO AUSTRALIA – TECHNICAL SUPPLEMENT A

Figure A.1 Migrant share by Education and Experience: SIH
0.00
0.05
0.10
0.15
0.20
0.25
0.30
0.35
0.40
0.45
0.50
Year 11 Year 12 Diploma withoutyear 12
Diploma afteryear 12
UniversityProp
ortio
n o
mig
rant
s to
tota
l pop
ulat
ion
1-5 year experience 6-10 year experience 11-15 year experience 16-20 year experience
21-25 year experience 26-30 year experience 31-35 year experience 36-40 year experience
Figure A.2 Annual earnings of Australian born workers by education and experience: SIH
0
10000
20000
30000
40000
50000
60000
70000
80000
90000
Year 11 Year 12 Diploma withoutyear 12
Diploma afteryear 12
University
1-5 year experience 6-10 year experience 11-15 year experience 16-20 year experience
21-25 year experience 26-30 year experience 31-35 year experience 36-40 year experience
$ pe
r yea
r
IMMIGRATION TO AUSTRALIA AND THE LABOUR MARKET OUTCOMES 9

Figure A.3 shows the mean annual earnings of Australian born workers by education and experience, respectively. We see very strong returns to university education and again an inverted U-shape experience/earnings profile.
Figure A.3 Annual earnings of Australian born workers by education and experience groups
Education
0
10000
20000
30000
40000
50000
60000
70000
80000
High schooldropout
High schoolgraduate
Diplomagraduates
without year12
Diplomagraduates
after year 12
Universitygraduates
Total
$ pe
r ye
ar
Experience
0
10000
20000
30000
40000
50000
60000
70000
1-5years
6-10years
11-15years
16-20years
21-25years
26-30years
31-35years
36-40years
Total
$ pe
r yea
r
10 MIGRANT INTAKE INTO AUSTRALIA – TECHNICAL SUPPLEMENT A

Figure A.4 presents the unemployment rate of Australian born workers by education and experience groups. The figures show that the unemployment rate decreases with the level of education and with experience; the exception is slightly higher unemployment for those in the highest experience group.
Figure A.4 Unemployment rate of Australian born workers by education and experience groups
Education
0
1
2
3
4
5
6
7
8
9
High schooldropout
High schoolgraduate
Diplomagraduates
without year12
Diplomagraduatesafter year
12
Universitygraduates
Total
Per c
ent
Experience
0
1
2
3
4
5
6
7
8
9
1-5years
6-10years
11-15years
16-20years
21-25years
26-30years
31-35years
36-40years
Total
Per c
ent
IMMIGRATION TO AUSTRALIA AND THE LABOUR MARKET OUTCOMES 11

Figure A.5 presents migrant share by education and experience from the Census data and figure A.6 shows annual earnings by education and experience from HILDA. The overall impression provided by the two data sets is quite similar.
Figure A.5 Migrant share by education and experience, Census
0.0
0.1
0.2
0.3
0.4
0.5
0.6
1-5 years 6-10 years 11-15years
16-20years
21-25years
26-30years
31-35years
36-40years
Shar
e
Dropout Y12 Cert w/o Y12 Cert w Y12 Degree
12 MIGRANT INTAKE INTO AUSTRALIA – TECHNICAL SUPPLEMENT A

Figure A.6 Annual earnings by education and experience, HILDA
0
10,000
20,000
30,000
40,000
50,000
60,000
70,000
80,000
1-5 years 6-10 years 11-15years
16-20years
21-25years
26-30years
31-35years
36-40years
Inco
me
($)
Dropout Y12 Cert w/o Y12 Cert w Y12 Degree
Figures A.7 and A.8 show the distribution of changes over time in the key variable pijt in the two data sets — SIH and Census. The model is identified from these changes and the key empirical question is: are changes in the share of immigrants in total workers statistically related to labour market outcomes of Australian-born workers over the sample period? We can see that in both data sets, the changes in the share of migrants is centered around zero and is fairly small – while we do observe both positive and negative changes, this will limit our ability to detect any effect of immigration on labour market outcomes.
In the Census, we find that the average proportional change in migrant share (pooling across the two time periods) is 0.0022. The minimum is -0.07 and the maximum is .10. In the SIH, the average is slightly negative (-0.0049), the minimum is -0.13 and the maximum change is 0.18. The migrant share changes calculated from the SIH have a slightly higher variance than those calculated from the Census. In general, across both data sets, the larger changes are for the most highly educated groups who saw positive increases in the share of immigrants over time. The two groups with certificates (year 12 and no year 12) saw the largest decreases in immigrant share.
IMMIGRATION TO AUSTRALIA AND THE LABOUR MARKET OUTCOMES 13

Figure A.7 Distribution of migrant share changes between periods: SIH data
0
5
10
15
20
-0.2 -0.15 -0.1 -0.05 0 0.05 0.1 0.15 0.2
Figure A.8 Distribution of migrant share changes between periods: Census data
0
5
10
15
20
-0.2 -0.15 -0.1 -0.05 0 0.05 0.1 0.15 0.2
14 MIGRANT INTAKE INTO AUSTRALIA – TECHNICAL SUPPLEMENT A

A.4 Empirical results
We estimate models of the labour market outcomes of Australian-born workers (including annual earnings, weekly earnings, weekly hours worked, hourly wage rate, labour force participation, and unemployment rate) against the share of migrants with different specifications: (i) models that include only the time dummy variables; (ii) models controlling for all dummy variables including dummies for education groups, for experience groups, and dummies for time but without any interaction terms; (iii) models controlling for education, experience, time and the interactions between dummy variables that allow for changing skill premia over time.
We present weighted regressions using the weights defined as the number of Australian-born in each education-experience cell for whom the relevant outcome variable is defined. That is, we weight labour force participation regressions by the native population, unemployment regressions by the native labour force, and hours and earnings regressions by the number of natives employed. We also present unweighted estimates for comparison. In all of our models, we present standard errors that control for clustering on education-experience cells to allow for serial correlation in the estimates.
The results from SIH data are presented in tables A.1 and A.3 and results from HILDA wage and earnings data matched to census data for immigrant shares by experience/education cells are reported in tables A.2 and A.4. In our discussion of these results we begin with the broad, overarching story coming out of the coefficients, before turning to individual coefficients that may be of particular interest.
Empirical results: Survey of Income and Housing
Table A.1 presents the results for the full sample from the SIH. In the first row, we estimate a model that includes only time dummies and no controls for education or experience. Row two presents results where we add the controls for education and experience levels, but no interactions between the two. Row three presents the results when we add the full set of skill controls including interactions between education and experience and interactions with time which allow skill premia to vary across time. Unweighted estimates are provided in row four for comparison.
IMMIGRATION TO AUSTRALIA AND THE LABOUR MARKET OUTCOMES 15

Table A.1 Estimated values of θ from equation (1): SIH, full sample
Log annual earnings
Log weekly earnings
Log of wage rate
Weekly hours
Participation rate
Unemployment rate
Weighted, time dummies only
θ 1.879*** 1.650*** 1.510*** 7.480** 0.240* -0.205***
(0.360) (0.301) (0.231) (2.991) (0.120) (0.055)
Weighted, education, experience and time dummies but no interactions
θ -0.090 -0.086 -0.144** 0.089 0.108 -0.017
(0.143) (0.135) (0.068) (3.124) (0.111) (0.053)
Weighted; education, experience and time dummies and their interactions — preferred estimates
θ 0.175 0.021 -0.077 6.983 0.525** -0.021
(0.154) (0.169) (0.205) (4.190) (0.250) (0.043)
Unweighted; education, experience and time dummies and their interactions
θ .388** 0.179 0.035 8.549* .464** -0.035
(0.177) (0.186) (0.196) (4.662) (0.207) (0.04)
Note: *,**,*** indicate statistical significance at the 10%, 5%, and 1% significance level respectively.
The weighted estimates with a full set of shift and interaction dummies (row three) are our preferred model in all of the tables. We primarily discuss these weighted results.
For models that only include time dummies, we find a positive relationship (and statistically significant) between immigration and wages (measured as yearly earnings, weekly earnings or hourly wage) in the sense that more immigration is correlated with higher wages. Immigration is also correlated with higher labour force participation and lower unemployment.
For the models that include all dummy variables and their interactions, we find little statistical relationship between immigration and wages or other labour market outcomes (participation or unemployment). There does appear to be some small statistical association between immigration and a higher participation rate. This association is quite small. If the share of immigrants goes up by 1 percentage point (from say 20% to 21%), this is associated with a 0.5 percentage point increase in the participation rate. Recall from figure A.9 that the typical changes are very small — on the order of one percentage point.
Empirical results: HILDA combined with Census data
The results for the HILDA/Census data are quite similar (table A.2). We find a strong association between Australian-born labour market outcomes and immigrant shares when we do not control for different returns to experience and education. Once we include a full 16 MIGRANT INTAKE INTO AUSTRALIA – TECHNICAL SUPPLEMENT A

set of dummies, these associations disappear. We find no statistically significant associations.
Table A.2 Estimated values of θ from equation (1): HILDA and Census, full sample
Log annual earnings
Log weekly earnings
Log of wage rate
Weekly hours
Participation rate†
Unemployment rate†
Weighted, time dummies only
θ 2.016*** 1.821*** 1.686*** 4.682 0.241** -0.244***
(0.404) (0.337) (0.245) (4.193) (0.119) (0.066)
Weighted, education, experience and time dummies but no interactions
θ 0.210 0.455*** 0.243* 6.315 -0.007 -0.015
(0.185) (0.154) (0.130) (6.010) (0.089) (0.058)
Weighted; education, experience and time dummies and their interactions — preferred estimates
θ 0.267 0.752 0.612 11.349 0.074 0.076
(0.666) (0.607) (0.413) (14.997) (0.081) (0.047)
Unweighted; education, experience and time dummies and their interactions
θ -0.061 0.534 0.622 13.922 0.034 0.061
(0.714) (0.634) (0.476) (14.987) (0.071) (0.038)
Note: *,**,*** indicate statistical significance at the 10%, 5%, and 1% significance level respectively. †Calculated from Census; otherwise calculated from HILDA.
Overall, the results show strong evidence for migrant selection. We reach this conclusion because we observe that when we add no controls (except time dummies), there is a very strong positive association between labour market outcomes and immigration. This could lead one to erroneously conclude that immigrants are ‘causing’ positive labour market outcomes.
When we control for differential returns to experience and education and changes to those returns over time (by including the full set of education and experience dummy variables and their interactions), we find that the positive association disappears. The positive correlation observed in row 1 of tables A.1 and A.3 is thus ‘spurious’ in that what we are picking up is that immigrants are associated with high skill levels and labour market outcomes are also associated with high skill levels. Once we control for this association, the ‘causal’ effect of immigration on labour market outcomes (in row 3 of tables A.1 and A.3) becomes mostly statistically insignificant. Further, there is not a clear and consistent story looking at the signs and sizes of the coefficients – some are consistent with stronger labour market outcomes (higher wages, higher participation rates and hours and lower unemployment), and some with weaker labour market outcomes.
IMMIGRATION TO AUSTRALIA AND THE LABOUR MARKET OUTCOMES 17

Thus, migrants are flowing into those skill groups that have the highest earnings and the best employment opportunities. This is the result of government policy but also of the decisions by potential migrants, which determine which type of migrant comes to Australia.
Once we account for the differential returns to experience and education, we find no evidence across the sample that immigration is associated with worse labour market outcomes for Australian-born workers. In the SIH data, there is a small statistical association between immigration and a higher participation rate among Australian-born workers. This association is small in size and only significant at the 10 per cent level.
Empirical results: Separate estimation by male and female
Tables A.1 and A.2 pooled all individuals. We also re-estimate the models, splitting the sample by male/female. (See tables A.3 and A.4 for SIH and HILDA/Census, respectively.) In what follows, unless otherwise specified, we present results from our preferred specification where we control for a full set of dummies and interactions. The patterns that we observe in tables A.1 and A.2 — positive selection by immigrants when we do not control for returns to education and experience and weighted and unweighted estimates which are roughly similar — are repeated for all of our models. These full results are available from the authors upon request.
For males, in both data sets, we find no statistically significant association between immigration and labour market outcomes. In SIH, we find positive associations at the 10 per cent significance level between immigration and hours worked and labour force participation in the female sub-sample. Using the Census data, we find a positive association between immigration and the unemployment rate for females. More immigration seems related to more unemployment. The effect is significant at the 5 per cent level, but very small and only for females. If the share of immigrants goes up by 5 percentage points, the unemployment rate for females increases by about 0.6 percentage points. Note that we only find this effect in the Census data. The coefficient for females in the SIH data is actually negative, although not statistically significant.
The model of equation (1) imposes a constant response parameter, θ, across all experience and education groups. Given the large number of fixed effects in the model, it is not possible to estimate a model with a parameter that varies by skill group.
It may be that the labour market outcomes of different types of workers have different responses to immigration in which case the assumption of a constant response parameter would be incorrect. To test this hypothesis, at least somewhat, we estimate the model for a sub-population of people with experience less than or equal to 15 years. We again estimate models where we pool across all individuals as well as separately by male and female.
18 MIGRANT INTAKE INTO AUSTRALIA – TECHNICAL SUPPLEMENT A

The results are broadly consistent with what we find in the main sample. For the SIH (table A.3) the only statistically significant relationship that we find is for females. Specifically, we find that increased immigration is associated with decreased unemployment. If the share of immigrants goes up by 5 percentage points, this is associated with a drop in the unemployment rate for females of about 0.9 percentage points.
Table A.3 Estimated values of θ from equation (1): SIH, selected sub-samples
Log annual earnings
Log weekly earnings
Log of wage rate
Weekly hours
Participation rate
Unemployment rate
Males only
θ 0.064 0.064 0.068 -0.848 0.131 -0.037
(0.164) (0.181) (0.196) (3.226) (0.101) (0.051)
Females only
θ 0.155 0.153 -0.029 8.112* 0.209* -0.039
(0.184) (0.170) (0.203) (4.803) (0.104) (0.050)
All individuals with 15 years of experience or less
θ 0.247 -0.082 -0.254 3.465 0.175 -0.098
(0.332) (0.445) (0.406) (9.117) (0.207) (0.094)
Males with 15 years of experience or less
θ 0.298 0.240 0.359 -5.202 -0.049 0.033
(0.222) (0.278) (0.398) (3.885) (0.106) (0.087)
Females with 15 years of experience or less
θ 0.071 -0.122 -0.038 7.417 0.100 -0.189*
(0.348) (0.354) (0.586) (7.253) (0.160) (0.099)
Models include full set of time dummies, education and experience fixed effects and full set of interactions Note: *,**,*** indicate statistical significance at the 10%, 5%, and 1% significance level respectively.
In the combined HILDA / Census data (table A.4), we find no relationship between any of the earnings variables and immigration for this less experienced group. We do find a weak positive association between immigration and participation in the full sample of less experienced people. We again find a positive relationship between immigration and unemployment for females. Note the contrast with SIH where we find a negative relationship between immigration and unemployment for females.
IMMIGRATION TO AUSTRALIA AND THE LABOUR MARKET OUTCOMES 19

Table A.4 Estimated values of θ from equation (1): HILDA and Census, selected subsamples
Log annual earnings
Log weekly earnings
Log of wage rate
Weekly hours
Participation rate†
Unemployment rate†
Males only
θ 0.792 1.213 1.166 16.878 0.009 0.037
(0.814) (0.832) (0.704) (16.506) (0.053) (0.039)
Females only
θ -1.105 -0.486 -0.673 8.443 -0.033 0.112**
(0.784) (0.747) (0.531) (18.539) (0.092) (0.050)
All individuals with 15 years of experience or less
θ 0.038 0.593 0.230 -4.133 0.180* 0.167
(0.432) (0.504) (0.694) (24.168) (0.096) (0.110)
Males with 15 years of experience or less
θ 0.335 0.975 1.020 5.704 0.059 0.083
(0.841) (0.809) (0.735) (26.580) (0.076) (0.079)
Females with 15 years of experience or less
θ -0.691 -0.370 -0.773 -7.373 -0.002 0.256*
(1.295) (1.259) (0.840) (32.681) (0.101) (0.134)
Models include full set of time dummies, education and experience fixed effects and full set of interactions Note: *,**,*** indicate statistical significance at the 10%, 5%, and 1% significance level respectively.
†Calculated from Census; otherwise calculated from HILDA.
Empirical results: Incumbents
Throughout this paper so far, we have compared immigrants (as those born outside Australia) to those born in Australia. But Australia has a very large stock of immigrants who, while born outside of Australia, have lived in Australia for a long time. To check if our results are driven by how we classify individuals, we re-estimate the model comparing ‘incumbents’ to ‘recent immigrants’. We define incumbents as those born in Australia plus those who have migrated to Australia more than five years previously. ‘Recent immigrants’ are now defined as those who migrated to Australia within the last five years.
We estimate the labour market outcomes of incumbents as a function of the share of recent immigrants in overall population. Weights are now defined based upon the number of incumbents rather than the number of Australian-born. We only estimate models using the Census / HILDA data. In the SIH, we do not have precise enough information about year of arrival in Australia to distinguish between incumbents and recent arrivals. Results for
20 MIGRANT INTAKE INTO AUSTRALIA – TECHNICAL SUPPLEMENT A

the full sample are provided in table A.5. We show results without controls and with controls and weighted and unweighted for comparison with table A.2.
Table A.5 Estimated values of θ from equation (1): HILDA and Census, full sampleincumbents compared to recent immigrants
Log annual earnings
Log weekly earnings
Log of wage rate
Weekly hours
Participation rate†
Unemployment rate†
Weighted, time dummies only
θ 0.142 0.529 0.564 -0.411 0.915*** -0.116
(1.260) (1.116) (0.813) (14.295) (0.235) (0.079)
Weighted, education, experience and time dummies but no interactions
θ 0.211 0.141 -0.028 9.603 0.298** -0.434***
(0.316) (0.296) (0.287) (12.951) (0.132) (0.125)
Weighted; education, experience and time dummies and their interactions — preferred estimates
θ 0.437 0.519 -0.516 35.527 0.287** 0.101
(1.108) (1.024) (0.654) (31.419) (0.135) (0.095)
Unweighted; education, experience and time dummies and their interactions
θ -0.224 -0.049 -0.647 26.260 0.280* 0.111
(1.220) (1.181) (0.917) (32.177) (0.146) (0.084)
Note: *,**,*** indicate statistical significance at the 10%, 5%, and 1% significance level respectively. †Calculated from Census; otherwise calculated from HILDA
The only statistically significant effect we find is a positive association between the participation rate and immigration. If the share of recent immigrants goes up by 5 percentage points, this is associated with an increase in labour force participation of incumbents of about 1.4 percentage points. When we compare tables A.2 and A.5, it appears that the effect of selection is much stronger when we compare Australian-born to all immigrants than when we compare incumbents to recent immigrants. This is a somewhat counterintuitive result – more recent migrants might be expected to be more likely to enter strong labour markets. That said, the signs of the coefficients remain broadly consistent with positive selection.
We also split the samples by male and female. For males, none of the coefficients are statistically significant. For females, we find a positive association between recent immigration and incumbents’ weekly hours.7
7 These results are available from the authors.IMMIGRATION TO AUSTRALIA AND THE LABOUR MARKET OUTCOMES 21

Empirical results: overarching summary
Overall, across all of these estimates, our results indicate that immigration is higher into those skill groups (defined by education and experience) that have higher wages and better labour market prospects. This is consistent with immigrants coming to Australia with knowledge of where returns are high and is also consistent with selective migration policies.
Once we control for this selection into skill groups by immigrants, there is very little evidence of any negative labour market effects, in aggregate, on those born in Australia or the broader group of incumbents resulting from immigration.
Are immigrants and Australian-born workers in same skill groups comparable?
A key element of our model is the assumption that migrants and Australian-born workers compete within the same education/experience cells (skill groups). It could be that experience and education obtained outside of Australia has a lower value in the local labour market and that in fact migrants are competing with the Australian-born at lower levels of experience and education. This would mean that we have misclassified some individuals as competing in one skill group when they should actually be in another, lower skill group.
First, it is important to note that misclassification by itself poses no threat to our identification strategy. We identify the effects in the model from changes in the share of migrants. Mis-classification poses no problem unless the degree of misclassification is also changing over time.
Nonetheless, it is important to see if immigrants and Australian-born individuals within skill group cells look similar. In table A.6, we present the three most common occupations for migrants and natives by education and 10-year experience groupings. The two groups look very similar, particularly where levels of education are highest. If we think of anecdotes where overseas-trained doctors are driving taxis in Australia, this might be the group for whom we would worry the most about misclassification. Yet, the top three occupations are the same, and in the same order for both immigrants and Australian-born. Australian-born individuals with higher education are between 6 and 15 percentage points more likely to be professionals than comparable immigrants, so there is some evidence for higher occupational status for the highly educated if they are Australian-born. However, within our sample there is not evidence of large-scale occupational downgrading by migrants.
In tables A.7 and A.8, we present the Duncan index of dissimilarity comparing native and migrant occupational distributions (at the one digit level) holding either education
22 MIGRANT INTAKE INTO AUSTRALIA – TECHNICAL SUPPLEMENT A

(table A.7) or experience (table A.8) constant. This index captures the proportion of either group that would need to change occupations to make the two distributions equal. The more similar the occupational distributions, the smaller the index. We have highlighted the smallest values in each row and column.
The results are comforting in the sense that the occupational profiles of immigrants and natives are most similar within the same education-experience cell, in general. Within education groups, less experienced migrants look most similar to less experienced natives. However, highly experienced migrants look more similar to moderately experienced natives, so there may be some discount placed on overseas experience. Within experience groups, migrants almost always look most similar to natives with the same education.
Robustness check: broader skill classifications
As a final check on our classification of skill groups, we re-estimate all of the models with fewer education-experience cells. Some authors have argued that wider skill groups are better as the assumption of no competition across skill groups is more likely to hold when skill groups are more broadly defined. We re-estimate all the models using 12 groups — 3 educational groups (high school dropout; university graduates; all others) and 4 experience groups defined by 10 year groupings.8
The results are quite similar to those already presented.9 We begin by discussing the effect of immigration on outcomes for the Australian-born. For the SIH data, the only significant associations are a positive relationship between hours and immigration and a negative relationship between unemployment and immigration when we pool male and female together. The coefficients are 11.8 and -0.08 and are just significant at the 10% level. When we split the sample by sex we find no statistically significant coefficients. For the combined HILDA/Census data, we only find a statistically significant association between immigrants and the participation rate. The coefficient in the pooled sample is 0.40. We find a statistically significant estimate of .252 for males. We find no effect for females.
8 Figure A.3, the middle 3 educational categories which we have combined together have very similar average earnings.
9 For this reason we only discuss the results and do not present full tables. These are available from the authors upon request.
IMMIGRATION TO AUSTRALIA AND THE LABOUR MARKET OUTCOMES 23

Table A.6 Three most common occupations by skill group and migrant / Australian-born statusCalculated from 2011 Census data
Education Experience Top 3 professions (and fraction of workers in occupation)
Mig
rant
s
Dropout 1-10 years Labourers 0.285 Trades 0.191 Machinery 0.139Dropout 11-20 years Labourers 0.276 Machinery 0.185 Trades 0.160Dropout 21-30 years Labourers 0.235 Machinery 0.171 Clerical 0.154Dropout 31-40 years Labourers 0.233 Clerical 0.178 Machinery 0.160
Y12 1-10 years Sales 0.216 Community 0.183 Labourers 0.175Y12 11-20 years Clerical 0.174 Labourers 0.169 Trades 0.119Y12 21-30 years Clerical 0.202 Labourers 0.155 Managers 0.149Y12 31-40 years Clerical 0.203 Labourers 0.172 Managers 0.153
Cert w/o Y12 1-10 years Trades 0.410 Community 0.140 Labourers 0.121Cert w/o Y12 11-20 years Trades 0.374 Community 0.125 Clerical 0.102Cert w/o Y12 21-30 years Trades 0.323 Community 0.136 Managers 0.124Cert w/o Y12 31-40 years Trades 0.310 Community 0.133 Managers 0.125
Cert w Y12 1-10 years Trades 0.256 Community 0.178 Labourers 0.126Cert w Y12 11-20 years Trades 0.254 Professionals 0.152 Clerical 0.150Cert w Y12 21-30 years Trades 0.226 Professionals 0.169 Clerical 0.152Cert w Y12 31-40 years Trades 0.213 Professionals 0.185 Clerical 0.150
Degree 1-10 years Professionals 0.511 Clerical 0.139 Managers 0.094Degree 11-20 years Professionals 0.537 Managers 0.166 Clerical 0.117Degree 21-30 years Professionals 0.528 Managers 0.189 Clerical 0.110Degree 31-40 years Professionals 0.554 Managers 0.177 Clerical 0.105
Aus
tral
ian
born
Dropout 1-10 years Trades 0.249 Labourers 0.229 Sales 0.155Dropout 11-20 years Labourers 0.220 Machinery 0.192 Clerical 0.141Dropout 21-30 years Clerical 0.211 Labourers 0.182 Machinery 0.163Dropout 31-40 years Clerical 0.239 Labourers 0.177 Machinery 0.151
Y12 1-10 years Sales 0.255 Community 0.174 Clerical 0.162Y12 11-20 years Clerical 0.249 Managers 0.160 Sales 0.130Y12 21-30 years Clerical 0.294 Managers 0.191 Sales 0.115Y12 31-40 years Clerical 0.293 Managers 0.213 Professionals 0.107
Cert w/o Y12 1-10 years Trades 0.482 Community 0.105 Clerical 0.094Cert w/o Y12 11-20 years Trades 0.386 Managers 0.116 Clerical 0.108Cert w/o Y12 21-30 years Trades 0.310 Managers 0.146 Clerical 0.132Cert w/o Y12 31-40 years Trades 0.282 Managers 0.143 Clerical 0.139
Cert w Y12 1-10 years Trades 0.288 Clerical 0.175 Community 0.168Cert w Y12 11-20 years Trades 0.247 Clerical 0.186 Managers 0.147Cert w Y12 21-30 years Professionals 0.209 Clerical 0.179 Managers 0.175Cert w Y12 31-40 years Professionals 0.283 Managers 0.180 Clerical 0.161
Degree 1-10 years Professionals 0.655 Managers 0.112 Clerical 0.101Degree 11-20 years Professionals 0.601 Managers 0.199 Clerical 0.096Degree 21-30 years Professionals 0.621 Managers 0.212 Clerical 0.083Degree 31-40 years Professionals 0.643 Managers 0.198 Clerical 0.077
24 MIGRANT INTAKE INTO AUSTRALIA – TECHNICAL SUPPLEMENT A
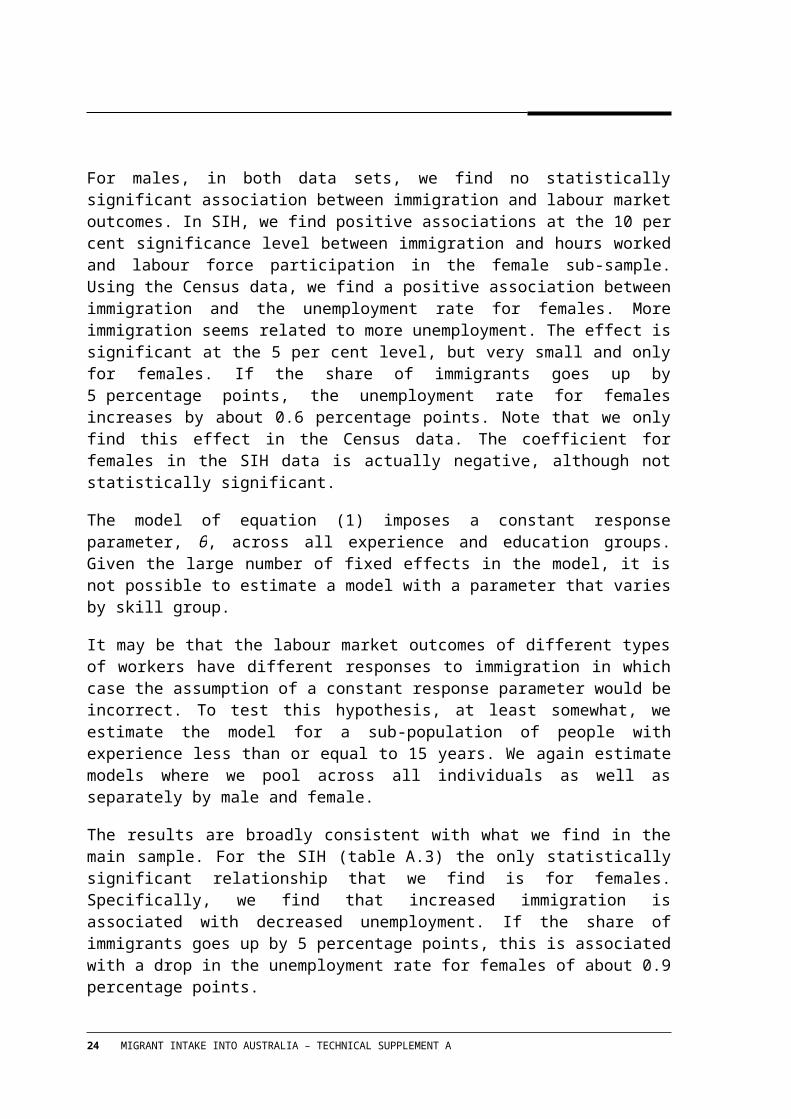
Table A.7 Duncan index of dis-similarity for Australian-born and immigrant workers calculated from 2011 Census dataholding education constant
Experience of corresponding immigrant group
Education-experience of native group 1-10 years 11-20 years 21-30 years 31-40 years
High school dropouts1-10 years 0.097 0.182 0.197 0.20911-20 years 0.173 0.097 0.040 0.06321-30 years 0.240 0.195 0.107 0.08131-40 years 0.261 0.225 0.137 0.108
Year 121-10 years 0.099 0.244 0.266 0.28211-20 years 0.271 0.148 0.104 0.12121-30 years 0.332 0.209 0.169 0.18831-40 years 0.354 0.222 0.183 0.197
Certificate (w/o Year 12)1-10 years 0.082 0.122 0.175 0.18611-20 years 0.108 0.057 0.080 0.09121-30 years 0.172 0.094 0.041 0.03531-40 years 0.195 0.119 0.056 0.040
Certificate (w Year 12)1-10 years 0.114 0.132 0.168 0.19911-20 years 0.198 0.080 0.078 0.10121-30 years 0.294 0.150 0.108 0.10531-40 years 0.355 0.211 0.163 0.146
Degree1-10 years 0.161 0.122 0.138 0.11611-20 years 0.195 0.096 0.083 0.06921-30 years 0.228 0.130 0.116 0.10231-40 years 0.236 0.138 0.124 0.110
Numbers in table indicate the proportion of individuals who would have to change occupation to make the occupational distribution identical for two groups. Highlighted cells are the lowest – indicating the most similar distributions – in their row or column.
IMMIGRATION TO AUSTRALIA AND THE LABOUR MARKET OUTCOMES 25

Table A.8 Duncan index of dis-similarity for Australian-born and immigrant workers calculated from 2011 Census dataholding education constant
Education of corresponding immigrant group
Education-experience of native group
High school
dropout Year 12
Certificate (w/o
Year 12)Certificate
(w Year 12) Degree
1-10 yearsHigh school dropout 0.097 0.252 0.246 0.200 0.585Year 12 0.324 0.099 0.305 0.187 0.488Certificate (w/o Year 12) 0.328 0.399 0.082 0.227 0.550Certificate (w Year 12) 0.353 0.280 0.220 0.114 0.427Degree 0.711 0.640 0.668 0.622 0.161
11-20 yearsHigh school dropout 0.097 0.155 0.346 0.332 0.568Year 12 0.345 0.148 0.331 0.270 0.441Certificate (w/o Year 12) 0.315 0.275 0.057 0.175 0.537Certificate (w Year 12) 0.387 0.223 0.225 0.080 0.422Degree 0.685 0.566 0.632 0.536 0.096
21-30 yearsHigh school dropout 0.107 0.112 0.349 0.346 0.556Year 12 0.324 0.169 0.325 0.275 0.421Certificate (w/o Year 12) 0.319 0.241 0.041 0.119 0.492Certificate (w Year 12) 0.374 0.258 0.242 0.108 0.333Degree 0.696 0.594 0.623 0.524 0.116
31-40 yearsHigh school dropout 0.108 0.096 0.354 0.346 0.564Year 12 0.304 0.197 0.324 0.275 0.447Certificate (w/o Year 12) 0.324 0.252 0.040 0.103 0.493Certificate (w Year 12) 0.388 0.306 0.283 0.146 0.271Degree 0.703 0.614 0.622 0.512 0.110
Numbers in table indicate the proportion of individuals who would have to change occupation to make the occupational distribution identical for two groups. Highlighted cells are the lowest — indicating the most similar distributions — in their row or column.
Interestingly, we find stronger effects when we consider broad skill groupings for incumbents, but the results are inconclusive on the question as to whether immigration leads to stronger or weaker labour market outcomes for incumbents (See table A.9.) We find a negative association between incumbent wages and the fraction of recent immigrants. We find statistically significant positive associations between immigration and weekly hours worked and participation. The fraction of recent immigrants is significant at the 5% level for participation, but only at the 10% level for wages and weekly hours. The
26 MIGRANT INTAKE INTO AUSTRALIA – TECHNICAL SUPPLEMENT A

wage and hours effects are fairly strong. If the share of recent immigrants goes up by 1 percentage point, this is associated with a drop in wages of 2.6 per cent, an increase in weekly hours of 32 minutes and an increase in the participation rate of one-half of one percentage point.
When we split the sample by sex (table A.9) we again find mixed results. For males we find a positive association between recent migration and the participation rate but also a positive association with the unemployment rate. The wage and hours effects from the pooled sample are concentrated amongst female workers — for men the effects are smaller and not statistically different from zero.
Table A.9 Estimated values of θ from equation (1): HILDA and Census (incumbents compared to recent immigrants); Broad experience groups and education categories3 education categories and 4 experience categories
Log annual earnings
Log weekly earnings
Log of wage rate
Weekly hours
Participation rate†
Unemployment rate†
All incumbents
θ 0.618 0.307 -2.587* 53.607* 0.580** 0.257
(1.104) (1.082) (1.243) (29.675) (0.235) (0.153)
Males only
θ 0.430 0.371 -0.266 33.002 0.366* 0.306**
(1.944) (2.170) (1.596) (50.258) (0.186) (0.120)
Females only
θ 1.226 0.444 -5.471*** 91.568*** 0.440 0.130
(1.999) (1.815) (1.452) (24.716) (0.338) (0.340)
Models include full set of time dummies, education and experience fixed effects and full set of interactions Note: *,**,*** indicate statistical significance at the 10%, 5%, and 1% significance level respectively. †Calculated from Census; otherwise calculated from HILDA.
It is important to note that the negative wage effect in the pooled sample is also very fragile and driven by one skill group: degree holders with 1-10 years of experience. If we add a dummy variable for that group (or drop them from the analysis), the coefficient on immigrant share in the wage regression becomes positive, 0.5376, but insignificant. Between 2001 and 2011, this group of individuals had lower wage growth than expected but this could plausibly be for other reasons, such as differential effects of the Global Financial Crisis or the mining boom across education-experience groupings.10
10 For example, either the mining boom or Global Financial Crisis could have plausibly eroded the wages of young university graduates, relative to other workers with little experience or university graduates well into their careers through rapid wages growth for trades or limited employment growth in traditionally
IMMIGRATION TO AUSTRALIA AND THE LABOUR MARKET OUTCOMES 27

A priori, it is difficult to say whether the more narrow skill groups or the broader skill groups provide better estimates. Comparing table A.2 to table A.9, we can see that the standard errors are two to three times larger when we use the broader groups and the incumbent sample. The broader groups will provide more imprecise estimates and potentially more volatile estimates since we are estimating on a much smaller effective sample size. The narrower groups will give biased estimates if skill groups are too narrowly defined and if there is leakage and competition across skill groups. As others in the literature have pointed out, the results do depend upon the definition of skill groups.
A.5 Discussion and conclusion
In this paper we use a simple and data driven approach to address whether or not the labour market outcomes of the Australian-born and incumbents are related to patterns of migration. We do this by constructing skill groups which are defined by education and years of (potential) experience. We look at whether changes in the share of immigrants in these cells over time is related to changing labour market outcomes for the Australian-born and incumbents. We control for a variety of fixed effects as well as macroeconomic conditions and we allow the return to skills to vary over time.
Overall, and looking across the full suite of our results, we find little evidence that the labour market outcomes of Australian-born workers are negatively related to immigration. The few statistically significant associations we do find are inconclusive, and cover both stronger and weaker labour market outcomes. They may arise simply from statistical chance or reflect the influence of omitted variables on relative labour market outcomes of education-experience cells over time. Moreover, these associations are economically small and only just statistically significant, so the evidence is scant. Our results are consistent across two very different data sets.
We do find some negative effects of recent migrants (those who arrived in Australia in the last five years) on employment and wage of incumbents (Australian-born and immigrants who have resided in Australia for more than five years) when we consider very broadly defined skill groups. However, we also find positive associations between recent migration and weekly hours and labour force participation of incumbents.
The approach that we use has an advantage over approaches that use the uneven geographical spread of immigrants to identify the impact of immigration on labour market outcomes. In those approaches, geographical labour markets are assumed to be distinct and movement between labour markets which might be driven by differences in employment opportunities and wages are ruled out. In Australia, this looks like a very bad assumption given the large flows of workers from one state to another which we observed during the mining boom which took place during our data period, 2001–2011.
well-paid graduate jobs.28 MIGRANT INTAKE INTO AUSTRALIA – TECHNICAL SUPPLEMENT A

The disadvantage of our approach is that we assume that each skill group (defined by education and experience) is an individual labour market and that there is no substitutability of workers across different labour markets. Specifically, the approach is assuming that the arrival of immigrants in one skill group is not causing Australian-born or incumbent workers to move to competing in another skill group. Given that skill groups are defined on relatively immutable categories, education and potential experience, this seems less problematic than the geographical assumption.
Our results are dependent both upon the immigration policies in place during the period 2001–2012 and the overall economic conditions. As we are estimating over a period of very robust economic growth, it is perhaps not surprising that we find very little negative impact of immigration on natives and incumbents. It could be that in periods of slow growth or contraction there are negative effects, but we would not be able to identify these in our data. Given that our approach is non-parametric and data-driven, our results are dependent upon policy settings. The results do not give any insight into how different policies might affect the relationship between immigration and labour market outcomes of the Australian-born and incumbents.
One reason why we may fail to find statistically significant results is that the amount of variation in immigrant shares in our data is pretty small. Recalling figures A.9 and A.10, most of the skill groups show little or no change in the proportion of immigrants over time. A longer time window and more variability in immigration would assist in identification — as available in the original Borjas (2003) paper — but we do not currently have either of these things.
Our data does not account for short-term migrants. They are absent in the census data by construction. In the SIH, they would only be counted if they were living in private dwellings. If short-term migrants are living in hostels or other non-private dwellings, they will not be in our data. While this group may be important for certain low-skill jobs in the economy, the results across all skill groups should not be substantially impacted by their absence.
Throughout, we have discussed changes in the percentage of migrants in skill groups as being related to in-flows of migration. But, they can also be related to outflows. Immigrant shares in skill groups can drop if Australian-born workers are out-migrating even in the absence of any change in immigration. Our intuition, again, is that this is not an important determinant of the results. Out-migration has been important in highly skilled groups in Australia, but less so during the economic boom of the 2000s. For most groups, in-migration dominates out-migration and it is this effect that we are mostly capturing.
IMMIGRATION TO AUSTRALIA AND THE LABOUR MARKET OUTCOMES 29

Despite these caveats, the paper provides important new information about the relationship between immigration and the labour market outcomes of the Australian-born and incumbents at an aggregate level. If there were strong negative effects, the approach used here should reveal a more consistent picture — in the signs, sizes and statistical significance of the coefficients. The fact that we find associations with both stronger and weaker labour market outcomes, with the few results that are statistically significant relatively sensitive to assumptions such as the classification of skill groupings, suggests that, at least at the level of the overall economy and the vast majority of workers, immigration does not appear to have been a major factor in the labour market outcomes of the Australian-born and previous immigrant cohorts over the period studied.
ReferencesBond, M., and Gaston, N. 2011, ‘The impact of Immigration on Australian-born workers:
An assessment using the National Labour Market Approach’, Economics Papers, vol. 30, no. 3, pp. 400–13
Borjas, G. J. 2003, ‘The Labor Demand Curve Is Downward Sloping: Reexamining the Impact of Immigration on the Labor Market’, The Quarterly Journal of Economics, vol. 118, no. 4, pp. 1335–74.
Borjas, G. J. 2006, ‘Native Internal Migration and the Labor Market Impact of Immigration’, Journal of Human Resources, vol. 41, no. 2, pp. 221–58.
Duncan, O. B. and Duncan, B. 1955, ‘Residential Distribution and Occupational Segregation’, American Journal of Sociology, vol. 60, no. 5, pp. 493–503.
Friedberg, R. M., and Hunt, J. 1995, ‘The Impact of Immigrants on Host Country Wages, Employment and Growth’, The Journal of Economic Perspectives, pp. 23–44.
Manacorda, M., Manning, A., and Wadsworth, J. 2012, ‘The Impact of Immigration on the Structure of Wages: Theory and Evidence from Britain’, Journal of the European Economic Association, vol. 10, no. 1, pp. 120–51.
Ottaviano, G. I., and Peri, G. 2012, ‘Rethinking the Effect of Immigration on Wages’, Journal of the European Economic Association, vol. 10, no. 1, pp. 152–97.
Sinning, M. and Vorell, M. 2011, ‘People’s Attitudes and the Effects of Immigration to Australia’, Ruhr Economic Papers 0271, Rheinisch-Westfälisches Institut für Wirtschaftsforschung, Ruhr-Universität Bochum, Universität Dortmund, Universität Duisburg-Essen.
Smith, J. P., and Edmonston, B. (eds.) 1997, The new Americans: Economic, demographic, and fiscal effects of immigration, National Academies Press.
30 MIGRANT INTAKE INTO AUSTRALIA – TECHNICAL SUPPLEMENT A