immigration policy and the skills of immigrants to ... · immigration policy and the skills of...
TRANSCRIPT
Immigration Policy and the Skills of Immigrants toAustralia, Canada, and the United States
Heather AntecolDepartment of EconomicsIllinois State UniversityNormal, IL 61790-4200
Deborah A. Cobb-ClarkNational Centre for Development Studies
andEconomics Program
Research School of Social SciencesThe Australian National University
Canberra, ACT 0200, [email protected]
Stephen J. TrejoDepartment of Economics
University of TexasAustin, TX 78712-1173
March 2000
I. Introduction
Australia, Canada, and the United States share a common history as major
immigrant-receiving countries.1 In this paper, we compare the observable skills—
language fluency, education, and income—of immigrants to these three countries. These
countries provide fertile ground for comparative analysis because although their economies
are similar in many fundamental respects, labor market policies and institutions differ
markedly, and this institutional variation provides a promising avenue for identifying the
labor market effects of government policy. In addition, high-quality census microdata are
available for each of these countries making it possible to conduct detailed and
comparable analyses of labor market outcomes.
The topic of immigration is especially ripe for such a comparative analysis,
because this is an area where researchers and policymakers in the United States could
learn a great deal from the experiences of Australia and Canada. Of particular interest are
the attempts Australia and Canada have made to screen for workers with special skills or
high levels of education (Boyd 1976; Price 1979; Green and Green 1995). These attempts
run counter to the family reunification emphasis of U.S. immigration policy. In the United
States, concerns have arisen over the declining education and skill levels of successive
immigrant waves (Borjas 1995). Such concerns are reflected in provisions of the
Immigration Act of 1990 that seek to increase the share of immigrants admitted on the basis
of their work skills, and these concerns have also prompted proposals to introduce more
explicitly skill-based admissions criteria like those used in Australia and Canada. Before
pushing ahead with this kind of immigration reform, however, it would be prudent to
1 During the period 1975-80, for example, nearly two-thirds of all immigrants chose one of these three countries
as their destination (Borjas 1991). More recently, other countries have emerged as important immigrant destinations, but
2
consider the consequences of such policies in Australia and Canada.
Furthermore, even if we put aside differences in immigration policy, structural and
institutional differences in the labor markets of the three countries are likely to influence
the type of immigrants who are attracted to each destination. For a number of reasons
(stronger labor unions, higher minimum wages, national health insurance, more generous
unemployment insurance and welfare systems), workers in the lower end of the income
distribution are generally better off in Australia and Canada than in the United States,
especially relative to the average worker in each country (Card and Freeman 1993;
Gregory and Daly 1994). Furthermore, although all three countries have experienced
widening income inequality over the past two decades, in the United States real incomes
have fallen sharply for low-skill workers, whereas in Australia and Canada the
corresponding decline in the bottom half of the income distribution has been much more
modest (Freeman and Katz 1994). A comparative analysis may therefore shed light on how
ongoing changes in the U.S. wage structure will affect the skill composition of the
immigrant flows that the United States attracts and how these immigrants are likely to fare
in the U.S. labor market.
To illustrate our strategy, consider the question of which country should attract the
most skilled immigrant flow. On the one hand, the Australian and Canadian practice of
admitting a large fraction of immigrants through a “point system” that screens for labor
market skills suggests that these countries should receive a more skilled immigrant flow
than the United States. On the other hand, the theory of selective migration (Borjas 1991)
predicts that the generous redistribution systems and relatively egalitarian wage structures
Australia, Canada, and the United States remain dominant receiving countries.
3
in Australia and Canada work in the opposite direction by attracting less skilled
immigrants who will reside in the bottom half of the income distribution. On the surface,
then, it is difficult to determine how differences in immigration policies and government
institutions across countries should affect the selectivity of immigration flows to the three
destination countries.
To a large extent, however, the immigration point systems employed in Australia
and Canada select immigrants based on easily observed characteristics such as age,
education, language, and occupation. In terms of these characteristics, immigrants to
Australia and Canada should be more productive than those migrating to the United States.
Our tests of this hypothesis will reveal how successful immigration point systems are, in
practice, at selecting immigrants with favorable skill measures, and how much this
screening process raises the labor market productivity of immigrant workers.2
Interestingly, the opposite pattern should emerge if we first control for the
characteristics that immigrant point systems screen on. In particular, among immigrants
with similar observable skill measures, the most productive should locate in the United
States where there is less social insurance against poor labor market outcomes but a
greater individual return to favorable outcomes. Our tests of this hypothesis will indicate
to what extent immigrant locational choices based on difficult-to-observe attributes, such
as ability and ambition, are able to undo the selectivity intended by point systems.
Alternatively, a finding that Australian and Canadian immigrants are superior to U.S.
2 For several reasons, it is not a foregone conclusion that the Australian and Canadian systems lead to an
immigrant flow that is highly selective in terms of characteristics associated with labor market success. First, both systemsadmit many immigrants who are not screened by a points test, including applicants with immediate family who are citizensof the destination country, refugees, and the family members who accompany those admitted by a points test. Second,both systems award a significant number of points based on a “personal assessment” of the applicant by the immigrationofficial conducting the face-to-face interview. Finally, Reitz (1998) argues that the Australian and Canadian point systemscan be passed by applicants with quite modest skill levels, and therefore these systems may provide only very weak filters
4
immigrants in terms of unobservable as well as observable determinants of earnings would
suggest that the “personal assessment” portion of a point system successfully screens for
some of the difficult-to-observe attributes related to labor market productivity.
II. Immigration Policy in Australia, Canada, and the United States
Tables 1 and 2 present an overview of the immigrant admissions policies of
Australia, Canada, and the United States as of around 1990.3 Table 1 provides a brief
outline of the main components of admissions policies in the three countries, and Table 2
reports the percentages of immigrants who entered under various broad admission
categories. Our primary goal is to show that a much larger share of Australian and
Canadian immigrants are admitted on the basis of their labor market skills than is the case
for U.S. immigrants.
In Australia and Canada, so-called “independent” migrants without relatives in the
destination country can gain admission by passing a “points test” that takes into account
factors such as the applicant’s age, education, language ability, and occupation. Some
applicants with relatives in the destination country are also evaluated by a points test, with
the number of points required for admission lowered when the family relationship is
sufficiently close.4 In addition, immigrants can be admitted because they possess special
talents or because they meet certain investment requirements and intend to establish a
business in Australia or Canada. Immigrants entering Australia or Canada through any of
the avenues just described are categorized as “skilled” immigrants in Table 2, because the
for immigrant labor market skills.
3 For detailed discussions of immigration policy in these three countries, see Boyd (1976), Briggs (1984),Chiswick (1987), Borjas (1988), Vialet (1989), Cobb-Clark (1990), Reimers and Troper (1992), Green (1995), Green andGreen (1995), Lack and Templeton (1995), and Reitz (1998).
4 Immigrant admissions categories in which entry is determined jointly by a points test and by family relationshipsinclude the “concessional” category in Australia and the “assisted relatives” category in Canada.
5
human capital and potential labor market success of these applicants play a key role in
their admission. In contrast, “family” immigrants consist of those applicants admitted
solely on the basis of having an immediate relative in the destination country, and
“refugees” are immigrants fleeing political persecution who are admitted on humanitarian
grounds.
U.S. admissions policy distinguishes between two types of family immigrants.
“Numerically unlimited” family immigrants are the immediate relatives of U.S. citizens
who enter without counting against the overall cap set for annual immigrant admissions.
“Numerically limited” family immigrants are the more distant relatives of U.S. citizens and
the immediate relatives of U.S. permanent residents who, in 1990, entered under one of the
relevant preference categories (first, second, fourth, or fifth) that regulated admissions
subject to the annual cap.5 In Table 2, we label U.S. immigrants entering under the third or
sixth preference categories as “skilled” immigrants, because only these immigrants were
admitted on the basis of their occupation or labor market skills.
The data assembled in Table 2 show that labor market skills play a much larger
role in the immigrant admission policies of Australia and Canada than that of the United
States. Around 1990, half of Australian immigrants and almost 40 percent of Canadian
immigrants were admitted because of their labor market skills, whereas less than 10
percent of U.S. immigrants gained entry in this way.6 Conversely, two-thirds of U.S.
5 Rather than ranking family- and skill-based immigrants under a single preference system, the 1990 Immigration
Act, established a three-track preference system for family-sponsored, employment-based, and diversity immigrants(Vialet and Eig, 1990). Our data pre-date this change in policy, however.
6 In Table 2, the “skilled” category includes the immediate family members who accompany those admitted onthe basis of their labor market skills. Therefore, these figures overstate the number of immigrants granted entry becauseof their own skills rather than family relationships, but adjusting for this feature of the reported data would not alter theconclusion that the skilled category constitutes a much larger share of immigrant admissions in Australia and Canada thanin the United States. In addition, the data in Table 2 pertain only to legal admissions. The sizeable and largely unskilledflow of undocumented immigration to the United States implies that the share of all U.S. immigrants admitted because of
6
immigrants were admitted on the basis of their family relationships, as compared with only
a quarter of Australian immigrants and 37 percent of Canadian immigrants. The relative
importance of skilled versus family migration varies somewhat across immigrant regions
of origin, but for all source regions the share of skilled immigrants is much higher and the
share of family immigrants is much lower in Australia and Canada than in the United
States.
Table 2 describes immigrant admissions in the three countries as of around 1990,
but the same basic pattern existed throughout the 1970s and 1980s, when most of the
immigrants we analyze below arrived in their destinations. Since the 1965 Amendments to
the Immigration and Nationality Act, the skilled category has made up a very small
percentage of the U.S. immigration flow (Reitz 1998). Point systems for screening a
substantial portion of immigrant applicants were introduced in Canada in the late 1960s
and in Australia in the early 1970s (Green and Green 1995; Reitz 1998). Although the
fraction of immigrants admitted under a point system in these countries has varied over
time, particularly for Canada, throughout this period the percentage of admissions based on
labor market criteria has remained much higher in Australia and Canada than in the United
States (Wright and Maxim 1993; Reitz 1998).
III. Data
We analyze individual-level data from the 1991 Australian and Canadian censuses
and the 1990 U.S. census. These censuses provide comparable data on demographic
characteristics and labor force behavior, as well as the requisite information on country of
their skills is even lower than Table 2 suggests.
7
birth and year of arrival for immigrants.7 The Australian data set constitutes a one- percent
sample of the population, the Canadian data set is a three-percent sample, and the U.S. data
set is a five-percent sample.8 These data sources supply detailed information on many
thousands of individuals in each destination country. Such large samples are essential for
empirical analyses of immigrants, because immigrants typically constitute a small fraction
of the total population, and it is important to disaggregate the immigrant population
according to variables such as year of arrival and country of origin.
We restrict our analysis to men between the ages of 25 and 59 who are not
institutional residents. We exclude women in order to minimize biases arising from
selective labor force participation, and we choose this age range so as to focus on men
who have completed their formal schooling and who have a strong attachment to the labor
market. Often, we compare outcomes for immigrants with those for natives who reside in
the same destination country. In this way, natives can serve as a control for cross-country
differences in social or economic conditions or in how the census data were collected. To
increase comparability of the native samples and improve their usefulness as a control
group, we exclude non-whites from the native (but not the immigrant) samples.9 Finally,
residents of the Atlantic Provinces and the Territories are excluded from the Canadian
samples, because for these individuals the information about country of birth and year of
7 In this paper, we use the term “immigrant” as synonymous with foreign-born individuals, in contrast to the
official terminology used by the U.S. Immigration and Naturalization Service in which immigrants are legal permanentresidents, and other foreigners such as tourists, business travelers, and recent refugee arrivals are “nonimmigrant aliens.” The census data analyzed here cannot make such distinctions among foreign-born individuals.
8 The U.S. sample is much larger than the other two samples. To lighten the computational burden, we employa .1 percent (or 1 in a 1000) sample of U.S. natives, but we use the full 5 percent sample of U.S. immigrants, and we usethe full samples of natives and immigrants available in the Australian and Canadian data. The Australian and Canadiancensus data are self-weighting, whereas the 1990 U.S. census provides sampling weights that we use in all of thecalculations reported in the paper.
9 In particular, we exclude blacks, Asians, Hispanics, and aboriginals from the native sample for each destinationcountry.
8
immigration is not reported in sufficient detail.
These restrictions produce final samples of immigrant men totaling approximately
11,500 for Australia, 38,600 for Canada, and 297,000 for the United States. For each
destination country, Table 3 displays the region of birth distribution for the immigrants in
our samples who arrived within ten years of the census. The most striking difference in the
national origin composition of recent immigrants to the three countries involves Latin
America. Almost half of post-1980 immigrants to the United States hail from Central or
South America (including Mexico and the Caribbean), whereas only 14 percent of
Canadian immigrants and 2 percent of Australian immigrants come from this region. In
addition, the United States receives relatively fewer immigrants from the United Kingdom
and Europe than do the other countries: immigrants from these regions comprise 11
percent of the U.S. immigration flow as compared to 26 percent of the Canadian flow and
33 percent of the Australian flow.10 Another difference is that Asians make up a somewhat
larger share of the immigrant flow to Australia (36 percent) and Canada (40 percent) than
to the United States (28 percent). Lastly, note that Australia receives a sizeable number of
immigrants from New Zealand.
In the sections that follow, we examine in turn three different measures of
immigrant labor market skills: fluency in the language of the destination country, years of
schooling, and income. Our analysis will show that the national origin differences
documented in Table 3—particularly the large share of U.S. immigrants from Latin
America—explain most of the observed skill differences between immigrants to the three
destination countries.
10 In Table 3, Europe is defined to include the former USSR.

9
IV. Fluency in the Destination Country Language
The Australian and U.S. censuses provide very similar measures of English
language proficiency. Respondents were first asked whether they speak a language other
than English at home, and then only those who answered affirmatively were asked how
well they speak English, with possible responses of “very well,” well,” “not well,” or “not
at all.” For the Australian and U.S. data, we define individuals as “fluent in the destination
country language” if they speak only English or else report speaking English “very well” or
“well.” Unfortunately, the language information available in the Canadian census is not
directly comparable. In the Canadian data, we define individuals as fluent in the
destination country language if they are able to conduct a conversation in either English or
French.11
Given these definitions, Table 4 reports for each destination country the percent of
immigrant men who are fluent in the destination country language, by five-year arrival
cohorts.12 In all three destination countries, immigrant fluency rates rise monotonically
with the length of time since arrival. This pattern is largely due to the fact that immigrants
who do not speak the destination country language when they arrive tend to acquire fluency
over time as they adapt to their new home. We must caution, however, that differences
between immigrant arrival cohorts observed at a single point in time may reflect permanent
differences between these cohorts as well as the changes that occur for a given cohort as it
11 In their study of immigrants to Canada and the United States, Duleep and Regets (1992) use these same
definitions in an attempt to create roughly comparable measures of language fluency from the 1981 Canadian census andthe 1980 U.S. census.
12 The intervals listed in Table 4 (and in subsequent tables) for the immigrant arrival cohorts are those thatpertain to the Australian and Canadian data; the slightly different immigrant cohorts that pertain to the U.S. data are asfollows: pre-1970, 1970-74, 1975-79, 1980-84, and 1985-90. For ease of exposition, henceforth we will refer to particularimmigrant cohorts using the year intervals that pertain to the Australian and Canadian data, with the implied understandingthat in the U.S. data the actual cohort intervals begin and end one year earlier.
10
spends more time in the destination country.13
For every arrival cohort, fluency rates are lower for U.S. immigrants than for
Australian and Canadian immigrants, and the fluency deficit of U.S. immigrants is
particularly large for cohorts arriving after 1970. For example, among the most recent
immigrants (those arriving within five years of the census), only 61 percent of U.S.
immigrants are fluent, as compared to 82 percent of Australian immigrants and 91 percent
of Canadian immigrants. Even among immigrants who have spent 15-20 years in the
destination country (1971-75 arrivals), the fluency rate of U.S. immigrants (80 percent) is
well below that of Australian immigrants (93 percent) and Canadian immigrants (97
percent). Given the substantial weight that the immigration point systems used in Australia
and Canada have typically placed on language skills, these data seem to indicate that the
Australian and Canadian point systems have been effective at tilting the immigration flow
towards those proficient in the language of the destination country. In Table 4, the relative
fluency of Canadian immigrants is probably overstated because of the particular wording
of the language questions asked in the Canadian census. Recall, however, that the virtually
identical language questions asked in the Australian and U.S. censuses produce fluency
measures for these two countries that are directly comparable to each other. Moreover, the
sheer magnitude of the fluency deficit observed for U.S. immigrants suggests that at least a
portion of this deficit is real.
To learn more about the source of the fluency deficit for U.S. immigrants, Table 5
reports fluency rates separately by immigrant region of birth.14 In this table, we limit the
13 By tracking cohorts of U.S. immigrants between the 1980 and 1990 censuses, Carliner (1995, 1996) and
Funkhouser (1996) show that English proficiency does indeed improve markedly with duration of U.S. residence and thatthis improvement plays an important role in immigrant wage growth.
14 In Table 5, we exclude immigrants from the four source regions listed in Table 3 that cannot be defined for all
11
sample to immigrants have been in the destination country for ten years or less. The
fluency rates for Canadian immigrants are generally much higher than those observed for
immigrants in the other two countries, but once again these high rates may well be an
artifact of the way that fluency is measured in the Canadian data. More interesting and
informative is the comparison between Australia and the United States. Fluency rates are
quite similar for Australian and U.S. immigrants who come from the same source region.
The last two rows of Table 5 show that the overall fluency rate for U.S. immigrants (65
percent) falls well short of the Australian rate (80 percent) almost entirely because the
United States is home to a large population of Latin American immigrants who tend to
speak English poorly. When we exclude immigrants from Central and South America, the
U.S fluency rate jumps to 79 percent, whereas the Australian fluency rate rises only very
slightly to 81 percent.
V. Education
The second immigrant skill measure we analyze is education. Table 6 reports the
results of least squares regressions in which the dependent variable is years of schooling
and the independent variables include dummies identifying immigrants from various arrival
cohorts.15 The samples for these regressions include natives as well as immigrants. In the
columns labeled (1), no other independent variables are included in the regressions, so the
intercepts represent the average education level of natives in each destination country, and
the coefficients on the immigrant cohort dummies show the education differentials between
immigrants of each arrival cohort and natives. U.S. natives display the highest mean
three destination countries. The excluded regions are the following: United States, Other North America,Oceania/Antarctica, and Other.
15 All of the regression tables presented in the paper report robust standard errors in parentheses.
12
education level, 13.4 years, followed by Canadian natives with 12.6 years and Australian
natives with 12.3 years.16 U.S. immigrants, however, have substantially lower levels of
educational attainment than U.S. natives, with the deficit ranging between one and two
years, depending on the arrival cohort. This contrasts with Australian and Canadian
immigrants, who tend to have more schooling than natives in their respective destinations.
The education levels of U.S. immigrants are low not just relative to U.S. natives, but also
when compared directly with those of other immigrants. For all cohorts arriving after
1970, immigrants to Australia or Canada average at least a year more schooling than do
U.S. immigrants from the same cohort.
The columns labeled (2) in Table 6 present education regressions that also include
dummy variables identifying five-year age groups, with the dummy for ages 25-29 omitted.
In these regressions, the intercepts now represent the average education level of 25-29
year-old natives, the immigrant cohort coefficients measure immigrant-native differences
after conditioning on age, and the coefficients on the age dummies reflect education
differentials between each age group and 25-29 year-olds. The age coefficients capture the
secular rise in schooling levels that took place over this period, particularly in Canada,
where average educational attainment is sharply higher for those born after 1940.
Controlling for age, however, has little effect on the estimated immigrant-native schooling
differentials or on the conclusion that the United States is less successful than Australia and
Canada at attracting well-educated immigrants.
Table 7 shows immigrant educational attainment by region of birth for post-
1980/81 arrivals. The first three columns report average years of schooling for each
16 This pattern of education differences across the three countries is similar to what Evans, Kelley, and Wanner
(1998) and Reitz (1998) report.
13
immigrant group. Among immigrants from a particular source region, the education level
of U.S. immigrants typically matches or exceeds that of Australian and Canadian
immigrants, yet on the whole U.S. immigrants average about a year and a half less
schooling than immigrants in the other two destination countries. As was the case with
language fluency, the explanation for this pattern is the large immigration flow from Latin
America to the United States. U.S. immigrants from Central and South America average
less than ten years of schooling, and excluding this group from the calculations causes the
mean education level of U.S. immigrants to shoot up from 11.7 years to 13.9 years.
Considering only those who originate from outside of Latin America, U.S. immigrants
average half a year more schooling than immigrants to Australia and Canada.
Because of differences across countries in educational practices and in the census
questions used to elicit information about educational attainment, the years of schooling
variable we have constructed may suffer from comparability problems. To a large extent,
however, we would expect such factors to impact measured schooling in similar ways for
immigrants and natives in the same destination country. It is therefore useful to examine a
measure of immigrant education that is defined relative to the education level of natives in
the destination country, because in this way we may be able to mitigate biases from
country-specific idiosyncrasies in the measurement of schooling levels. The last three
columns of Table 7 report a relative education measure, here defined as the difference in
average years of schooling between a particular immigrant group and natives in the same
destination country. Because of the relatively high education level of U.S. natives, by this
measure U.S. immigrants remain somewhat less educated than Australian and Canadian
immigrants even after we exclude those originating from Latin America. In particular,
14
considering only immigrants who arrived after 1980/81 and who were not born in Latin
America, Australian immigrants average a year more schooling than Australian natives and
Canadian immigrants average three-quarters of a year more schooling than Canadian
natives. The relative education advantage for U.S. immigrants of one-half year is smaller
than the corresponding education advantages observed for Australian and Canadian
immigrants, but note that including Latin American immigrants in the calculation results in
U.S. immigrants averaging 1.68 years less schooling than U.S. natives. Regardless of
whether immigrant education levels are measured in absolute terms or relative to natives,
the educational gap between U.S. immigrants and immigrants in the other two destination
countries arises primarily because the United States receives a large flow of poorly-
educated immigrants from Latin America.
Tables 6 and 7 provide information about average schooling levels. Immigration
point systems like those used in Australia and Canada might be particularly effective at
screening out immigrants from the bottom tail of the education distribution. In our data,
however, the patterns evident at low education levels are similar to those just described
for average education levels. For example, among immigrants arriving after 1980/81, the
share with ten or fewer years of schooling is 15.8 percent in Australia, 15.7 percent in
Canada, and 29.9 percent in the United States.17 Excluding immigrants from Latin America
barely affects the Australian and Canadian calculations but drops the share for U.S.
immigrants to 13.8 percent. Once immigrants from Latin America are excluded, U.S.
immigrants are less likely than Australian and Canadian immigrants to possess low levels
of schooling.
17 The corresponding shares among natives are 32.2 percent in Australia, 21.1 percent in Canada, and 8.1
percent in the United States.
15
VI. Income
The final immigrant skill measure we analyze is personal income. Ideally, we
would prefer to use data on earnings rather than income, but the Australian census does not
distinguish earnings from other income sources.18 To increase the correspondence between
income and earnings, we now restrict the samples to employed men.19 The income and
employment measures in the Australian data refer to the usual week and the census survey
week, respectively, whereas in the Canadian and U.S. data these measures refer to the
calendar year preceding the census. The Canadian and U.S. income measures have been
converted to a weekly basis so as to match the Australian data.20
Tables 8 and 9 present estimates from least squares regressions in which the
dependent variable is the natural logarithm of weekly personal income, and the samples
pool immigrant and native men. Two specifications are reported for each destination
country. In the first specification, the independent variables include immigrant arrival
cohort dummies, age dummies, controls for geographic location, and indicators for hours
worked during the census survey week. The coefficients of the geographic location and
weekly hours of work variables are restricted to be the same for immigrants and natives,
whereas the coefficients of the age dummies are allowed to vary by nativity. The second
specification adds as regressors years of schooling and indicators for fluency in the
18 Earnings information is available in the Canadian and U.S. censuses, however, and for these two countries we
have replicated the analyses reported below using earnings rather than income as the dependent variable. The income andearnings regressions produce similar results.
19 In the Canadian sample, we also exclude immigrants who arrived during the census year (1991), becauseincome data are not available for these recent arrivals.
20 Another difference between the income measures available for each country is that the Australian censusreports income in fourteen intervals, whereas the Canadian and U.S. censuses provide continuous measures of income. For Australia, we use the midpoints of the reported income intervals to construct the income variable employed in ourregressions. For Canada and the United States, the results reported here employ a continuous income variable, but weobtain similar results when we instead group these data into intervals and assign midpoints so as to mimic the Australiandata.
16
language of the destination country, and here the return to education can vary by nativity.
Table 8 reports the immigrant cohort coefficients from these regressions. These
coefficients have been normalized to represent immigrant-native income differentials for
men who are aged 25-29 (in both specifications) and who have 12 years of schooling (in
specification (2)). Table 9 reports the coefficients of the age, education, and fluency
variables. Note that the interactions between nativity and age in these regressions imply
that the immigrant-native income gaps presented in Table 8 for ages 25-29 will differ at
older ages.
Figure 1 provides a convenient way of summarizing the immigrant-native income
differentials implied by these regressions. Based on the specification that does not control
for education and fluency, the top panel of Figure 1 shows the predicted log income
differentials between immigrant and native men, by destination country and immigrant
arrival cohort.21 The three lines plotted in each graph provide this information for the three
destination countries, with the different points on each line referring to the particular
immigrant cohorts included in our samples. The bottom panel of Figure 1 is the same as
the top panel, except that the bottom panel is based on the regression specification that
adds controls for education and fluency.22 In other words, the top panel of Figure 1
corresponds to specification (1) in Tables 8 and 9, whereas the bottom panel of the figure
corresponds to specification (2).
21 To control for age differences, both across countries and between immigrants and natives within a country,
these calculations assign the same age distribution to all groups. In particular, we use the age distribution observed for oursample of U.S. immigrants: 20.2 percent are in the 25-29 age range, 20.7 percent are 30-34, 17.5 percent are 35-39, 14.8percent are 40-44, 11.2 percent are 45-49, 9.0 percent are 50-54, and 6.7 percent are 55-59. Because the immigrant-native income differentials estimated for each country are allowed to vary by age group, the overall differentials shown inFigure 1 depend on the particular age distribution used. However, similar patterns emerge from using the age distributionsobserved for any of the immigrant or native samples in our three destination countries.
22 The calculations displayed in the bottom panel of Figure 1 pertain to individuals with 12 years of education.

17
A word of caution is in order about interpreting these graphs. Because analyses of
immigrant outcomes using a single cross section of data cannot distinguish assimilation and
cohort effects, the plots do not portray the life-cycle trajectories of immigrants as they gain
experience in the destination country labor market. Instead, the graphs are only intended to
illustrate the income differences between immigrants of various arrival cohorts and natives
at a given point in time.
Figures 1 tells an interesting story. Without controlling for education and fluency,
the income disadvantage of immigrants relative to natives is most severe in the United
States and smallest in Australia, with Canada falling in between (see the top panel of
Figure 1). Once we condition on education and fluency, however, immigrant-native
income differentials for the United States shrink dramatically, with the U.S. differentials
now smaller than those observed in Canada and sometimes even Australia (see the bottom
panel of Figure 1). For example, without controls for education and fluency, immigrants
who have been in the destination country for 11-15 years (i.e., 1976-80 arrivals) possess
income deficits relative to natives of 7.6 percent in Australia, 15.9 percent in Canada, and
32.3 percent in the United States. After controlling for education and fluency, the
corresponding income deficits are 2.4 percent for Australian immigrants, 7.5 percent for
Canadian immigrants, and 2.7 percent for U.S. immigrants. The comparison between the
top and bottom panels of Figure 1 suggests that the smaller income deficits (relative to
natives) observed for Australian and Canadian immigrants than for U.S. immigrants are
largely explained by the higher levels of education and fluency possessed by Australian
and Canadian immigrants. Indeed, after conditioning on these observable skill measures,
the relative incomes of U.S. immigrants compare favorably with those of Canadian
18
immigrants for all arrival cohorts, and they compare favorably with those of Australian
immigrants for cohorts that have been in the destination country for more than ten years.
In Australia, immigrant-native income differences are relatively small to begin with
and essentially disappear after controlling for education and fluency. Consistent with
previous research, the Australian data show little correlation between an immigrant’s
income and his year of arrival.23 In addition, Table 9 indicates that Australian immigrants
earn the same return to education as Australian natives, whereas the Canadian and U.S.
data show the expected pattern of a lower return to education for immigrants.24 Evidently,
both in terms of the intercept and the return to education, the wage structure is similar for
immigrants and natives in Australia.
Tables 10 and 11 and Figure 2 replicate the preceding analysis of immigrant-native
income differentials, but now using samples from each country that exclude immigrants
born in Central and South America. With respect to comparisons of the relative incomes of
immigrants in the three destination countries, notice that the top panel of Figure 2
resembles the bottom panel of Figure 1. Excluding Latin American immigrants (Figure 2)
dramatically shrinks immigrant-native income differentials in the United States, resulting in
income gaps for U.S. immigrants that are smaller than those of Canadian immigrants and
some groups of Australian immigrants. With Latin American immigrants included in the
samples (Figure 1), recall that controlling for education and fluency generated this same
23 Borjas (1988) reports this result in his analysis of data from the 1981 Australian census. McDonald and
Worswick (1999) analyze microdata from the Australian Income Distribution Surveys of 1982, 1986, and 1990. They findlittle evidence of statistically significant cohort and assimilation effects on the earnings of Australian immigrants.
24 The standard interpretation of this pattern is that schooling acquired by immigrants in their home countrytransfers imperfectly to the destination country’s labor market (Chiswick 1978). The failure of the Australian data toconform to the expected pattern may be due in part to the limited information about educational attainment available in thecensus. Analyzing unique data with detailed information about the types of education obtained and how much of thiseducation was obtained abroad and how much was obtained in Australia, Chapman and Iredale (1993) find that Australianimmigrants are paid a higher wage premium for schooling received in Australia than for foreign schooling.
19
general pattern of results. Given our earlier findings that unskilled immigration from Latin
America explains why U.S. immigrants overall have lower levels of education and English
fluency than Australian and Canadian immigrants, it is not surprising that the impact of
excluding Latin American immigrants on immigrant-native income differentials in the three
countries is similar to the impact of controlling for education and fluency.
VII. Conclusion
Census data for 1990/91 indicate that Australian and Canadian immigrants have
higher levels of fluency in the destination country language, education, and income (relative
to natives) than do U.S. immigrants. This skill deficit for U.S. immigrants arises primarily
because the United States receives a much larger share of immigrants from Latin America
than do the other two countries.
In his analysis of earlier census data for Canada and the United States, Borjas
reports a similar finding: “Differences in the national-origin mix of immigrants arriving in
Canada and the United States since 1965 are mainly responsible for the higher average
skills and relative wages of immigrants in Canada” (Borjas 1993, p. 35). The large U.S.
immigration flow from Latin America plays a leading role in this story, although not quite
as dominant a role in Borjas’s version of the story as it does in ours.25 From his analysis,
Borjas concludes that the Canadian “point system works because it alters the national-
origin mix of immigrant flows” (Borjas 1993, p. 40).
We do not believe, however, that our analysis provides much support for the
proposition that the skills of U.S. immigrants would improve if the United States were to
adopt an immigration point system similar to those in Australia and Canada. For several
25 See footnote 10 of Borjas (1993).
20
reasons, we strongly suspect that the Australian and Canadian point systems are not the
primary reason that these countries receive few Latin American immigrants relative to the
United States. First of all, the United States shares a long border and a long history with
Mexico, and these factors undoubtedly contribute to the large presence of Latin American
immigrants in the United States. Second, Australia and Canada never received many
immigrants from Latin America, even before immigration point systems were introduced in
Australia in the 1970s and Canada in the late 1960s (see Reitz 1998, Table 1.1, pp. 10-12).
Finally, much of U.S. immigration from Latin America is undocumented (Warren and
Passel 1987; Woodrow and Passel 1990) and subject to limited official control (Bean,
Espenshade, White, and Dymowski 1990; Donato, Durand, and Massey 1992; Kossoudji
1992). A point system that screens legal immigrants for skills may do little to raise the
skills or restrict the entry of Latin American immigrants to the United States, because these
immigrants seem to find it relatively easy to enter outside of the official admissions system.
21
References
Not cited in paper
Australian Department of Immigration, Local Government and Ethnic Affairs (ADILGEA)(1991). Efficiency Audit, Department of Immigration, Local Government and EthnicAffairs, Audit Report No. 11, 1991 - 1992. Canberra: Australian GovernmentPrinting Service.
Bean, Frank D.; Espenshade, Thomas J.; White, Michael J.; and Dymowski, Robert F. “Post-IRCA Changes in the Volume and Composition of Undocumented Migrationto the United States: An Assessment Based on Apprehensions Data.” InUndocumented Migration to the United States: IRCA and the Experience of the1980s, edited by Frank D. Bean, Barry Edmonston, and Jeffrey S. Passel. Washington, DC: Urban Institute Press, 1990, pp. 111-58.
Borjas, George. J. International Differences in the Labor Market Performance ofImmigrants. Kalamazoo, Mich.: W.E. Upjohn Institute for Employment Research,1988.
______. “Immigration and Self-Selection.” In Immigration, Trade, and the LaborMarket, edited by John M. Abowd and Richard B. Freeman. Chicago: Universityof Chicago Press, 1991, pp. 29-76.
______. “Immigration Policy, National Origin, and Immigrant Skills: A Comparison ofCanada and the United States.” In Small Differences That Matter: Labor Marketsand Income Maintenance in Canada and the United States, edited by David Cardand Richard B. Freeman. Chicago: University of Chicago Press, 1993, pp. 21-43.
______. “Assimilation and Changes in Cohort Quality Revisited: What Happened toImmigrant Earnings in the 1980s?” Journal of Labor Economics, April 1995,13(2), pp. 201-45.
Boyd, Monica. “Immigration Policies and Trends: A Comparison of Canada and theUnited States.” Demography, February 1976, 18(1), pp. 83-104.
Bureau of Immigration Research, Statistics Section. (1991). Settler Arrivals 1989-1990,Statistical Report No. 3. Canberra: Australian Government Printing Service.
Briggs, Vernon. M., Jr. (1984). Immigration Policy and the American Labor Force.Baltimore: The Johns Hopkins University Press.
Card, David, and Freeman, Richard B., editors. Small Differences That Matter: LaborMarkets and Income Maintenance in Canada and the United States. Chicago:University of Chicago Press, 1993.
22
Carliner, Geoffrey. “The Language Ability of U.S. Immigrants: Assimilation and CohortEffects.” Working Paper 5222. Cambridge, MA: NBER, 1995.
______. “The Wages and Language Skills of U.S. Immigrants.” Working Paper 5763. Cambridge, MA: NBER, 1996.
Chapman, Bruce J., and Iredale, Robyn R. “Immigrant Qualifications: Recognition andRelative Wage Outcomes.” International Migration Review, Summer 1993,27(2), pp. 359-87.
Chiswick, Barry R. “The Effect of Americanization on the Earnings of Foreign-BornMen.” Journal of Political Economy, October 1978, 86(5), pp. 897-921.
______. (1987). “Immigration Policy, Source Countries, and Immigrant Skills: Australia,Canada, and the United States” in The Economics of Immigration. Proceedings ofConference held at the Australian National University. Canberra: AustralianGovernment Printing Service.
Cobb-Clark, Deborah A. (1990). Immigrant Selectivity: The Roles of Household Structureand U.S. Immigration Policy. PhD dissertation, Economics Department, Universityof Michigan. Ann Arbor: University of Michigan.
Donato, Katharine M.; Durand, Jorge; and Massey, Douglas S. “Stemming the Tide? Assessing the Deterrent Effects of the Immigration Reform and Control Act.” Demography, May 1992, 29(2), pp. 139-157.
Duleep, Harriet Orcutt and Mark C. Regets (1992). “Some Evidence on the Effects ofAdmissions Criteria on Immigrant Assimilation” in Immigration, Language andEthnic Issues: Canada and the United States. Barry R. Chiswick, editor.Washington: American Enterprise Institute: 410 - 439.
Employment and Immigration Canada. (1992). Immigration Statistics 1991. Quebec:Employment and Immigration Canada.
Evans, M.D.R.; Kelley, Jonathan; and Wanner, Richard A. “The Consequences of Divorcefor Children’s Education: Australia, Canada, and the U.S.A., 1940-1990.” Manuscript. Canberra, Australia: Australian National University, 1998.
Freeman, Richard B., and Katz, Lawrence F. “Rising Wage Inequality: The United StatesVs. Other Advanced Countries.” In Working Under Different Rules, edited byRichard B. Freeman. New York: Russell Sage Foundation, 1994, pp. 29-62.
23
Funkhouser, Edward. “How Much of Immigrant Wage Assimilation is Related to EnglishLanguage Acquisition?” Manuscript. Santa Barbara, CA: University of California,1996.
Green, Alan. G. (1995). “A Comparison of Canadian and US Immigration Policy in theTwentieth Century” in Diminishing Returns: The Economics of Canada's RecentImmigration Policy. D. J. DeVortez, editor. Toronto and Vancouver: C.D. HoweInstitute and The Laurier Institution.
Green, Alan G. and David A. Green. (1995). “Canadian Immigration Policy: TheEffectiveness of the Point System and Other Instruments.” Canadian Journal ofEconomics 28(4b): 1006 - 1041.
Gregory, Robert G., and Daly, Anne E. “Welfare and Economic Progress of IndigenousMen of Australia and the U.S., 1980-1990.” Manuscript. Canberra, Australia:Australian National University, 1994.
Jasso, Guillermina and Mark R. Rosenzweig (1995). “Do Immigrants Screened for SkillsDo Better than Family Reunification Immigrants?” International Migration Review29(1): 85 -111.
Kossoudji, Sherrie A. “Playing Cat and Mouse at the U.S.-Mexican Border.” Demography, May 1992, 29(2), pp. 159-80.
Lack, John and Jacqueline Templeton. (1995). Bold Experiment: A Documentary Historyof Australian Immigration Since 1945. Melbourne: Oxford University Press.
McDonald, James T., and Worswick, Christopher. “The Earnings of Immigrant Men inAustralia: Assimilation, Cohort Effects, and Macroeconomic Conditions.” Economic Record, March 1999, 75(228), pp. 49-62.
Price, Charles. “Australia.” In The Politics of Migration Policies, edited by DanielKubat. New York: Center for Migration Studies, 1979, pp. 3-18.
Reimers, David M., and Troper, Harold. (1992). “Canadian and American ImmigrationPolicy since 1945” in Immigration, Language and Ethnic Issues: Canada and theUnited States. Barry R. Chiswick, editor. Washington: American EnterpriseInstitute, 15-54.
Reitz, Jeffrey G. Warmth of the Welcome : The Social Causes of Economic Success forImmigrants in Different Nations and Cities. Boulder, Colo.: Westview Press,1998.
24
Statistics Canada, Housing, Family, and Social Statistics Division (1990). Immigrants inCanada: Selected Highlights. Ottawa: Canadian Government Printing Centre.
U.S. Department of Justice, Immigration and Naturalization Service. (1991). 1990Statistical Yearbook of the Immigration and Naturalization Service. Washington:U.S. Government Printing Office.
Vialet, Joyce C. (1989). Immigration: Numerical Limits and the Preference System.Washington: Congressional Research Service, Library of Congress.
Vialet, Joyce C. and Larry M. Eig. (1990). Immigration Act of 1990 (P.L. 101-649).Washington: Congressional Research Service, Library of Congress.
Warren, Robert, and Passel, Jeffrey S. 1987. “A Count of the Uncountable: Estimates ofUndocumented Aliens Counted in the 1980 United States Census.” Demography,August 1987, 24(3), pp. 375-93.
Wright, Robert E., and Maxim, Paul S. “Immigration Policy and Immigrant Quality:Empirical Evidence from Canada.” Journal of Population Economics, November1993, 6(4), pp. 337-52.
Woodrow, Karen A., and Jeffrey S Passel. “Post-IRCA Undocumented Immigration to theUnited States: An Assessment Based on the June 1988 CPS.” In UndocumentedMigration to the United States: IRCA and the Experience of the 1980s, edited byFrank D. Bean, Barry Edmonston, and Jeffrey S. Passel. Washington, DC: UrbanInstitute Press, 1990, pp. 33-72.
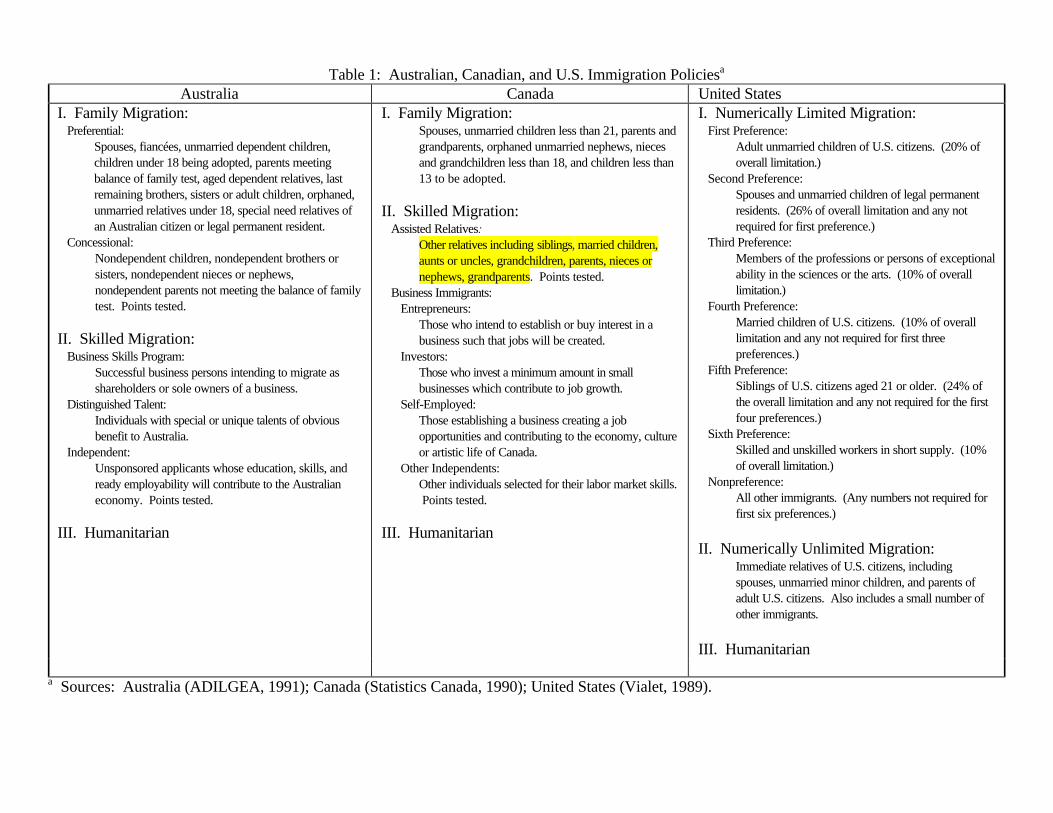
Table 1: Australian, Canadian, and U.S. Immigration Policiesa
Australia Canada United StatesI. Family Migration: Preferential:
Spouses, fiancées, unmarried dependent children,children under 18 being adopted, parents meetingbalance of family test, aged dependent relatives, lastremaining brothers, sisters or adult children, orphaned,unmarried relatives under 18, special need relatives ofan Australian citizen or legal permanent resident.
Concessional:Nondependent children, nondependent brothers orsisters, nondependent nieces or nephews,nondependent parents not meeting the balance of familytest. Points tested.
II. Skilled Migration: Business Skills Program:
Successful business persons intending to migrate asshareholders or sole owners of a business.
Distinguished Talent:Individuals with special or unique talents of obviousbenefit to Australia.
Independent:Unsponsored applicants whose education, skills, andready employability will contribute to the Australianeconomy. Points tested.
III. Humanitarian
I. Family Migration:Spouses, unmarried children less than 21, parents andgrandparents, orphaned unmarried nephews, niecesand grandchildren less than 18, and children less than13 to be adopted.
II. Skilled Migration: Assisted Relatives:
Other relatives including siblings, married children,aunts or uncles, grandchildren, parents, nieces ornephews, grandparents. Points tested.
Business Immigrants: Entrepreneurs:
Those who intend to establish or buy interest in abusiness such that jobs will be created.
Investors:Those who invest a minimum amount in small businesses which contribute to job growth.
Self-Employed:Those establishing a business creating a jobopportunities and contributing to the economy, cultureor artistic life of Canada.
Other Independents:Other individuals selected for their labor market skills. Points tested.
III. Humanitarian
I. Numerically Limited Migration: First Preference:
Adult unmarried children of U.S. citizens. (20% ofoverall limitation.)
Second Preference:Spouses and unmarried children of legal permanentresidents. (26% of overall limitation and any notrequired for first preference.)
Third Preference:Members of the professions or persons of exceptionalability in the sciences or the arts. (10% of overalllimitation.)
Fourth Preference:Married children of U.S. citizens. (10% of overalllimitation and any not required for first threepreferences.)
Fifth Preference:Siblings of U.S. citizens aged 21 or older. (24% ofthe overall limitation and any not required for the firstfour preferences.)
Sixth Preference:Skilled and unskilled workers in short supply. (10%of overall limitation.)
Nonpreference:All other immigrants. (Any numbers not required forfirst six preferences.)
II. Numerically Unlimited Migration:Immediate relatives of U.S. citizens, includingspouses, unmarried minor children, and parents ofadult U.S. citizens. Also includes a small number ofother immigrants.
III. Humanitarian
a Sources: Australia (ADILGEA, 1991); Canada (Statistics Canada, 1990); United States (Vialet, 1989).

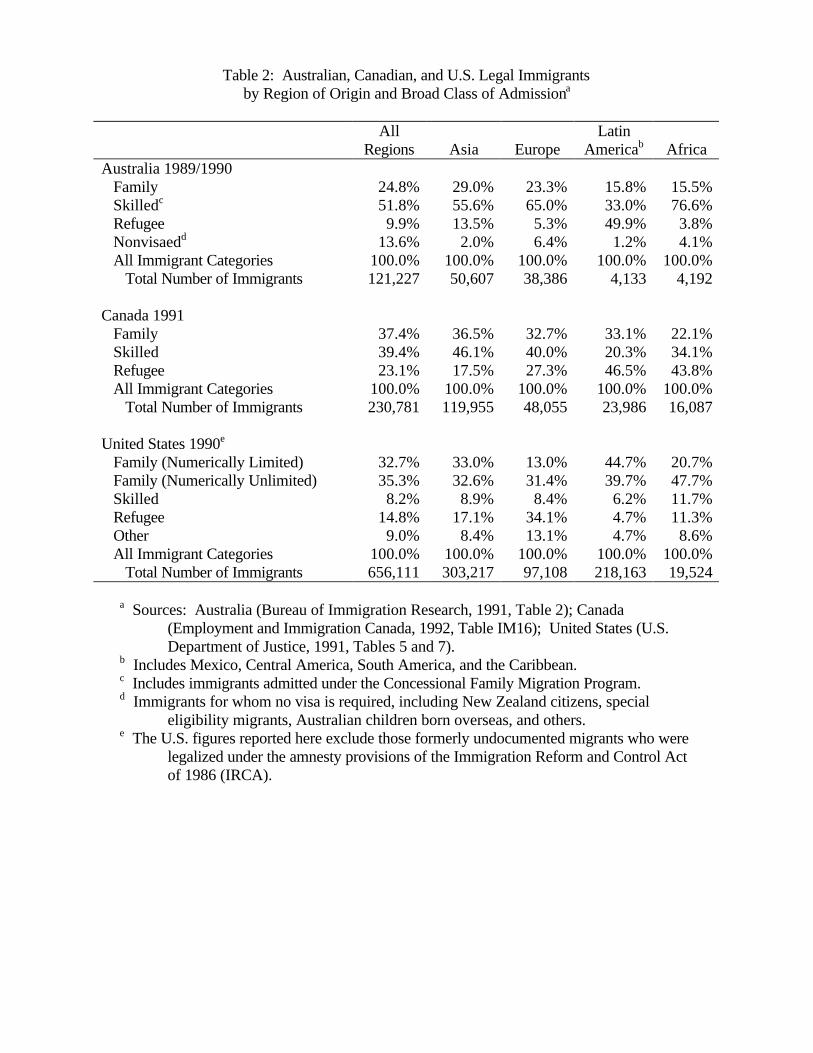
Table 2: Australian, Canadian, and U.S. Legal Immigrantsby Region of Origin and Broad Class of Admissiona
AllRegions Asia Europe
LatinAmericab Africa
Australia 1989/1990 Family 24.8% 29.0% 23.3% 15.8% 15.5% Skilledc 51.8% 55.6% 65.0% 33.0% 76.6% Refugee 9.9% 13.5% 5.3% 49.9% 3.8% Nonvisaedd 13.6% 2.0% 6.4% 1.2% 4.1% All Immigrant Categories 100.0% 100.0% 100.0% 100.0% 100.0% Total Number of Immigrants 121,227 50,607 38,386 4,133 4,192
Canada 1991 Family 37.4% 36.5% 32.7% 33.1% 22.1% Skilled 39.4% 46.1% 40.0% 20.3% 34.1% Refugee 23.1% 17.5% 27.3% 46.5% 43.8% All Immigrant Categories 100.0% 100.0% 100.0% 100.0% 100.0% Total Number of Immigrants 230,781 119,955 48,055 23,986 16,087
United States 1990e
Family (Numerically Limited) 32.7% 33.0% 13.0% 44.7% 20.7% Family (Numerically Unlimited) 35.3% 32.6% 31.4% 39.7% 47.7% Skilled 8.2% 8.9% 8.4% 6.2% 11.7% Refugee 14.8% 17.1% 34.1% 4.7% 11.3% Other 9.0% 8.4% 13.1% 4.7% 8.6% All Immigrant Categories 100.0% 100.0% 100.0% 100.0% 100.0% Total Number of Immigrants 656,111 303,217 97,108 218,163 19,524
a Sources: Australia (Bureau of Immigration Research, 1991, Table 2); Canada(Employment and Immigration Canada, 1992, Table IM16); United States (U.S.Department of Justice, 1991, Tables 5 and 7).
b Includes Mexico, Central America, South America, and the Caribbean.c Includes immigrants admitted under the Concessional Family Migration Program.d Immigrants for whom no visa is required, including New Zealand citizens, special
eligibility migrants, Australian children born overseas, and others.e The U.S. figures reported here exclude those formerly undocumented migrants who were
legalized under the amnesty provisions of the Immigration Reform and Control Actof 1986 (IRCA).
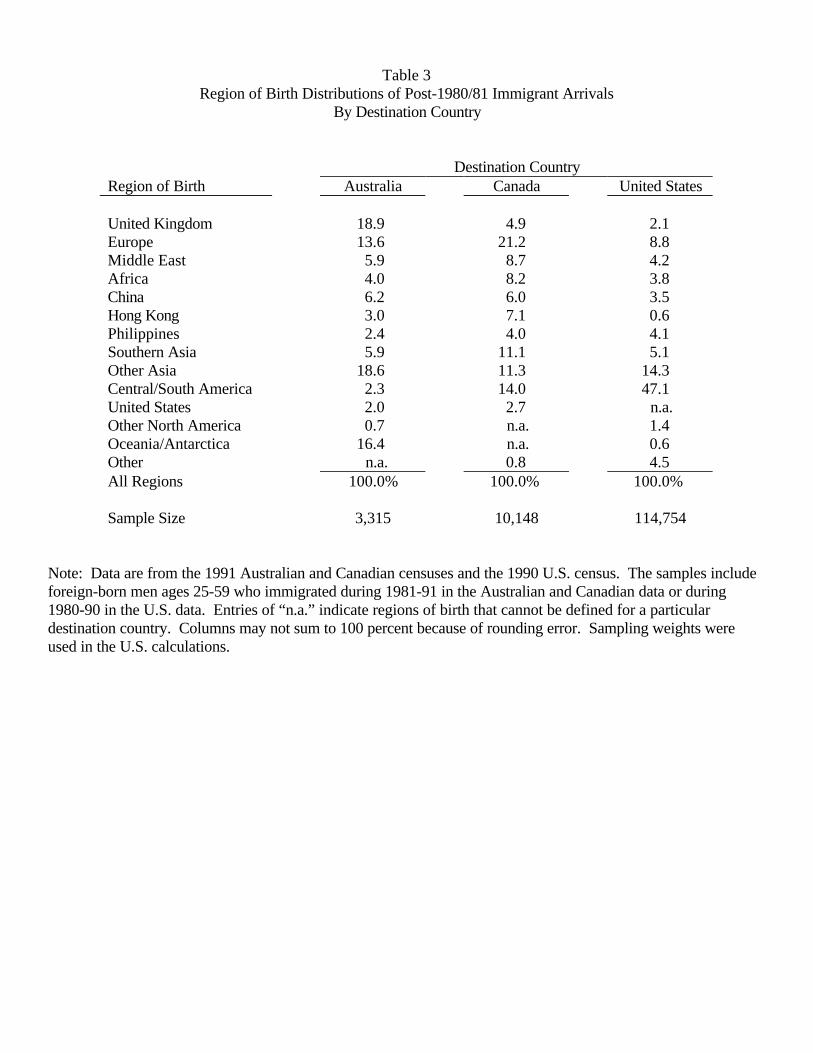
Table 3Region of Birth Distributions of Post-1980/81 Immigrant Arrivals
By Destination Country
Destination CountryRegion of Birth Australia Canada United States
United Kingdom 18.9 4.9 2.1Europe 13.6 21.2 8.8Middle East 5.9 8.7 4.2Africa 4.0 8.2 3.8China 6.2 6.0 3.5Hong Kong 3.0 7.1 0.6Philippines 2.4 4.0 4.1Southern Asia 5.9 11.1 5.1Other Asia 18.6 11.3 14.3Central/South America 2.3 14.0 47.1United States 2.0 2.7 n.a.Other North America 0.7 n.a. 1.4Oceania/Antarctica 16.4 n.a. 0.6Other n.a. 0.8 4.5All Regions 100.0% 100.0% 100.0%
Sample Size 3,315 10,148 114,754
Note: Data are from the 1991 Australian and Canadian censuses and the 1990 U.S. census. The samples includeforeign-born men ages 25-59 who immigrated during 1981-91 in the Australian and Canadian data or during1980-90 in the U.S. data. Entries of “n.a.” indicate regions of birth that cannot be defined for a particulardestination country. Columns may not sum to 100 percent because of rounding error. Sampling weights wereused in the U.S. calculations.
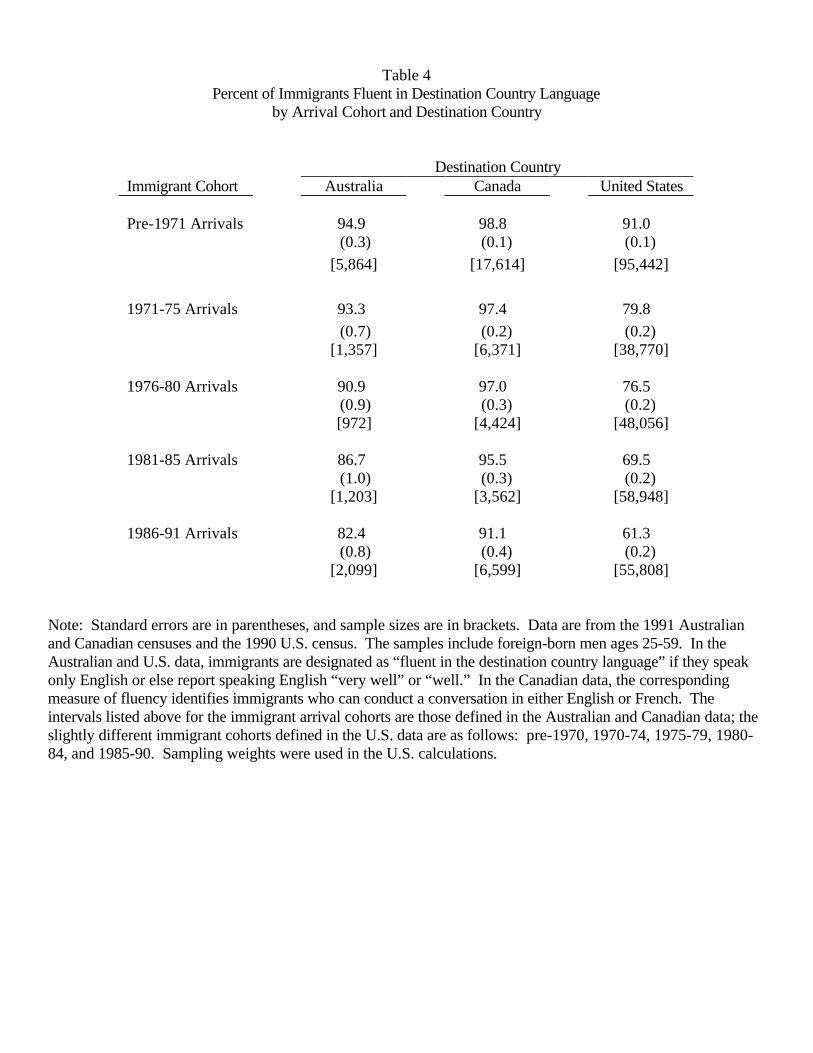
Table 4Percent of Immigrants Fluent in Destination Country Language
by Arrival Cohort and Destination Country
Destination CountryImmigrant Cohort Australia Canada United States
Pre-1971 Arrivals 94.9 98.8 91.0(0.3) (0.1) (0.1)
[5,864] [17,614] [95,442]
1971-75 Arrivals 93.3 97.4 79.8
(0.7) (0.2) (0.2)[1,357] [6,371] [38,770]
1976-80 Arrivals 90.9 97.0 76.5(0.9) (0.3) (0.2)[972] [4,424] [48,056]
1981-85 Arrivals 86.7 95.5 69.5(1.0) (0.3) (0.2)
[1,203] [3,562] [58,948]
1986-91 Arrivals 82.4 91.1 61.3(0.8) (0.4) (0.2)
[2,099] [6,599] [55,808]
Note: Standard errors are in parentheses, and sample sizes are in brackets. Data are from the 1991 Australianand Canadian censuses and the 1990 U.S. census. The samples include foreign-born men ages 25-59. In theAustralian and U.S. data, immigrants are designated as “fluent in the destination country language” if they speakonly English or else report speaking English “very well” or “well.” In the Canadian data, the correspondingmeasure of fluency identifies immigrants who can conduct a conversation in either English or French. Theintervals listed above for the immigrant arrival cohorts are those defined in the Australian and Canadian data; theslightly different immigrant cohorts defined in the U.S. data are as follows: pre-1970, 1970-74, 1975-79, 1980-84, and 1985-90. Sampling weights were used in the U.S. calculations.

Table 5Percent of Post-1980/81 Immigrant Arrivals Fluent in Destination Country Language
by Birthplace and Destination Country
Destination CountryRegion of Birth Australia Canada United States
United Kingdom 100.0 100.0 99.7(.) (.) (0.1)
Europe 75.3 89.7 77.6(2.0) (0.7) (0.5)
Middle East 71.3 95.1 88.2(3.2) (0.7) (0.5)
Africa 100.0 99.5 94.6(.) (0.2) (0.4)
China 53.9 70.0 55.5(3.5) (1.9) (0.9)
Hong Kong 81.0 96.7 81.6(3.9) (0.7) (1.5)
Philippines 98.7 99.5 94.4(1.3) (0.3) (0.4)
Southern Asia 96.4 94.5 93.5(1.4) (0.7) (0.4)
Other Asia 66.8 88.3 64.7(1.9) (0.9) (0.4)
Central/South America 57.7 94.6 51.2(5.9) (0.6) (0.2)
All Regions Listed Above 80.4 92.4 64.8(0.7) (0.3) (0.2)
All Regions, Excluding 81.0 92.0 78.6 Central/South America (0.7) (0.3) (0.2)
Note: Standard errors are in parentheses. Data are from the 1991 Australian and Canadian censuses and the 1990U.S. census. The samples include foreign-born men ages 25-59 who immigrated during 1981-91 in the Australianand Canadian data or during 1980-90 in the U.S. data. In the Australian and U.S. data, immigrants are designatedas “fluent in the destination country language” if they speak only English or else report speaking English “verywell” or “well.” In the Canadian data, the corresponding measure of fluency identifies immigrants who canconduct a conversation in either English or French. Sampling weights were used in the U.S. calculations.
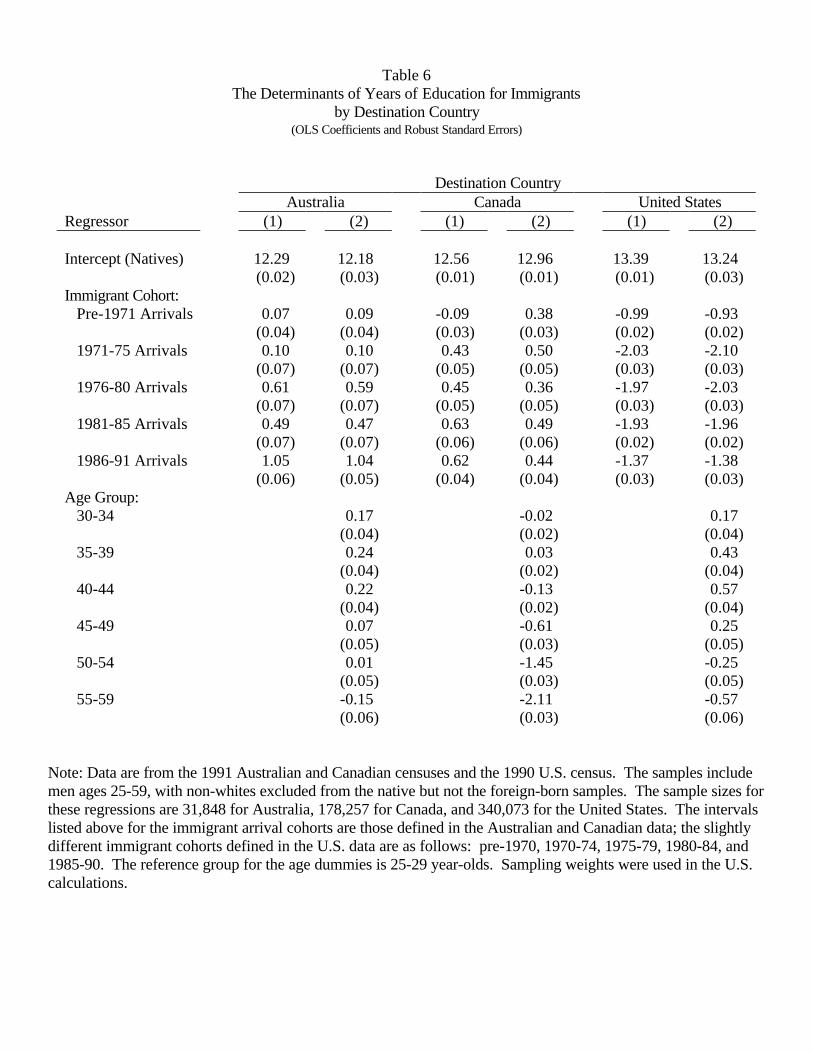
Table 6The Determinants of Years of Education for Immigrants
by Destination Country(OLS Coefficients and Robust Standard Errors)
Destination CountryAustralia Canada United States
Regressor (1) (2) (1) (2) (1) (2)
Intercept (Natives) 12.29 12.18 12.56 12.96 13.39 13.24(0.02) (0.03) (0.01) (0.01) (0.01) (0.03)
Immigrant Cohort: Pre-1971 Arrivals 0.07 0.09 -0.09 0.38 -0.99 -0.93
(0.04) (0.04) (0.03) (0.03) (0.02) (0.02) 1971-75 Arrivals 0.10 0.10 0.43 0.50 -2.03 -2.10
(0.07) (0.07) (0.05) (0.05) (0.03) (0.03) 1976-80 Arrivals 0.61 0.59 0.45 0.36 -1.97 -2.03
(0.07) (0.07) (0.05) (0.05) (0.03) (0.03) 1981-85 Arrivals 0.49 0.47 0.63 0.49 -1.93 -1.96
(0.07) (0.07) (0.06) (0.06) (0.02) (0.02) 1986-91 Arrivals 1.05 1.04 0.62 0.44 -1.37 -1.38
(0.06) (0.05) (0.04) (0.04) (0.03) (0.03)Age Group: 30-34 0.17 -0.02 0.17
(0.04) (0.02) (0.04) 35-39 0.24 0.03 0.43
(0.04) (0.02) (0.04) 40-44 0.22 -0.13 0.57
(0.04) (0.02) (0.04) 45-49 0.07 -0.61 0.25
(0.05) (0.03) (0.05) 50-54 0.01 -1.45 -0.25
(0.05) (0.03) (0.05) 55-59 -0.15 -2.11 -0.57
(0.06) (0.03) (0.06)
Note: Data are from the 1991 Australian and Canadian censuses and the 1990 U.S. census. The samples includemen ages 25-59, with non-whites excluded from the native but not the foreign-born samples. The sample sizes forthese regressions are 31,848 for Australia, 178,257 for Canada, and 340,073 for the United States. The intervalslisted above for the immigrant arrival cohorts are those defined in the Australian and Canadian data; the slightlydifferent immigrant cohorts defined in the U.S. data are as follows: pre-1970, 1970-74, 1975-79, 1980-84, and1985-90. The reference group for the age dummies is 25-29 year-olds. Sampling weights were used in the U.S.calculations.
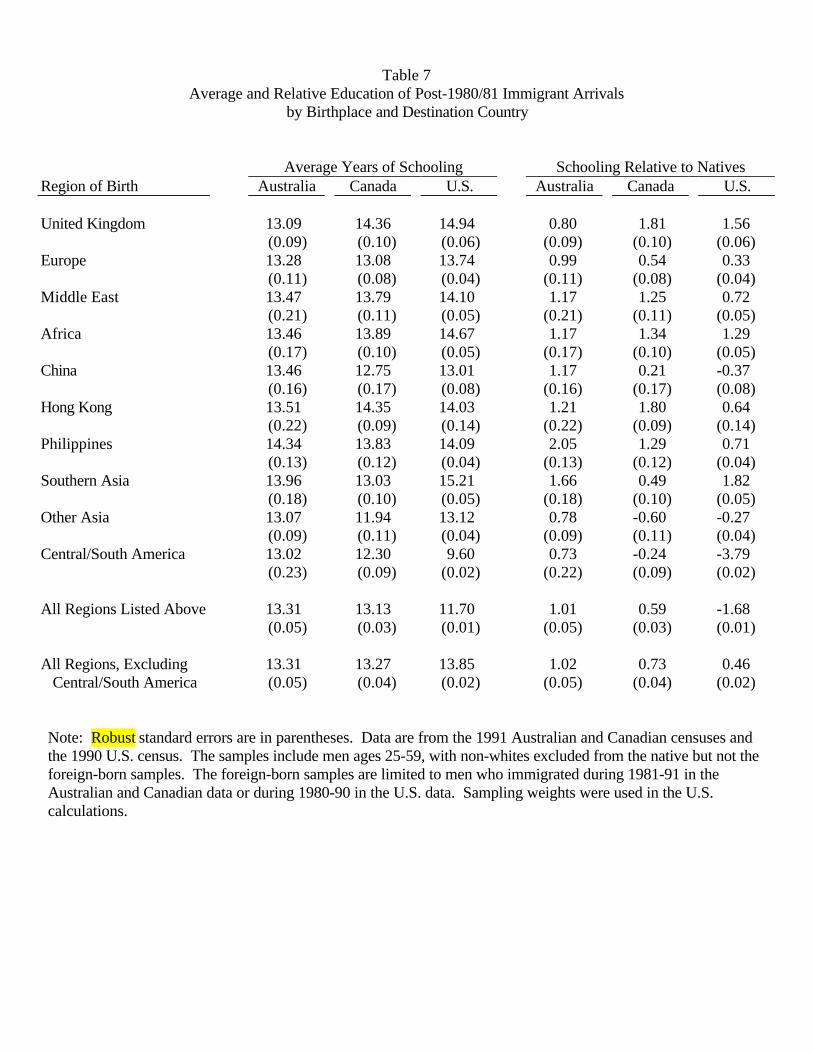
Table 7Average and Relative Education of Post-1980/81 Immigrant Arrivals
by Birthplace and Destination Country
Average Years of Schooling Schooling Relative to NativesRegion of Birth Australia Canada U.S. Australia Canada U.S.
United Kingdom 13.09 14.36 14.94 0.80 1.81 1.56(0.09) (0.10) (0.06) (0.09) (0.10) (0.06)
Europe 13.28 13.08 13.74 0.99 0.54 0.33(0.11) (0.08) (0.04) (0.11) (0.08) (0.04)
Middle East 13.47 13.79 14.10 1.17 1.25 0.72(0.21) (0.11) (0.05) (0.21) (0.11) (0.05)
Africa 13.46 13.89 14.67 1.17 1.34 1.29(0.17) (0.10) (0.05) (0.17) (0.10) (0.05)
China 13.46 12.75 13.01 1.17 0.21 -0.37(0.16) (0.17) (0.08) (0.16) (0.17) (0.08)
Hong Kong 13.51 14.35 14.03 1.21 1.80 0.64(0.22) (0.09) (0.14) (0.22) (0.09) (0.14)
Philippines 14.34 13.83 14.09 2.05 1.29 0.71(0.13) (0.12) (0.04) (0.13) (0.12) (0.04)
Southern Asia 13.96 13.03 15.21 1.66 0.49 1.82(0.18) (0.10) (0.05) (0.18) (0.10) (0.05)
Other Asia 13.07 11.94 13.12 0.78 -0.60 -0.27(0.09) (0.11) (0.04) (0.09) (0.11) (0.04)
Central/South America 13.02 12.30 9.60 0.73 -0.24 -3.79(0.23) (0.09) (0.02) (0.22) (0.09) (0.02)
All Regions Listed Above 13.31 13.13 11.70 1.01 0.59 -1.68(0.05) (0.03) (0.01) (0.05) (0.03) (0.01)
All Regions, Excluding 13.31 13.27 13.85 1.02 0.73 0.46 Central/South America (0.05) (0.04) (0.02) (0.05) (0.04) (0.02)
Note: Robust standard errors are in parentheses. Data are from the 1991 Australian and Canadian censuses andthe 1990 U.S. census. The samples include men ages 25-59, with non-whites excluded from the native but not theforeign-born samples. The foreign-born samples are limited to men who immigrated during 1981-91 in theAustralian and Canadian data or during 1980-90 in the U.S. data. Sampling weights were used in the U.S.calculations.
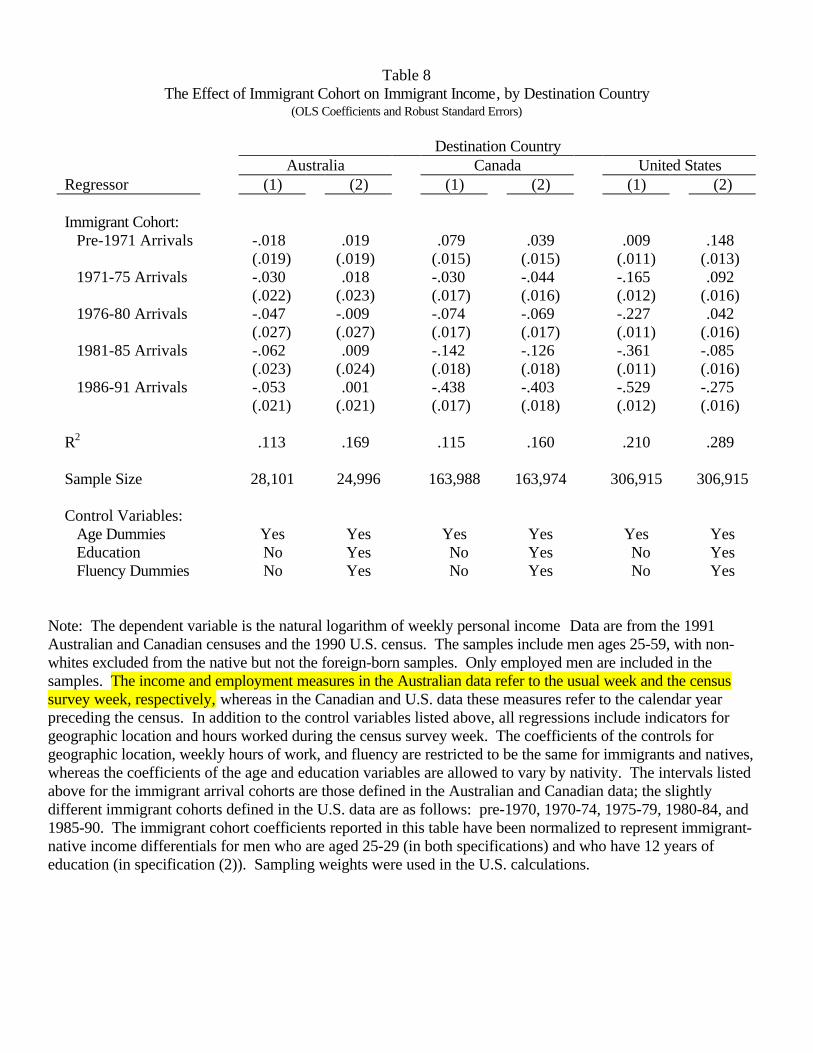
Table 8The Effect of Immigrant Cohort on Immigrant Income, by Destination Country
(OLS Coefficients and Robust Standard Errors)
Destination CountryAustralia Canada United States
Regressor (1) (2) (1) (2) (1) (2)
Immigrant Cohort: Pre-1971 Arrivals -.018 .019 .079 .039 .009 .148
(.019) (.019) (.015) (.015) (.011) (.013) 1971-75 Arrivals -.030 .018 -.030 -.044 -.165 .092
(.022) (.023) (.017) (.016) (.012) (.016) 1976-80 Arrivals -.047 -.009 -.074 -.069 -.227 .042
(.027) (.027) (.017) (.017) (.011) (.016) 1981-85 Arrivals -.062 .009 -.142 -.126 -.361 -.085
(.023) (.024) (.018) (.018) (.011) (.016) 1986-91 Arrivals -.053 .001 -.438 -.403 -.529 -.275
(.021) (.021) (.017) (.018) (.012) (.016)
R2 .113 .169 .115 .160 .210 .289
Sample Size 28,101 24,996 163,988 163,974 306,915 306,915
Control Variables: Age Dummies Yes Yes Yes Yes Yes Yes Education No Yes No Yes No Yes Fluency Dummies No Yes No Yes No Yes
Note: The dependent variable is the natural logarithm of weekly personal income Data are from the 1991Australian and Canadian censuses and the 1990 U.S. census. The samples include men ages 25-59, with non-whites excluded from the native but not the foreign-born samples. Only employed men are included in thesamples. The income and employment measures in the Australian data refer to the usual week and the censussurvey week, respectively, whereas in the Canadian and U.S. data these measures refer to the calendar yearpreceding the census. In addition to the control variables listed above, all regressions include indicators forgeographic location and hours worked during the census survey week. The coefficients of the controls forgeographic location, weekly hours of work, and fluency are restricted to be the same for immigrants and natives,whereas the coefficients of the age and education variables are allowed to vary by nativity. The intervals listedabove for the immigrant arrival cohorts are those defined in the Australian and Canadian data; the slightlydifferent immigrant cohorts defined in the U.S. data are as follows: pre-1970, 1970-74, 1975-79, 1980-84, and1985-90. The immigrant cohort coefficients reported in this table have been normalized to represent immigrant-native income differentials for men who are aged 25-29 (in both specifications) and who have 12 years ofeducation (in specification (2)). Sampling weights were used in the U.S. calculations.
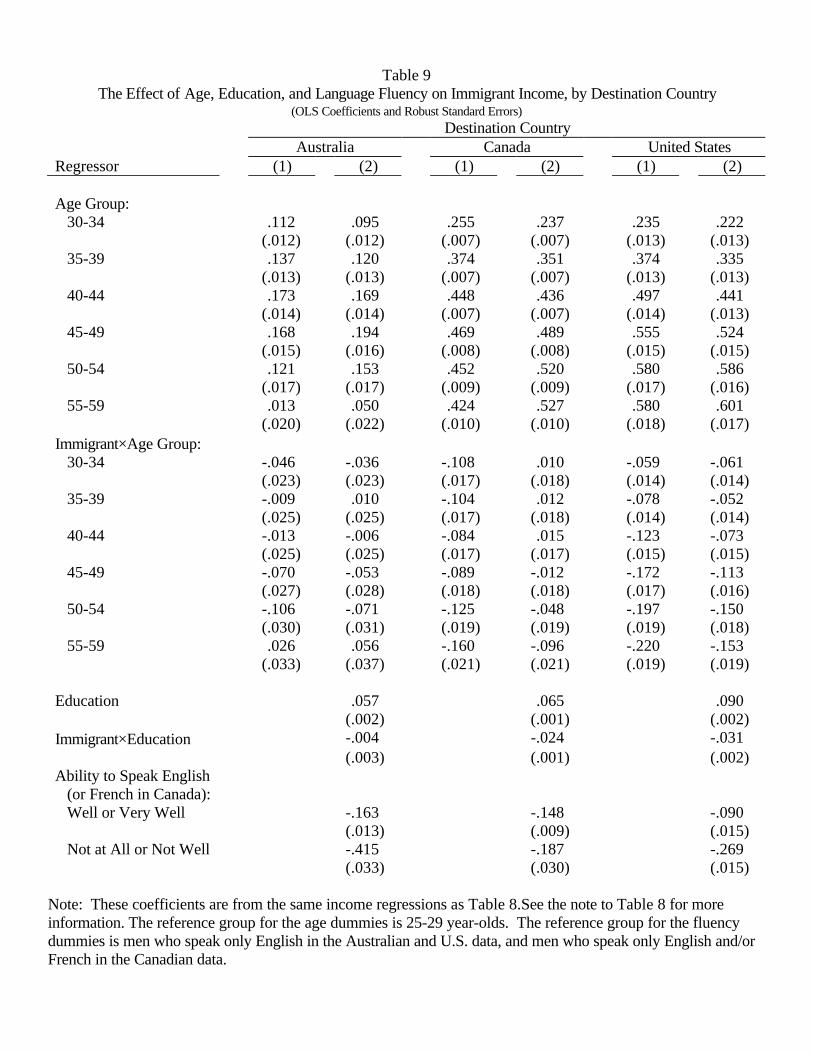
Table 9The Effect of Age, Education, and Language Fluency on Immigrant Income, by Destination Country
(OLS Coefficients and Robust Standard Errors)
Destination CountryAustralia Canada United States
Regressor (1) (2) (1) (2) (1) (2)
Age Group: 30-34 .112 .095 .255 .237 .235 .222
(.012) (.012) (.007) (.007) (.013) (.013) 35-39 .137 .120 .374 .351 .374 .335
(.013) (.013) (.007) (.007) (.013) (.013) 40-44 .173 .169 .448 .436 .497 .441
(.014) (.014) (.007) (.007) (.014) (.013) 45-49 .168 .194 .469 .489 .555 .524
(.015) (.016) (.008) (.008) (.015) (.015) 50-54 .121 .153 .452 .520 .580 .586
(.017) (.017) (.009) (.009) (.017) (.016) 55-59 .013 .050 .424 .527 .580 .601
(.020) (.022) (.010) (.010) (.018) (.017)Immigrant×Age Group: 30-34 -.046 -.036 -.108 .010 -.059 -.061
(.023) (.023) (.017) (.018) (.014) (.014) 35-39 -.009 .010 -.104 .012 -.078 -.052
(.025) (.025) (.017) (.018) (.014) (.014) 40-44 -.013 -.006 -.084 .015 -.123 -.073
(.025) (.025) (.017) (.017) (.015) (.015) 45-49 -.070 -.053 -.089 -.012 -.172 -.113
(.027) (.028) (.018) (.018) (.017) (.016) 50-54 -.106 -.071 -.125 -.048 -.197 -.150
(.030) (.031) (.019) (.019) (.019) (.018) 55-59 .026 .056 -.160 -.096 -.220 -.153
(.033) (.037) (.021) (.021) (.019) (.019)
Education .057 .065 .090(.002) (.001) (.002)
Immigrant×Education -.004 -.024 -.031(.003) (.001) (.002)
Ability to Speak English (or French in Canada): Well or Very Well -.163 -.148 -.090
(.013) (.009) (.015) Not at All or Not Well -.415 -.187 -.269
(.033) (.030) (.015)
Note: These coefficients are from the same income regressions as Table 8.See the note to Table 8 for moreinformation. The reference group for the age dummies is 25-29 year-olds. The reference group for the fluencydummies is men who speak only English in the Australian and U.S. data, and men who speak only English and/orFrench in the Canadian data.
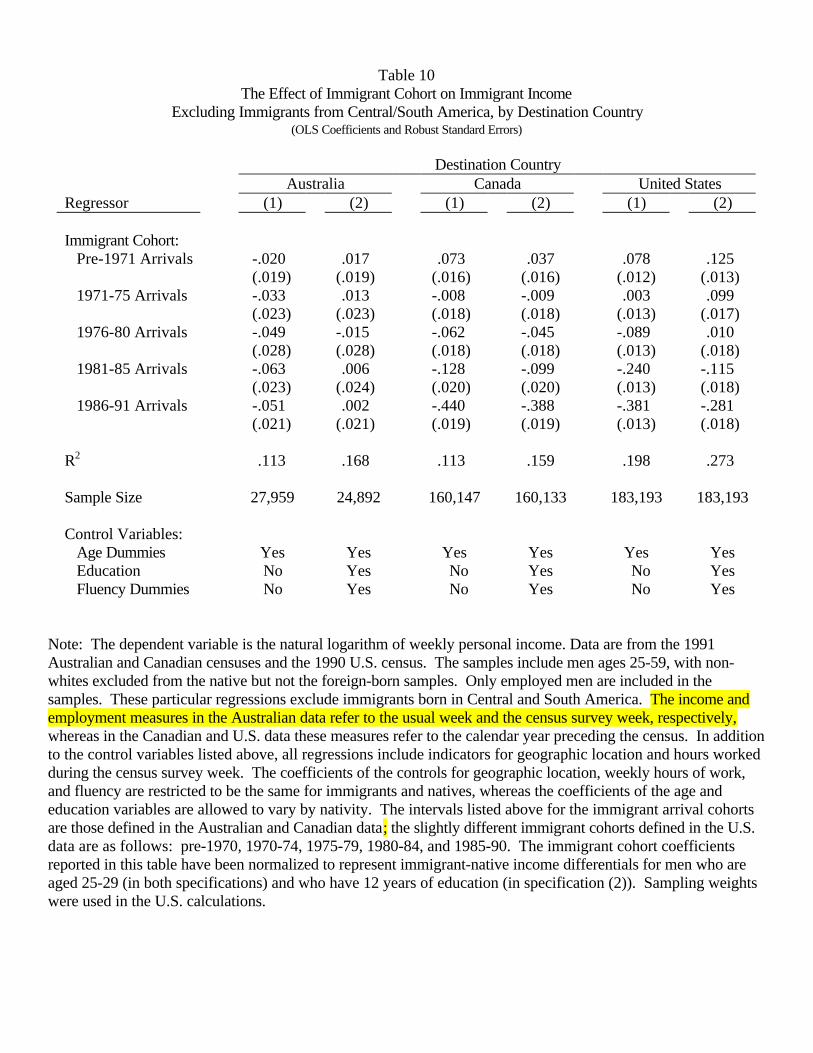
Table 10The Effect of Immigrant Cohort on Immigrant Income
Excluding Immigrants from Central/South America, by Destination Country(OLS Coefficients and Robust Standard Errors)
Destination CountryAustralia Canada United States
Regressor (1) (2) (1) (2) (1) (2)
Immigrant Cohort: Pre-1971 Arrivals -.020 .017 .073 .037 .078 .125
(.019) (.019) (.016) (.016) (.012) (.013) 1971-75 Arrivals -.033 .013 -.008 -.009 .003 .099
(.023) (.023) (.018) (.018) (.013) (.017) 1976-80 Arrivals -.049 -.015 -.062 -.045 -.089 .010
(.028) (.028) (.018) (.018) (.013) (.018) 1981-85 Arrivals -.063 .006 -.128 -.099 -.240 -.115
(.023) (.024) (.020) (.020) (.013) (.018) 1986-91 Arrivals -.051 .002 -.440 -.388 -.381 -.281
(.021) (.021) (.019) (.019) (.013) (.018)
R2 .113 .168 .113 .159 .198 .273
Sample Size 27,959 24,892 160,147 160,133 183,193 183,193
Control Variables: Age Dummies Yes Yes Yes Yes Yes Yes Education No Yes No Yes No Yes Fluency Dummies No Yes No Yes No Yes
Note: The dependent variable is the natural logarithm of weekly personal income. Data are from the 1991Australian and Canadian censuses and the 1990 U.S. census. The samples include men ages 25-59, with non-whites excluded from the native but not the foreign-born samples. Only employed men are included in thesamples. These particular regressions exclude immigrants born in Central and South America. The income andemployment measures in the Australian data refer to the usual week and the census survey week, respectively,whereas in the Canadian and U.S. data these measures refer to the calendar year preceding the census. In additionto the control variables listed above, all regressions include indicators for geographic location and hours workedduring the census survey week. The coefficients of the controls for geographic location, weekly hours of work,and fluency are restricted to be the same for immigrants and natives, whereas the coefficients of the age andeducation variables are allowed to vary by nativity. The intervals listed above for the immigrant arrival cohortsare those defined in the Australian and Canadian data; the slightly different immigrant cohorts defined in the U.S.data are as follows: pre-1970, 1970-74, 1975-79, 1980-84, and 1985-90. The immigrant cohort coefficientsreported in this table have been normalized to represent immigrant-native income differentials for men who areaged 25-29 (in both specifications) and who have 12 years of education (in specification (2)). Sampling weightswere used in the U.S. calculations.
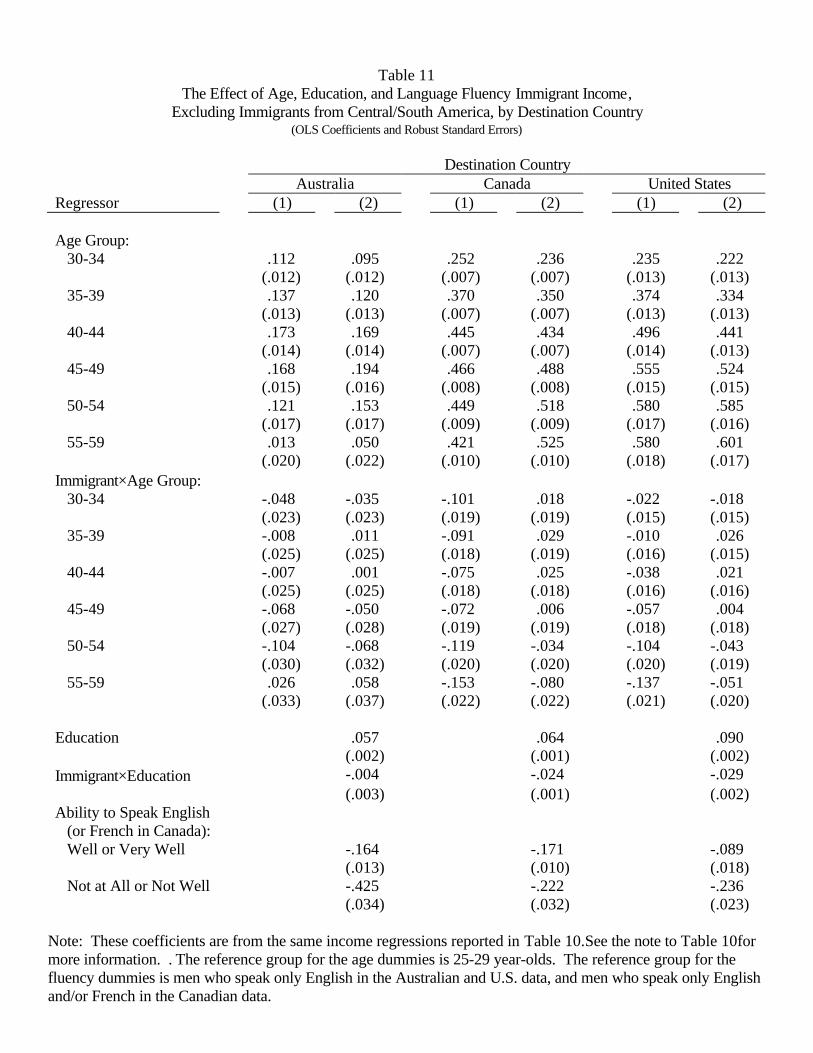
Table 11The Effect of Age, Education, and Language Fluency Immigrant Income,
Excluding Immigrants from Central/South America, by Destination Country(OLS Coefficients and Robust Standard Errors)
Destination CountryAustralia Canada United States
Regressor (1) (2) (1) (2) (1) (2)
Age Group: 30-34 .112 .095 .252 .236 .235 .222
(.012) (.012) (.007) (.007) (.013) (.013) 35-39 .137 .120 .370 .350 .374 .334
(.013) (.013) (.007) (.007) (.013) (.013) 40-44 .173 .169 .445 .434 .496 .441
(.014) (.014) (.007) (.007) (.014) (.013) 45-49 .168 .194 .466 .488 .555 .524
(.015) (.016) (.008) (.008) (.015) (.015) 50-54 .121 .153 .449 .518 .580 .585
(.017) (.017) (.009) (.009) (.017) (.016) 55-59 .013 .050 .421 .525 .580 .601
(.020) (.022) (.010) (.010) (.018) (.017)Immigrant×Age Group: 30-34 -.048 -.035 -.101 .018 -.022 -.018
(.023) (.023) (.019) (.019) (.015) (.015) 35-39 -.008 .011 -.091 .029 -.010 .026
(.025) (.025) (.018) (.019) (.016) (.015) 40-44 -.007 .001 -.075 .025 -.038 .021
(.025) (.025) (.018) (.018) (.016) (.016) 45-49 -.068 -.050 -.072 .006 -.057 .004
(.027) (.028) (.019) (.019) (.018) (.018) 50-54 -.104 -.068 -.119 -.034 -.104 -.043
(.030) (.032) (.020) (.020) (.020) (.019) 55-59 .026 .058 -.153 -.080 -.137 -.051
(.033) (.037) (.022) (.022) (.021) (.020)
Education .057 .064 .090(.002) (.001) (.002)
Immigrant×Education -.004 -.024 -.029(.003) (.001) (.002)
Ability to Speak English (or French in Canada): Well or Very Well -.164 -.171 -.089
(.013) (.010) (.018) Not at All or Not Well -.425 -.222 -.236
(.034) (.032) (.023)
Note: These coefficients are from the same income regressions reported in Table 10.See the note to Table 10formore information. . The reference group for the age dummies is 25-29 year-olds. The reference group for thefluency dummies is men who speak only English in the Australian and U.S. data, and men who speak only Englishand/or French in the Canadian data.
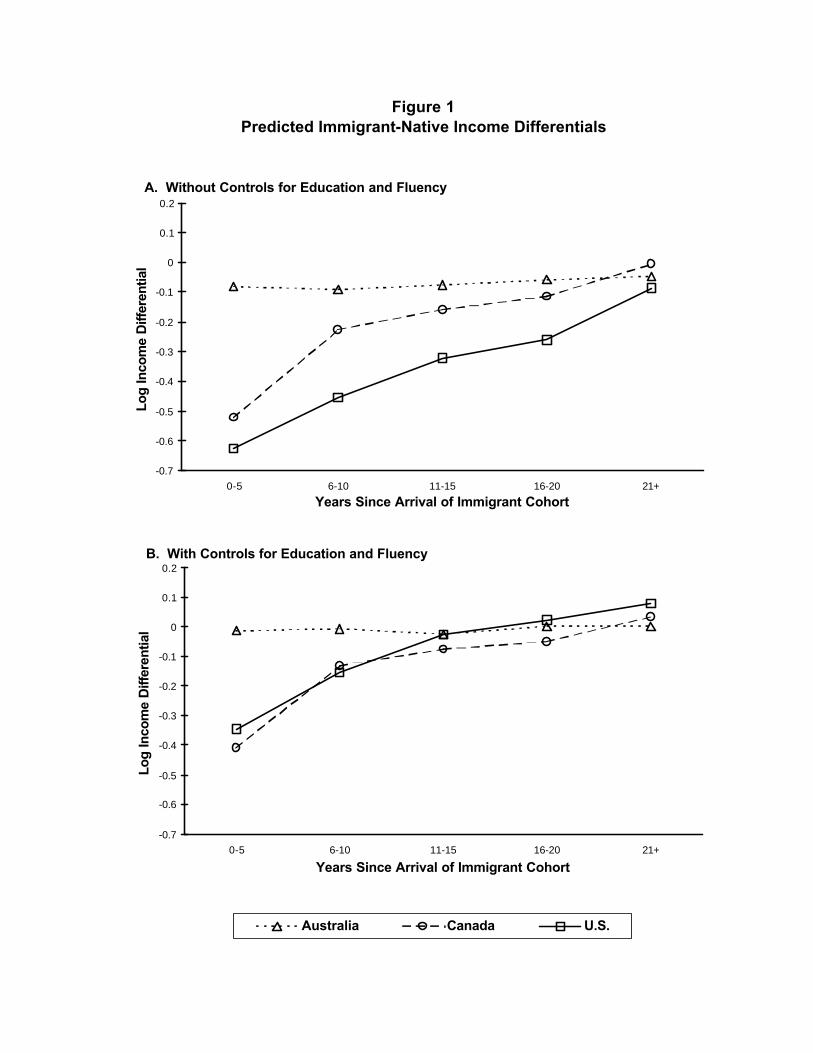
Figure 1Predicted Immigrant-Native Income Differentials
A. Without Controls for Education and Fluency
-0.7
-0.6
-0.5
-0.4
-0.3
-0.2
-0.1
0
0.1
0.2
0-5 6-10 11-15 16-20 21+
Years Since Arrival of Immigrant Cohort
Log
Inco
me
Diff
eren
tial
B. With Controls for Education and Fluency
-0.7
-0.6
-0.5
-0.4
-0.3
-0.2
-0.1
0
0.1
0.2
0-5 6-10 11-15 16-20 21+
Years Since Arrival of Immigrant Cohort
Log
Inco
me
Diff
eren
tial
Australia Canada U.S.
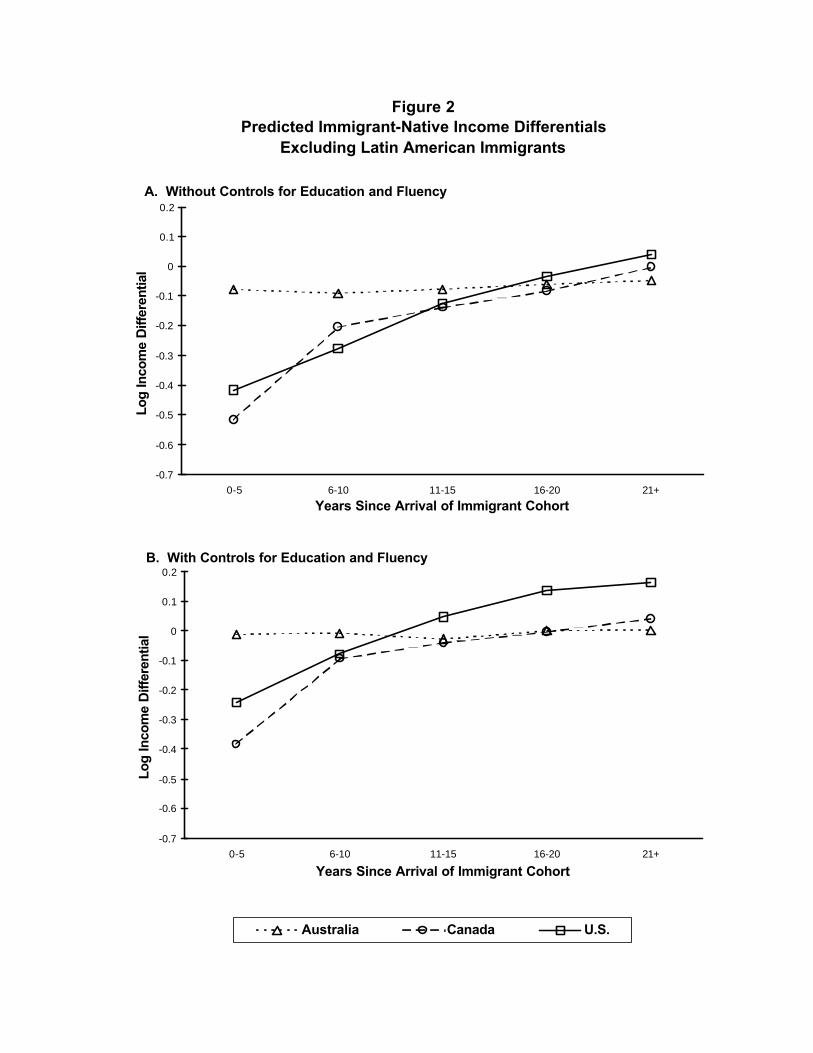
Figure 2Predicted Immigrant-Native Income Differentials
Excluding Latin American Immigrants
A. Without Controls for Education and Fluency
-0.7
-0.6
-0.5
-0.4
-0.3
-0.2
-0.1
0
0.1
0.2
0-5 6-10 11-15 16-20 21+
Years Since Arrival of Immigrant Cohort
Log
Inco
me
Diff
eren
tial
B. With Controls for Education and Fluency
-0.7
-0.6
-0.5
-0.4
-0.3
-0.2
-0.1
0
0.1
0.2
0-5 6-10 11-15 16-20 21+
Years Since Arrival of Immigrant Cohort
Log
Inco
me
Diff
eren
tial
Australia Canada U.S.