the regional economic impact of corpus · pdf filecorpus christi regional transportation...
TRANSCRIPT
THE REGIONAL ECONOMIC IMPACT OF CORPUS CHRISTI
REGIONAL TRANSPORTATION AUTHORITY
Prepared for
Corpus Christi Regional Transportation Authority
5658 Bear Lane, Corpus Christi, Texas 78405
Prepared by
Jim Lee, Ph.D.
Texas A&M University-Corpus Christi [email protected]
December 2006

TABLE OF CONTENTS
Page BULLET SUMMARY iv 1. INTRODUCTION ………………………………………………………………… 1 2.1 Objective …………………………………………………………………….. 1 2.2 Research Scope and Methodology .………………………………………. 1 2. BACKGROUND …………………………………………………………………. 2 2.1 Authority Profile …………………………………………………………….. 2 2.2 Services ……………………………………………………………………… 2 2.3 Operating Budget …………………………………………………………… 5 2.4 Area Profile ………………………………………………………………….. 6 3. OPERATIONAL IMPACTS …………………………………………………….. 9 3.1 Direct Impacts …………………………………………………………….… 9 3.2 Secondary Impacts ………………………………………………………… 10 3.3 Multiplier Effects ………………………………………………………….… 11 3.4 Total Operational Impacts …………………………………………………. 12 4. AFFORDABLE MOBILITY ……………………………………………………... 14 4.1 Spending Value Benefit ……………………………………………………. 14 4.2 Expanded Opportunity Benefit …………………………………………….. 16 4.3 Total Affordable Mobility Benefits ……………………………………….… 18 5. CONGESTION RELIEF …………………………………………………………. 19 5.1 Travel Time Savings ……………………………………………………….. 19 5.2 Other Cost Savings ………………………………………………………… 20 5.3 Total Congestion Relief Benefits …………………………………………. 21 6. TOTAL ECONOMIC IMPACTS ………………………………………………… 21 6.1 Output and Employment Impacts …………….…………………………... 21 6.2 Fiscal Impacts ………………………………………………………………. 22 7. CONCLUSION ……………………………………………………………………… 23
ii
TABLE OF CONTENTS (Continued) PageEXHIBITS Exhibit 1.1 Economic Impact Summary ……………………………………………. 1Exhibit 2.1 Public Transit Passenger Trips (000’s), 1996-2005 …………………. 1Exhibit 2.2 CCRTA Primary Service Area ………………………………………….. 4Exhibit 2.3 Revenue Sources, 2005 ………………………………………………… 5Exhibit 2.4 Expenditure Sources, 2005 …………………………………………….. 6Exhibit 2.5 Socioeconomic Characteristics by Census Tract. ……………………. 8Exhibit 3.1 Operational Economic Impacts ………………………………………… 10Exhibit 3.2 Schematic Diagram of Economic Impacts. ……………………………. 11Exhibit 3.3 Total Operational Impacts …………………………...………………….. 12Exhibit 3.4 Direct and Secondary Operational Impacts …………………………… 13Exhibit 4.1 Trips Displaced by Public Transit ……………………………………… 15Exhibit 4.2 Costs of Alternative Transportation Modes ……………………….…... 16Exhibit 4.3 Expanded Opportunity Benefit …………………………………………. 18Exhibit 4.4 Affordable Mobility Benefits …………………………………………….. 18Exhibit 5.1 Congestion Relief Benefits .…………………………………………….. 21Exhibit 6.1 Total Output and Employment Impacts ..…….………………………... 21Exhibit 6.2 Impacts on Indirect Business Tax Revenues .………………………… 22Exhibit 6.3 Return on Local Taxes ………………………………………………….. 23 APPENDIX Primary Data Sources .………………………………………………………………… 25
iii

BULLET SUMMARY
The Regional Economic Impact of Corpus Christi Regional Transportation Authority
This study provides a quantitative assessment of the impact of CCRTA on the regional economy of Corpus Christi. Economic impacts arise from operating the public transit system as well as from the economic benefits to both transit riders and other residents within the community. The study concludes with a cost-benefit analysis on local tax support. Operational Benefits Direct Impacts • $18.2 million in output, $8.5 million in household earnings, and 289 jobs Total Impacts, including Indirect & Induced Impacts • $29.1 million in output, $12.1 million in household earnings, and 424 jobs Affordable Mobility Benefits • $6.3 million in spending value benefits • $8.3 million in expanded opportunity benefits • $14.7 million and 740 jobs in total affordable mobility benefits Congestion Relief Benefits • $2.4 million in travel time savings • $6.8 million in vehicle operating cost savings • $1.6 million in enhanced safety • $0.7 million in enhanced air quality • $11.6 million and 584 jobs in total congestion relief benefits Total Economic Impacts • $55.4 million and 1,748 jobs in operational, affordable mobility and congestion relief
benefits Fiscal Analysis • $1.36 million annually in total indirect business tax impacts • $1 million annually in local tax revenues from total operational impacts • $0.3 million annually in local tax revenues from forgone earnings benefits • The return on funding from each local tax dollar is $2.93
iv

1. INTRODUCTION
1.1 Objective
Corpus Christi Regional Transportation Authority (CCRTA) commissioned Texas A&M University-Corpus Christi to conduct a study that analyzes the regional economic impact of the public transit system in the Corpus Christi metro area. CCRTA is the primary provider of public transportation in the region. The primary objective of this report is to provide a quantitative assessment of the impact that CCRTA instills on various parts of the Corpus Christi community. The contributions of CCRTA to the regional economy are measured by the value of economic activity enhanced by presence of the public transit system. This report concludes with a cost-benefit analysis that compares the economic benefits of public transit with local tax funding.
1.2 Research Scope and Methodology Public transportation benefits local communities in diverse ways. This study
relies on the methodology and guidelines established by the Federal Transit Administration, as detailed in Lewis (1999).1 As summarized in Exhibit 1.1, this study examines four areas of economic impacts associated with the public transit system in Corpus Christi.
Exhibit 1.1 Economic Impact Summary Category Description
Operational Impacts • Direct impacts • Indirect impacts • Income-induced impacts
Affordable Mobility Benefits
• Spending value • Expanded employment opportunities for riders
Congestion Relief Benefits
• Savings on travel time and vehicle operations for riders • Increased efficiency on less congested roads for non-
riders • Enhanced road safety • Enhanced area air quality
Fiscal Impacts
• Tax revenue changes • Return on tax dollar
1 David Lewis and Fred Williams (1999), Policy and Planning as Public Choice: Mass Transit in the
United States, Brookfield: Ashgate.
- 1 -

The first area of economic impacts arises from the operation of the public transit system as a business enterprise. The second area represents economic benefits related to the access of affordable mobility, which leads to higher living standards for low-income households. The third area of economic impacts arises from cost savings for riders, congestion relief for non-riders, as well as enhanced road safety and air quality for the entire community. The fourth area of economic impacts is measured by changes in local tax revenues as a result of the benefits of the pubic transit system on local income and employment. Such fiscal impact analysis provides insights into the payoffs of the local tax dollars that help fund the public transit system.
2. BACKGROUND
2.1 Authority Profile CCRTA was created in 1985 by majority vote of Corpus Christi taxpayers in order
to provide accessible and affordable transportation to residents within the Corpus Christi metro area. Today, the Authority remains the sole provider of public transportation services in Corpus Christi. The Authority’s service area includes all of Nueces County (except Petronila) and part of San Patricio County. Nueces County includes the cities of Agua Dulce, Bishop, Corpus Christi, Driscoll, Port Aransas, Robstown, and some unincorporated areas. The service area in San Patricio County includes the cities of Gregory and San Patricio. According to the 2000 (latest) Census, the Authority’s total service area includes 838 square miles and has a population of 317,015.
2.2 Services CCRTA serves Corpus Christi either directly or through contractors. According to
the Authority, its major services include fixed route services known as the B to area residents and tourists alike. For those whose disabilities prevent them from accessing fixed route bus services, para-transit bus service—called B-Line—is available. In addition, CCRTA offers van and car pool services, along with charter and transit services for special public events. The ground transportation services are maintained with a fleet of 77 motorbus coaches and 43 demand responsive vehicles, along with over 1,400 bus stops and shelters, and seven transfer stations. In addition to ground transportation, CCRTA also utilizes a contracted ferryboat to provide Harbor Ferry services during the summer.
- 2 -
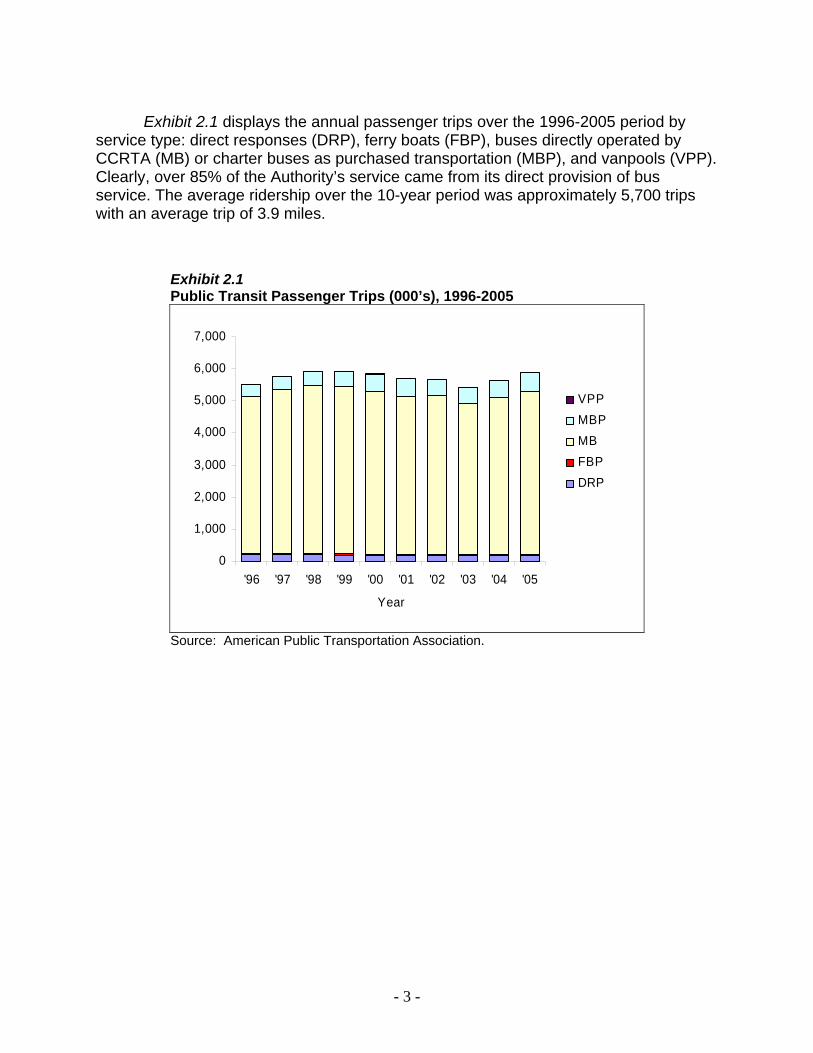
Exhibit 2.1 displays the annual passenger trips over the 1996-2005 period by
service type: direct responses (DRP), ferry boats (FBP), buses directly operated by CCRTA (MB) or charter buses as purchased transportation (MBP), and vanpools (VPP). Clearly, over 85% of the Authority’s service came from its direct provision of bus service. The average ridership over the 10-year period was approximately 5,700 trips with an average trip of 3.9 miles.
Exhibit 2.1 Public Transit Passenger Trips (000’s), 1996-2005
0
1,000
2,000
3,000
4,000
5,000
6,000
7,000
'96 '97 '98 '99 '00 '01 '02 '03 '04 '05
Year
VPPMBPMBFBPDRP
Source: American Public Transportation Association.
- 3 -

Exhibit 2.2 presents a map of CCRTA’s current main service area in Nueces and San Patricio counties.2 The fixed bus routes are highlighted by thick color lines.
Exhibit 2.2 CCRTA Primary Service Area
Sources: CCRTA and Texas A&M University-Corpus Christi.
2 Jane L. Crowson, David E. Leasure, Robert W. Smith, and Frederick P. Worthen (1997), A GIS for
Public Transit, Texas A&M University-Corpus Christi and Corpus Christi Regional Transportation Authority. Available online at http://gis.esri.com/library/userconf/proc97/proc97/to400/pap359/p359.htm.
- 4 -
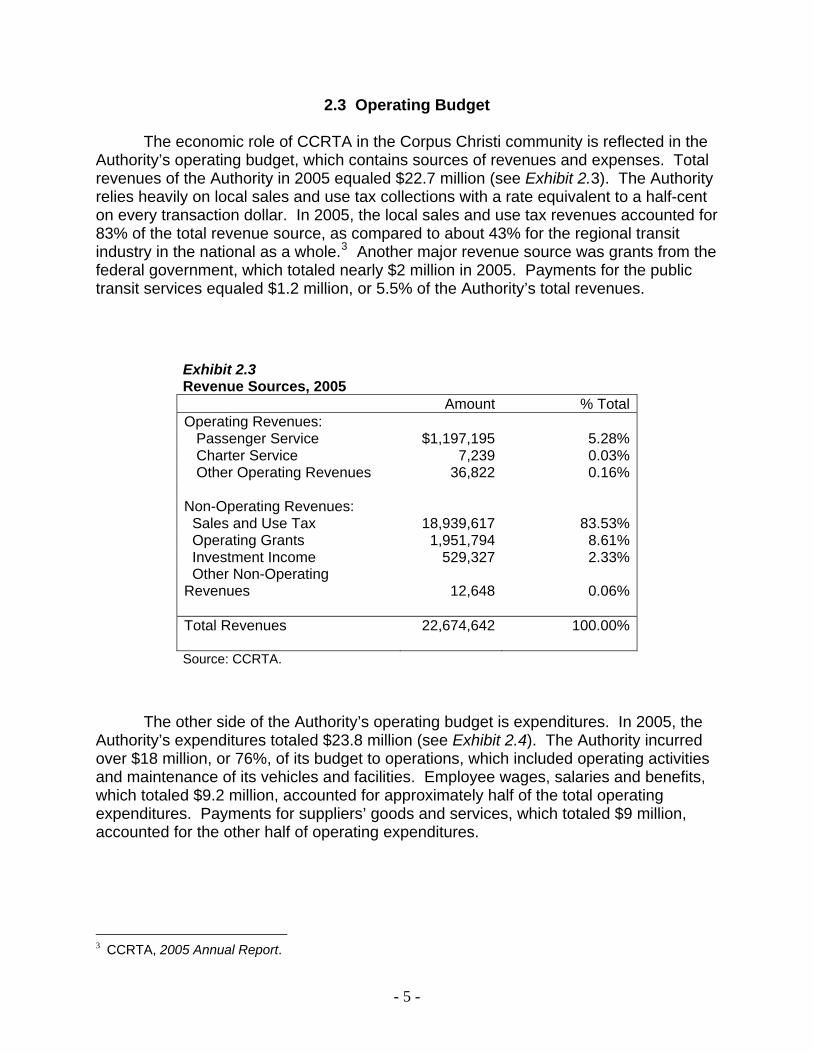
2.3 Operating Budget The economic role of CCRTA in the Corpus Christi community is reflected in the Authority’s operating budget, which contains sources of revenues and expenses. Total revenues of the Authority in 2005 equaled $22.7 million (see Exhibit 2.3). The Authority relies heavily on local sales and use tax collections with a rate equivalent to a half-cent on every transaction dollar. In 2005, the local sales and use tax revenues accounted for 83% of the total revenue source, as compared to about 43% for the regional transit industry in the national as a whole.3 Another major revenue source was grants from the federal government, which totaled nearly $2 million in 2005. Payments for the public transit services equaled $1.2 million, or 5.5% of the Authority’s total revenues.
Exhibit 2.3 Revenue Sources, 2005 Amount % Total Operating Revenues: Passenger Service $1,197,195 5.28% Charter Service 7,239 0.03% Other Operating Revenues 36,822 0.16% Non-Operating Revenues: Sales and Use Tax 18,939,617 83.53% Operating Grants 1,951,794 8.61% Investment Income 529,327 2.33% Other Non-Operating Revenues 12,648 0.06% Total Revenues 22,674,642 100.00% Source: CCRTA.
The other side of the Authority’s operating budget is expenditures. In 2005, the Authority’s expenditures totaled $23.8 million (see Exhibit 2.4). The Authority incurred over $18 million, or 76%, of its budget to operations, which included operating activities and maintenance of its vehicles and facilities. Employee wages, salaries and benefits, which totaled $9.2 million, accounted for approximately half of the total operating expenditures. Payments for suppliers’ goods and services, which totaled $9 million, accounted for the other half of operating expenditures.
3 CCRTA, 2005 Annual Report.
- 5 -

Exhibit 2.4 Expenditure Sources, 2005 Amount % Total Operating Expenditures $18,190,312 76.30% Depreciation 4,394,500 18.43% Non-Operating Expenditures 1,255,302 5.27% Total Expenditures 23,840,114 100.00% Source: CCRTA.
For the 10-year period ending in 2005 (1996-2005), CCRTA’s budget expanded on average approximately 3.5% per year.4 Similarly, its major revenue source from local sales and use tax collections grew at approximately 3% per year on average. Adjusted for overall price inflation, the total budget (in real terms) was nearly constant over that 10-year period.
2.4 Area Profile
The public transit system in Corpus Christi relies heavily on local financial support through sales and use tax collections. As a result, CCRTA’s operating budget is affected to a great extent by the region’s overall economic conditions. According to the Bureau of Economic Analysis, personal income per person for Corpus Christi is $28,539, as compared to $34,586 for the U.S.5 Over the 10-year period ending in 2005, local personal income in current dollars grew at an average annual rate of 4.4%, which was consistent with the national average of 4.0%. Meanwhile, local retail sales grew more slowly at 1.1% annually. Similarly, the area witnessed steady but relatively slow growth in population and employment. The size of local population grew on average 0.6% annually and local employment gained 1.3% annually. Such measures of local economic conditions also reflect recent changes in the local tax revenues that help finance the public transit system.
The geographically dispersed nature of Corpus Christi not only affects the operation of the local transit system, but it also poses a challenge to low-income residents to access employment-related and other socioeconomic activities. In addition, the regional population is socio-economically diverse. The maps in Exhibit 2.5, which are prepared by the Corpus Christi Metropolitan Planning Organization, illustrate the geographic distributions of the area population by Census tract on the basis of different
4 Ibid. 5 U.S. Department of Commerce, Bureau of Economic Analysis, Survey of Current Business (2005).
- 6 -
socioeconomic characteristics.6 These maps together highlight a demographically diverse population within CCRTA’s service area. Census tracts near the west side and downtown of Corpus Christi, and Robstown have high percentages of high unemployment, families living in poverty, persons with disabilities, as well as housing units without vehicles. Similarly, economic development occurs rather unevenly within Corpus Christi. Employment centers are located mainly along South Padre Island Drive, downtown and the ship channel. The geographically disparity between major employment centers and low-income and other transportation-disadvantaged population segments in Corpus Christi highlights the role of a local public transportation provider. As such a provider, CCRTA serves to improve access of these population segments for employment, education and medical care purposes. The Authority plays a vital role in improving mobility of low-income groups. According to American Public Transportation Association’s (APTA) data for a metro area in the size of Corpus Christi, 54% of bus riders earn an annual income under $15,000. In addition, over 40% of bus trips are for work, and nearly 20% of the trips are for school. These data are in line with the results from CCRTA’s latest survey.
6 Corpus Christi Metropolitan Planning Organization (2003), Job Access and Reverse Commute
Transportation Plan.
- 7 -

Exhibit 2.5 Socioeconomic Characteristics by Census Tract a. Unemployed Persons
b. Families in Poverty
c. Persons with Disability d. Houses without Vehicles
Source: Corpus Christi Metropolitan Planning Organization.
- 8 -

3. OPERATIONAL IMPACTS
The public transit system in Corpus Christi benefits the regional economy in diverse ways. The first area of its economic contributions to Corpus Christi arises from its provision of public transit services to the local community as an enterprise. To maintain its operations, CCRTA incurs expenditures on resources, such as labor and capital. To the extent that many of these resources are provided by business vendors within Corpus Christi, the Authority directly benefits these suppliers. Its employment of local workforce, from managers to bus drivers, represents another positive impact on the Corpus Christi economy.
The economic impact associated with CCRTA as an enterprise is measured
alternatively by output, household earnings, and employment associated with expenditures that it incurs to operate the public transit system. The total expenditures, which directly benefit the Authority’s employees and business suppliers, are only part of the total economic impact. The initial impact on the local economy is called a direct impact. When the dollars in the direct impact are spent within the community, there are secondary impacts on local economic activity. The total economic impact on Corpus Christi, therefore, measures the extent to which different industries and households across the area are affected by the presence of the public transit system. All estimates of the operational economic impacts are based on CCRTA’s 2005 budget.
3.1 Direct Impacts
The direct economic impacts arise from the benefits that CCRTA contributes to its employees and business suppliers for utilizing their goods and services. The Authority directly employs 200 local residents and 89 contractors. As indicated in the preceding section, payments to these individuals totaled $18.2 million in 2005. In this sense, the total direct economic impact is estimated at $18.2 million, which generates $12.5 million in value-added output or business activity (see Exhibit 3.1).7 The direct employment impact is 289 full-time-equivalent jobs and total household earnings of $8.5 million in the form of wages, salaries, and other earnings.
7 In this report, total output is the broadest measure of economic activity and refers to gross business
revenues that might include output produced with resources outside the region. By comparison, value-added output refers to the amount of output that is produced using local resources.
- 9 -
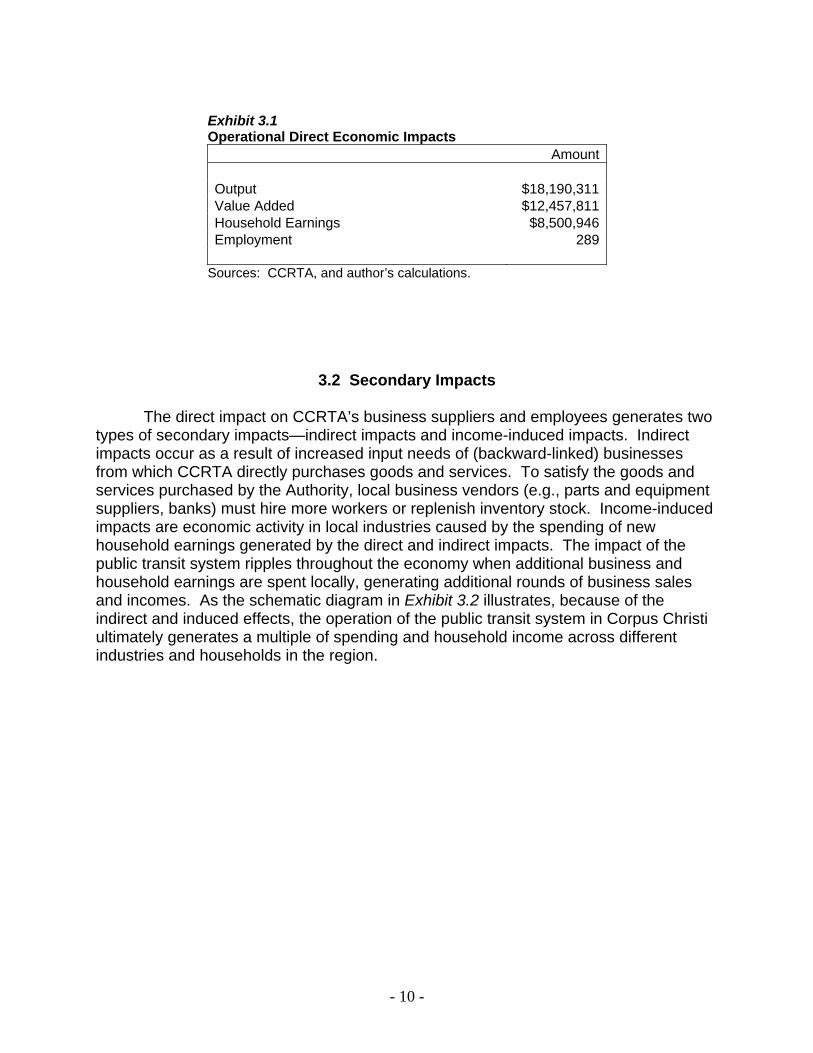
Exhibit 3.1 Operational Direct Economic Impacts Amount Output $18,190,311 Value Added $12,457,811 Household Earnings $8,500,946 Employment 289
Sources: CCRTA, and author’s calculations.
3.2 Secondary Impacts
The direct impact on CCRTA’s business suppliers and employees generates two types of secondary impacts—indirect impacts and income-induced impacts. Indirect impacts occur as a result of increased input needs of (backward-linked) businesses from which CCRTA directly purchases goods and services. To satisfy the goods and services purchased by the Authority, local business vendors (e.g., parts and equipment suppliers, banks) must hire more workers or replenish inventory stock. Income-induced impacts are economic activity in local industries caused by the spending of new household earnings generated by the direct and indirect impacts. The impact of the public transit system ripples throughout the economy when additional business and household earnings are spent locally, generating additional rounds of business sales and incomes. As the schematic diagram in Exhibit 3.2 illustrates, because of the indirect and induced effects, the operation of the public transit system in Corpus Christi ultimately generates a multiple of spending and household income across different industries and households in the region.
- 10 -
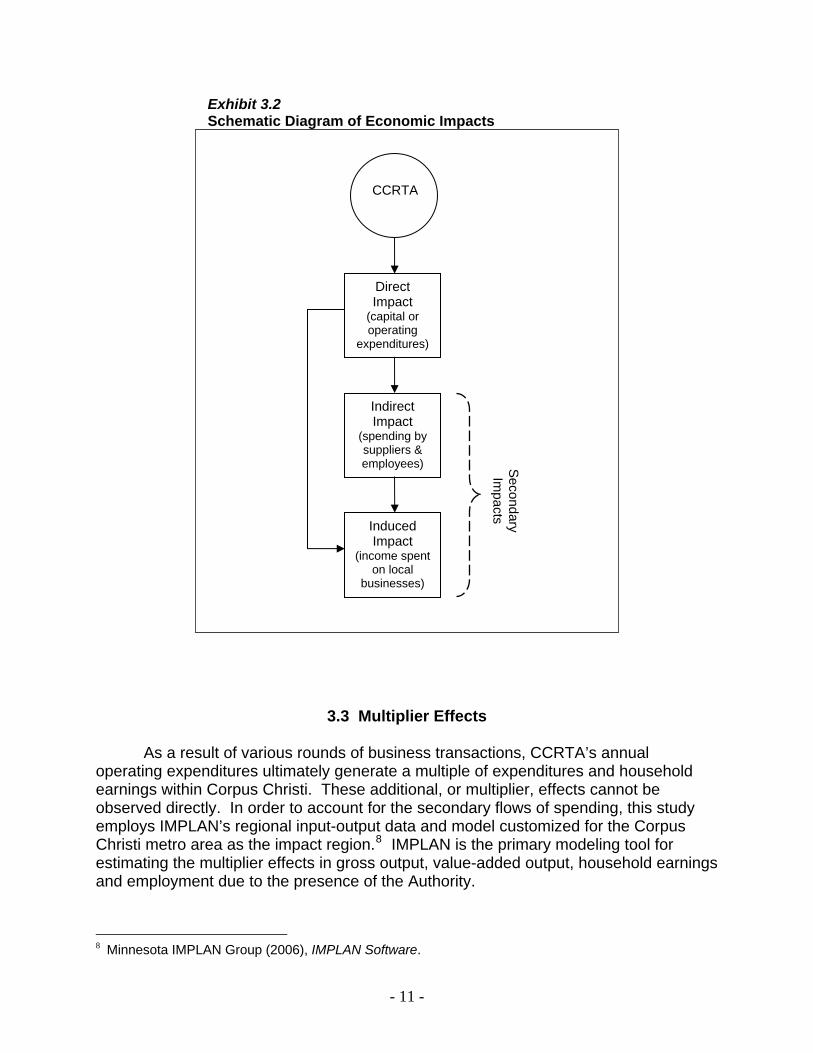
Exhibit 3.2 Schematic Diagram of Economic Impacts
CCRTA
Direct Impact
(capital or operating
expenditures)
Indirect Impact
(spending by suppliers & employees)
Induced Impact
(income spent on local
businesses)
Secondary Im
pacts
3.3 Multiplier Effects
As a result of various rounds of business transactions, CCRTA’s annual operating expenditures ultimately generate a multiple of expenditures and household earnings within Corpus Christi. These additional, or multiplier, effects cannot be observed directly. In order to account for the secondary flows of spending, this study employs IMPLAN’s regional input-output data and model customized for the Corpus Christi metro area as the impact region.8 IMPLAN is the primary modeling tool for estimating the multiplier effects in gross output, value-added output, household earnings and employment due to the presence of the Authority.
8 Minnesota IMPLAN Group (2006), IMPLAN Software.
- 11 -
The output multiplier for the Corpus Christi public transit industry is 1.24 for the indirect effect and 0.36 for the income-induced effect, implying a multiplier of 1.60 for the secondary effects. This multiplier further implies that a $1 spending by CCRTA generates another $0.6 in output across different industries in Corpus Christi.
Alternatively, the multiplier effect can be measured by the change in regional
employment as a result of one person directly employed by CCRTA. According to IMPLAN, the employment of 100 full-time employees for the public transit system generates another 47 full-time equivalent jobs in Corpus Christi, of which 16 jobs are associated with the indirect effect and 31 jobs are associated with the income-induced effect.
3.4 Total Operational Impacts
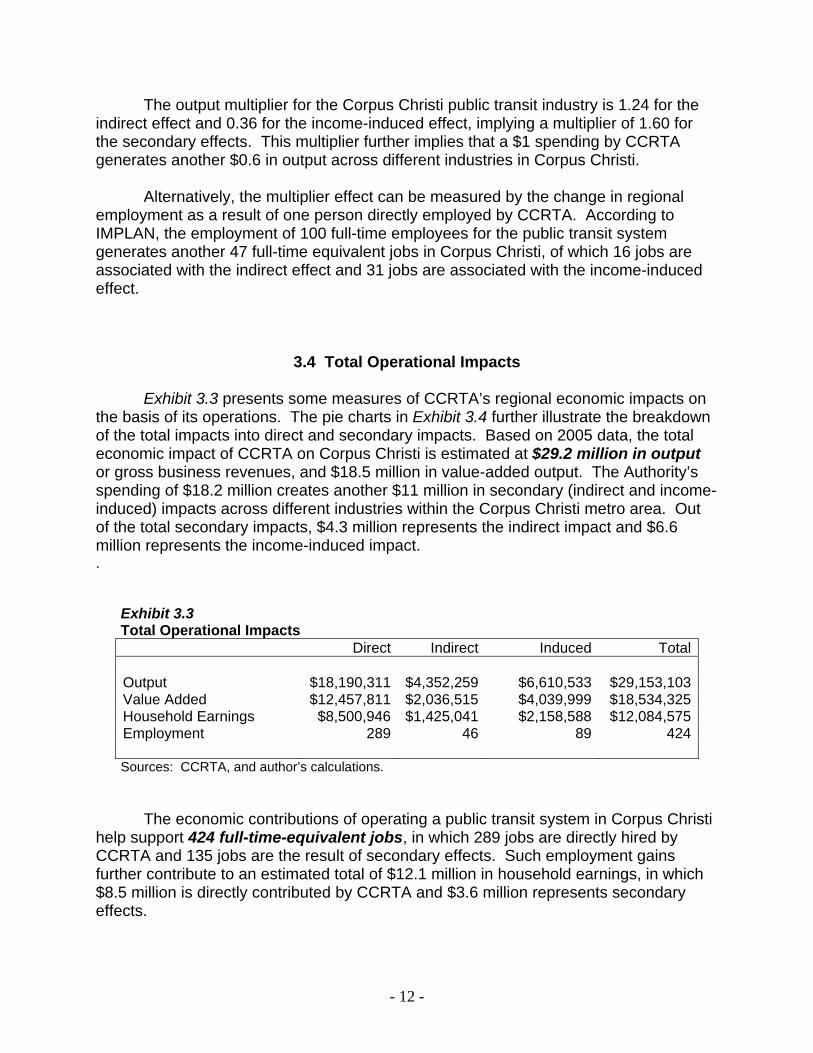
Exhibit 3.3 presents some measures of CCRTA’s regional economic impacts on the basis of its operations. The pie charts in Exhibit 3.4 further illustrate the breakdown of the total impacts into direct and secondary impacts. Based on 2005 data, the total economic impact of CCRTA on Corpus Christi is estimated at $29.2 million in output or gross business revenues, and $18.5 million in value-added output. The Authority’s spending of $18.2 million creates another $11 million in secondary (indirect and income-induced) impacts across different industries within the Corpus Christi metro area. Out of the total secondary impacts, $4.3 million represents the indirect impact and $6.6 million represents the income-induced impact. .
Exhibit 3.3 Total Operational Impacts Direct Indirect Induced Total Output $18,190,311 $4,352,259 $6,610,533 $29,153,103Value Added $12,457,811 $2,036,515 $4,039,999 $18,534,325Household Earnings $8,500,946 $1,425,041 $2,158,588 $12,084,575Employment 289 46 89 424 Sources: CCRTA, and author’s calculations.
The economic contributions of operating a public transit system in Corpus Christi help support 424 full-time-equivalent jobs, in which 289 jobs are directly hired by CCRTA and 135 jobs are the result of secondary effects. Such employment gains further contribute to an estimated total of $12.1 million in household earnings, in which $8.5 million is directly contributed by CCRTA and $3.6 million represents secondary effects.
- 12 -

Exhibit 3.4 Direct and Secondary Operational Impacts a. Output
Direct$18,190,311 Induced
$6,610,533
Indirect$4,352,259
Secondary $10,962,792
b. Employment
Induced89
Indirect46
Direct289
Secondary 135
Sources: Author’s calculations.
- 13 -
4. AFFORDABLE MOBILITY
As evident in Exhibits 2.2 and 2.5 above, the public transit system in Corpus
Christi serves largely individuals who do not have access to a vehicle—students, low-income and disabled individuals. Without public transit services, many of these residents with no other means of transportation would forgo shopping and employment opportunities, or spend more of their incomes on other transportation modes, such as taxis and carpooling. In this sense, the more affordable public transportation mode raises the living standards of low-income households and other transportation-disadvantaged individuals by expanding their economic opportunities. The employment benefits and cost savings for these individuals raise their consumption of goods and services that would otherwise be spent on local transportation.
The benefits of affordable mobility are broken down in two categories. The first
type of benefits is called spending value benefit, which represents the total amount that riders of public transit reallocate their savings from using public transit to consuming other (non-transportation related) goods and services. The second type of benefits is called expanded opportunity benefit, which arises from riders’ greater access to employment opportunity.
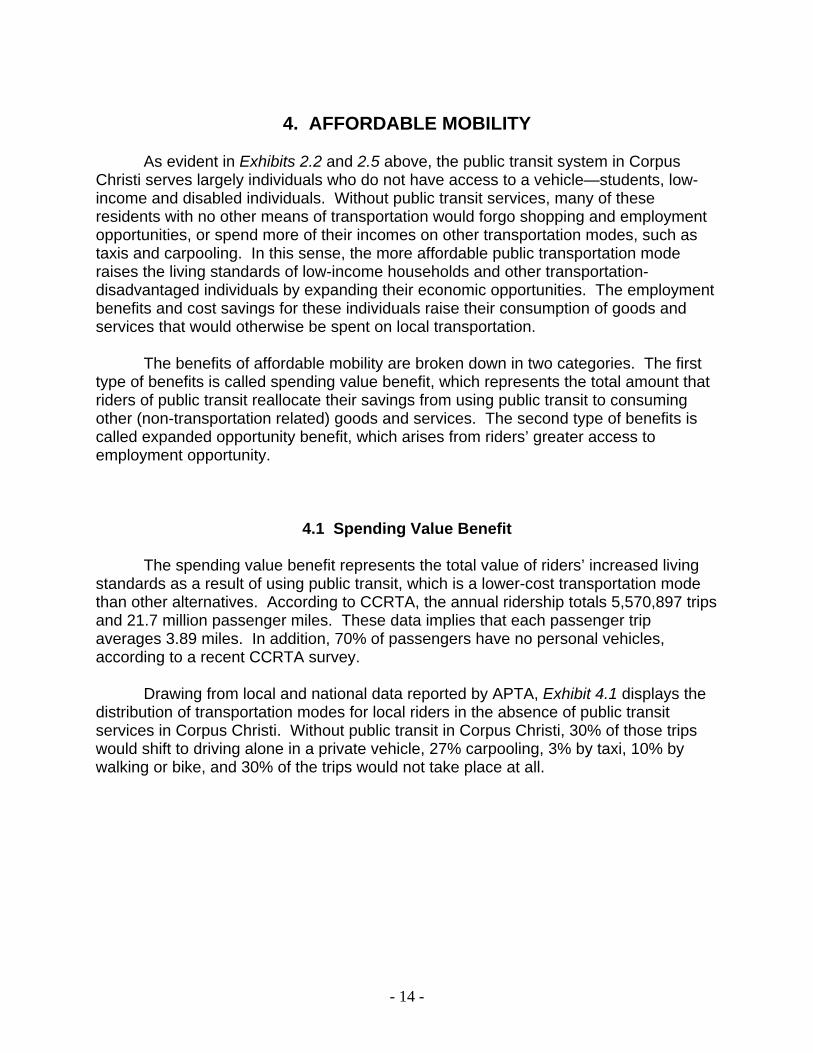
4.1 Spending Value Benefit
The spending value benefit represents the total value of riders’ increased living standards as a result of using public transit, which is a lower-cost transportation mode than other alternatives. According to CCRTA, the annual ridership totals 5,570,897 trips and 21.7 million passenger miles. These data implies that each passenger trip averages 3.89 miles. In addition, 70% of passengers have no personal vehicles, according to a recent CCRTA survey.
Drawing from local and national data reported by APTA, Exhibit 4.1 displays the
distribution of transportation modes for local riders in the absence of public transit services in Corpus Christi. Without public transit in Corpus Christi, 30% of those trips would shift to driving alone in a private vehicle, 27% carpooling, 3% by taxi, 10% by walking or bike, and 30% of the trips would not take place at all.
- 14 -

Exhibit 4.1 Trips Displaced by Public Transit
Driving Alone30%
Carpool27%
Taxi3%
Forgone Trips30%
Walk/Bike10%
Sources: CCRTA, and author’s calculations.
Even though the majority (70%) of the trips would still occur in the absence of
public transit services in Corpus Christi, the average cost of the alternatives is substantially higher than the average fare for public transit. For CCRTA, the average price per passenger trip is $0.21. This is calculated as dividing the total revenue from passenger services in 2005 by the total number of passenger trips.
Avg. trip price = (Total passenger revenue) / (# Trips) $0.21 = $1,197,195 / 5,570,897 Except for walking and biking that incur no costs, all alternative transportation
modes involve higher costs than the average fare for local public transit. As detailed in Exhibit 4.2, the average total cost is $4.03 for driving alone, $2.02 for carpooling, and $12 for a taxi ride.9 Weighted by the proportions of shifted trips, the average cost for these alternatives is $2.11.
9 The data draw on American Automobile Association (2006), Your Driving Costs 2006. The cost factors
in average parking fees and vehicle operating costs, such as fuel, routine maintenance, tires, insurance, license and registration, loan finance charges and depreciation costs.
- 15 -

Exhibit 4.2 Costs of Alternative Transportation Modes Average Cost Weighted Cost Solo Driving $4.03 $1.21 Carpooling $2.02 $0.54 Taxi $12 $0.36 Walking/Biking — — Total Average $2.11 Source: Author’s calculations.
In the absence of public transit, approximately 3.34 million trips would be shifted
to other paying transportation modes (i.e., by vehicle). The difference between the average price of public transit ($0.21) and the average price of its alternative transportation modes ($2.11) represents savings for riders of public transit. The savings totals $6.3 million annually. This result means that the public transit system in Corpus Christi frees up $6.3 million in the community each year that would be reallocated to consuming non-transportation related goods and services. This spending value impact is translated into an employment impact of 412 full-time equivalent jobs.
Spending value = [(Price of alternatives) – (Price of transit)] x (# Shifted trips) $6,345,245 = [ $2.11 – $0.21 ] x 3,342,538
4.2 Expanded Opportunity Benefit
The expanded opportunity benefit represents the value of extra economic well-being for individuals who use public transportation for employment purposes, including travel to and from work, and for employment training. Estimation of this benefit is based on the number of jobs or the amount of earnings that would have been lost had transit riders forgone their employment-related trips in the absence of public transportation.
Based on the latest CCRTA survey and Census data, 41% of passenger trips are
for employment purposes. In addition, 54% of transit riders belong to low-income groups earning less than $1,500 per year. These individuals rely totally on pubic transit to and from work. As Exhibit 4.1 above indicates, 30% of total trips in Corpus Christi, i.e., 1.67 million trips, would not have occurred without public transit. The total number of forgone work trips is the product of the percentage of work trips, the percentage of low income riders, and the total number of forgone trips. Accordingly, the estimate for the number of forgone work trips is 370,019.
- 16 -

# Forgone work trips = (% Work trips) x (% Low income riders) x (# Forgone trips)
370,019 = 41% x 54% x 1,671,269 The total number of forgone work trips can be translated into the total number of
full-time equivalent jobs lost in the absence of public transit. For an average employment period of 50 weeks per year and 10 trips per week, the total number of forgone work trips per rider is 500. The total number of forgone jobs can therefore be calculated by first multiplying the number of forgone work trips by the percentage of work trips that would have been lost in the absence of public transit, and then divide the product by the number of annual work trips per rider. The result is 303 jobs.
# forgone jobs = [ (% Ridership for work would lose their job in the absence of public transit) x (# Forgone work trips) ] / (# Annual work trips per rider)
303 = [ 41% x 370,019 ] / 500
Drawing on Census data, the average annual income of transit riders in Corpus Christi is $15,390. The loss of 303 jobs, therefore, results in $4.67 million in annual forgone income. This total amount of forgone income represents the loss of local household income per year in the absence of public transportation.
Total forgone income = (# forgone jobs) x (Avg. income of riders) $4,669,566 = 303 x $15,390 Similar to the CCRTA’s operations, the direct benefits to transit riders in terms of
employment and income earnings create ripple effects across different industries of the Corpus Christi economy. The employment impact on riders generates multiplier effects, particularly induced-income effects, on local businesses when employment gains stimulate spending on goods and services locally.
Based on IMPLAN data, the income multiplier for the average household in
Corpus Christi is 1.78, and the employment multiplier is 1.09. Accordingly, the employment benefit of 303 jobs generates a secondary effect of 25 jobs, so that the total employment impact is 328 jobs (See Exhibit 4.3). In addition, the total amount of annual income earnings associated with the total employment benefit equals $8.3 million, in which $3.7 million represents the secondary effect on businesses within the Corpus Christi community.
- 17 -
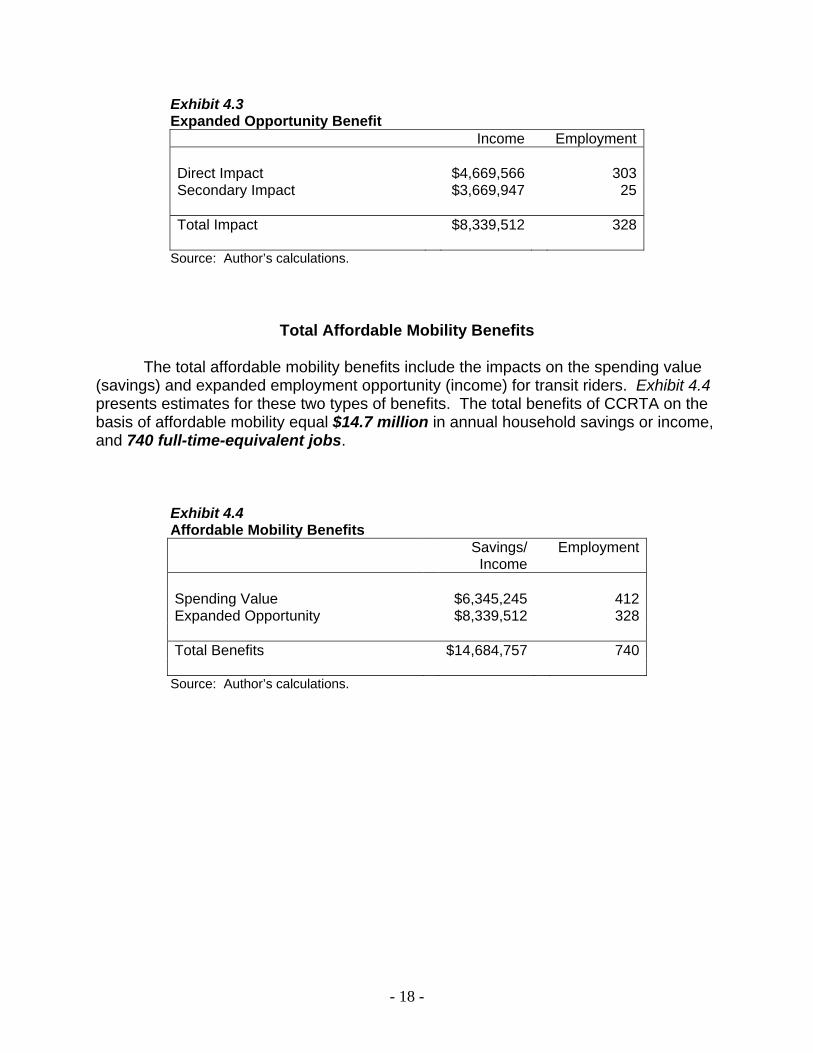
Exhibit 4.3 Expanded Opportunity Benefit Income Employment Direct Impact $4,669,566 303 Secondary Impact $3,669,947 25 Total Impact $8,339,512 328
Source: Author’s calculations.
Total Affordable Mobility Benefits
The total affordable mobility benefits include the impacts on the spending value (savings) and expanded employment opportunity (income) for transit riders. Exhibit 4.4 presents estimates for these two types of benefits. The total benefits of CCRTA on the basis of affordable mobility equal $14.7 million in annual household savings or income, and 740 full-time-equivalent jobs.
Exhibit 4.4 Affordable Mobility Benefits
Savings/
IncomeEmployment
Spending Value $6,345,245 412 Expanded Opportunity $8,339,512 328 Total Benefits $14,684,757 740
Source: Author’s calculations.
- 18 -
5. CONGESTION RELIEF
Public transit provides an economically-efficient alternative for trips that would otherwise be taken by private vehicles. Fewer trips by private vehicles result in savings in travel costs and fewer accidents. Fewer private vehicles on the road also lead to less traffic congestion and lower air pollution. In this sense, public transit not only benefits riders but also non-transit users that remain on the road.
5.1 Travel Time Savings Travel time savings represent the economic values of using public transit to avoid
travel delays. The annual travel time savings for Corpus Christi commuters that use the public transit services is estimated to total $2.4 million. This value equals the amount of private vehicle hours times the time value per hour for an average rider. The total number of private vehicle hours is obtained by dividing CCRTA’s annual vehicle miles traveled (VMT) by the average travel speed in Corpus Christi.
Exhibit 4.1 above indicates that 3.34 million additional trips by vehicle (60% of
5.57 million transit trips) would occur annually in the absence of public transit in Corpus Christi. The average travel speed in Corpus Christi is 40 miles per hour, according to a Corpus Christi Metropolitan Planning Organization report.10 The number of private vehicle hours that have been replaced by public transit, therefore, equals 325,336 hours per year.
The time value of a typical rider is estimated to be $7.4 per hour. This measure
is based on dividing the average annual wage of local service-sector employees by the total number of work hours per year for an employee. Based on regional data from the Bureau of Labor Statistics, the annual wages for the typical rider equal $15,390.
Travel time savings = (# Vehicle hours) x (Time value) $2,407,174 = 325,336 x $7.40 where: # Vehicle hours = (Vehicle miles traveled) / (Avg. speed, mph ) 325,336 = 13,013,442 / 40 Time value = (Annual wages of typical rider) / (# Hours) $7.40 = $15,390 / 2,080
10 Corpus Christi Metropolitan Planning Organization (2004), 2003 Regional Travel Speed Study.
- 19 -

5.2 Other Cost Savings
The reduction of VMTs also yields cost savings associated with vehicle
operation, safety and emissions. The following details the calculation of these three areas of benefits, which total $9.17 million.
According to APTA, public transit consumes one-half the fuel of a private car for
every VMT and one-third the fuel of a truck or SUV. The total amount of vehicle operating costs is the product of total VMTs and the vehicle operating cost per mile. The average operating cost is 52.2 cents per vehicle mile, according to the 2006 estimate by American Automobile Association. The amount of annual savings on the basis of additional vehicle operating costs in the absence of public transit is, therefore, estimated at $6.8 million.
Vehicle operating costs = (VMTs) x (Operating cost per mile) $6,793,017 = 13,013,442 x $0.522 Public transit is 26 times safer than travel by private vehicles, according to APTA.
The economic value of enhanced safety due to public transit is calculated as the total VMTs times the value of fewer accidents per mile traveled by public transit instead of by private vehicle. The Department of Transportation’s Federal Highway Administration has reported that the value of reduced accidents due to public transit is 12.7 cents. This translates into a total $1.65 million in safety cost savings per year for Corpus Christi.
Safety costs = (VMTs) x (Value of reduced accidents) $1,652,707 = 13,013,442 x $0.127 As compared to private vehicles, pubic transit is more efficient on the basis of
emissions. Public transit produces 50% to 95% less pollutants than private vehicles, according to APTA. Furthermore, the Environmental Protection Agency reports that the additional economic cost associated with emissions from private vehicles instead of buses is 5.6 cents per mile. Multiplying the VMTs by this value of reduced emissions from public transit equals the total annual savings on emission costs, which is approximately $729,000.
Emission costs = (VMTs) x (Value of reduced emissions) $728,753 = 13,013,442 x $0.056
- 20 -

5.3 Total Congestion Relief Benefits Congestion relief benefits include riders’ savings in travel time and vehicle
operation costs, as well as the economic values of enhanced safety and improved air quality associated with the use of public transit. The total amount of these cost savings is estimated at $11.6 million annually (see Exhibit 5.1). Such cost savings represent the values that local residents can reallocate their income to non-transportation-related goods and services. This impact contributes to a total of 584 full-time-equivalent jobs.
Exhibit 5.1 Congestion Relief Benefits Savings Employment Travel Time Savings $2,407,174 121 Vehicle Operating Cost Savings $6,793,017 342 Safety Cost Savings $1,652,707 83 Emission Cost Savings $728,753 37
Total $11,581,651 584
Source: Author’s calculations.
6. TOTAL ECONOMIC IMPACTS
6.1 Output and Employment Impacts Exhibit 6.1 presents estimates for the three categories of economic impacts—operational, affordable mobility and congestion relief—on the basis of output (or savings) and employment associated with the public transit system in Corpus Christi. In total, CCRTA generates an estimated annual regional economic impact equal to $55.4 million, which contributes to 1,748 full-time-equivalent jobs.
Exhibit 6.1 Total Output and Employment Impacts Output Employment Operational $29,153,103 424 Affordable Mobility $14,684,757 740 Congestion Relief $11,581,651 584 Total $55,419,511 1,748
Source: Author’s calculations.
- 21 -

The alternative measures of total economic impacts reflect the value of better quality of life for residents—transit users and non-users—in Corpus Christi. Some benefits, such as riders’ cost savings, represent only reallocation of local travel expenses to other goods and services, while other benefits, such as CCRTA’s own operation and riders’ expanded opportunities, represent additional dollars injected into the local economy. Those latter benefits, which instill stimulative effects on the economy, also have an impact on local tax revenues.
6.2 Fiscal Impacts
Along with its own operation, CCRTA benefits the regional economy of Corpus Christi by providing low-income commuters with mobility for employment purposes. As discussed above, the additional earnings and employment associated with the provision as well as the use of public transit generate additional spending and thus business transactions in Corpus Christi. Tax revenues increase as a result. Exhibit 6.2 presents the amounts of indirect business tax revenues (sales, excise and business property taxes) associated with CCRTA’s operation and the additional earnings of riders due to their use of public transit. The values are estimated using IMPLAN. The total impact on local tax collections is $1.36 million annually. The operational impact accounts for approximately $1 million of the tax revenues, and the estimated expanded opportunity benefit account for $0.3 million.
Exhibit 6.2 Impact on Indirect Business Tax Revenues Income Tax Total Operational Impacts $29,153,103 $1,057,948 Expanded Opportunity Benefit $8,339,512 $302,636 Total $37,492,616 $1,360,584
Source: Author’s calculations.
Public transportation in Corpus Christi was made possible by local sales and use tax collections. In 2005, this source of funding for CCRTA’s operation equaled $18.9 million. On the other hand, the Authority generated an estimated total impact of $55.4 million on the local economy of Corpus Christi. In this sense, the “return on investment” (ROI) for local taxpayers’ dollars is 2.93, meaning that each dollar of local tax funding helps support nearly $3 worth of business activity in Corpus Christi (See Exhibit 6.3).
- 22 -

Exhibit 6.3 Return on Local Taxes Amount Total Economic Benefits $55,419,511 Local Sales & Use Tax $18,939,617 ROI 2.93
Source: Author’s calculations.
7. CONCLUSION
This study was commissioned by CCRTA to examine the impact of Corpus Christi’s public transit system on the local economy. Following the methodology established by Federal Transit Administration, this report contains estimates of the economic impact in three broad categories: operational benefits, affordable mobility benefits, and congestion relief benefits.
As a public agency, CCRTA aims at demonstrating the value of tax dollars spent on public transit. By evaluating the impacts that the public transit system generates on the local economy of Corpus Christi, this study has conducted a cost-benefit type analysis and provided a return on investment estimate for taxpayers’ dollars.
It is noteworthy that the impacts of a public transit system in Corpus Christi
extend well beyond those presented in this report. Public transportation is vital to retaining the economic vitality of low-income communities within such a metro area as Corpus Christi. Greater accessibility and mobility as a result of a developed public transit system enhances regional economic development by, for example, revitalizing low-income communities. These long-term benefits to neighborhood and business development are difficult to quantify and, therefore, are beyond the scope of the present study.
- 23 -

APPENDIX
- 24 -

Primary Data Sources
This study utilizes regional and national data from numerous sources. The following is a list of agencies where data have been obtained from: American Automobile Association American Public Transportation Association Bureau of Economic Analysis, U.S. Department of Commerce Bureau of Labor Statistics Corpus Christi Metropolitan Planning Organization Corpus Christi Regional Transportation Authority Environmental Protection Agency Federal Highway Administration, Department of Transportation IMPLAN software and data, Minnesota IMPLAN Group National Transit Database, Federal Transit Administration U.S. Census Bureau
- 25 -