the production and composition of milk of cows cooled by
TRANSCRIPT

Louisiana State UniversityLSU Digital Commons
LSU Agricultural Experiment Station Reports LSU AgCenter
1955
The production and composition of milk of cowscooled by shade or sprinkling during the summermonthsLouis L. Rusoff
Follow this and additional works at: http://digitalcommons.lsu.edu/agexp
This Article is brought to you for free and open access by the LSU AgCenter at LSU Digital Commons. It has been accepted for inclusion in LSUAgricultural Experiment Station Reports by an authorized administrator of LSU Digital Commons. For more information, please [email protected].
Recommended CitationRusoff, Louis L., "The production and composition of milk of cows cooled by shade or sprinkling during the summer months" (1955).LSU Agricultural Experiment Station Reports. 298.http://digitalcommons.lsu.edu/agexp/298

the Production and Composition
of Milk of Cows
cooled by shade or sprinkling
during the summer months
by LL Rusoff, G.D.Miller, and J.B. Fryejr.

CONTENTSPage
INTRODUCTION 3
LITERATURE REVIEW 3
EXPERIMENTAL PLAN 7
A. Trial I—first year . 7
B. Trial II—second year 7
C. Trial Ill-third year 8
RESULTS AND DISCUSSION 9
A. Trial I
1. Milk production 9
2. Composition of milk . 9
B. Trial II
1. Milk production 13
2. Composition of milk 13
C. Trial III
1. Milk production 19
2. Composition of milk 19
SUMMARY 26
REFERENCES . ..' 27
APPENDIX . . 29
ACKNOWLEDGMENT
The authors are indebted to B. }. Burch, Jr., former Assistant
Professor of Dairying, and Paul Henderson, Farm Supervisor in the
Dairy Department, for their assistance in the management and care
of the animals in this study; and to Dr. James E. Johnston and Dr. Cecil
Branton of the Dairy Department for their suggestions and criticism of
the manuscript.

The Production and Composition of Milk of CowsCooled by Shade or Sprinkling During the
Summer Months
L. L. RusoFF, G. D. Miller, and J. B. Frye_, Jr.*
INTRODUCTION
A definite decrease in milk prodnction dniing the summer months
is experienced by dairy iarmers in Louisiana. The high environmental
temperatures and humidity along with a lower plane of nutrition, par-
ticularly due to poor pastures and a limited roughage program during
this season, are probably the main factors involved. It has been observed
that cows spend most of the daytime during the hot summer months
in the shade in inactivity and their body temperatures and respiration
rates increase progressively. It has been suggested that the high en-
vironmental temperatures in Louisiana might also affect the physical
and chemical composition of cows' milk. In order to dissipate excess
heat and provide comfort for animals, sprinkling with water has been
used successfully by some investigators. Therefore, it was decided to
determine what effect cooling of lactating cows by shade or by sprinkling
with water had on milk production and on the composition of milk
during the summer months.
Experiments were conducted during the summer months of 1948,
1949 and 1950 to test this type of treatment on the production and conr-
position of milk. Analyses were made for fat, total solids, solids-not-fat,
total protein, casein, albumin, globulin, lactose, ash, calcium, phos-
phorus, specific gravity, titratable acidity, and pH of the milks for three
years.
LITERATURE REVIEW
It is recognized that several factors, i.e., breed, stage of lactation,
plane of nutrition, season of year, and high temperature, may affect the
production and composition of milk.
There are several studies on the effect of high environmental tem-
peratures on milk production and composition. At temperatures above
80°F. it was found that milk production always decreased (2, 3, 8, 13, 18,
20, 21, 22, and 29) and that the composition of milk was also affected
(2, 5, 6, 7, 10, 16, 17, 18, 20, 21, 23)
.
Rhoad (22) in 1935 reported that European cattle in Brazil pro-
duced only 56 per cent of their apparent capacity due to effects of hot
weather. Bartlett (2) in England reported a reduction in milk yield
of 0.16 pound per day, percentage fat 0.04 per cent, and solids-not-fat
*Nutiitionist, Research Associate, and Head, respectively, Dairy Department.
3

0.153 per cent at environmental temperatures of 80°F. It was pointed
out that these reductions were not signilcant and that the high tempera-
ture was not the only factor responsible for the low quality of summermilk.
Regan and Richardson (21) in 1938, using 3 pairs of animals of
the Holstein, Jersey, and Guernsey breeds in a psychrometric room at
constant humidity and air movement, increased the environmental tem-
perature from 50 to 95° F. for 5-10 days. Above 80° F. there was a de-
crease in milk yield, solids-not-fat, and casein. The daily milk yield de-
clined from 25 pounds at 80° to 17 pounds at 95°, solids-not-fat from
7.88 to 7.58 per cent, and casein from 2.07 to 1.81 per cent. The values
for percentage butterfat (from 4.0 up to 4.3) and pH tended to increase.
Woodward and Jensen (29) in 1942 found a marked decrease in
milk production during the summer season in a study of 15,442 lacta-
tion records of cows in dairy herd improvement associations in 12 north-
ern and western states and 101 lactation records of cows on advanced
registry in the experimental breeding herd of the Bureau of Dairy
Industry at Beltsville, Md. The Beltsville cows produced the least milk
in July, the range of deviation from the mean being 10.4 per cent.
These workeis attributed this deviation to the weather.
Overman (16, 17) during 1945 conducted a study on the monthly
variations in the composition of milk produced under Illinois condi-
tions. The percentage values for all components studied in Holstein
milk except lactose tended to be lowest during the warmer months. His
percentages for summer and winter milks were: fat 3.3 and 3.6, protein
3.2 and 3.4, lactose 4.9 and 4.8, ash 0.65 and 0.68, total solids 12.2 and
12.5, and solids-not-fat 8.8 and 8.9, respectively.
Kastli (11) in 1945 in Switzerland reported the fat content of milk
showed a gradual rise from May (3.61 per cent) to October (3.94 per
cent) and a fall from then until March (3.55 per cent) . The curve for
solids-not-fat showed a maximum in December (9.33 per cent) and a
minimum in March (8.97 per cent) and July (9.01 per cent) .
Labarthe (12) in 1946 in Argentina reported highest percentages of
butterfat to occur in their fall (April-June) and the lowest in their
spring (October-December) .
Espe (8) in 1946 reported a 23 per cent drop in milk production
of the Iowa station herd during 1941 when the maximum temperature
rose from 84° to 99° F. from July 20 to July 24. Another 11 per cent
drop in production within 7 days occurred in August when the maxi-
mum temperature increased from 80° F. to 93° F. There were no changes
in feeding or management during this time. Espe, in summarizing the
findings of other investigators (4, 9, 19, 27, 28) ,reported that the per-
centage of butterfat is lowest in the summer and highest in the Avinter.
He stated that this decrease in butterfat percentage in the summer
amounted to 15-20 per cent.
4

Davis et al. (6) in 1947 investigated seasonal variations in the con-
stituents of milk produced under Aiizona conditions. The investigators
analyzed one day's milking each month during lactations over a 30-
month jseriod from 11 Jersey, 11 Holstein, and 11 Guernsey cows. Tlie
mean maximum temperatures for the spring, stimmer, fall and winter
seasons were 82.6°, 99.3°, 84.8°, and 66.9° F., respectively. The butterfat,
total solids, and serum solids content of the milks were higher in winter
and lower in summer. The butterfat content of milk was calculated to
decrease 0.1 per cent each 10° F. rise in mean maximum temperatures.
They concluded that the environmental temperature appeared to exert
a greater inHuence on milk and butterfat production than did the ad-
vancing stage of lactation. In another paper these investigators (7)
reported total solids, serum solids, fat, lactose, and protein values to be
higher in winter and lower in summer, while the chloride content of
the milk was higher in summer than in winter. The data were obtained
monthly over a two-year period from four groups of animals, each con-
taining 30 cows or more, representing Jersey, Guernsey, Holstein, and
mixed breeds.
In South Africa, Bonsma (3) in 1947 reported that milk produc-
tion declined sharply when the atmospheric temperature exceeded 85° F.
He stated that when the atmospheric temperature reached 100° F.,
cows produced only 53 per cent of the amount of milk they produced at
70° F.
Sinha and Minett (24) in 1947 in India reported that daily wet-
ting of the body surface of milking water buffaloes during the hot
months prevented a decrease in milk yield. The animals were splashed
for 5 minutes by throwing water over their bodies with buckets approxi-
mately 2 hours before milking. Four periods of 10 days each were used
when the maximum daily temperatures ranged from 97° to 109° F., the
relative humidity being approximately 24 per cent and the temperature
of the water being 80-86° F.
Van Rensburg (26) in 1947 in South Africa, reported that solids-not-
fat, fat, and lactose were lowest during the winter months. He attribut-
ed this to malnutrition during this season of the year. High tempera-
tures did not produce a decline in milk solids, the best quality milk
being obtained during some of the hottest months. Bakalor (1) in
1948, also in South Africa, analyzed the records of 6,369 official samples
of milk of all breeds from January 1934 to December 1947. The solids-
not-fat were lowest in the dry months and the monthly fat content was
higher in winter than in summer.
Riek and Lee (23) in 1948 in Australia studied the reactions of four
grade Jersey cows in a psychrometric room at temperatures of 85° to 110°
F. for 7 hours, twice a week. The absolute humidity was 6.16 grams of
water per cubic foot. These workers observed no effect on milk or butter-
fat production at these high temperatures. At high humidities and tem-
5
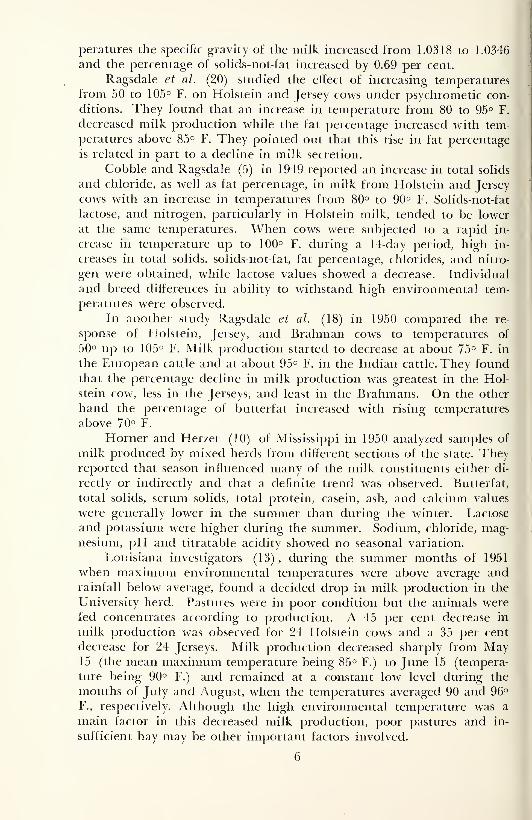
peratures the specific gravity of the milk increased from 1.0318 to 1.0346
and the percentage of solids-not-fat increased by 0.69 per cent.
Ragsdale et al. (20) studied the effect of increasing temperatures
from 50 to 105° F. on Holstein and Jersey cows under psychrometic con-
ditions. They found that an increase in temperature from 80 to 95° F.
decreased milk production while the fat jjercentage increased with tem-
peratures above 85° F. They pointed out that this rise in fat percentage
is related in part to a decline in milk secretion.
Cobble and Ragsdale (5) in 1949 reported an increase in total solids
and chloride, as well as fat percentage, in milk from Holstein and Jersey
coAvs with an increase in temperatures from 80° to 90° F. Solids-not-fat
lactose, and nitrogen, particularly in Holstein milk, tended to be lower
at the same temperatures. When cows were subjected to a rapid in-
crease in temperature up to 100° F. during a 14-day period, high in-
creases in total solids, solids-not-fat, fat percentage, chlorides, and nitro-
gen were obtained, while lactose values showed a decrease. Individual
and breed differences in ability to withstand high environmental tem-
peratures were observed.
In another study Ragsdale et al. (18) in 1950 compared the re-
sjaonse of Holstein, Jersey, and Brahman cows to temperatures of
50° up to 105° F. Milk production started to decrease at about 75° F. in
the European cattle and at about 95° F. in the Indian cattle. They foundthat the percentage decline in milk production was greatest in the Hol-
stein cow, less in the Jerseys, and least in the Brahmans. On the other
hand the j^ercentage of butterfat increased with rising temperatures
above 70° F.
Horner and Herzer (10) of Mississippi in 1950 analyzed samples of
milk produced by mixed herds from different sections of the state. Theyreported that season influenced many of the milk constituents either di-
rectly or indirectly and that a definite trend was observed. Butterfat,
total solids, serum solids, total protein, casein, ash, and calcium values
were generally lower in the summer than during the winter. Lactose
and potassium were higher during the summer. Sodium, chloride, mag-
nesium, pH and titratable acidity showed no seasonal variation.
Louisiana investigators (13) , during the summer months of 1951
when maximum environmental temperatures were above average andrainfall below average, found a decided drop in milk production in the
University herd. Pastures were in poor condition but the animals were
fed concentrates according to production. A 45 per cent decrease in
milk production was observed for 24 Holstein cows and a 35 per cent
decrease for 24 Jerseys. Milk production decreased sharply from May15 (the mean maximum temperature being 85° F.) to June 15 (tempera-
ture being 90° F.) and remained at a constant low level during the
months of July and August, when the temperatures averaged 90 and 96°
F., respectively. Although the high environmental temperature was a
main factor in this decreased milk production, poor pastures and in-
sufficient hay may be other important factors involved.
6
I

EXPERIMENTAL PLANPurpose
In 1948, 1949, and 1950 experiments were conducted during the
summer months to determine the effect on the mid-summer slump in
milk production and on the composition ot the milk of lactating cows
cooled by sprinkling with water. Analyses of milks were made for fat,
total solids, solids-not-fat, total protein, casein, albumin, globulin, lac-
tose, ash, calcium, phosphorus, specific gravity, titratable acidity, and
pH values for the three years.
MethodsA. Trial 1 (1948)—Two comparable groups of 16 lactating cows (8
Holsteins and 8 Jerseys) were used in a reversal experiment. The de-
sign of the experiment is shown in Table 1. The cows of each breed
were paired according to production, stage of lactation, and other
pertinent factors. One animal of each pair was put in each group by
randomization. Each group had access to similar pasture. The pasture
plots were side by side on good bottom land and provided fairly good
forage consisting mainly of Dallis grass with some Bermuda and a little
carpet. The grass did not become dry and fibrous due to dry weather.
The grain concentrate (17 per cent protein), which was made up of
yellow corn meal, crimped oats, cottonseed meal, soybean meal and
wheat bran with the addition of minerals and salt, was the same as that
fed the regular L.S.U. milking herd and was adjusted weekly according
to production.
The exjDcriment consisted of three 14-day periods with 2 days in
which to change-over between periods. The first week of the study
was used as a preliminary period and the results were not recorded as
part of the experiment. The average maximum temperatures taken in
the pastures of both groups were 92° F., 87.5° F. and 82.3° F. for the first
second, and third periods, respectively.
In one pasture a shed (15 x 30 feet) with open sides was utilized
for shade. This pasture was occupied by the group that had access to
shade. Two sheds of the same size were j^rovided in the other pasture.
One of these furnished only shade and the other one was equipped
with sprinklers which hung from the ceiling at regular intervals and
produced a fine spray of water. A concrete floor with drainage was
provided in this shed. This pasture was utilized by the group that had
access to shade plus sprinkling.
B. Trial II (1949)—In this study two comparable groups of 12 lac-
tating cows (6 Holsteins and 6 Jerseys) were used in a double reversal
experiment having four 14-day periods with a preliminary period of one
week. Three days were provided between periods to make the change-
over. The design of the experiment is shown in Table 1.
The cows of each breed were paired according to the plan used in
Trial I. Each group was fed and managed in the same manner and
was subjected to either sprinkling with water or no sprinkling. The
7

TABLE 1.—Experimental Designs
Design of reversal experiment, Trial 1 (1948)
Periods
Group"1
Aug. 10-Aug. 23
2
.\ug. 26-Sept. 8
3
Sept. 11 -Sept. 24
1 Shade
plus sprinkling
Shade Shade
plus sprinkling
2 Shade Shade
plus sprinkling
Shade
Av. max. temp. 92"F 87.5°F 82.3"Fi
°Each group consisted o£ 8 Holstein and 8 Jersey cows.
Design of double reversal experiment, Trial 2 (1949)
Periods
Group'' 12 3 4
June 23-July 6 July 10-July 23 July 27-Aug. 9 Aug. 13-Aug. 26
1 Sprinkling Shade Sprinkling Shade
2 Shade Sprinkling Shade Sprinkling
Av. max. temp. 89.1°F 86.40F 88.VF 88.VF
"Each group consisted of 6 Holstein and 6 Jersey cows.
Design of continuous and reversal experunent. Trial 3 (1950)
Experimental
Design
Group"Periods
1
June 26-July 9
2 3 4
July 13-July 26 July 30-Aug. 12 Aug. 16-Aug. 29
Continuous 1 Shade Shade Shade Shade
Reversal 2 Shade Sprinkling Shade Sprinkling
Continuous 3 Sprinkling Sprinkling Sprinkling Sprinkling
Reversal 4 Sprinkling Shade Sprinkling Shade
Av. max. temp. 88.4"F 87.5<'F 89.2°F 89.1°F
''Each group consisted of 3 Holstein and 3 Jersey cows.
treatments were similar to those of Trial I with the exception that the
group of animals having access to the sprinklers did not have access to
additional dry shade.
The average maximum temperatures were 89.1° F., 86.4° F., 88.7°
F., and 88.7° F. for the first, second, third, and fourth periods, re-
spectively.
C. Trial III (1950)—Four comparable groups of 24 cows, each con-
sisting of 3 lactating Holsteins and 3 lactating Jerseys, were used in
this experiment which consisted of a continuous and a reversal phase.
The cows of each breed were paired according to stage of lactation, pro-
duction, and age. One animal of each pair was placed in its respective
group by randomization. The design of the ex23eriment is shown in
Table 1.

Each group was fed and managed in the same manner as those in
Trials I and 11. The treatments were also similar to those of Trial II
with the exception that groups 1 and 3 were subjected to a continuous
treatment of shade and sprinkling, respectively. This study consisted of
four 14-day periods with 3 days between periods to change-over. Theaverage maximum pasture temperatures were 88.4° F., 87.5° F., 89.2° F.,
and 89.1° F., for periods I, II, III, and IV, respectively.
Collection of Data—Records of milk production were kept daily for
the three trials and chemical and physical analyses of milk produced
by each group of cows were made daily. The analyses for fat, total
solids, solids-not-fat, total protein, casein, albumin, globulin, lactose,
ash, specific gravity, titratable acidity, and pH were made according to
the methods of the Association of Official Agricultural Chemists (15).
The method described by Morris, Nelson and Palmer (14) was used for
determining calcium and phosphorus.
RESULTS AND DISCUSSION
A. Trial 1 (1948)
1. Milk Production—The relationship between maximum air tem-
perature and average daily yield of 4 per cent fat-corrected milk (FCM)
of each group of cows during each period of Trial 1 is presented in
Table 2. During period I, milk production was slightly in favor of
the groujD of cows (group 1) which had access to sprinkling, especially
the Holsteins. However, in the reversal period (period II) when this
group was allowed only shade, a slightly greater milk yield still per-
sisted over group 2 which now had access to sprinkling. In period 3,
group 1 which again had access to sprinkling showed a slightly higher
milk yield over group 2. Thus, this particular group of cows (group 1)
produced slightly more FCM than did group 2 regardless of whether the
animals were subjected to sprinkling or not.
The average milk production for group 1 during periods I and III,
when the cows had access to sprinkling, was 1.3 pounds less than the
milk yield during period II, when no sprinkling was available. On the
other hand, group 2 produced 1.4 pounds more milk daily when the ani-
mals were subjected to sprinkling (period II) than when no sprinkling
was available (periods 1 and III). The average daily FCM yield for all
animals allowed sprinkling was 26.8 pounds as compared to 26.4 pounds
for the non-sprinkled animals. The average daily milk yield for all
Holsteins which were sprinkled was 26.7 pounds, while the Holsteins
not sprinkled averaged 25.9 pounds. The sprinkled Jerseys averaged
27.0 pounds of milk and the non-sprinkled Jerseys 26.8. Thus sprinkling
of cows appeared to have a very small effect on milk production during
the summer months of 1948.
2. Composition of Milk—The average physical and chemical com-
position of the milk by experimental periods for Trial I is shown in
Table 3. Observation of the table shows no apparent variation in the
constituents of milk from cows which had access to shade and sprin-
9

^a
Xm
13
^O
^^^
f^
-S^
c
o.S
-a
S„
33
so
o^
oo5o.
.S
3aj
^w
j2
?^
+r'
10

,2^
a00
in
3ot—
<
00
OJ
0}
Cal
CM
OC>
O)
00
CO^
—CM
00o
or-
^^
Og
CM
CO
cn
CM
oo
—
oO
CT)
CO
11
01
CM
CM
CM
siCM
XX
II
-H
CM

kling, and those that had access to only shade. The fat analyses do not
show any variations as the result ot sprinkling versus non-sprinkling.
Group H-1 (Holsteins) for period I averaged 3.2 per cent fat while
having access to sprinklers and shade, and 3.3 in period II while having
access to only shade. When they were switched back to sprinklers and
shade in period III, the fat rose to 3.4 per cent. This group, as well as
H-2, J-1, and J-2, showed a progressive increase in fat percentage during
each period of the experiment regardless of whether or not the cows
had access to sprinklers.
The same progressive increase is noted with respect to total solids,
solids-not-fat, total protein, casein, albumin, globulin, calcium and
phosphorus, and the reversal or a progressive decrease in the lactose and
ash content. It is believed that these constituents, as well as fat, are
influenced by the stage of lactation and seasonal trend and not by the
cooling effect of sprinkling. These results are in agreement with the
work of other investigators (1, 10, 11, 12, 16, 17) , in that the season of
the year and stage of lactation have a definite effect on the composition
of milk. However, this does not agree with work of Van Rensburg
(26) in South Africa who observed that the fat and solids-not-fat content
of milk from cows under investigation was at its lowest during the win-
ter months. He found that the percentage of fat and solids-not-fat
decreased progressively during a seasonal period similar to that of this
trial. Davis (6) also reported that under Arizona conditions and tem-
peratures, which reached a maximum of 105° F., environmental tempera-
ture had a greater influence on milk and butterfat production than
did stage of lactation.
The range and average johysical and chemical composition of milk
from cows sprinkled with water and those not subjected to sprinkling
for the entire experimental period of Trial I (summer 1948), regardless
of their group affiliation, are shown in Appendix Table 1. The results
reported in this table tend to support the observations that sprinkling
apparently had no effect on the composition of the milk produced by the
experimental cows. Table 4 presents the average values. The average fat
percentages for the Holstein cows subjected to and not subjected to
the sprinklers were similar, being 3.20 per cent. The fat percentage for
the sprinkled Jersey cows was 4.77 per cent; for the Jersey cows not
sprinkled it was 4.73 per cent. This is a variation of only 0.04 per cent,
which is insignificant. This same trend prevailed with the other com-
ponents, indicating very little variation in the composition of the milk
of sprinkled and non-sprinkled cows. Appendix Table 1 also indicates a
variation in the composition of milk from individual cows within breeds.
The fat percentage of sprinkled Holstein cows ranged from 2.50 to 3.50
per cent and the non-sprinkled Holsteins from 2.97 to 3.80 per cent.
This is a range of 1.00 and 0.83 per cent, respectively. However, as in-
dicated previously, the average composition of milk on a herd basis
within a breed was fairly uniform.
12

TABLE 4.—The average physical and chemical composition of milk from cows sprinkled
with water and not sprinkled during Trial I (summer 1948) regardless of
group
Holsteins JerseysAverage
Sprinkled Not Sprinkled Sprinkled Not Sprinkled
Fat % 3.20 3.20 4.77 4.73
Total solids % 11.19 11.26 13.80 13.69
Solids-not-£at % 7.96 8.06 8.89 8.92
Total protein % 2.99 3.01 3.57 3.43
Casein % 2.20 2.24 2.79 2.76
Albumin % .27 .27 .26 .26
Globulin % .58 .54 .53 .53
Lactose % 4.65 4.63 5.04 5.08
Ash % 7.35 7.05 7.49 7.63
Calcium mg/100 ml .098 .125 .117 .122
Phosphorus mg/100 ml. .114 .115 .130 .130
Specific gravity 1.0292 1.0294 1.0817 1.0815
Titratable acidity % 11.63 11.55 13.21 13.45
pH 6.67 6.67 6.65 6.65
B. Trial II (Summer 1949)
1. Milk Production—A summary o£ the maximum environmental
temperature values and production data of cows during each period of
Trial II is presented in Table 5. It can be seen from the table that
the cows produced slightly more milk when they were subjected to
sprinkling than when they were in the shade alone with the exception
of period III. The production of the Holstein cows is responsible for this
increase and not that of the Jerseys. All groups, containing both Hol-
steins and Jerseys, which were subjected to sprinkling in each period
showed an over-all daily average of 28.0 pounds of FCM during the ex-
perimental periods as compared to 27.1 pounds for the groups allowed
shade. The Holsteins averaged 29.4 pounds of milk daily when allowed
sprinkling as compared to 28.5 pounds when subjected to no sprinkling,
a difference of 0.9 pound. The Jerseys averaged 26.6 pounds of milk
when sprinkled compared with 25.7 pounds during the periods of nosprinkling, a difference of 0.8 pound. Thus sprinkling appeared to be
beneficial to milk production during this summer by approximately
0.9 pound of milk.
2. Composition of Milk—The average physical and chemical com-
position of the milk analyzed during the experimental periods of Trial
II is shown in Table 6. The results of this table do not follow the
trend established in Table 3 for Trial I, which showed a progressive
increase by periods in the percentage composition of fat, total solids,
solids-not-fat, total protein, casein, albumin, globulin, calcium andphosphorus, and a progressive decrease by periods in lactose and ash.
There was no relationship observed between the obtained values
of the milk of cows subjected to and not subjected to sprinkling (Table
6). In period I, group H-1 showed a fat percentage of 3.03 when sub-
jected to sprinkling, and 3.20 per cent in period II when subjected to
13


OH
^CD
00
00
00o
00
o15
XX
1I
XX

oo
^^
-H
CM
CM
oo
^^
CO
«—
oO
^—
1
ox
CD
CO
00
O-H
iTi
00
00
t—
I
CMm
CT)O00
oo
in
ic
oo
Q,2
inO
in
^
ZiiZ
I—
'CO
o^
CT)
^^
m—I
o^
^
o^
16

shade. This is an increase of 0.17 per cent, which follows the trend
of the progressive increase as seen in Table 3. In Period III, dur-
ing which the cows in group HT -were again subjected to sprinkling, a
progressive increase in fat percentage was observed, as the analysis for
fat was 3.22 per cent, or an increase of 0.02 per cent. However, whenthe cows in this group were switched to period IV, in which the cows
were subjected to dry shade, the fat content decreased to 3.19 per cent,
or a reduction of 0.03 per cent. The fat percentages for the other
groups, H-2, J-1, and J-2, fluctuated by periods but did not establish
a definite trend between the sprinkled and non-sprinkled cows, nor
for the stage of lactation and season of the year. However, total pro-
tein, casein, albumin, globulin, calcium, and phosphorus followed the
seasonal trend and stage of lactation trend of progressively increasing
values, whereas fat, total solids, solids-not-fat, and lactose showed no
definite trend.
The range and average values of some physical and chemical con-
stituents of milk from cows sprinkled with water and those not subjected
to sprinkling during Trial II (1949) are shown in Appendix Table 2.
The trend of the values in this table is comparable with those of Ap-
pendix Table 1 in that there is a wide range in the constitutents of
milk among individual cows within a breed while the herd average for
a given breed is fairly uniform. It also establishes the fact that there
is probably no variation due to sprinkling, since within the breeds the
average value of any one component of milk is uniformly the same
whetlier subjected to sprinkling or not. Any small variation is probab-
ly due to other factors.
The range of fat percentage of Jersey cows subjected to sprinklers
during the four periods of Trial II is between 4.44 and 5.21, or 0.77 per
cent. For Jersey cows not subjected to sprinklers the range is between
4.38 and 4.96, or a difference of 0.58 per cent fat. However, the aver-
age percentage of fat for the Jerseys subjected to sprinkling during the
TABLE 7.—The average physical and chemical composition of milk from cows sprinkled
with water and not sprinkled during trial II (summer 1949)
Holsteins Jerseys
AverageSprinkled Not Sprinkled Sprinkled Not Sprinkled
Fat % 3.32 3.18 4.77 4.77
Total Solids % 11.48 11.07 13.61 13.34
Total Protein % 2.84 2.82 3.48 3.51
Solids-not-fat % 8.02 7.77 8.84 8.78
Casein % 2.08 2.01 2.68 2.68
Albumin % .29 .31 .29 .37
Globulin % .46 .51 .49 .53
Lactose % 4.71 4.69 5.07 5.01
Ash % .721 .717 .778 .774
Calcium mg/lOOml. .089 .090 .114 .113
Phosphorus mg/100 ml. .094 .093 .111 .112
Specific gravity 1.0293 1.0284 1.0316 1.0314
Titratable acidity % 9.75 8.97 11.58 11.58
PH 6.78 6.81 6.82 6.84
17

3oE
a'«
Suji'JiuucIs
;n[d3pEi|3
n|dspEi)s
Sun>iuiicls
sr.idopiTq
Su![^iii.ids
sn]d3pEi]S
npEiis
Suii^iui.xds
snid
spEiji,'
apEqs
Sur[>|u!.ids
snjdapEqs
spEqs
Sini>|uijds
sn[dapcqs
apEijs
3u!i>iui.ids
Mi[dapEqs
apeqS
Su!|>iuuds
snidapEqs
apEqs
Suq^ui-ids
srqdapEqs
apEqs
o^
—
"
3218
—>.o

four periods throughout the trial and the Jerseys not subjected to
sprinkling is identical, being 4.77 per cent (Table 7). This is an indi-
cation that sprinkhng had no effect on the fat percentage of the milk.
The analyses of the other components reflect the same trend—a wide
range in composition among individual animals and a uniform average
of milk constituents for a given herd.
C. Trial III (Summer 1950)
1. Milk Production—Table 8 presents the vahies of average maxi-
mum air temperature and average FCM production during each experi-
mental period of Trial III. There is apparently no close relationship
between milk production of the cows and the environmental tempera-
tures. Examination of the table shows that the average milk production
for both Holstein and Jersey cows which had access to sprinkling is
greater than the average production of the animals not having access
to sprinkling, regardless of the type of trial. The Holsteins having ac-
cess to sprinkling had a higher daily milk yield by 3.5 pounds, on the
average, over the non-sprinkled Holsteins. In analyzing the values ob-
tained during each trial it is seen that the Holsteins subjected to sprin-
kling showed an average daily increase of 5.5 pounds more milk during
the continuous trial and an increase of 1.4 pounds during the reversal
trial over the production of Holsteins not subjected to sprinkling.
For the Jerseys, those sprinkled produced an average of 1 pound less
milk than those not sprinkled in the continuous trial but 1.3 poundsmore in the reversal. The average maximum pasture temperature
failed to reach 90° F. during this trial and the results may have been
different if it had reached the middle nineties, which might have re-
stricted grazing, especially in the Holstein breed.
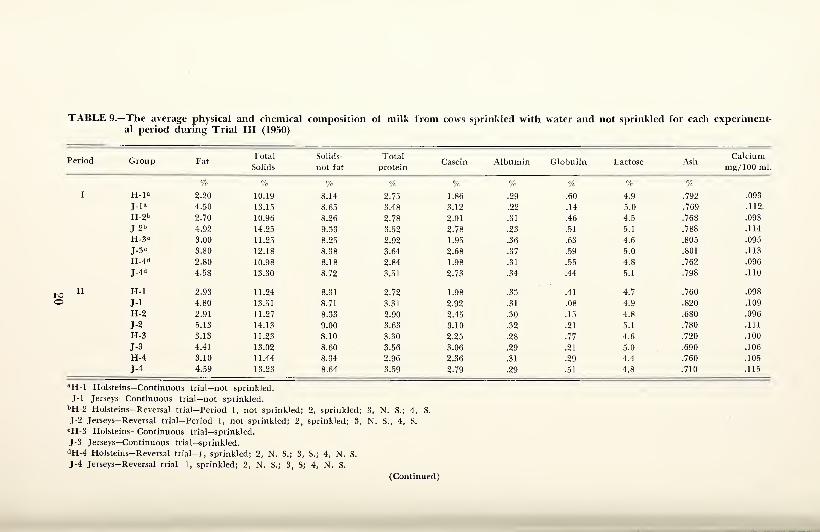
2. Composition of Milk—The average physical and chemical constitu-
ents of the milk analzed during each experimental period of Trial III
is shown in Table 9. The results in this table indicate that there is
probably no variation in the composition of milks produced by cows
subjected to continuous shade or sprinkling, or of those subjected to a
reversal of shade and sprinkling. The general trend of variation, with
a few exceptions, follows those in Trial I (1948) of a progressive increase
in fat, total solids, solids-not-fat, total protein, casein, albumin, globulin,
calcium, and phosphorus, and a decrease in lactose and ash. In the re-
versal trial, the fat percentage for group H-2 in period I was 2.70 whensubjected to shade. When reversed to sprinkling in period II the fat
percentage increased to 2.91. In period III when the cows again had ac-
cess to shade the fat percentage remained at about the same level (2.95
per cent). In period IV (when the cows were reversed to sprinkling)
the fat percentage continued to increase to 3.20. The Jersey breed of
this group, J-2, also shows a progressive increase in fat percentage for
periods, I, II, and III but a small decline of 0.10 per cent in the fourth
period as compared to the third period. The continuous groups 1 and3 parallel the progressive increase in fat of groups 2 and 4. These results
19
as
3o
oooooooo
ocMcoGOc^^a^to«-H
CO
c-i
CM
'c\r
>—
'!M
c-j
CO
!>rCO
ox
c-j
CJ
CO
CO
CM
CO
CM
CO
OOOOCiOC3^QOOOOOOO
OCOOrfi—'CM-OcO
OOOiMOOOoO
CM-^cj-^COOOcjTj^
CO
CM
CO
CO
oi
CO
^--^eOOOOT^^"^
coir^ooOi—(CDcotO
taoocjodo^cooooooo
i-HCO^"^'—"COi—
CO
{M•^C^rlOco^CO^
I-"
;^
CM
ffi
l-l-J
ffi
°?
CO
"T^
CMZ
03
I
o5
-a
I
fa.
.2
«
I
CC
>c
ffi
ffi
ffi
ffi
-H^
C<
^ffi
'JhC
(-Ij
ffi
ffi
20

ca_o
If8«I—
I
|S
lluB
).a
HI.
3-SSi
oo
se
oooooooo
oooooooo
(£).—iG0
0000r--I>O
00
00
00
CO
i>-
00
.
^-.f
-H
Tt*
t^ClOOCit^OOI^-OO
oooo
iT)
cv{
TtH
CSI
,K^K
>5^
ffiA
ffi
21

TABLE 9.—(Continued).—The average physical and chemical composition of milk fromcows sprinkled with water and not sprinkled for each experi-mental period during Trial III (1950)
Period GroupPhosphorus
mg/100 ml.
Specific
gravity
Titratable
aciditypH
%H-1 .089 1.0302 1 n
J W. / 0 6 49
J-1 .105 1.0310 14.00 6.46
H-2 .092 1.0309 12.00 6.26
J-2 .108 1.0334 13.50 6.47
H-3 .090 1.0306 11.32 6.28
J-3 .106 1.0305 12.12 6.39
H-4 . .093 1.0305 13.50 6.40
J-4 .105 1.0312 12.95 6.43
H-1 .101 1 0309 1 I ft91 1 .04 O.DJ
J-1 .115 1.0310 15.75 6.62
H-2 .095 1.0311 12.70 6.59
J-2 .109 1.0319 15.22 6.05
H-3 .109 1.0299 12.00 6.64
J-3 .113 1.0309 14.50 6.02
H-4 .116 1.0309 13.80 6.67
J-4 .120 1.0309 14.25 6.63
H-1 .111 1 .0307 13 37 o.o /
J-1 .108 1.0306 15.25 6.25
H-2 .101 1.0317 13.25 6.57
J-2 .115 1.0308 13.75 6.60
H-3 .112 1.0278 12.62 6.50
J-3 .099 1.0288 12.50 6.60
H-4 .108 1.0271 13.37 6.60
J-4 .115 1.0322 14.62 6.45
H-1 .105 1.0294 11.75 6.60
J-1 .109 1.0325 16.00 6.51
H-2 .096 1.0295 13.2 6.63
J-2 .111 1.0322 14.25 6.58
H-3 .093 1.0291 12.00 6.62
J-3 .099 1.0310 13.37 6.64
H-4 .108 1.0282 13.50 6.61
J-4 .105 1.0285 14.12 6.60
II
III
IV
indicate that the variation was not the result of sprinkling or shade but
could be attributed to the stage of lactation and season of the year or
other factors.
The average physical and chemical composition of milks producedby each experimental group of cows during Trial III (summer 1950) is
shown in Table 10. The values indicate that there was no variation in
the composition of milk as a result of sprinkling the experimental cows
with water. The average for all Holsteins not sprinkled, which included
those in the continuous and reversal trials, as compared with the aver-
age for all Holsteins s^arinkled is remarkably close in the percentage of
all constituents. The fat percentage for the Holsteins had the widest
range—0.22 per cent. This same observation in percentage of all con-
stituents is noted between all non-sprinkled Jerseys and all sprinkled
Jerseys. The greatest range—0.22 per cent—was in total solids. This is
22

oo
—.—
CT)
i3
V
^1
oc-
I-
OQQ
XX
23

TABLE 10.—(Continued).—The average physical and chemical composition of milk fromcows sprinkled with water and not sprinkled in each experi-
mental group by treatment during Trial III (summer 1950)
Groupand
' 1 TfiQtTnfnf"J. X CALlXlCllL
Specific gravity Titratable acidity pH
%H-Dry (C) 1 1 .92 6.57
H-Dry (R) 1.0304 13.14 6.53
H-Wet (C) 1 .0293 1 1 QftJ. 1 .yo 6.51
H-Wet (R) 1.0295 13.17 6.55
ri-ury i^t-j&ixj 1 0303 12.53 6.55
H-Wet (C&R) 1.0294 12.57 6.53
J-Dry (C) 1.0313 15.25 6.46
J-Dry (R) 1.0309 13.90 6.57
J-Wet (C) 1.0303 13.12 6.56
J-Wet (R) 1.0321 14.26 6.53
J-Dry (C&R) 1.0311 14.57 6.51
J-Wet (C&R) 1.0312 13.69 6.54
C—Continuous.
R— Reversal.
an indication that sprinkling of the experimental animals had little, if
any, effect on the composition of milk.
The average maximum environmental temperatures during sum-
mer trials of 1948, 1949, and 1950, are very similar. In general, these
figures are between 85° and 90° F. The 1948 trial was started later
(August) than the 1949 and 1950 trials (June). No relationship was
found between the environmental temperatures and amount of milk
prodviction or milk composition for any of the years studied. No ad-
vantage in sprinkling the animals occurred during the first trial during
1948. In the 1949 trial, sprinkling increased the average daily milk
production of the animals by 0.9 pound, which was not important. In
the 1950 trial, sprinkling increased the milk production of Holsteins
by a significant figure, 5.5 pounds daily, during the continuous trial.
From this study daily sprinkling during the hot months appears to be
of benefit to Holsteins. Ragsdale et al. (18, 20) have pointed out the
sensitivity of Holstein animals to high environmental temperatures.
Rectal temperatures and respiratory activity increased while milk pro-
duction decreased at a greater rate than for Jerseys. Thus sprinkling
may be of advantage in the comfort of Holstein cows.
The lack of control of some of the variables encountered under
pasture conditions may have been an important factor in these studies.
The environmental temperature as well as the humidity was always
changing. Wind velocity, though low, probably varied in its effect oh the
cows' comfort. It is possible that animals recover from the high day-
time temperatures after the sun sets. Holstein cattle, being more sensi-
tive, might not recuperate or become acclimatized as quickly as it ap-
pears Jersey cattle do at Louisiana temperatures.
24

3o
^o
«
GO
"t-
'o
Tt^oo
Oo
CM
to
-H
CvjoO
--J
Cvj
C4
C4
C^^
I—
IQO
oooo
00
CO
CM
CM
Cv)
CO
CO
CO
<U
1)
V
X^X
^
oo
cno
^CTi
J>.
CM
c^i
CO
CO
GO
rrs
On
o^
CO
CO
CO
00
Olo
Tt^
IlC
tj)
CT)
Ww<
w>
3>-
H11pq
CT)
-Tf
1-^
CO
00
CO
CO
CO
00
rc^
lO
C^J
CM
(>r
CM
CO
CO
CO
GO
>—
(
-H
Of-HO^
KKK
^^
^a;
ss
s
oo
oTfi
-rt'm
CTi
CTi
CO
CDO
Th"
T}i
LD
^Hi22

Table 1 1 summarizes the average physical and chemical composi-
tion of milk from Holstein and Jersey cows sprinkled with water andthose not sprinkled, during the three summer periods—Trial I (1948),
Trial II (1949), and Trial III (1950)—and also the three-year averages.
These values for the various years are very close, and again indicate
that the composition of cow's milk of an individual breed is fairly
constant.
SUMMARY
During the summer months of 1948, 1949, and 1950 experiments
were conducted to determine what effect cooling of lactating cows by
shade or by sprinkling with water had on milk production and on the
composition of the milk. Analyses were made for fat, total solids, solids-
not-fat, total protein, casein, albumin, globulin, lactose, ash, calcium,
phosphorus, specific gravity, titratable acidity, and pH of the milk for
each year.
In 1948 a reversal trial was run using two groups of 16 lactating
animals (8 Holsteins and 8 Jerseys); in 1949 a double reversal trial in-
volving two groups of 12 lactating animals (6 Holsteins and 6 Jerseys);
and in 1950 a double reversal and continuous trial involving 24 lactat-
ing animals (12 Holsteins and 12 Jerseys).
The results obtained for the three-year study indicate:
1) . There was a slight increase in milk production of the Holstein
cattle that were subjected to sprinkling over the production of the cows
not subjected to sprinkling, especially during the continuous trial whenthe animals were sprinkled daily. There was practically no increase in
the milk production of the sprinkled Jersey cows over that of the Jerseys
not sprinkled.
2) . There was no relationship between the average daily maximumenvironmental temperature (88° F.) and the composition of the milk,
for the three trials.
3) . Any cooling effect of the animals from sprinkling had little, if any,
effect on the physical and chemical constituents in milk.
4) . The average physical and chemical composition of the milk from
the exj^erimental cows in the trials over the three-year period is within
a 10 per cent variation when compared with the average values report-
ed by other workers in the United States and foreign countries. Thevalues recorded by other investigators are consistently higher in the
physical and chemical composition of milk with the exception of ash
and lactose.
26

REFERENCESBakalor, S. The Composition of City Milk in Cape Town. Farming in S.
Africa, 23: 675-676. 1948.
Bartlett, S. The Influence of High Environmental Temperature on theSecretion and Composition of Milk. J. Dairy Res., 6: 283-288. 1935.
Bonsma,J. C. Influence of Climate on Animal Production and its Effects on
Himian Nutrition. The Leech. April 1-9. 1947.
Clothier, R. W. Seasonal Variations in Butterfat Content of Milk in SouthernArizona. Soc. Prom. Agr. Sci. Proc, 39:75-90. 1919.
Cohble,J. W., and Ragsdale, A. C. The Effect of Increasing Environmental
Temperature on the Composition of Milk.J. Dairy Sci., 32:713. 1949.
Davis, R. N., Harland, F. G., Caster, A. B., and Kellner, R. H. Variationsin the Constituents of Milk under Arizona Conditions. (1) Variations of In-dividual Cows within Breeds by Calendar Months.
J.Dairy Sci., 30:415-424. 1947.
Davis, R. N., Harland, F. C, Caster, A. B., and Kellner, R. H. (3) Variationsin Milk from Jersey, Guernsey, Holstein, and Mixed Herds.
J. Dairy Sci.,
30:435-442. 1947.
Espe, Dwight. Secretion of Milk. 1946. The Collegiate Press, Inc., Ames, Iowa.Jacobsen, D. H., and Wallis, G. C. Factors Affecting the Composition of Milk.S. Dak. Agr. Expt. Sta. Bull. 331. 1939.
Horner, C. J., and Herzer, E. H. A Study of the Composition of Milk Producedin Different Areas of Mississippi. Miss. Agr. Expt. Sta. Bull. 474. 24 p. 1950.Kastli, P. The Composition of Milk in Switzerland. Schweiz, Melchzeitung71:65-68, 291-292, 295-296, 299-300, 303. 1945. (Abstract-Nutr. Abst. andRev., 15:427. 1946.)
Laborthe, C. A. Seasonal Variations in the Fat Content of Milk From SomeAreas of the Argentine Republic. Vet. B. Aires. 1 1:181-214. 1946. (Abstract-Nutr. Abst. and Rev., 17:613. 1948.)
Miller, G. D., Frye, Jr., J. B., and Burch, Jr., B.J. La. Agr. Expt. Sta. 1951.
Unpublished results.
Morris, H. P., Nelson,J. W., and Palmer, L. S. Quantitative Determination
of Calcium, Magnesium and Phosphorus in Feed Stuff and Cattle Excreta. Ind.Eng. Chem. Anal. Ed. 3:164-172. 1931.
Official and Tentative Methods of Analysis, 5th ed., A.O.A.C. WashingtonD. C. 1940.
'
Overman, O. R. Monthly Variations in the Composition of Milk. T DairySci., 28:305-309. 1945.
Overman, O. R. Monthly Variation in the Composition of Milk. T Dairy Sci30:A 108. 1947.
Ragsdale, A. C, Thompson, H. J., Worstell, D. M., and Brady. S. Environ-metal physiology IX. Milk Production and Feed and Water ConsumptionResponses of Brahman, Jersey and Holstein Cows to change in Temperature,50= to 105o F. and 50o to 80o F: Mo. Agr. Expt. Res. Bui. 460. 1950Ragsdale, A. C, and Turner, C. W. The Seasonal Variations of Per Cent ofFat in Cows' Milk. J. Dairy Sci., 5:544-,554. 1922.
Ragsdale, A. C, Worstell, D. M., Thompson, H.J., and Brady. S. Environmental
Physiology VI. Influence of Temperature 50o to Oo F. and 50o to 95o F. onMilk Production, Feed and Water Consumption and Body Weight in Jerseyand Holstein Cows. Mo. Agr. Expt. Sta. Res. 449. 1949.
Regan, W. M., and Richardson, G. A. Reactions of the Dairy Cows to Changes inEnxironmental Temperature.
J. Dairy Sci., 21: 73-79. 1938.Rhoad, A. O. The Dairy Cow of the Tropics. Amer. Soc. Animal Prod Proc28:212-214. 1935.
Riek, R. F., and Lee, D. H. K. Reactions to Hot Atmospheres of Jersey Cowsin Milk.
J. Dairy Res., 15:219-226. 1948.
27

Sinha, K. C, and Minett, F. C. Application of Water to the Body Surface of
Water Buffaloes and its Effect on Milk Yield.J. Animal Sci., 6:258-264. 1947.
Snedecor, C. W. Statistical Methods, 3rd ed. Iowa State College Press, Ames,Iowa. 1940.
Van Rensburg, S. W. J. The Secretion of Abnormal Milk by Quarters Freefrom Pathogens. Onderstepoort
J. Vet. Sci., 22: 91-226. 1947.
(Abstract-Nutr. Abst. and Rev., 18(3) : 503. 1949.)
Weaver, E., and Mathews, C. A. The Influence of Temperatures and CertainOther Factors upon the Peicentage of Fat in Milk. Iowa Agr. Expt. Sta. Res.
Bui. 107. 1928.
White, G. C, and Judkins, H. P. Variations in the Fat, Solids-not-fat andTotal Solids in Cows' Milk. Conn. (Storrs) Agr. Expt. Sta. Bui. 94. 1918.
Woodward, T. E., and Jensen, E. The Influence of Season on Milk Production.
U.S.D.A. Bur. Ag. Econ., Mimeo Bui. 1942.
28

oH
r-'
to
CO
.5oo
5ci
oi
^^
<_;
-4
.13
to
IS
oj
CN
GO
CO
OOCM
CO
CO
CO
OO
IT)
to
CO
OO
CO
S-
2:2;
!>
CO
aa
U00
cm
CO
OO
CT)
oo
^(2S
^'^
Tl^
29
>—
1—
'CO
CO
I—
I—I
CO
CO
OO
—
i
^3

GO
rlH
O00
-H^
CO
OO
CO—
aa
3^
CO
Oi
.—
1^
OO
^F—
t
CO
vn
00
cn
^^
x>
oo
oo
uO
oo
oo
ot--
'JZ^^
cn
CO
30
O00
—
oo
^^

