the prevalence and characteristics of children …
TRANSCRIPT

THE PREVALENCE AND CHARACTERISTICS OF CHILDREN GROWING UP WITH RELATIVES IN THE UK
Characteristics of children living with relatives in England: Part I
Dinithi Wijedasa Hadley Centre for Adoption & Foster Care Studies
University of Bristol
BRIEFING PAPER 001
An ESRC Funded Research Study

This briefing paper series provides snapshots from the research titled ‘Kinship Care Re-visited: Using Census 2011 Microdata to Examine the Extent and Nature of Kinship Care in the UK’ funded by the Economic and
Social Research Council (ESRC) grant ES/K008587/1.
This work contains statistical data from the Office for National Statistics (ONS), which is Crown Copyright. The use of ONS statistical data in this work does not imply the endorsement of the ONS in relation to the
interpretation or analysis of the statistical data. This work uses research datasets which may not exactly reproduce ONS aggregates.
ACKNOWLEDGEMENTS
The author gratefully acknowledges the feedback of her mentor, Professor Julie Selwyn and the support from the team at the Virtual Microdata Laboratory at the Office for National Statistics, Titchfield. The author would
also like to thank Sarah Brown of the School for Policy Studies at the University of Bristol for editorial guidance. This research project is being conducted under the auspices of an academic and a stakeholder
advisory group. The list of members in the advisory groups and further details of the study can be found on the project website: www.bristolkinshipstudy.co.uk
The responsibility for the analysis, results and the views expressed ultimately rests with the author.
Published by the Hadley Centre for Adoption and Foster Care Studies, University of Bristol
Copyright ©Dinithi Wijedasa 2015
ISBN- 978-0-9560194-9-3

The prevalence and characteristics of children growing up with relatives in the UK (Briefing paper 001)
1
KEY MESSAGES
• This briefing paper is the first in a series, from an Economic and Social Research Council (ESRC) funded research study. The study explores the prevalence and characteristics of children growing up in kinship care in the UK using 2011 Census microdata (grant ES/K008587/1).
• This paper explores the main characteristics of children growing up in kinship care in England.
• Kinship care remains the most prevalent form of non-parental care for children who are unable to live with their parents in England.
• At the time of the 2011 Census, there were just over 11.3 million children (0-18years) living in England. Of these, an estimated 152,910 (1.4%) children were living in kinship care.
• In other words, in 2011, one in 74 children in England were growing up in the care of relatives.
• Since the last Census in 2001, the kinship child population had grown at a rate of 7%, resulting in 9,543 more children in kinship care in 2011.
• The 7% growth in the kinship child population is more than three times that of the population growth rate of all children in England, which was 2% over the same time period.
• The highest regional prevalence of kinship care (1.7%) was seen in Greater London and the North East.
• The highest regional growth rates in the kinship child populations between 2001 and 2011 were seen in
the South West (40%) and the South East (24%) regions.
• Nearly one in three (32%) children growing up in kinship care in England were non-white. In the population of children growing up with at least one parent, 24% were non-white.
• The highest prevalence of kinship care was seen within the black ethnic group. One in every 37 black
children was growing up in the care of relatives.
• Despite kinship care still being the predominant option for children who are unable to live with their parents in England and despite research evidence that children living in kinship care have better outcomes than children fostered by non-relatives, the results of this study show that a large number of children in kinship care are affected by poverty and deprivation.
• Forty percent of all children in kinship care in England were living in households located in the 20% of the poorest areas in England. This is an improvement of only 4% since 2001, which implies that the financial burden on kinship families still remain an area of concern.
• More than three quarters (76%) of the kinship children were living in a deprived household. The high
prevalence (4%) of kinship children in the most deprived households in England and the low prevalence (0.7%) of kinship children in the households with no deprivation indicate a pressing need for support and services to be provided to these children and their kinship families.
• One in two (51%) children were growing up in households headed by grandparents whilst 23% were growing up in households headed by a sibling. The remaining were growing up in households headed by another relative, such as an aunt, an uncle or a cousin.
• Compared with children growing up with at least one parent, children in kinship care were nearly twice as likely to have a long-term health problem or disability that limited their day-to-day activities.

The prevalence and characteristics of children growing up with relatives in the UK (Briefing paper 001)
2
INTRODUCTION
The family environment that children grow up in can greatly influence their outcomes in terms of development and wellbeing (1). Although most children in the UK still live with at least one parent (2), some are unable to live with their parents due to neglect or abuse by parents, parental sickness or death, parents being in prison; family circumstances such as poverty; parental drug and alcohol abuse or; mental health issues. The majority of these children live with relatives or friends, otherwise known as kinship care. Previous analyses of the 2001 Census here at the Hadley Centre found that in England, there were 143,367 children living with relatives in non-parent households in England, compared to 58,900 children who were looked after by the State (3). Kinship placements can result when (4-7):
1. Local authorities place looked after children with kinship carers approved as foster carers, where placements are then supported as foster placements. However, analysis of the 2001 Census found that only around 5% all children living with relatives in the UK were recorded as foster care arrangements (8).
2. Private law orders such as Special Guardianship orders or Residence orders (now called Child Arrangement orders) are made to kinship carers taking on previously looked after children, where support is largely discretionary.
3. Private law orders such as Special Guardianship orders or Residence orders (now called Child Arrangement orders) are made to kinship carers taking on children who have not been previously looked after, where discretionary support may be available depending on the local authority. However, court data on private law orders are not shared routinely with the children’s services. Therefore children’s services are most likely unaware of these placements.
4. Kinship placements are privately arranged between relatives, where no private law orders are made and where kinship carers are not approved foster carers. This constitutes the largest number of kinship placements in England, but there is no legal obligation made on close relatives to notify the authorities of such child care arrangements between families. Therefore these kinship families remain largely unaware of the discretionary specialist support and services that may be available to them from the local authorities (7-9).
Key terms
•KINSHIP CARE: Kinship care in this study was defined as an instance where a child was growing up in the care of a relative, in the absence of parent/s. Although most definitions of kinship care include situations where friends of the family care for children in the absence of parents, these households could not be separately identified from the Census returns. They are therefore excluded from the definition of kinship care in this report.
•PREVALENCE: The proportion or the percentage of people in the population belonging to a particular group of interest, at a given point in time.
•CHILD: UN Convention on the Rights of the Child defines anyone under the age 18 years as a child, unless majority is attained earlier. In the UK, the age of majority is 18 years. Therefore, in this study, a child was defined as anyone who is under the age of 18 (0-18 years).
•POPULATION GROWTH RATE: The change in population over a specified period of time expressed as a percentage of the population at the start of the period.

The prevalence and characteristics of children growing up with relatives in the UK (Briefing paper 001)
3
In the absence of good parental care, kinship care is generally considered a better alternative to being fostered by unrelated foster carers. Children in kinship care are more likely to have better mental health and behavioural outcomes due to the stability of placements and they are also more likely to preserve their identities through family and community ties (5, 10-18). Despite these indicated benefits, kinship care can also entail some risk (19). Some children in kinship care placements continue to have complex socio-emotional needs due to previous adverse experiences, such as abuse and neglect (18, 20, 21) and a majority live in poverty and deprivation (21-23). Kinship carers themselves often tend to give up their employment to look after the children and are likely to have a higher incidence of physical health concerns, with many experiencing stress and also facing isolation and discrimination (12, 24, 25).
Since the most recent estimates of kinship care prevalence in the UK are based on the 2001 Census, there is a current lack of an evidence base on kinship care households to inform policy formation, policy implementation and effective resource allocation. This briefing paper, which is the first in a series, provides a brief overview of the characteristics of the children growing up with relatives in England. This series of briefing papers is published as part of a study funded by the ESRC to analyse microdata from the 2011 Census in order to provide nationally representative, reliable statistics and maps on the distribution and characteristics of kinship care households in the four countries of the UK.
POLICY BACKGROUND
In recent years, governments in England, Wales, Scotland and Northern Ireland have all acknowledged the need to support kinship families [27-29]. For example, under statutory guidance on family and friends care, published in 2010, all local authorities in England, were required to publish specific policies with regard to children growing up in the care of family and friends by September 2011(26). However, at five months after the stipulated deadline, a research study found that only 55% of the local authorities had fulfilled this obligation (27). It is important that appropriate and adequate support services are provided to these kinship families, who do not fall into the traditional family categorisations, targeting their specific needs. However, the research further indicated that only 13% of the policies were based on local demographic details and analyses of the needs of kinship families, which may have resulted in inadequate support and resources being allocated and provided for local kinship families (27).
AIM AND METHOD
The main aim of this research is to contribute to a more up-to-date and nuanced academic, policy and public understanding of the prevalence and characteristics of kinship families in the UK through secondary analysis of 2011 Census microdata. A more detailed overview of the study, including the specific objectives and a detailed methodology, can be found on the project website at
www.bristolkinshipstudy.co.uk.

The prevalence and characteristics of children growing up with relatives in the UK (Briefing paper 001)
4
DATA SOURCE AND ANALYSES
Kinship care prevalence rates and the characteristics of the kinship households in the UK were established through analyses of 2011 Census secure microdata. These microdata samples contain anonymised records of 10% of the total data from the Census and therefore, provide the best and most representative data on households in the UK. They are made available for analysis at secure microdata laboratories to those with an approved researcher license. Secure microdata were analysed at individual and household levels, including the full household relationship matrix, which was used to identify:
Children living with at least one parent. Children living in households where parents were absent, but where the household reference
person1 was a relative of the child.
Comparisons were made between these two groups, where possible. Although most definitions of kinship care include instances where friends of the family care for the children in the absence of parents, these households could not be separately identified from the Census returns and are therefore excluded from the definition of kinship care in this report. The household data excluded individuals living in communal establishments (28)2. Therefore, all results exclude children living in communal establishments such as residential/juvenile care settings. The numbers in the tables and figures will not always add up to the total number of children in the population as children with missing data points were excluded from analyses.
WEIGHTS All analyses have been weighted by a factor of 10 as the analyses were run on a 10% sample of the Census data.
1 The concept of a household reference person (HRP) was introduced in the 2001 census to replace the traditional concept of the head of the household [28]. 2 A more detailed definition of communal establishments can be found in [28].

The prevalence and characteristics of children growing up with relatives in the UK (Briefing paper 001)
5
RESULTS
(29, 30)
Table 1. Estimates of children living in kinship care in 2001 and 2011 in England
Number of children in kinship care
Prevalence of kinship care (%)
2001 143,367 1.3%
2011 152,910 1.4%
Source: ONS. Estimates calculated from 2011 Census Secure Microdata 2001 estimates from Nandy et al., 2011 (8)
The prevalence of children living in kinship care in England
At the time of the 2011 Census, there were just over 11.3 million children (0-18 years) living in England.
Of those, an estimated 152,910 (1.4%) children were living in kinship care (Table 1).
In other words, one in 74 children in England were growing up in the care of relatives. The prevalence of kinship care at local authority level are given in Appendix A.
The number of children growing up in kinship care has increased by a rate of 7% since the last Census in 2001.
The growth in the number of children growing up in kinship care is more than three times that of the population growth of all children in England, where the total child (0-18 years) population growth rate was 2% over the same time period [28, 29].
The regional prevalence of kinship care in England
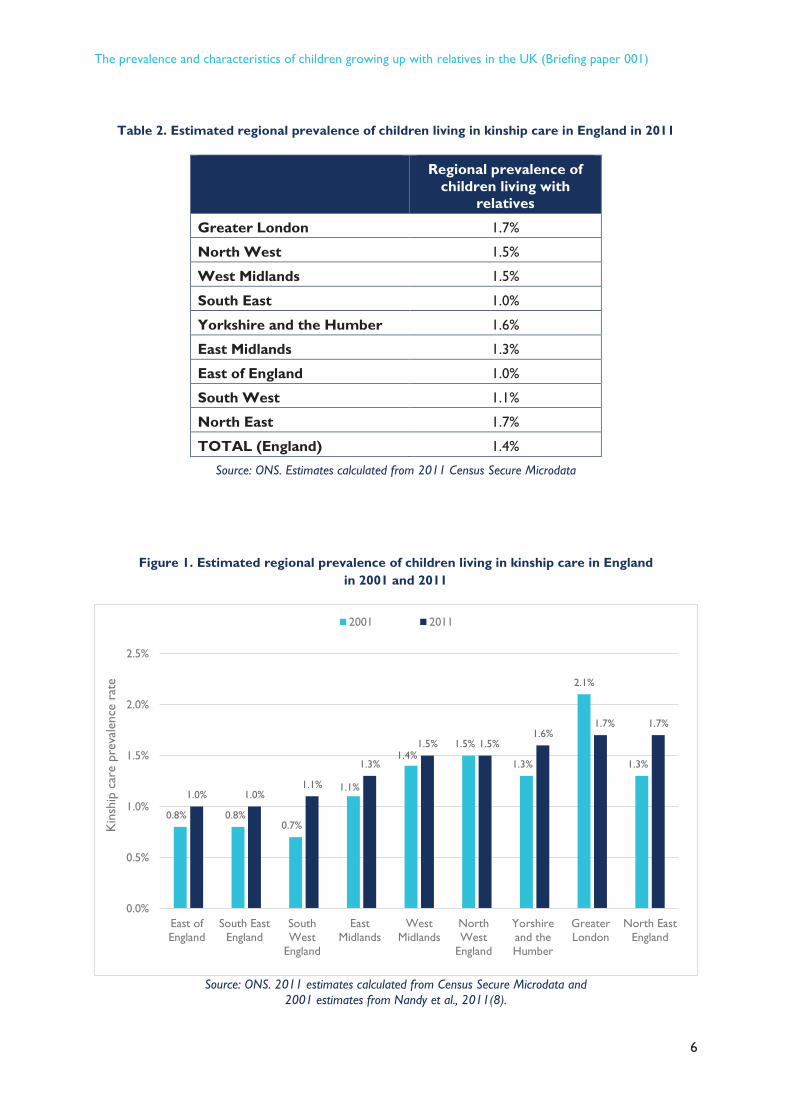
The regional estimates of the number and the prevalence of children living with relatives in England is given in Table 2.
The highest regional kinship care prevalence of 1.7% was seen in Greater London and North East England.
When compared with the 2001 estimates, all regions except Greater London and North West have seen an increase in the prevalence of children living with relatives (Figure 1).
The prevalence and characteristics of children growing up with relatives in the UK (Briefing paper 001)
6
Table 2. Estimated regional prevalence of children living in kinship care in England in 2011
Regional prevalence of children living with
relatives
Greater London 1.7%
North West 1.5%
West Midlands 1.5%
South East 1.0%
Yorkshire and the Humber 1.6%
East Midlands 1.3%
East of England 1.0%
South West 1.1%
North East 1.7%
TOTAL (England) 1.4%
Source: ONS. Estimates calculated from 2011 Census Secure Microdata
Figure 1. Estimated regional prevalence of children living in kinship care in England in 2001 and 2011
Source: ONS. 2011 estimates calculated from Census Secure Microdata and
2001 estimates from Nandy et al., 2011(8).
0.8% 0.8%0.7%
1.1%
1.4%1.5%
1.3%
2.1%
1.3%
1.0% 1.0%1.1%
1.3%
1.5% 1.5%1.6%
1.7% 1.7%
0.0%
0.5%
1.0%
1.5%
2.0%
2.5%
East ofEngland
South EastEngland
SouthWest
England
EastMidlands
WestMidlands
NorthWest
England
Yorshireand theHumber
GreaterLondon
North EastEngland
Kin
ship
car
e pr
eval
ence
rat
e
2001 2011

The prevalence and characteristics of children growing up with relatives in the UK (Briefing paper 001)
7
Figure 2. Estimated regional distribution of children in kinship care, compared with children living with at least one parent in England in 2011
Source: ONS. Estimates calculated from 2011 Census Secure Microdata
The regional distribution of kinship care in England
We then looked at how the kinship child population was distributed across the regions (Figure 2).
One in five children living with relatives in England were living in Greater London
Greater London, the North West, the West Midlands, Yorkshire and the Humber and the North East had proportionately more children in kinship care in the region when compared with the proportion of children growing up with at least one parent.
16%
13%11%
16%
10%
8%
11%
9%
5%
20%
15%
12%
12%
11%
8%
8% 7%
6%
0%
5%
10%
15%
20%
25%
G r e a t e r L o n d o n
N o r t h W e s t
E n g l a n d
W e s t M i d l a n d s
S o u t h E a s t E n g l a n d
Y o r k s h i r e a n d t h e H u m b e r
E a s t M i d l a n d s
E a s t o f E n g l a n d
S o u t h W e s t
E n g l a n d
N o r t h E a s t
E n g l a n d
PRO
PORT
ION
OF
CH
ILD
REN
IN R
EGIO
N
Children living with parents (N= 11,059,990) Children living with relatives (N=152,910)
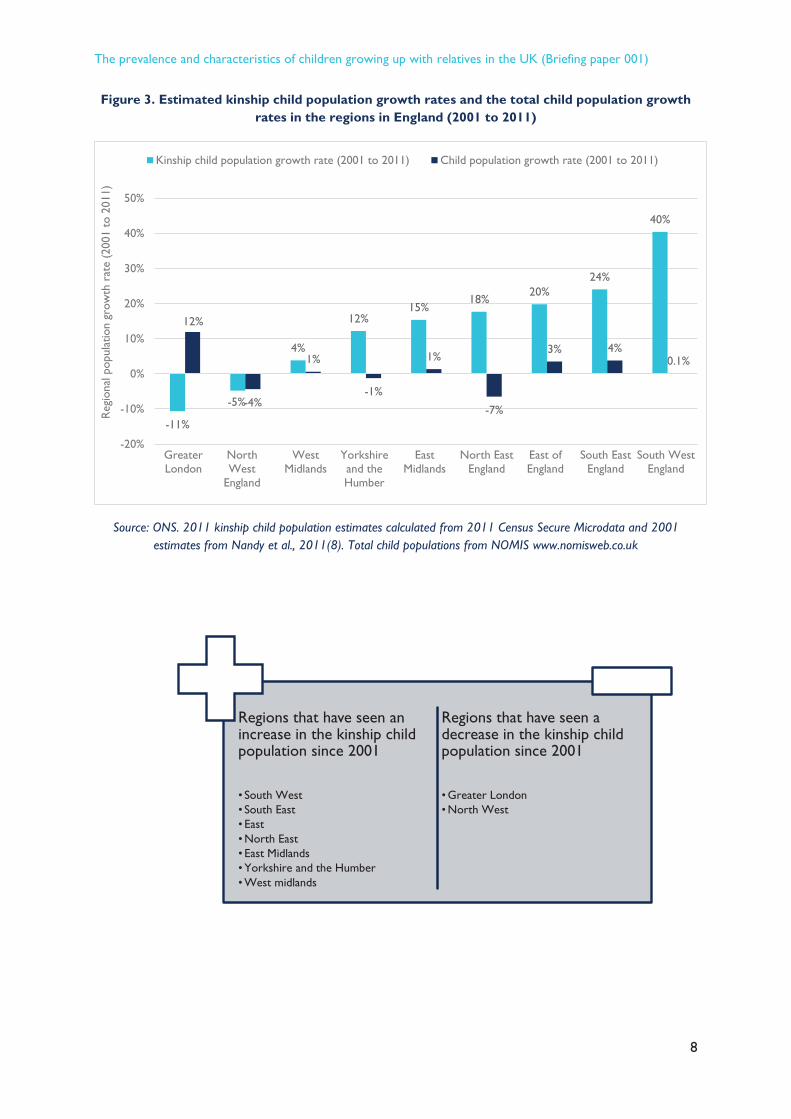
The regional kinship population growth rate in England (2001-2011)
The kinship child population growth rate in comparison with the total child (0-18 years) population growth rate in each of the regions is shown in Figure 3.
The highest regional growth rate in the kinship child populations between 2001 and 2011 was seen in the South West and the South East regions.
The prevalence and characteristics of children growing up with relatives in the UK (Briefing paper 001)
8
Figure 3. Estimated kinship child population growth rates and the total child population growth rates in the regions in England (2001 to 2011)
Source: ONS. 2011 kinship child population estimates calculated from 2011 Census Secure Microdata and 2001 estimates from Nandy et al., 2011(8). Total child populations from NOMIS www.nomisweb.co.uk
-11%
-5%
4%
12%15%
18%20%
24%
40%
12%
-4%
1%
-1%
1%
-7%
3% 4%0.1%
-20%
-10%
0%
10%
20%
30%
40%
50%
GreaterLondon
NorthWest
England
WestMidlands
Yorkshireand theHumber
EastMidlands
North EastEngland
East ofEngland
South EastEngland
South WestEngland
Regi
onal
pop
ulat
ion
grow
th r
ate
(200
1 to
201
1)
Kinship child population growth rate (2001 to 2011) Child population growth rate (2001 to 2011)
Regions that have seen an increase in the kinship child population since 2001
• South West • South East• East•North East• East Midlands•Yorkshire and the Humber•West midlands
Regions that have seen a decrease in the kinship child population since 2001
•Greater London•North West

The prevalence and characteristics of children growing up with relatives in the UK (Briefing paper 001)
9
Figure 4. The estimated age distribution of children living in kinship care compared with children living with at least one parent in England in 2011
Source: ONS. Estimates calculated from 2011 Census Secure Microdata
Gender of children in kinship care in England
In 2011, 51% of the children living with their kin were male.
The proportions of male and female children in kinship care are the same as that of the total child population in England.
The age distribution of children in kinship care in England
The age distribution of children in kinship care, compared with those living with at least one parent is shown in Figure 4.
Compared with children who were growing up with at least one parent, where the age distribution of the children was evenly distributed, a larger proportion of children growing up in kinship care were older.
Fifty percent of the children growing up in kinship care in 2011 in England were between 10-18 years of age. This was higher than that of the population of children living with at least one parent, where 44% were between the ages of 10-18 years.
The results from the 2001 Census analyses was similar, where 51% of the kinship children were between 10-18 years (8).
0%
1%
2%
3%
4%
5%
6%
7%
8%
9%
10%
0 1 2 3 4 5 6 7 8 9 1 0 1 1 1 2 1 3 1 4 1 5 1 6 1 7
A G E I N Y E A R S
Prop
ortio
n of
chi
ldre
n w
ithin
eac
h ag
e ba
nd
Children living with parents (N= 1,105,990) Children living with relatives (N=152,910)

The prevalence and characteristics of children growing up with relatives in the UK (Briefing paper 001)
10
Table 3. Estimates of children in kinship care by children’s age in England in 2001 and 2011
Age group Number of children in
kinship care (2001)
Number of children in
kinship care (2011)
Prevalence rate 2001
(%)
Prevalence rate 2011
(%)
Kinship child
population growth rate (2001-2011)
0 to 4 years 33,333 40,300 1.10% 1.20% 21%
5 to 9 years 36,567 35,520 1.10% 1.20% -3%
10 to 14 years 41,633 40,640 1.30% 1.30% -2%
15 to 18 years 31,833 36,450 1.70% 1.90% 15%
Total (England)
143,366 152,910 1.30% 1.40% 7%
Source: ONS. Estimates calculated from 2011 Census Secure Microdata 2001 estimates from Nandy et al., 2011(8)
The prevalence and population growth of kinship care in England by age
The prevalence and population growth rates of children in kinship care in England between 2001 and 2011 are given in Table 3.
When compared with the 2001 Census estimates (3), the number of children aged 0-4 years in kinship care has increased by 21% and the number of children aged 15-18 years in kinship care has increased by 15%.
Children’s relationship to the head of the household
The concept of a household reference person (HRP) was introduced in the 2001 census to replace the traditional concept of the head of the household (28). In the Census, the household reference person is defined as the person who earns the most in the household. If there are two people with the same earnings, the older person of the two is regarded as the household reference person.
One in two (51%) children were growing up in households headed by grandparents whilst 23% were growing up in households headed by a sibling. The remaining were growing up in households headed by another relative, such as an aunt, an uncle or a cousin.
The proportion of grandparent-headed households has increased since 2001, whilst the proportion of sibling-headed households has decreased. The comparison between the 2001 and 2011 estimates is shown in Figure 5.

The prevalence and characteristics of children growing up with relatives in the UK (Briefing paper 001)
11
Figure 5. Estimates of children’s relationship to their kin carers in England in 2011 (N= 152,910) and 2001 (N=143,367)
Source: ONS. Estimates calculated from 2011 Census Secure Microdata 2001 estimates from Nandy et al., 2011 (8)
44%
17%
38%
51%
27%23%
0%
10%
20%
30%
40%
50%
60%
Grandchild Relation-other Sibling
England 2001 England 2011
Note on the kinship children's relationship to the head of the household
It was not possible to ascertain whether the household reference persons were the children’s primary carers from the Census data. Therefore, it is possible that in some households, persons other than the household reference person were the child’s primary caregiver. There may be grandparent headed households where a sibling is the primary carer and also sibling headed households where a grandparent or another relative is the primary caregiver. The children’s relationship to the other household members will be explored in detail in the forthcoming briefing papers.
Prevalence of kinship care within ethnic groups in England
Prevalence of kinship care within the different ethnic groups in 2011 are given in Table 4.
The highest prevalence of kinship care was seen within the black ethnic group. One in 37 black children was growing up in the care of relatives.
Overall, the non-white ethnic groups had a higher prevalence of kinship care compared with the white population. The prevalence rate of kinship care within the white child population was 1.2%, whilst the prevalence rate within the non-white population of children in England was 2.0%.

The prevalence and characteristics of children growing up with relatives in the UK (Briefing paper 001)
12
Table 4. Estimated prevalence of children in kinship care within ethnic groups in England in 2011
Ethnicity 2011 kinship population (n=149,540)
Prevalence of kinship care within
ethnic group
Prevalence per 1000 children within ethnic group
Black 14,950 2.7% 27
Asian 19,710 1.8% 18
Mixed 10,440 1.8% 18
Other ethnic group 2,240 1.6% 16
White 102,200 1.2% 12
Source: ONS. Estimates calculated from 2011 Census Secure Microdata
3
Figure 6. The estimated ethnic distribution of children living in kinship care compared with children living with at least one parent in England in 2011
Source: ONS. Estimates calculated from 2011 Census Secure Microdata
3𝜒𝜒2(1)= 9496.08, p < .001, OR= 1.70
Distribution of kinship care within ethnic groups in England
Nearly a third (32%) of the children growing up in households headed by a relative in 2011 were non-white (Figure 6).
Kinship children were 1.7 times more likely to be non-white compared with children growing up with at least one parent3.
79%
68%
21%
32%
0%
20%
40%
60%
80%
100%
Children living with parents(N= 10,944,530)
Children living with relatives(N=149,540)
Perc
enta
ge o
f chi
ldre
n in
eth
nic
grou
p
White Non-white
The prevalence and characteristics of children growing up with relatives in the UK (Briefing paper 001)
13
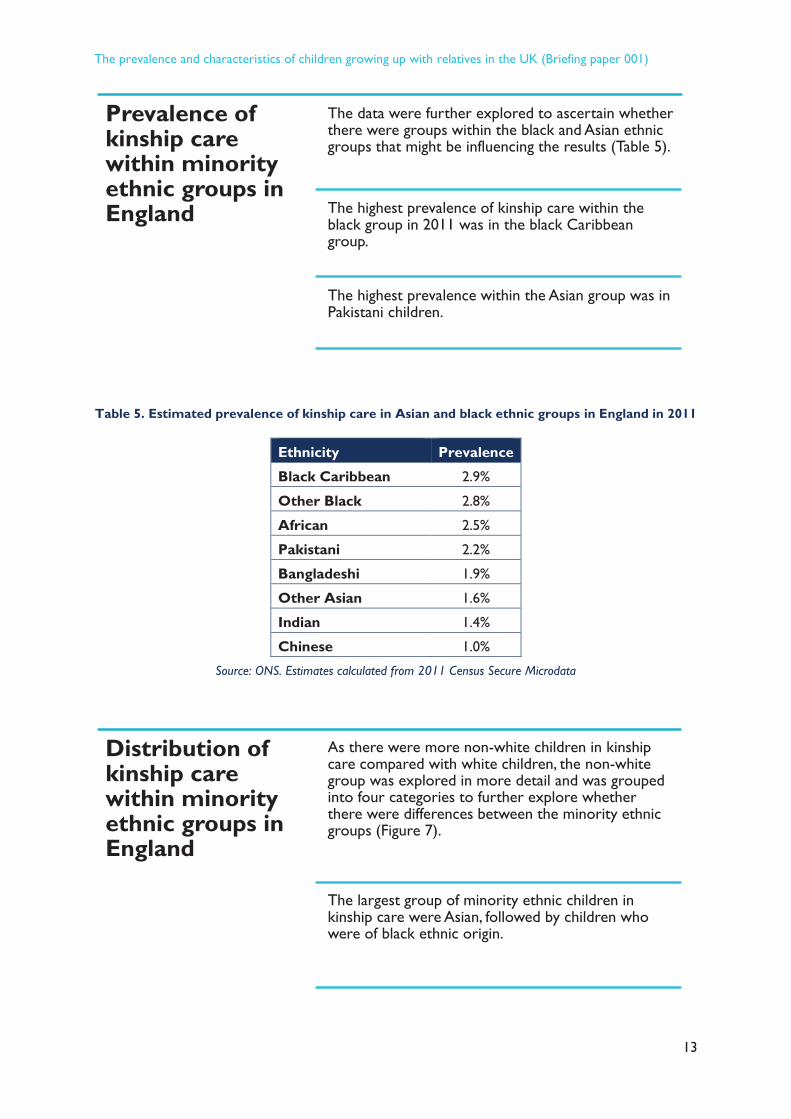
Table 5. Estimated prevalence of kinship care in Asian and black ethnic groups in England in 2011
Ethnicity Prevalence
Black Caribbean 2.9%
Other Black 2.8%
African 2.5%
Pakistani 2.2%
Bangladeshi 1.9%
Other Asian 1.6%
Indian 1.4%
Chinese 1.0%
Source: ONS. Estimates calculated from 2011 Census Secure Microdata
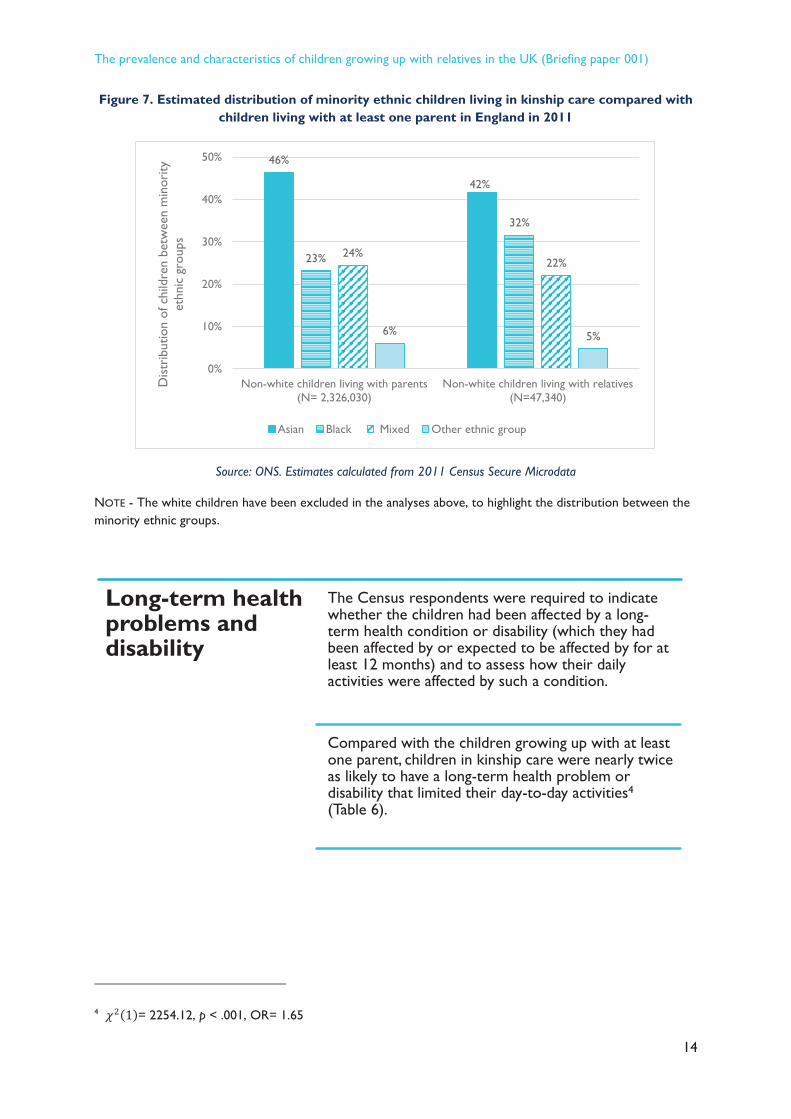
Distribution of kinship care within minority ethnic groups in England
As there were more non-white children in kinship care compared with white children, the non-white group was explored in more detail and was grouped into four categories to further explore whether there were differences between the minority ethnic groups (Figure 7).
The largest group of minority ethnic children in kinship care were Asian, followed by children who were of black ethnic origin.
Prevalence of kinship care within minority ethnic groups in England
The data were further explored to ascertain whether there were groups within the black and Asian ethnic groups that might be influencing the results (Table 5).
The highest prevalence of kinship care within the black group in 2011 was in the black Caribbean group.
The highest prevalence within the Asian group was in Pakistani children.
The prevalence and characteristics of children growing up with relatives in the UK (Briefing paper 001)
14
Figure 7. Estimated distribution of minority ethnic children living in kinship care compared with children living with at least one parent in England in 2011
Source: ONS. Estimates calculated from 2011 Census Secure Microdata
NOTE - The white children have been excluded in the analyses above, to highlight the distribution between the minority ethnic groups.
4
4 𝜒𝜒2(1)= 2254.12, p < .001, OR= 1.65
46%
42%
23%
32%
24%22%
6% 5%
0%
10%
20%
30%
40%
50%
Non-white children living with parents(N= 2,326,030)
Non-white children living with relatives(N=47,340)
Dis
trib
utio
n of
chi
ldre
n be
twee
n m
inor
ity
ethn
ic g
roup
s
Asian Black Mixed Other ethnic group
Long-term health problems and disability
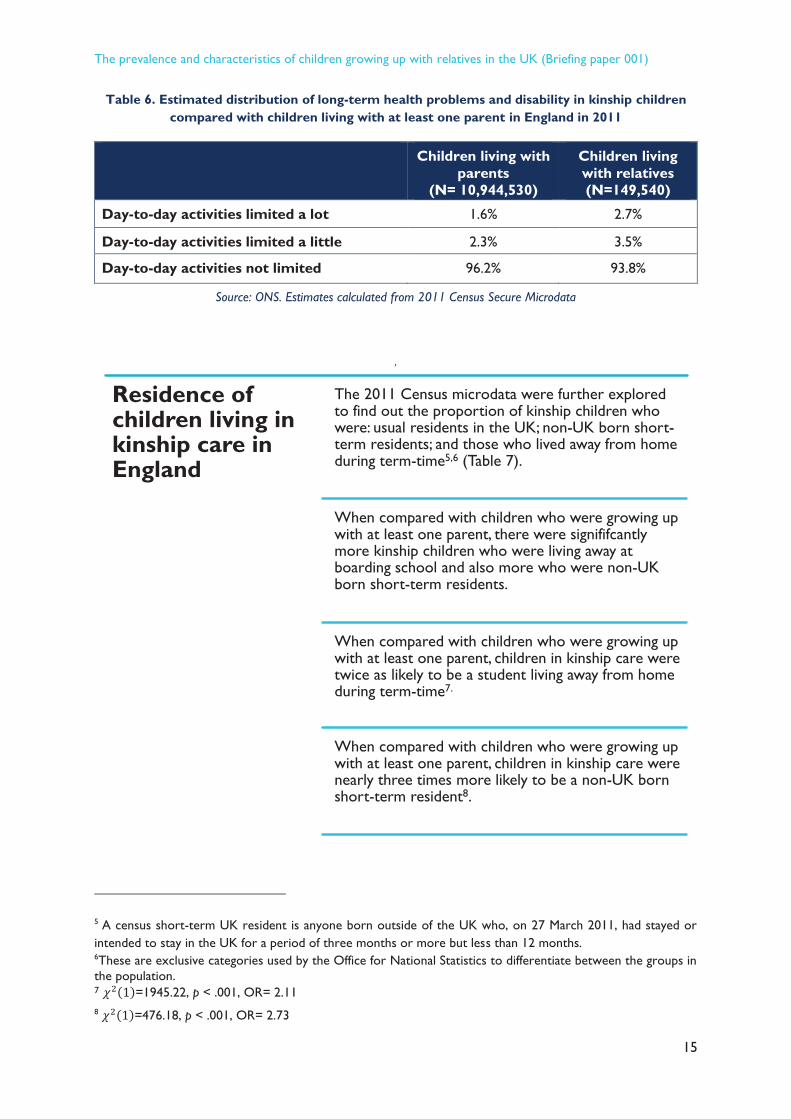
The Census respondents were required to indicate whether the children had been affected by a long-term health condition or disability (which they had been affected by or expected to be affected by for at least 12 months) and to assess how their daily activities were affected by such a condition.
Compared with the children growing up with at least one parent, children in kinship care were nearly twice as likely to have a long-term health problem or disability that limited their day-to-day activities4
(Table 6).
The prevalence and characteristics of children growing up with relatives in the UK (Briefing paper 001)
15
Table 6. Estimated distribution of long-term health problems and disability in kinship children compared with children living with at least one parent in England in 2011
Children living with parents
(N= 10,944,530)
Children living with relatives (N=149,540)
Day-to-day activities limited a lot 1.6% 2.7%
Day-to-day activities limited a little 2.3% 3.5%
Day-to-day activities not limited 96.2% 93.8%
Source: ONS. Estimates calculated from 2011 Census Secure Microdata
5,6
7
8
5 A census short-term UK resident is anyone born outside of the UK who, on 27 March 2011, had stayed or intended to stay in the UK for a period of three months or more but less than 12 months. 6These are exclusive categories used by the Office for National Statistics to differentiate between the groups in the population. 7 𝜒𝜒2(1)=1945.22, p < .001, OR= 2.11 8 𝜒𝜒2(1)=476.18, p < .001, OR= 2.73
Residence of children living in kinship care in England
The 2011 Census microdata were further explored to find out the proportion of kinship children who were: usual residents in the UK; non-UK born short-term residents; and those who lived away from home during term-time5,6 (Table 7).
When compared with children who were growing up with at least one parent, there were signififcantly more kinship children who were living away at boarding school and also more who were non-UK born short-term residents.
When compared with children who were growing up with at least one parent, children in kinship care were twice as likely to be a student living away from home during term-time7.
When compared with children who were growing up with at least one parent, children in kinship care were nearly three times more likely to be a non-UK born short-term resident8.

The prevalence and characteristics of children growing up with relatives in the UK (Briefing paper 001)
16
Table 7. Estimated distribution of the residence type of kinship children compared with children living with at least one parent in England in 2011
Children living with parents
(N= 11,059,990)
Children living with relatives (N=152,910)
Usual resident 98.9% 97.5%
Student living away from home during term-time 1.0% 2.2%
Non-UK born short-term resident 0.1% 0.3%
Source: ONS. Estimates calculated from 2011 Census Secure Microdata
Figure 8. Estimated prevalence of kinship care by IMD9 income quintile England in 2011
Source: ONS. Estimates calculated from 2011 Census Secure Microdata
Prevalence of kinship care and poverty in England
Previous research has consistently indicated that a large number of children in kinship care live in poverty (e.g., 8,19-21).
The analysis of the 2011 Census confirmed that many children in kinship care were living in the poorest areas, with the highest prevalence of kinship care seen in the group of children living in the poorest 20% of areas in England (Figure 8).
One in every 46 children living in the poorest 20% of the areas (super output areas) in England was a child living in kinship care.
In the richest 20% of areas in England, only one in every 160 children was living in kinship care.
2.2%
1.7%
1.2%
0.9%0.7%
0.0%
1.0%
2.0%
3.0%
Quintile 1(Poorest 20%)
Quintile 2 Quintile 3 Quintile 4 Quintile 5(Richest 20%)
Prev
alen
ce o
f kin
ship
car
e

The prevalence and characteristics of children growing up with relatives in the UK (Briefing paper 001)
17
(31-33)
Figure 9. Estimated distribution of poverty by IMD9 income quintiles in kinship children compared with children living with at least one parent in England in 2011
Source: ONS. Estimates calculated from 2011 Census Secure Microdata
9 Index of Multiple Deprivation, Noble et al., 2000, 2004, 2007 (31-33). The index of multiple deprivation is a measure of deprivation at small area level.
Distribution of kinship care and poverty in England
Data from the 2011 Census also indicate that 40% of all children living in kinship care in England live in households located in the 20% of the most income deprived areas in England (Figure 9)
This is an improvement of only 4% since 2001, which implies that financial burden on kinship families still remain an area of concern.
24%
20%19% 18% 19%
40%
25%
15%
11%9%
0%
10%
20%
30%
40%
50%
Quintile 1(Poorest 20% ofareas in England
Quintile 2 Quintile 3 Quintile 4 Quintile 5(Richest 20% ofareas in England)
Perc
enta
ge o
f chi
ldre
n
Children living with parents (N=10,933,410) Children living with relatives (N=149,940)

The prevalence and characteristics of children growing up with relatives in the UK (Briefing paper 001)
18
1011(34)
10 Poverty has been defined as lack of money or material possessions whilst deprivation has been defined as a lack of resources to escape from poverty (34) 11 According the 2011 Census, a household was classified as deprived if it met one or more of the following conditions [28]: Employment: where any member of a household, who is not a full-time student, is either unemployed or long-term sick, Education: no person in the household has at least level 2 education (see highest level of qualification), and no person aged 16-18 is a full-time student, Health and disability: any person in the household has general health that is “bad” or “very bad” or has a long term health problem, Housing: the household's accommodation is either overcrowded, with an occupancy rating -1 or less, or is in a shared dwelling, or has no central heating. A household is classified as being deprived in none, or one to four of these dimensions in any combination.
Prevalence of kinship care within deprived households in England
The 2011 data were further explored to see whether children living in kinship care were experiencing any household deprivation10 based on four selected household characteristics (employment; education; health and disability; and housing) as defined by the Office for National Statistics11.
Kinship children were most likely to be growing up in households deprived on all four dimensions: employment, education, health and disability and housing (Figure 10).
One in every 25 children living in households deprived in all four dimensions, in England, was a child living in kinship care.
In contrast to this, in the population of children who were growing up in non-deprived households, only one in 159 children were growing up in kinship care.
The high prevalence of kinship children in the most deprived households indicate a pressing need for support and services to be provided to these children and their kinship families.

The prevalence and characteristics of children growing up with relatives in the UK (Briefing paper 001)
19
Figure 10. Estimated prevalence of kinship care by household deprivation in England in 2011
#
Source: ONS. Estimates calculated from 2011 Census Secure Microdata
Figure 11. Estimated distribution of household deprivation for kinship children compared with children living with at least one parent in England in 2011
Source: ONS. Estimates calculated from 2011 Census Secure Microdata
4.0%3.7%
2.7%
1.7%
0.7%
0.0%
1.0%
2.0%
3.0%
4.0%
5.0%
Householdsdeprived in 4dimensions
Householdsdeprived in 3dimensions
Householdsdeprived in 2dimensions
Householdsdeprived in 1
dimension
Households notdeprived in any
dimension
Prev
alen
ce o
f kin
ship
car
e
Distribution of household deprivation in children living in kinship care in England
In 2011, a little more than three quarters (76%) of the children living in kinship care were living in households deprived on at least one dimension (see footnote 11 for a detailed description of these dimensions) (Figure 11). In contrast, less than half (47%) of the children living with at least one parent were affected by any household deprivation.
1%4%
13%
29%
53%
2%
12%
27%
36%
24%
0%
10%
20%
30%
40%
50%
60%
Householdsdeprived in 4dimensions
Householdsdeprived in 3dimensions
Householdsdeprived in 2dimensions
Householdsdeprived in 1
dimension
Households notdeprived in any
dimension
Perc
enta
ge o
f chi
ldre
n
Children living with parents (N=11,055,820) Children living with relatives (N=152,910)

The prevalence and characteristics of children growing up with relatives in the UK (Briefing paper 001)
20
FORTHCOMING TITLES IN THIS BRIEFING PAPER SERIES
The forthcoming briefing papers in this series will cover the following topics:
• The prevalence and characteristics of the children living in kinship care in Wales, Scotland and Northern Ireland.
• Household characteristics of children living in kinship care in England, Wales, Scotland and Northern Ireland.
• Poverty and deprivation faced by children living in kinship care in England, Wales, Scotland and Northern Ireland.
To join the mailing list, e-mail [email protected] or find the latest briefing papers on the project website www.bristolkinshipstudy.co.uk
REFERENCES
1. de Vaus DA, Gray M. The Changing Living Arrangements of Children, 1946-2001. Journal of Family Studies. 2004;10(1):9-19.
2. ONS. Statistical Bulletin: Families and households in the UK, 2001 to 2010. Newport: 2011.
3. Selwyn J, Nandy S. Kinship care in the UK: using census data to estimate the extent of formal and informal care by relatives. Child & Family Social Work. 2012:Online http://dx.doi.org/10.1111/j.365-2206.012.00879.x.
4. Broad B. Kinship Care: Providing positive and safe care for children living away from home. London: Save the Children UK, 2007.
5. Doolan M, Nixon P, Lawrence P. Growing up in the Care of Relatives or Friends: Delivering best practice for children in family and friends care. London: Family Rights Group, 2004.
6. Farmer E, Moyers S. Kinship care: Fostering effective family and friends placements. London: Jessica Kingsley; 2009.
7. Hunt J, Waterhouse S. Understanding family and friends care: the relationship between need, support and legal status. Carers’ experiences. London: Family Rights Group, 2012.
8. Nandy S, Selwyn J, Farmer E, Vaisey P. Spotlight on Kinship Care: Using Census microdata to examine the extent and nature of kinship care in the UK at the turn of the Twentieth century. Bristol: University of Bristol, 2011.
9. Roth D, Aziz R, Lindley B. Understanding family and friends care: local authority policies- the good, the bad and the non existent. London: Family Rights Group 2012.
10. Cuddeback GS. Kinship and family foster care: a methodological substantive syntheses of research. Children and Youth Services Review. 2004;26: 623-39.
11. Winokur M, Holtan A, Valentine D. Kinship care for the safety, permanency, and well-being of children removed from the home for maltreatment. Campbell Systematic Reviews. 2009;1.
12. Farmer E. Making kinship care work. Adoption and Fostering 2009;33(3):15-27.
13. Aldgate J. Living in kinship care: A child-centred view. Adoption and Fostering 2009;33(3):51-63.
14. Broad B, Skinner A. Relative Benefits:Placing children in kinship care. London: BAAF; 2005.

The prevalence and characteristics of children growing up with relatives in the UK (Briefing paper 001)
21
15. Burgess C, Rossvoll F, Wallace B, Daniel B. ‘It's just like another home, just another family, so it's nae different’ Children's voices in kinship care: a research study about the experience of children in kinship care in Scotland. Child & Family Social Work. 2010;15(3):297-306.
16. Winokur MA, Crawford GA, Longobardi RC, Valentine DP. Matched Comparison of Children in Kinship Care and Foster Care on Child Welfare Outcomes. Fam Soc. 2008;89(3):338-46.
17. O'Brien V. Relative foster care : an untapped placement alternative for children in the care system? A discussion of the central issues. Journal of Child Centred Practice, . 1996;3 (1):7-22.
18. Selwyn J, Farmer E, Meakings S, Vaisey P. The poor relations? children and informal carers speak out. Bristol: University of Bristol, 2013.
19. Roby JL. Children in Informal Alternative Care. New York: UNICEF Child Protection Section, 2011.
20. Farmer E. How do placements in kinship care compare with those in non-kin foster care: placement patterns, progress and outcomes? Child & Family Social Work. 2009;14(3):331-42.
21. Aziz R, Roth D. Understanding family and friends care: analysis of a population study. London Family Rights Group, 2012.
22. Richards A. Second Time around: A survey of Grandparents Raising Their Children. London: Family Rights Group, 2001.
23. Nandy S, Selwyn J. Kinship Care and Poverty: Using Census Data to Examine the Extent and Nature of Kinship Care in the UK. British Journal of Social Work. 2012.
24. Gautier A, Wellard S. Giving up the day job: Kinship carers and Employment. London: Grandparents Plus, 2012.
25. Wellard S. Too old to care? The experiences of older grandparents raising their grandchildren. London: Grandparents Plus, 2011.
26. Department for Education. Statutory Guidance on Family and Friends Care. In: Education Df, editor. London2011.
27. Roth D, Aziz R, Lindley B. Understanding family and friends care: local authority policies - the good, the bad and the non existent London: Family Rights Group, 2012.
28. Office for National Statistics. 2011 Census Glossary of Terms 2014.
29. Office for National Statistics. Mid-2011 Population Estimates: England; estimated resident population by single year of age and sex; based on the results of the 2011 Census. 2012.
30. Office for National Statistics. Census 2001: First results for population for England and Wales. London: 2003.
31. Noble M, McLennan D, Wilkinson K, Whitworth A, Barnes H, Dibben CAf. The English Indices of Deprivation 2007. London: 2008.
32. Noble M, Smith GAN, Penhale B, Wright G, Dibben C, Owen T, et al. Measuring Multiple Deprivation at the Small Area Level: The Indices of Deprivation 2000, Regeneration Research Summary, Number 37. London: 2000.
33. Noble M, Wright G, Dibben C, Smith GAN, McLennan D, Anttila C, et al. The English Indices of Deprivation 2004. London: 2004.
34. Townsend P. Deprivation. Journal of Social Policy. 1987;16:125-46.

The prevalence and characteristics of children growing up with relatives in the UK (Briefing paper 001)
22
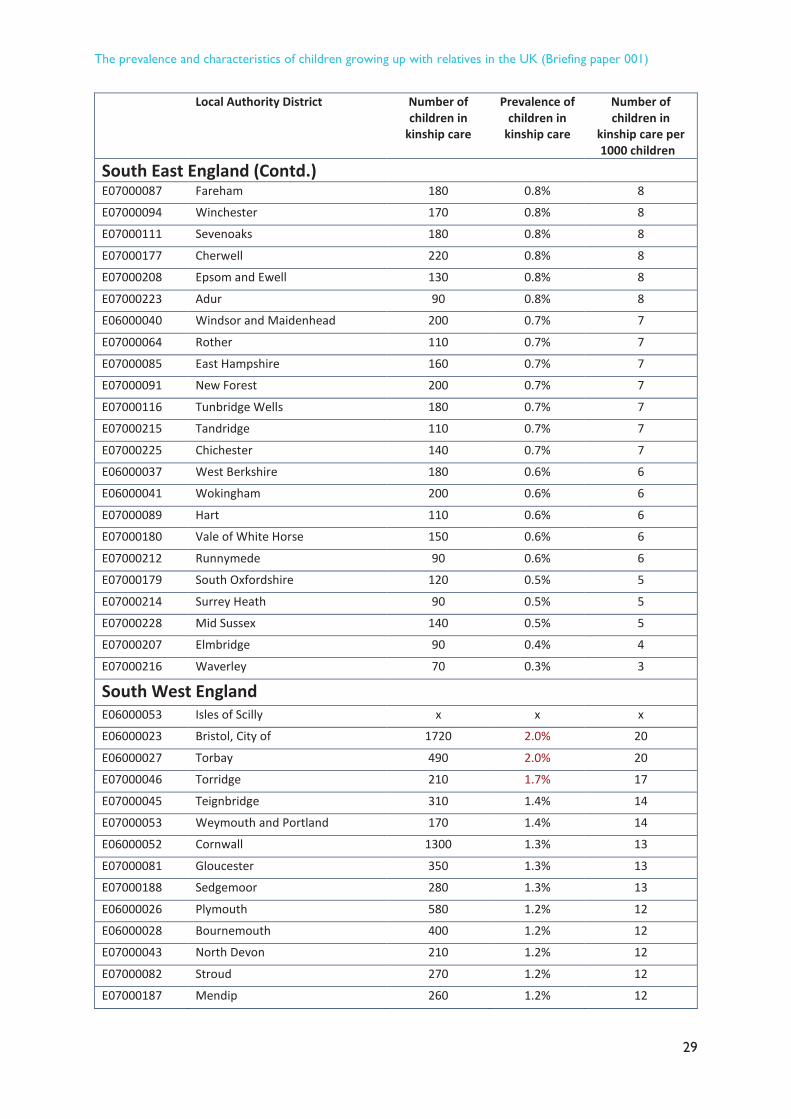
Appendix A. Estimated prevalence of children kinship care by local authority district in England, 2011
Local Authority District Number of children in kinship care
Prevalence of children in kinship care
Number of children in kinship care per 1000 children
North East England
E06000002 Middlesbrough 690 2.2% 22
E08000024 Sunderland 1210 2.2% 22
E06000001 Hartlepool 420 2.1% 21
E06000003 Redcar and Cleveland 520 2.0% 20
E06000005 Darlington 390 1.8% 18
E08000023 South Tyneside 500 1.8% 18
E06000048 Northumberland 1020 1.7% 17
E08000021 Newcastle upon Tyne 910 1.7% 17
E06000047 County Durham 1570 1.6% 16
E08000020 Gateshead 600 1.6% 16
E06000004 Stockton-on-Tees 660 1.5% 15
E08000022 North Tyneside 570 1.5% 15
North West England
E06000008 Blackburn with Darwen 920 2.5% 25
E08000003 Manchester 2590 2.4% 24
E08000011 Knowsley 780 2.4% 24
E08000012 Liverpool 2080 2.4% 24
E06000006 Halton 540 2.0% 20
E07000123 Preston 590 2.0% 20
E08000004 Oldham 1120 2.0% 20
E08000008 Tameside 850 1.9% 19
E07000121 Lancaster 440 1.8% 18
E06000009 Blackpool 460 1.7% 17
E07000117 Burnley 340 1.7% 17
E07000122 Pendle 360 1.7% 17
E08000015 Wirral 1080 1.7% 17 E07000120 Hyndburn 300 1.6% 16
E08000001 Bolton 1030 1.6% 16
E07000028 Carlisle 290 1.5% 15 E08000005 Rochdale 730 1.5% 15
E08000006 Salford 740 1.5% 15
E07000026 Allerdale 250 1.4% 14
E07000119 Fylde 190 1.4% 14 E07000125 Rossendale 200 1.4% 14
E07000127 West Lancashire 310 1.4% 14 E08000002 Bury 560 1.4% 14
E08000010 Wigan 900 1.4% 14

The prevalence and characteristics of children growing up with relatives in the UK (Briefing paper 001)
23
Local Authority District Number of children in kinship care
Prevalence of children in kinship care
Number of children in
kinship care per 1000 children
North West England (contd.)
E08000014 Sefton 730 1.4% 14
E07000118 Chorley 280 1.3% 13
E06000007 Warrington 500 1.2% 12
E06000050 Cheshire West and Chester 810 1.2% 12
E07000126 South Ribble 260 1.2% 12
E08000013 St. Helens 430 1.2% 12
E06000049 Cheshire East 820 1.1% 11
E07000027 Barrow-in-Furness 160 1.1% 11
E07000128 Wyre 210 1.1% 11
E08000007 Stockport 570 1.0% 10
E07000029 Copeland 120 0.9% 9
E08000009 Trafford 450 0.9% 9
E07000124 Ribble Valley 80 0.7% 7
E07000030 Eden 60 0.6% 6
E07000031 South Lakeland 100 0.6% 6
Yorkshire and the Humber
E08000032 Bradford 3030 2.3% 23
E08000036 Wakefield 1400 2.1% 21
E06000012 North East Lincolnshire 640 2.0% 20
E08000018 Rotherham 1010 1.9% 19
E06000010 Kingston upon Hull, City of 900 1.7% 17
E08000017 Doncaster 1060 1.7% 17
E08000019 Sheffield 1870 1.7% 17
E08000035 Leeds 2360 1.6% 16
E08000016 Barnsley 660 1.4% 14
E06000014 York 470 1.3% 13
E08000033 Calderdale 580 1.3% 13
E08000034 Kirklees 1230 1.3% 13
E06000011 East Riding of Yorkshire 760 1.2% 12
E07000163 Craven 120 1.2% 12
E07000168 Scarborough 220 1.2% 12
E07000169 Selby 190 1.2% 12
E06000013 North Lincolnshire 340 1.0% 10
E07000166 Richmondshire 110 1.0% 10
E07000164 Hambleton 140 0.8% 8
E07000165 Harrogate 260 0.8% 8
E07000167 Ryedale 70 0.7% 7

The prevalence and characteristics of children growing up with relatives in the UK (Briefing paper 001)
24
Local Authority District Number of children in kinship care
Prevalence of children in kinship care
Number of children in
kinship care per 1000 children
East Midlands
E06000017 Rutland x x x E07000033 Bolsover 340 2.2% 22
E06000018 Nottingham 1260 2.1% 21
E07000136 Boston 260 2.1% 21 E06000015 Derby 1040 1.9% 19
E07000171 Bassetlaw 400 1.9% 19
E06000016 Leicester 1390 1.8% 18
E07000154 Northampton 780 1.7% 17
E07000142 West Lindsey 270 1.5% 15 E07000153 Kettering 330 1.5% 15 E07000170 Ashfield 370 1.5% 15 E07000174 Mansfield 330 1.5% 15
E07000175 Newark and Sherwood 350 1.5% 15
E07000034 Chesterfield 240 1.3% 13
E07000137 East Lindsey 290 1.3% 13
E07000150 Corby 180 1.3% 13
E07000151 Daventry 220 1.3% 13
E07000152 East Northamptonshire 240 1.3% 13
E07000138 Lincoln 190 1.2% 12
E07000140 South Holland 200 1.2% 12
E07000141 South Kesteven 320 1.2% 12
E07000032 Amber Valley 270 1.1% 11
E07000156 Wellingborough 180 1.1% 11
E07000173 Gedling 260 1.1% 11
E07000176 Rushcliffe 250 1.1% 11
E07000036 Erewash 220 1.0% 10
E07000038 North East Derbyshire 180 1.0% 10
E07000139 North Kesteven 190 1.0% 10
E07000172 Broxtowe 210 1.0% 10
E07000039 South Derbyshire 180 0.9% 9
E07000130 Charnwood 290 0.9% 9
E07000132 Hinckley and Bosworth 190 0.9% 9
E07000035 Derbyshire Dales 100 0.8% 8
E07000129 Blaby 140 0.8% 8 E07000131 Harborough 130 0.8% 8
E07000155 South Northamptonshire 120 0.7% 7
E07000037 High Peak 80 0.5% 5 E07000133 Melton 50 0.5% 5
E07000134 North West Leicestershire 90 0.5% 5
E07000135 Oadby and Wigston 50 0.5% 5

The prevalence and characteristics of children growing up with relatives in the UK (Briefing paper 001)
25
Local Authority District Number of children in kinship care
Prevalence of children in kinship care
Number of children in
kinship care per 1000 children
West Midlands
E08000028 Sandwell 1830 2.5% 25
E08000031 Wolverhampton 1140 2.1% 21
E08000025 Birmingham 5340 2.0% 20
E08000030 Walsall 1130 1.8% 18
E06000021 Stoke-on-Trent 880 1.7% 17
E07000192 Cannock Chase 340 1.7% 17
E07000193 East Staffordshire 390 1.7% 17
E08000027 Dudley 1140 1.7% 17
E08000026 Coventry 1000 1.5% 15
E06000020 Telford and Wrekin 540 1.4% 14
E08000029 Solihull 600 1.4% 14
E06000019 Herefordshire, County of 450 1.3% 13
E07000197 Stafford 330 1.3% 13
E07000199 Tamworth 230 1.3% 13
E07000239 Wyre Forest 250 1.3% 13
E07000195 Newcastle-under-Lyme 280 1.2% 12
E07000218 North Warwickshire 140 1.2% 12
E07000236 Redditch 200 1.2% 12
E07000237 Worcester 240 1.2% 12 E07000238 Wychavon 250 1.2% 12
E07000198 Staffordshire Moorlands 190 1.1% 11
E07000194 Lichfield 190 1.0% 10
E07000219 Nuneaton and Bedworth 250 1.0% 10
E07000220 Rugby 190 1.0% 10 E07000196 South Staffordshire 180 0.9% 9
E07000234 Bromsgrove 150 0.9% 9
E07000221 Stratford-on-Avon 160 0.7% 7
E06000051 Shropshire 330 0.6% 6
E07000222 Warwick 160 0.6% 6
E07000235 Malvern Hills 80 0.6% 6
East of England
E06000032 Luton 920 1.8% 18
E06000034 Thurrock 650 1.7% 17
E07000076 Tendring 430 1.6% 16
E07000145 Great Yarmouth 320 1.6% 16
E07000206 Waveney 340 1.6% 16
E07000069 Castle Point 250 1.5% 15
E06000031 Peterborough 610 1.4% 14
E07000146 King’s Lynn and West Norfolk 360 1.3% 13

The prevalence and characteristics of children growing up with relatives in the UK (Briefing paper 001)
26
Local Authority District Number of children in kinship care
Prevalence of children in kinship care
Number of children in
kinship care per 1000 children
East of England (Contd.)
E07000205 Suffolk Coastal 320 1.3% 13
E07000010 Fenland 230 1.2% 12
E07000075 Rochford 200 1.2% 12
E07000200 Babergh 190 1.2% 12
E07000073 Harlow 200 1.1% 11
E07000102 Three Rivers 200 1.1% 11
E07000147 North Norfolk 180 1.1% 11
E07000202 Ipswich 300 1.1% 11
E06000033 Southend-on-Sea 340 1.0% 10
E06000055 Bedford 320 1.0% 10
E07000008 Cambridge 190 1.0% 10
E07000066 Basildon 390 1.0% 10
E07000067 Braintree 310 1.0% 10
E07000070 Chelmsford 340 1.0% 10
E07000071 Colchester 330 1.0% 10
E07000072 Epping Forest 240 1.0% 10
E07000074 Maldon 120 1.0% 10
E07000099 North Hertfordshire 250 1.0% 10
E07000101 Stevenage 190 1.0% 10
E07000148 Norwich 220 1.0% 10
E06000056 Central Bedfordshire 480 0.9% 9 E07000098 Hertsmere 200 0.9% 9
E07000143 Breckland 220 0.9% 9
E07000149 South Norfolk 230 0.9% 9
E07000204 St Edmundsbury 210 0.9% 9
E07000009 East Cambridgeshire 140 0.8% 8
E07000068 Brentwood 120 0.8% 8
E07000095 Broxbourne 160 0.8% 8
E07000201 Forest Heath 90 0.8% 8
E07000011 Huntingdonshire 250 0.7% 7
E07000096 Dacorum 210 0.7% 7
E07000097 East Hertfordshire 150 0.6% 6
E07000103 Watford 120 0.6% 6
E07000104 Welwyn Hatfield 130 0.6% 6
E07000203 Mid Suffolk 90 0.5% 5
E07000144 Broadland 80 0.4% 4
E07000012 South Cambridgeshire 100 0.3% 3
E07000077 Uttlesford 50 0.3% 3
E07000100 St Albans 90 0.3% 3

The prevalence and characteristics of children growing up with relatives in the UK (Briefing paper 001)
27
Local Authority District Number of children in kinship care
Prevalence of children in kinship care
Number of children in
kinship care per 1000 children
Greater London
E09000005 Brent 1920 2.8% 28
E09000022 Lambeth 1520 2.5% 25
E09000025 Newham 1860 2.5% 25
E09000028 Southwark 1380 2.3% 23
E09000030 Tower Hamlets 1240 2.3% 23
E09000002 Barking and Dagenham 1180 2.2% 22
E09000014 Haringey 1310 2.2% 22
E09000011 Greenwich 1230 2.1% 21
E09000012 Hackney 1120 2.1% 21
E09000023 Lewisham 1290 2.1% 21
E09000031 Waltham Forest 1240 2.1% 21
E09000009 Ealing 1510 2.0% 20
E09000019 Islington 750 2.0% 20
E09000010 Enfield 1380 1.8% 18
E09000008 Croydon 1450 1.7% 17
E09000026 Redbridge 1190 1.7% 17
E09000004 Bexley 850 1.6% 16
E09000033 Westminster and City of London 500 1.5% 15
E09000003 Barnet 1230 1.5% 15
E09000007 Camden 510 1.3% 13
E09000013 Hammersmith and Fulham 420 1.3% 13
E09000018 Hounslow 740 1.3% 13
E09000032 Wandsworth 720 1.3% 13
E09000015 Harrow 660 1.2% 12
E09000017 Hillingdon 670 1.1% 11
E09000020 Kensington and Chelsea 290 1.1% 11
E09000024 Merton 460 1.1% 11 E09000006 Bromley 680 1.0% 10
E09000016 Havering 500 1.0% 10
E09000021 Kingston upon Thames 270 0.8% 8
E09000029 Sutton 320 0.8% 8 E09000027 Richmond upon Thames 230 0.6% 6
South East England
E07000108 Dover 490 2.3% 23
E07000109 Gravesham 470 2.1% 21
E07000112 Shepway 440 2.1% 21
E07000178 Oxford 480 1.8% 18
E06000038 Reading 540 1.7% 17
E07000062 Hastings 320 1.7% 17

The prevalence and characteristics of children growing up with relatives in the UK (Briefing paper 001)
28
Local Authority District Number of children in kinship care
Prevalence of children in kinship care
Number of children in
kinship care per 1000 children
South East England (Contd.)
E06000039 Slough 570 1.6% 16
E07000061 Eastbourne 320 1.6% 16
E06000044 Portsmouth 600 1.5% 15
E06000046 Isle of Wight 370 1.5% 15
E07000107 Dartford 350 1.5% 15
E06000042 Milton Keynes 810 1.4% 14
E07000106 Canterbury 390 1.4% 14
E07000114 Thanet 360 1.4% 14
E06000035 Medway 740 1.3% 13
E07000090 Havant 300 1.3% 13
E07000110 Maidstone 410 1.3% 13
E07000213 Spelthorne 240 1.3% 13
E06000036 Bracknell Forest 290 1.2% 12
E06000045 Southampton 550 1.2% 12
E07000113 Swale 380 1.2% 12
E06000043 Brighton and Hove 520 1.1% 11
E07000063 Lewes 200 1.1% 11
E07000084 Basingstoke and Deane 400 1.1% 11
E07000088 Gosport 200 1.1% 11
E07000209 Guildford 290 1.1% 11
E07000211 Reigate and Banstead 310 1.1% 11
E07000007 Wycombe 370 1.0% 10
E07000086 Eastleigh 250 1.0% 10
E07000105 Ashford 290 1.0% 10
E07000115 Tonbridge and Malling 250 1.0% 10
E07000210 Mole Valley 160 1.0% 10
E07000224 Arun 230 1.0% 10
E07000226 Crawley 230 1.0% 10
E07000227 Horsham 250 1.0% 10
E07000229 Worthing 210 1.0% 10
E07000065 Wealden 270 0.9% 9
E07000092 Rushmoor 200 0.9% 9
E07000093 Test Valley 210 0.9% 9
E07000181 West Oxfordshire 190 0.9% 9
E07000217 Woking 200 0.9% 9
E07000004 Aylesbury Vale 300 0.8% 8
E07000005 Chiltern 160 0.8% 8
E07000006 South Bucks 100 0.8% 8
The prevalence and characteristics of children growing up with relatives in the UK (Briefing paper 001)
29
Local Authority District Number of children in
kinship care
Prevalence of children in
kinship care
Number of children in
kinship care per 1000 children
South East England (Contd.)
E07000087 Fareham 180 0.8% 8
E07000094 Winchester 170 0.8% 8
E07000111 Sevenoaks 180 0.8% 8
E07000177 Cherwell 220 0.8% 8
E07000208 Epsom and Ewell 130 0.8% 8
E07000223 Adur 90 0.8% 8
E06000040 Windsor and Maidenhead 200 0.7% 7
E07000064 Rother 110 0.7% 7
E07000085 East Hampshire 160 0.7% 7
E07000091 New Forest 200 0.7% 7
E07000116 Tunbridge Wells 180 0.7% 7
E07000215 Tandridge 110 0.7% 7
E07000225 Chichester 140 0.7% 7
E06000037 West Berkshire 180 0.6% 6
E06000041 Wokingham 200 0.6% 6
E07000089 Hart 110 0.6% 6
E07000180 Vale of White Horse 150 0.6% 6
E07000212 Runnymede 90 0.6% 6
E07000179 South Oxfordshire 120 0.5% 5
E07000214 Surrey Heath 90 0.5% 5
E07000228 Mid Sussex 140 0.5% 5
E07000207 Elmbridge 90 0.4% 4
E07000216 Waverley 70 0.3% 3
South West England
E06000053 Isles of Scilly x x x
E06000023 Bristol, City of 1720 2.0% 20
E06000027 Torbay 490 2.0% 20
E07000046 Torridge 210 1.7% 17
E07000045 Teignbridge 310 1.4% 14
E07000053 Weymouth and Portland 170 1.4% 14
E06000052 Cornwall 1300 1.3% 13
E07000081 Gloucester 350 1.3% 13
E07000188 Sedgemoor 280 1.3% 13
E06000026 Plymouth 580 1.2% 12
E06000028 Bournemouth 400 1.2% 12
E07000043 North Devon 210 1.2% 12
E07000082 Stroud 270 1.2% 12
E07000187 Mendip 260 1.2% 12

The prevalence and characteristics of children growing up with relatives in the UK (Briefing paper 001)
30
Local Authority District Number of children in
kinship care
Prevalence of children in
kinship care (%)
Number of children in
kinship care per 1000 children
South West England (Contd.)
E07000191 West Somerset 60 1.2% 12
E06000029 Poole 290 1.1% 11
E07000041 Exeter 220 1.1% 11
E07000080 Forest of Dean 150 1.1% 11
E07000190 Taunton Deane 240 1.1% 11
E07000042 Mid Devon 160 1.0% 10
E07000047 West Devon 100 1.0% 10
E07000048 Christchurch 80 1.0% 10
E07000189 South Somerset 320 1.0% 10
E06000024 North Somerset 380 0.9% 9
E06000025 South Gloucestershire 490 0.9% 9
E06000030 Swindon 340 0.8% 8
E06000054 Wiltshire 800 0.8% 8
E07000049 East Dorset 120 0.8% 8
E07000051 Purbeck 60 0.8% 8
E07000052 West Dorset 140 0.8% 8
E07000078 Cheltenham 150 0.8% 8
E06000022 Bath and North East Somerset 200 0.7% 7
E07000079 Cotswold 80 0.6% 6
E07000040 East Devon 120 0.5% 5
E07000050 North Dorset 60 0.5% 5
E07000083 Tewkesbury 80 0.5% 5
E07000044 South Hams 40 0.3% 3
Source: ONS. Estimates calculated from 2011 Census Secure Microdata
NOTE. City of London has been merged with Westminster.
Prevalence rates in red ink indicates that the local authority kinship child population prevalence rate in higher than the national average of 1.4%.
x indicates that there are less the 30 children living in kinship care in the local authority district.

Dinithi Wijedasa
Hadley Centre for Adoption & Foster Care Studies
University of Bristol
+44 (0)117 954 6627
www.bristolkinshipstudy.co.uk