the power of productivity - london school of economics · the key to unlocking the power of...
TRANSCRIPT
1
ThePowerofProductivity
AnAssessmentofUKFirmsandFactorsContributingtoProductivityEnhancement
DrAlexanderGrous
LondonSchoolofEconomicsandPoliticalScience
December,2016
2
Overview...........................................................................................................................31. UKProductivity:MacroEnvironmentandRegionalVariations.................................51.1 WhatisProductivity?............................................................................................51.2 MeasuringProductivityintheUK..........................................................................62. RegionalProductivityintheUK.................................................................................82.1 NUTS-1(Regionalareas/countygroups)LevelProductivityVariation..................82.2 NUTS-2(Singlecounties):RegionalVariation........................................................92.3 NUTS-3(Cities)RegionalProductivity:GettingGranular.....................................112.4 ManufacturingVersusServicesProductivity.......................................................152.5 ComparingRegionsofDifferentSize...................................................................162.6 GrowthinProductivityacrosstheUK:RegionalVariationbyMajorCities.........172.7 UKBusinessDistribution.....................................................................................202.8 Productivity:HowDoestheUKCompare?..........................................................212.9 UKRegionalProductivityVariations:GovernmentInterventionInitiatives........243. FirmSpecificFactors:DefiningGranularProductivityEnhancingOpportunities....274. ManagementPractices:The‘Lever’forFirm-LevelProductivityEnhancement.....274.1 DefiningManagementPractices.........................................................................274.2 EstablishingBestPractices..................................................................................284.3 AddressingManagementPracticestoOptimiseFirm-LevelProductivity...........294.4 WhyDoesManagementMatter?........................................................................324.5 ComplacencyisnotanOption.............................................................................334.6 ManagingforGrowth.........................................................................................345. InformationandCommunicationsTechnology.......................................................355.1 ICTAdoptionFactors...........................................................................................355.3 ChangingSocioeconomicDrivers........................................................................375.4 EnhancingProductivitywithICT..........................................................................385.5 APortfolioofOptions..........................................................................................405.6 MakingtheRightCall...........................................................................................415.6.1 MobileBroadband:Casestudy-PoliceandEmergencyServices...................425.7 ICTandConnectivity:WiderUseandBenefits....................................................436. FlexibleWorkforcePractices...................................................................................446.1 AnEvolvingWorkplace........................................................................................446.2 BenefitsofFlexibleWorkforcePractices.............................................................466.3 AdoptingFlexibleWorkforcePracticeTechnologicalEnablersforProductivity.47Conclusion.......................................................................................................................49

3
OverviewTheUKdisplaysdifferingproductivityacrossregionsandlagsallbutoneG7country.ThispaperreviewsavailableUKproductivitydatatopresentabackdropofproductivityintheUKandagainstG7countriesbeforedepictingoptionstoaddressfirm-levelproductivity.Thedatadepictsvariedproductivityresultswithsomecities,countiesandregionsperformingaboveorbelowtheUKaverage.FollowingthepresentationofavailableregionalUKproductivityresults,subsequentsectionsinthepaperaddresstheopportunitytoimproveresultsatthefirm-level:unlockingthepowerofproductivityrequiresamoregranularassessmentatthelevelofthefirm.Althoughlocalfactorsmayinfluencesomeaspectsofafirm’soperation,ultimately,afirm’smanagementpracticesarethekeyleverdictatingitsperformance,irrespectiveofitslocation.1Figure1depictstheresearchapproachutilisedinthispaper,withmanagementpracticesintegraltoproductivityenhancement,complementedbyinformationandcommunicationstechnology(ICT)andmobiletechnology,andflexibleworkforcepractices.2Beforetheseareexplored,resultsfromacrosstheUKarepresentedtohighlighttheobservedvariabilityinproductivityandthepotentialtoimprovethis.
FosteringUKProductivityEnhancement
UKproductivitydata(ONS)
LSE&McKinseyandCo,Stamford+,ManagementPracticesresearch:20,000
interviews
AdditionalLSEresearch:Productivityenhancing ICTand
Mobility
LSEandadditionalresearch:ChangingWorkforcePatterns
Figure1:Researchschema
Followingthisreview,therolethatmanagementpracticescanplayinfirm-levelproductivityimprovement is presented,drawingonover adecadeof leading researchby the LSEwithMcKinsey&Company,StanfordUniversity,andmorerecentlyotherparticipants, toassessmanagementpracticesusing aunique toolset developedandapplied in 20,000 interviewswith firmmanagers in 35 countries alongwith the analysis of firmaccounts. Results haveconsistently shown a statistically significant correlation between good practices and firmperformance: well-run companies are in general more productive, profitable, and havehigher sales growth than thosewith inferior practices.3Utilising the conclusions reachedfromtheextendedmanagementpracticesstudies,threecomplementarythreadshavebeenincluded as facilitators to increasing a firm’s performance:management practices,whichrepresents thekeyenablingmode; InformationandCommunicationsTechnology (ICT) and
1Bloom,N.,VanReenen,J.(2004).ManagementPractices,Work–LifeBalance,andProductivity:AReviewofSomeRecentEvidence.OxfordReviewofEconomicPolicy.Volume.22(4);pp:457-482.
2Bloom,Netal.(2011).ManagementPracticesAcrossFirmsandCountries.HarvardBusinessReview.Working-Paper12-052.December09.
3VanReenen,Jetal.(2006)ManagementPractices,Work—LifeBalance,andProductivity:AReviewofSomeRecentEvidence.OxfordReviewofEconomicPolicy(Winter)22(4):pp:457-482.
4
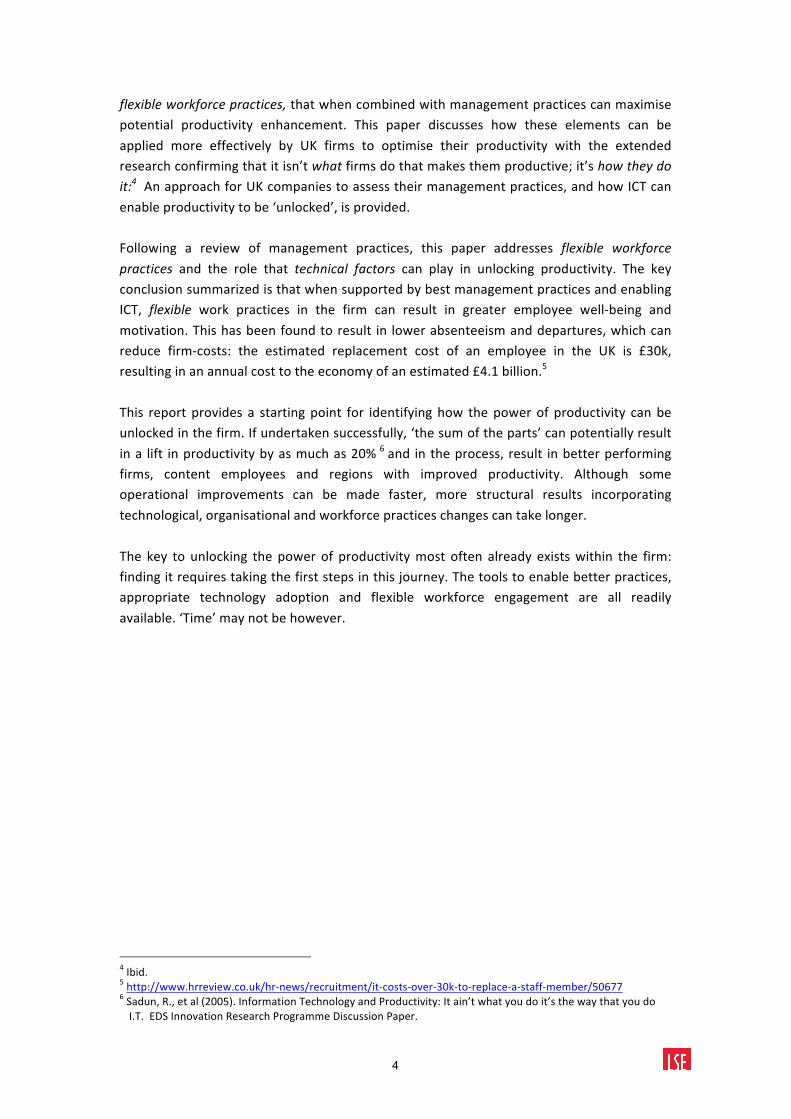
flexibleworkforcepractices,thatwhencombinedwithmanagementpracticescanmaximisepotential productivity enhancement. This paper discusses how these elements can beapplied more effectively by UK firms to optimise their productivity with the extendedresearchconfirmingthatitisn’twhatfirmsdothatmakesthemproductive;it’showtheydoit:4AnapproachforUKcompaniestoassesstheirmanagementpractices,andhowICTcanenableproductivitytobe‘unlocked’,isprovided.Following a review of management practices, this paper addresses flexible workforcepractices and the role that technical factors can play in unlocking productivity. The keyconclusionsummarizedisthatwhensupportedbybestmanagementpracticesandenablingICT, flexible work practices in the firm can result in greater employee well-being andmotivation.Thishasbeenfoundtoresult in lowerabsenteeismanddepartures,whichcanreduce firm-costs: the estimated replacement cost of an employee in the UK is £30k,resultinginanannualcosttotheeconomyofanestimated£4.1billion.5
This report provides a startingpoint for identifyinghow thepowerof productivity canbeunlockedinthefirm.Ifundertakensuccessfully,‘thesumoftheparts’canpotentiallyresultina lift inproductivitybyasmuchas20%6and intheprocess, result inbetterperformingfirms, content employees and regions with improved productivity. Although someoperational improvements can be made faster, more structural results incorporatingtechnological,organisationalandworkforcepracticeschangescantakelonger.The key to unlocking the power of productivitymost often already existswithin the firm:findingitrequirestakingthefirststepsinthisjourney.Thetoolstoenablebetterpractices,appropriate technology adoption and flexible workforce engagement are all readilyavailable.‘Time’maynotbehowever.
4Ibid.5http://www.hrreview.co.uk/hr-news/recruitment/it-costs-over-30k-to-replace-a-staff-member/506776Sadun,R.,etal(2005).InformationTechnologyandProductivity:Itain’twhatyoudoit’sthewaythatyoudoI.T.EDSInnovationResearchProgrammeDiscussionPaper.

5
LabourProductivity(outputperhour)
Output[GrossValueAdded(GVA)]LabourInput[Totalhoursworkedintheeconomy;workers,orjobs]=
=
1. UKProductivity:MacroEnvironmentandRegionalVariations
1.1 WhatisProductivity?
Productivity indicateshowwellresourcesarebeingutilised.7It iscommonlydefinedastheratio of a volumemeasure of output (goods and services) to a volumemeasure of input(labour and capital) used.8Production measures what is produced whilst productivity isconcernedwithhow it isproduced.9Thenotionofproductivity isakeydriverofeconomicgrowthandcompetitiveness10providingessentialperformancemeasurement; internationalcomparisons; the determination of capacity utilisation and living standards, and theforecastingofeconomicgrowth.11Acountry’sability to improve its standardof livingovertimedependslargelyonitsabilitytoraiseitsoutputperworker.12Labour productivity is one of themost widely usedmodes of productivitymeasurement.With labour costs comprising around two-thirds of the overall cost of production of UKeconomicoutput,thismeasureisanimportantindicatorofeconomicperformance.13Labourproductivitymeasuresoutput,asexpressedintermsofGrossDomesticProduct(GDP)GrossValue Added (GVA) (also known as ‘whole economy output’)14divided by labour inputs,utilisinghoursworkedoremploymentlevel.15GVAiscalculatedusingtheincomeapproach,andrepresentsthetotalvalueofgoodsandservicesproduced,minusthecostofproducingthose goods and services: it is a key component of GDP, reflecting the output of theeconomy.16Attheoverarchinglevel,labourproductivitycanbeexpressedinequationform:
Figure2:Labourproductivityequation17
NumerousproductivityindicatorsarecompiledintheUKbytheOfficeforNationalStatistics(ONS)acrossthethreemajorsectorsofProduction,ManufacturingandServices.Theseincludeoutputperworker,outputperjobandhourworked,andGVAperjobfilled
7Koch,M.J.,andandMcGrath,R.G.(1996)ImprovingLaborProductivity:HumanResourceManagementPoliciesdoMatter.StrategicManagementJournal.Vol.17,No.5(May);pp.335-354.
8OECD(2001).Measuringproductivity:OECDManual.Measurementofaggregateandindustrylevelgrowthhttps://www.oecd.org/std/productivity-stats/2352458.pdf
9Coelli,T.J,etal(2005)AnIntroductiontoEfficiencyandProductivityAnalysis.Springer.10Ibid.11McCann,P.(2016).TheUKRegional–NationalEconomicProblem:Geography,globalizationandgovernance.Routledge.
12HouseofCommons(2016).ProductivityintheUK.BriefingPaperNo06492,May.13ONS.StatisticalBulletin:LabourproductivityQ22015.http://www.ons.gov.uk/employmentandlabourmarket/peopleinwork/labourproductivity/bulletins/labourproductivity/2015-10-01
14https://www.ons.gov.uk/employmentandlabourmarket/peopleinwork/labourproductivity/bulletins/labourproductivity/jantomar2016
15Ibid.16DepartmentforBusinessInnovationandSkills(BIS)(2012).CommentaryonRegionalEconomicPerformanceIndicators.September.https://www.gov.uk/government/uploads/system/uploads/attachment_data/file/16338/12-p162-commentary-on-regional-economic-performance-indicators.pdf
17ONSStatisticalBulletin.RegionalGrossValueAdded(IncomeApproach):December2015.http://www.ons.gov.uk/economy/grossvalueaddedgva/bulletins/regionalgrossvalueaddedincomeapproach/december2015

6
GrossValueAdded(GVA)
OutputSectorsAreasNUTS:TheEconomy,Regions,City
Production
Manufacturing
Services
Outputperworker
Outputperjob
Outputperhour
Unitlabourcosts
Unitwagecosts
NominalGVAperfilledjob
NominalGVAperhourworked
NUTS-0 Country Level
NUTS-1 Group ofcounties/regions
NUTS-2 Singlecounty/region
NUTS-3 City
decreasing
pop
ulationsize
Costs
Productivity
andperhourworked.Unitlabourcostsarealsocollatedasamarkerofinflationarypressuresintheeconomy.18Figure3depictstheselabourproductivityindicators.
Figure3:MajorproductivitycategoriesforregionalUKcomparison
GVAperhourworkedorGVAperjobfilledarethemostrelevantindicatorswhenassessingregionaleconomicperformance.Ofthesemeasures,GVAperhourworkedisrecommendedasittakesintoconsiderationregionallabourmarketstructuresanddifferentworkingpatterns,suchasthemixofpart-timeandfull-timeworkers,homeworkersandjobshares.19ThisreportutilisesthesetwomeasuresandotherstooutlineproductivityintheUK.
1.2 MeasuringProductivityintheUK
Productivity indicators in the UK are compiled by the ONS using the Nomenclature ofTerritorial Units for Statistics (NUTS) and adopted throughout the EU since 2015.20Thisdivides a country into NUTS segments, with population criteria defining the size of each.Foursegmentsareutilisedcommencingatthemacroeconomiclevel,denotedbyNUTS-0,toNUTS-3, reflecting an individual city,withproductivitydata compiled for eachof thesebytheONSasdepictedinFigure4.
Figure4:NUTSsegmentationforproductivitydata(Source:ONS)21
ThirteenNUTS-1,2241NUTS-2and169NUTS-323areasexistfortheUK.The13NUTS-1areasaredepictedinTable1.
18ONSStatisticalBulletin.LabourProductivity:JantoMar2016.http://www.ons.gov.uk/employmentandlabourmarket/peopleinwork/labourproductivity/bulletins/labourproductivity/jantomar2016
19ONS.2016.AReviewofRegionalandSub-RegionalProductivityStatistics.https://www.ons.gov.uk/employmentandlabourmarket/peopleinwork/labourproductivity/articles/areviewofregionalandsubregionalproductivitystatistics/2016-04-06#note-on-gva-per-head
20https://www.destatis.de/Europa/EN/Methods/Classifications/OverviewClassification_NUTS.html21Ibid

7
Perhourworked
AverageUKGVA:
Perjobfilled
Otherindicators
BaseProductivity Base
Productivity
EnhancedProductivity
Table1:NUTS-1areasintheUK(Source:ONS)24
Table2providesanexampleofaNUTS-1areacascadedintoNUTS-2andNUTS-3areasasappliedbytheONStodefineregionalproductivityintheUK.
NUTS-CodesRegion NUTSlevel CodeUnitedKingdom NUTS-0 UKYorkshireandtheHumber NUTS-1 UKEWestYorkshire NUTS-2 UKE4Leeds NUTS-3 UKE42
Table2:ExampleofNUTSclassificationintheUK(Source:ONS)25
ThisresearchexaminesNUTS-1-3categoriesfromtheONStopresentregionalproductivityintheUK,asdepictedinthemethodologyinfigure3andsummarisedbelowinFigure5.
Figure5:Regionalproductivityandenhancementmodes
22ONSDataset:LabourProductivity:Tables1-10andR1.https://www.ons.gov.uk/file?uri=/employmentandlabourmarket/peopleinwork/labourproductivity/datasets/labourproductivitytables110andr1/current/lprod01q12016unlinked.xls
23SubregionalProductivity:LabourProductivity(GVAperhourworkedandGVAperfilledjob)indicesbyUKNUTS2andNUTS3subregions.https://www.ons.gov.uk/employmentandlabourmarket/peopleinwork/labourproductivity/datasets/subregionalproductivitylabourproductivitygvaperhourworkedandgvaperfilledjobindicesbyuknuts2andnuts3subregions
24ONSDataset:LabourProductivity.Opcit.25Ibid.
NorthEastNorthWest
YorkshireandtheHumberEastMidlandsWestMidlandsEastofEngland
LondonSouthEastSouthWestEnglandWales
ScotlandNorthernIreland
Others
BestManagementpractices
ICTuse
Workpattern
+
+
+
Enhancingmodes
Regionalproductivity

8
RegionalproductivitydataformthebasisfortheconsolidationofLSEresearchandotherresearchonproductivityoptimisation.2. RegionalProductivityintheUK
2.1 NUTS-1(Regionalareas/countygroups)LevelProductivityVariationTheUKdisplaysregionalvariationsinproductivity.26AttheNUTS-1level(groupofcounties),thisvariationisevidentwhenreviewingGVAperjobfilledandperhour,aspresentedinGraph1forthemostrecentlyavailabledatain2014.
Graph1:LabourproductivitybyNUTS1regionorcountry,2014
Source:ONS27GVAhoursperfilledjobandperhourworkedin2014werehigherthantheUKaverageinLondon(30%higher)andtheSouthEast(9%higher)andlowerthantheUKaverageinotherareas.28InWalesandNorthernIrelandproductivitywas17%and19%belowtheUKaveragerespectively,whilstinScotland,productivitywas2%belowtheUKaverage.Theremainingregionshadproductivitylevelsbetween9to13%belowtheUKaverage.29Theresultsarerelativelyconstantovertime,withGraph2depictingproductivityoveraseven-yearperiodfrom2007-2014forthemostproductiveregions.
26Ibid.27ONS.AReviewofRegionalandSub-RegionalProductivityStatistics.April2016.https://www.ons.gov.uk/employmentandlabourmarket/peopleinwork/labourproductivity/articles/areviewofregionalandsubregionalproductivitystatistics/2016-04-06#local-enterprise-partnerships-and-city-regions
28Ibid.29Ibid.

9
Graph2:UKNUTS1regionsandcountrieswithhighestGVAperhourworked,1997to2014Source:ONS30
ThehigherproductivitygrowthofLondonwasdrivenbya38%increaseinproductivityhours,withitsshareofUKGVAincreasingfrom18.9%to22.5%from1997to2014.31
2.2 NUTS-2(Singlecounties):RegionalVariation
AllfiveNUTS-2regionsintheGreaterLondonareawereamongthe10mostproductiveintheUKintermsofGVAperhourworked,withproductivitylevelsabovetheUKaverage.InnerLondonEastshowedthehighestproductivitylevel,withaGVAperhourworkedaround38%higherthantheUKaverage.ThiswasfollowedbyInnerLondonWestwithamarginallysmallerproductivitylevel.OnlytwootherregionsachievedGVAperhourworkedabovetheUKaveragebetween1997-2014:EastofEnglandandtheSouthEast.ThevariationbetweenareascanbereviewedattheNUTS-2level.Graph3reflectstheGVAperhourworkedforthetop10areasinNUTS-2.
Graph3:GVAperhourworked-highestrankingUKNUTS2sub-regions,2014Source:ONS32
30ONS.AReviewofRegionalandSub-RegionalProductivityStatistics.April2016.https://www.ons.gov.uk/employmentandlabourmarket/peopleinwork/labourproductivity/articles/areviewofregionalandsubregionalproductivitystatistics/2016-04-06#local-enterprise-partnerships-and-city-regions
31Ibid.

10
Incontrast,Graph4depictsthe10NUTS-2areaswiththelowestproductivitywiththisrangingfrom12%to20%lowerthanthenationalaverage.
Graph4:GVAperhourworked-lowestrankingUKNUTS2sub-regions,2014Source:ONS33
Althoughthelowerrankedareasarepredominantlylocatedinruralareas,urbanareasarerepresentedincludingSouthYorkshireandWestMidlands.SelectedcitiesacrosstheNUTSsubregionsreinforcethedisparateproductivitypicturefortheUK,asdepictedinGraph5.
Graph5:GVAperhourworked–SelectedCities2014
Source:ONS3432ONS.AReviewofRegionalandSub-RegionalProductivityStatistics.April2016.https://www.ons.gov.uk/employmentandlabourmarket/peopleinwork/labourproductivity/articles/areviewofregionalandsubregionalproductivitystatistics/2016-04-06#local-enterprise-partnerships-and-city-regions
33ONS.AReviewofRegionalandSub-RegionalProductivityStatistics.April2016.https://www.ons.gov.uk/employmentandlabourmarket/peopleinwork/labourproductivity/articles/areviewofregionalandsubregionalproductivitystatistics/2016-04-06#local-enterprise-partnerships-and-city-regions

11
LondonexhibitsthehighestlabourproductivityintheUK,at30%abovethenationalaveragein2014,followedbyAberdeenwith17%higherthanthenationalaverageandBristolataroundthenationalaverage.Othermajorcitiesdisplaylabourproductivity7-14%lowerthanthenationalaverage.2.3 NUTS-3(Cities)RegionalProductivity:GettingGranularProductivitymeasuresatthemostgranularlevelarerepresentedbyNUTS-3measures,withnominalGVAperhourworkedutilisedbytheONSforEngland,ScotlandandWales.ForEngland,4regionsareassessed:GreaterLondon,SouthofEngland,Midlands,NorthofEngland.Graph6depictstheproductivityforLondon,withallsubregionsdisplayingproductivitylevelsabovetheUKaverage.ThemostproductivesubregionwasTowerHamlets(whichincorporatestheCanaryWharffinancialdistrict),followedbyCamdenandtheCityofLondon,withproductivitylevelsof85%and43%abovetheUKaveragerespectively,withthesetwosubregionsthemostproductiveintheUK.Fromthetotal168NUTS-3subregions,48hadaGVAperhourworkedabovetheUKaverage,withjustunder50%ofthisnumberlocatedinLondon.
Graph6:NUTS-3GVAperhourworkedLondon
Source:ONS35
34ONS.Sub-RegionalProductivityMarch2016.http://www.ons.gov.uk/employmentandlabourmarket/peopleinwork/labourproductivity/articles/subregionalprodutivity/march2016
35ONS.Sub-RegionalProductivityMarch2016.http://www.ons.gov.uk/employmentandlabourmarket/peopleinwork/labourproductivity/articles/subregionalproductivity/march2016
12
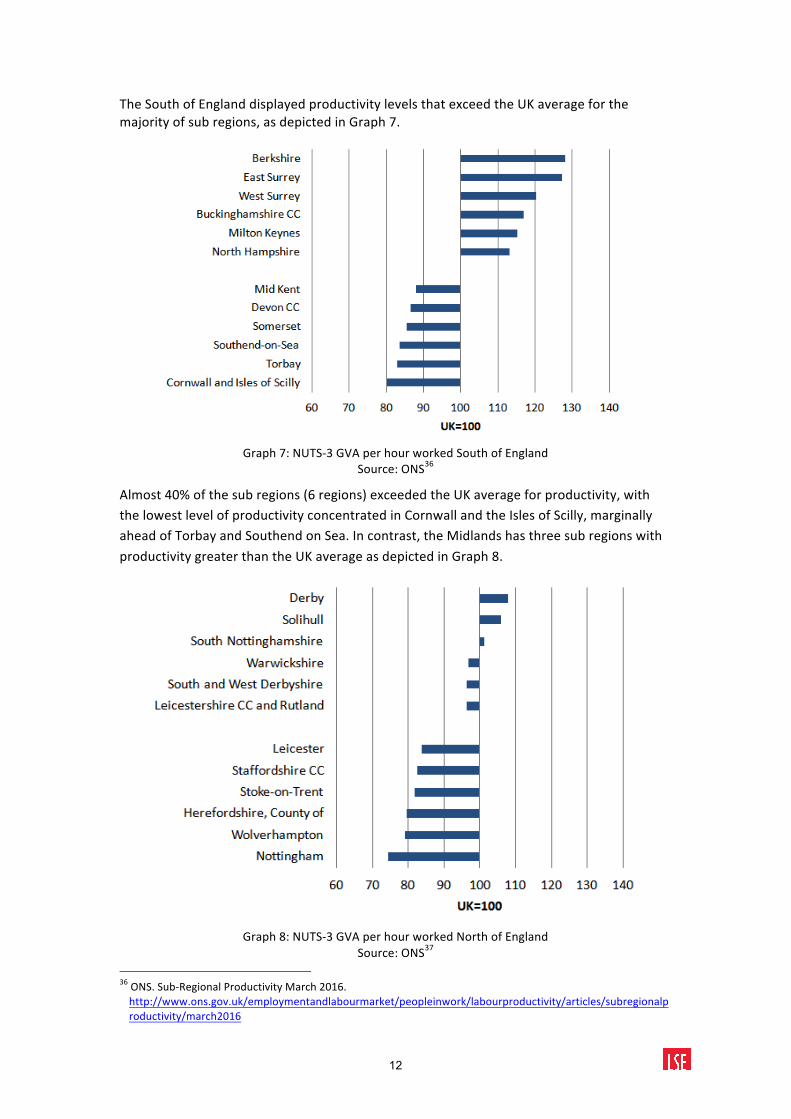
TheSouthofEnglanddisplayedproductivitylevelsthatexceedtheUKaverageforthemajorityofsubregions,asdepictedinGraph7.
Graph7:NUTS-3GVAperhourworkedSouthofEngland
Source:ONS36
Almost40%ofthesubregions(6regions)exceededtheUKaverageforproductivity,withthelowestlevelofproductivityconcentratedinCornwallandtheIslesofScilly,marginallyaheadofTorbayandSouthendonSea.Incontrast,theMidlandshasthreesubregionswithproductivitygreaterthantheUKaverageasdepictedinGraph8.
Graph8:NUTS-3GVAperhourworkedNorthofEngland
Source:ONS3736ONS.Sub-RegionalProductivityMarch2016.http://www.ons.gov.uk/employmentandlabourmarket/peopleinwork/labourproductivity/articles/subregionalproductivity/march2016

13
OnlythreesubregionsdisplayproductivityabovetheUKaverage:Derby,SolihullandSouthNottinghamshire,at8%,6%and2%respectively.Thedistributionofsubregionsregisteringproductivityofbetween25%lowerthantheUKaveragewassimilartothedistributionfortheSouthofEngland.AmarginallyhigherproportiondepictedalowerproductivitythantheSouthofEngland.ThistrendwasalsomirroredintheproductivityofScotland,withonlythreesubregionsdisplayingproductivityabovetheUKaverageforAberdeenCityandAberdeenshire,EdinburghandSouthAyrshireof17%,5%and3%respectively.Graph9depictsthisdistribution.
Graph9:NUTS-3GVAperhourworkedNorthofScotland
Source:ONS38
IncontrasttoallotherNUTS-3regions,WalesdepictsproductivitylowerthantheUKaverageforallsubregions,rangingfrom8%lowerfortheCentralValleyto33%lowerforPowys,asdisplayedinGraph10.
37ONS.Sub-RegionalProductivityMarch2016.http://www.ons.gov.uk/employmentandlabourmarket/peopleinwork/labourproductivity/articles/subregionalproductivity/march2016
38ONS.Sub-RegionalProductivityMarch2016.http://www.ons.gov.uk/employmentandlabourmarket/peopleinwork/labourproductivity/articles/subregionalproductivity/march2016

14
Graph10:NUTS-3GVAperhourworkedNorthofWales.
Source:ONS39
ThefinalNUTS-3regiontobecomparedisNorthernIreland,withthisareadisplayingasimilartrendtoWales:allsub-regionsdisplayedproductivitylevelslowerthantheUKaverage,asdepictedinGraph11.
Graph11:NUTS-3GVAperjobfilledIreland.
Source:ONS40
ThemostproductiveregioninNorthernIrelandwasBelfast,whichdisplayedproductivitylevelsof8%lowerthantheUKaverage,increasingto20%lowerfortheNorthofNorthernIreland.AcomparisonoftheNUTS-3regionsindicatestherelativedifferencesinproductivitybetweenregionalareasforsubregionsaboveandbelowtheUKproductivityaverage,asdisplayedinGraph12.
39ONS.Sub-RegionalProductivityMarch2016.http://www.ons.gov.uk/employmentandlabourmarket/peopleinwork/labourproductivity/articles/subregionalproductivity/march2016
40ONS.Sub-RegionalProductivityMarch2016.http://www.ons.gov.uk/employmentandlabourmarket/peopleinwork/labourproductivity/articles/subregionalproductivity/march2016

15
Graph12:NUTS-3GVAperhourworkedcomparison:aboveandbelowUKaverageSource:ResearchTeamconsolidationofdatafromONS41
2.4 ManufacturingVersusServicesProductivity
Atanaggregatelevel,UKproductivityvariesbetweenManufacturingandServices.NUTS-3providesblendeddatafrombothareasforGVA,hoursworkedandemployment(‘jobs’).Inthecaseofmanufacturingproductivity,Graph13depictstheinitialdeclineinproductivitybetween2008and2009.ThissituationhadreversedbyQ22011,whenallsub-industriesdisplayedpositiveresultsandproductivitywas6.6%higherthaninQ12008.A‘see-saw’hasbeenobservedsincemid-2011however,withrisesandfallsobserved,withthelatestdatain2016indicatingariseinmanufacturingjobsandGVA.
Graph13:Manufacturingproductivitymeasures
Source:ONS42
ThesamecriteriaareutilisedtodefineproductivityforServices,depictedinGraph14.41https://www.ons.gov.uk/methodology/geography/ukgeographies/eurostat#relationship-of-nuts-areas-to-uk-administrative-geographies
42https://www.ons.gov.uk/employmentandlabourmarket/peopleinwork/labourproductivity/bulletins/labourproductivity/aprtojune2016#manufacturing-labour-productivity-measures

16
Graph14:Servicesproductivitymeasures
Source:ONS43
ProductivityhasimprovedinServicesacrossallthreeindicators,althoughtheseinitiallytrendeddownwardsbetween2008-2009,beforepickingupinQ3.In2015,growthoccurredintheseandeightofthe11serviceindustriestheGovernmentutilisesfor‘Servicesproductivity’,withanoverallupturnoccurring.
2.5 ComparingRegionsofDifferentSize
GVAperheadprovidesacomparisonofresultsbasedonpopulation.ItdividesGVAinmillions(£)bythepopulationofaregiontogiveGVAperheadinpounds.ThisprovidesamodeforcomparingregionsofdifferentsizesbutisnotameasureofregionalproductivityasthismethodutilisestheentirepopulationtoderiveGVAperhead,includingsegmentsofthepopulationwhoarenoteconomicallyactive.GVAperheadprovidesanadditionalmeansofcomparingregionsofdifferentsize.Map1depictstheUKNUTS-1GVAperregionassegmentedbytheONS.RegionsindarkercolourindicatehigherGVAperhead,withLondonindicatingthehighestshareofGVAperhead,atover22%,followedbytheSouthEastatalmost15%,andthelowestsharefromNorthernIrelandatjustover2%.44
Map1:RegionalGVAperheadbyNUTS12013(Source:ONS45)
43https://www.ons.gov.uk/employmentandlabourmarket/peopleinwork/labourproductivity/bulletins/labourproductivity/aprtojune2016#manufacturing-labour-productivity-measures
44RegionalGrossValueAdded(IncomeApproach):December2015

17
ThemapindicatesthataconcentrationofhigherGVAperheadexistsintheSouth,withthisdecreasinginsomeNorthernareas.KeyregionalGVAperheadindicatorsare:
• London’sGVAperheadwas£42,666in2014:thehighestintheUK.• Wales’GVAperheadwas£17.573:thelowestintheUK.• GreaterLondondisplayedthehighestGVAperheadgrowthrates,at7.4%.• OnlyoneUKregiondisplayedadecreaseinGVAperheadin2014:CornwallandIsles
ofScillywith0.1%fall.
Graph15summarisestheproportionofGVAperheadbyregionoftheUKtotal.
Graph15:NUTS1percentageshareofUKGVA,2013
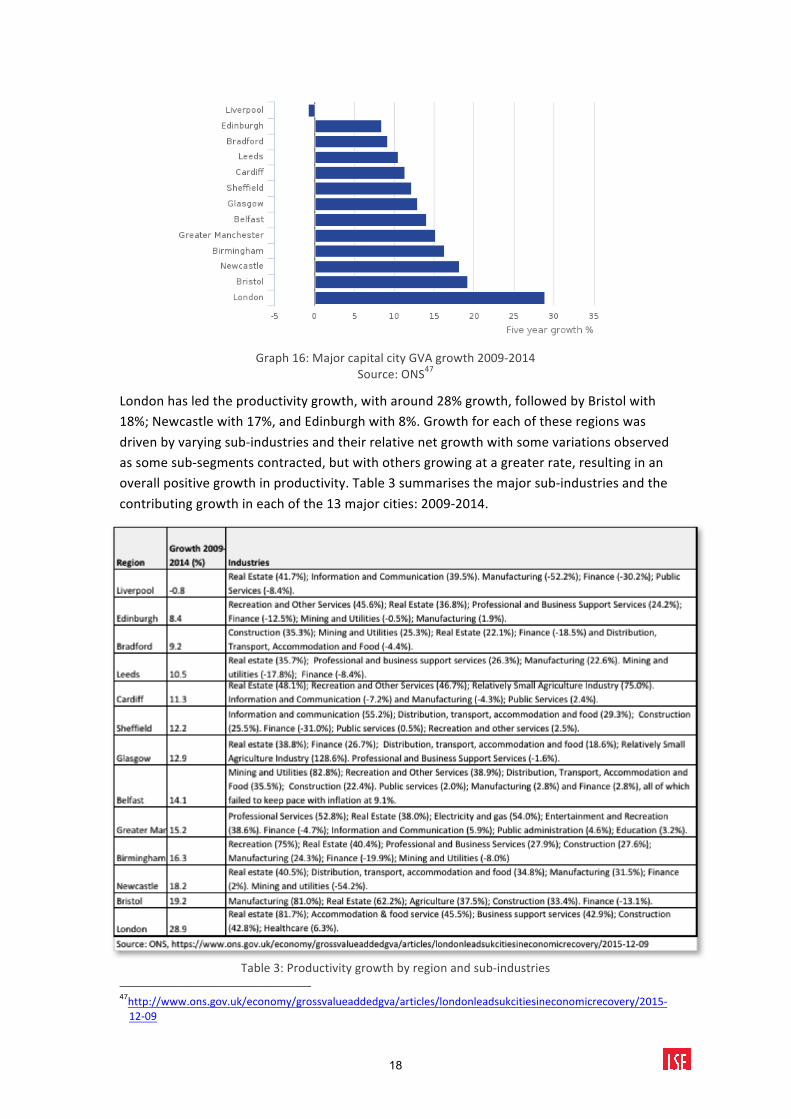
Source:ONS462.6 GrowthinProductivityacrosstheUK:RegionalVariationbyMajorCitiesProductivitychangehasshownamixedpictureacrosstheUK.Between2009-2014totalGVAgrewforallmajorcapitalcitiesexceptforLiverpool.Graph16depictsthetotalGVAfor13majorcapitalcitiesacrossUKregions.
45ONS(2014):RegionalGrossValueAdded.http://www.ons.gov.uk/economy/grossvalueaddedgva/bulletins/regionalgrossvalueaddedincomeapproach/2014-12-10
46Ibid
18
Graph16:MajorcapitalcityGVAgrowth2009-2014
Source:ONS47
Londonhasledtheproductivitygrowth,witharound28%growth,followedbyBristolwith18%;Newcastlewith17%,andEdinburghwith8%.Growthforeachoftheseregionswasdrivenbyvaryingsub-industriesandtheirrelativenetgrowthwithsomevariationsobservedassomesub-segmentscontracted,butwithothersgrowingatagreaterrate,resultinginanoverallpositivegrowthinproductivity.Table3summarisesthemajorsub-industriesandthecontributinggrowthineachofthe13majorcities:2009-2014.
5
Table3:Productivitygrowthbyregionandsub-industries47http://www.ons.gov.uk/economy/grossvalueaddedgva/articles/londonleadsukcitiesineconomicrecovery/2015-12-09
19
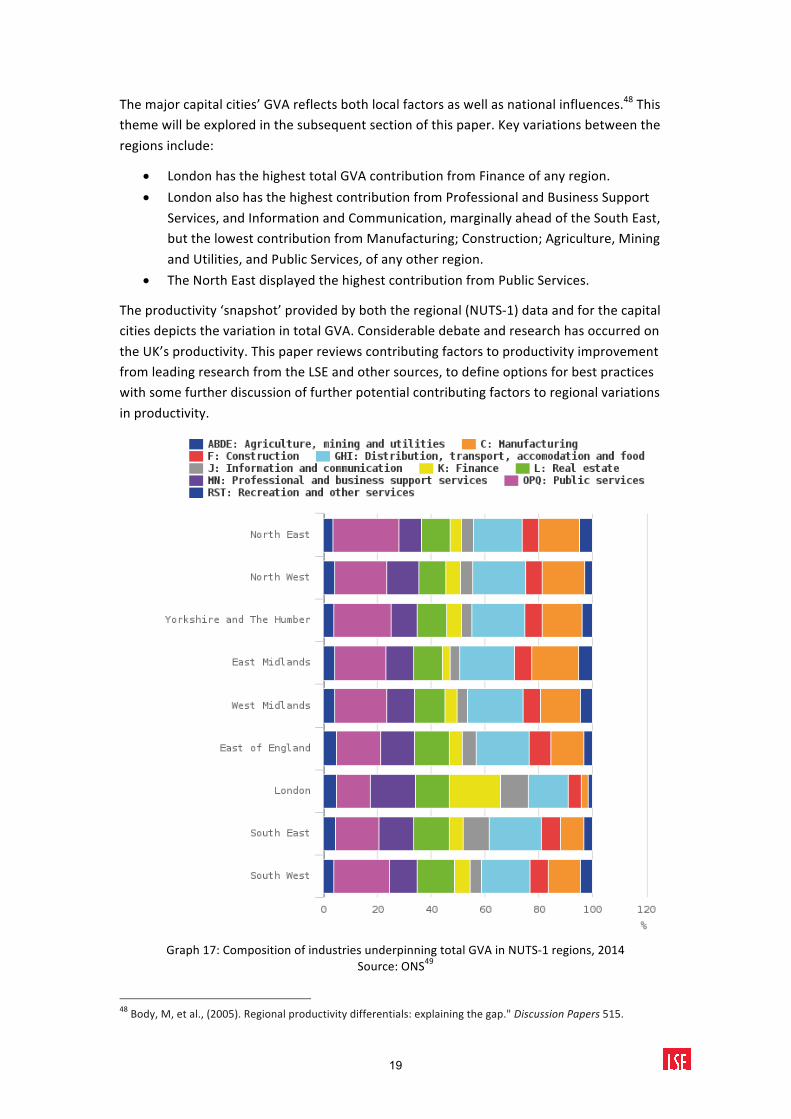
Themajorcapitalcities’GVAreflectsbothlocalfactorsaswellasnationalinfluences.48Thisthemewillbeexploredinthesubsequentsectionofthispaper.Keyvariationsbetweentheregionsinclude:
• LondonhasthehighesttotalGVAcontributionfromFinanceofanyregion.• LondonalsohasthehighestcontributionfromProfessionalandBusinessSupport
Services,andInformationandCommunication,marginallyaheadoftheSouthEast,butthelowestcontributionfromManufacturing;Construction;Agriculture,MiningandUtilities,andPublicServices,ofanyotherregion.
• TheNorthEastdisplayedthehighestcontributionfromPublicServices.
Theproductivity‘snapshot’providedbyboththeregional(NUTS-1)dataandforthecapitalcitiesdepictsthevariationintotalGVA.ConsiderabledebateandresearchhasoccurredontheUK’sproductivity.ThispaperreviewscontributingfactorstoproductivityimprovementfromleadingresearchfromtheLSEandothersources,todefineoptionsforbestpracticeswithsomefurtherdiscussionoffurtherpotentialcontributingfactorstoregionalvariationsinproductivity.
Graph17:CompositionofindustriesunderpinningtotalGVAinNUTS-1regions,2014
Source:ONS49
48Body,M,etal.,(2005).Regionalproductivitydifferentials:explainingthegap."DiscussionPapers515.

20
2.7 UKBusinessDistributionz
Smalltomediumenterprises(SMEs)accountfor99.3%ofallprivatesectorbusinesses;employ15.6millionpeople(60%ofallprivatesectoremployment),andgenerate£1.8trillioninrevenues(47%ofallprivatesectorrevenues).50Incontrast,MediumUKbusinesscomprise0.6%ofthetotalnumberofbusiness,andLargefirms0.1%,buttheyaccountfor12and40%oftotalemploymentrespectively,and14and53%oftotalturnover.51Graph18depictsUKbusinessesperheadofpopulationshowingtheunevendistributionacrossterritories.Londoncontainsthehighestdensityat1,464businessesper10,000residents,versus679businessesintheNorthEast,thelowestdensity.
Graph18:Numberofbusinessesper10,000residentadults,2016Source:HouseofCommonsBriefingPaperNo06152,26October2016.
Graph19depictsthedistributionofpercapitabusinessesagainsttheabsolutenumber.2
Graph19.NumberofbusinessesandbusinessdensityrateintheprivatesectorbyEnglishregionandUKcountry(beginningof2015)
Source:DepartmentofBusinessInnovationandSkills.StatisticalRelease.BusinessPopulationEstimates2015.5249ONS,(2015).StatisticalBulletin.GrossValueAddedIncomeApproach,December.50https://www.gov.uk/government/uploads/system/uploads/attachment_data/file/467443/bpe_2015_statistical_release.pdf
51Ibid.52Ibid.

21
ThedistributionoffirmsisskewedtoLondonandtheSouthEast;followedbyagroupcomprisingtheNorth,SouthandEastofEngland;afurthergroupcomprisingWestMidlands,YorkshireandtheHumberandEastMidlands,andtheNorthEast.Severalobservationscanbemadefromtheregionalproductivityresults:(i)lowerproductivitywasobservedinmanyoftheregionswithlowerbusinessdensity(GVAperhourworked)andviceversa;(ii)manyoftheseregionsdisplaylowerproximityto‘economicmass’.Thereisapotentialtoenhanceproductivitythroughreducedjourneytimes:
1. Estimatesindicatethata10%reductioninaveragejourneytimesthroughouttheUKcouldraiseproductivityby1.12%.53
2. Thisrangesfromamaximumof2.22fortheEastofEngland;1.73%forWestMidlands;1.66%forEastMidlands;1.57%forWales;1.55%forScotland;1.45%forYorkshireandHumberside.
IncontrastLondonwouldbenefitbyanestimatedmaximum1.08%reflectingitsalreadyhighdensity.Thebenefitisgreatestwhereaccesstocitiesincreasesthemost.54Thisraisessocioeconomicconsiderationsforlongterminfrastructureandtransportinvestment.
2.8 Productivity:HowDoestheUKCompare?
Theglobalbankingcrisisof2008precipitatedwhathasbecomeknownasthe‘GreatRecession’acrossdevelopedcountries.TheUK’stwodecadesofconsistenteconomicgrowthleadinguptothiseventwereextinguishedalmost‘instantly’,withoutputperhourstaying0.4%belowthepre-recessionlevelof2007.55LabourproductivityintheUKwas15-16%lowerthanwhereitwouldhavebeenhadtherecessionnotoccurred,equatingtoaproductivitygapofaround6%fortherestoftheG7countries:Canada,France,Germany,GreatBritain,Italy,Japan,andtheUnitedStates.56Bothoutputperhourandoutputperworkerhavenotshownsignificantimprovementsince2007,incontrasttotheUS,wheretheyhavegrownandarearound7%higherthanin2007.57Onlyonethirdofthevariationinlabourproductivityissuggestedasbeingattributabletothereallocationoffactorsofproductiontomoreproductivesectors,executedthroughthemovementoflabourandtheentryandexitoffirms.58
UKfirmsshowahighersensitivitytotheavailabilityoffinancethanfirmsinmanyotherEuropeancountries:59Anincreasedcostoffinancecanleadtothesubstitutionoflabourforcapital,drivingreducedlabourproductivitygrowth.Althoughthisisacontributingfactortolowerproductivity,itisnottheprimaryreasonforthis.Firmbehaviourhasbeenidentifiedastheprimaryfactorincontributingtolowerproductivityaftertherecession.60Post-
53Rice,P.,andVenables,T.,(2004)opcit.54Ibid.55Bryson,A.,andForth,J.,(2015).TheUK’sProductivityPuzzle.OccasionalPaper45.CentreforEconomicPerformance.LondonSchoolofEconomicsandPoliticalScience.
56Ibid.57OfficeforNationalStatistics(ONS).(2015).InternationalComparisonsofProductivity:FinalEstimates,2013.ONSStatisticalBulletin.February.
58Bryson,A.,andForth,J(2015).Opcit.59Bond,S.,etal.(2003).FinancialFactorsandInvestmentinBelgium,France,GermanyandtheUnitedKingdom:AComparisonUsingCompanyPanelData.ReviewofEconomicandStatistics.Vol.85;pp.153-165.
60Riley,R.,etal.(2014).TheFinancialCrisis,BankLendingandUKProductivity:SectoralandFirm-levelEvidence.NationalInstituteEconomicReview.No.228:R17-R34.

22
recession‘cleansing’(theentryandexitoffirms)hasalsonotbeenfoundtobeaprimarycontributingfactortolowerproductivity:61EvidencefromJapanindicatesthatwithin-firmfactorsweretheprimarycauseforweakproductivitygrowthversusanabsenceofthecleansingeffectsofrecession.Graph20providesacomparisonofproductivitymeasuredbyGDPperhoursworkedacrossG7countries.
Graph20ComparisonofGDPperhourworkedbetweentheUKandotherG7countriesSource:ONS62
TheUKillustrateslowerproductivitythanallcountriesexceptforJapan.ItlagsGermanyby36%,andtheUSandFrancebyaround30%.Itisalso10%lowerthanItalyand4%lowerthanCanada.Graph21providesfurtherdataonthevaryinghoursworkedbetweencountries.
61Griffin,N.,andOdaki,K.(2009).ReallocationandproductivitygrowthinJapan:Revisitingthelostdecadeofthe1990s.JournalofProductivityAnalysis.V3;pp:125-136.
62ONS.InternationalComparisonsofProductivity-FinalEstimates:2014.http://www.ons.gov.uk/economy/economicoutputandproductivity/productivitymeasures/bulletins/internationalcomparisonsofproductivityfinalestimates/2014

23
Graph21:ComparisonofaverageweeklyhoursworkedperG7countrySource:ONS63
In2014,USworkersworkedthemosthoursperweek,followedbyJapan,Canada,andtheUK.Anoveralldownwardstrendcanbeobservedacrosscountriesforhoursworked,withtheUKdisplayingamarginalrise.ComparedwiththeG7theUK:64
• hasthesecondlowestGDPperhourworked;• rankssecondlowestforproductivitygrowthsince2007;• lagsinproductivitycomparedwiththeeconomiesoftheUS,Germany,Franceand
Italyinallsub-sectorsandparticularlyinmanufacturing;• lagstheproductivityofFrance,ItalyandtheUSinfinancialservices;• lagsininoutputperhourbehindFrance,GermanyandtheUSforprivatenon-
financialservices.
An assessmentof firm-specific factors canprovide insight into elements that can improveproductivity,with threeareas that could contribute to this: (1)managementpractices; (2)useoftechnology;(3)flexibleworkforcepractices.65Inaddition,researchhasindicatedthatsome other contributing factors could also exist such as firm-location, but ultimately, afirm’smanagementpracticesarethekeylevertoimprovingproductivity.66Thesefactorswillbe reviewed in this paper to identify areas that have the potential to improve a firm’sproductivity.Researchhas indicated thatwell-run firmsperformbetter irrespectivewheretheyarelocated.67
63Ibid.64Ibid.65Bloom,N.,andVanReenen,N.(2007).MeasuringandExplainingManagementpracticesacrossfirmsandnations.QuarterlyJournalofEconomics.Vol:122(4);pp:1351-1408.
66Rice,P.,andVenables,A.J.,(2004).SpatialDeterminantsofProductivity:AnalysisfortheRegionsofGreatBritain.CEPDiscussionPaperNo642.CentreforEconomicPerformance.LondonSchoolofEconomicsandPoliticalScience.
67Bloometal,(2007).Opcit.

24
2.9 UKRegionalProductivityVariations:GovernmentInterventionInitiatives
TheUK’sdisparateproductivityperformancebetweenregionshasbeenreviewedinUKParliament68andbeenthesubjectofGovernmentplanstoaddress.69Tostimulateproductivityandattempttocreateamorebalancedscenario,15productivity-enhancinginitiativeshavebeendefinedforthelongtermaswellasthenearterm(‘dynamic’):70
Longterminvestment:
(1) Cuttingcorporationtaxto18%by2020(2) Investmentandsavingsincentivestostimulatebusinessinvestment(3) UpgradeUKskills,whichhavebeenidentifiedasanareaofweaknessand
impedimenttoproductivity(seebelow)(4) Improvingaccesstouniversitiestoenhanceskillsandprovidinggreateropportunity
forinstitutionstodefinefeesandothervariables(5) Addressingthetransportsystemwithadditionalinvestmentininfrastructureand
theappointmentofadditionalindividualstooverseeareas(6) Createinvestmentopportunitiesforlowcarbon-energyandreviewbusinessand
consumerenergybills(7) Continueexpansionofdigitalinfrastructurewithimprovedspeedstotheconsumer
andforbusinessesincludingfixedandmobile(8) Deliver£6.9billiononsciencecapitalandestablishcommercialisationcentresand
fosteruniversitycollaborativefacilities
DynamicEconomy:
(9) Improvingplanningfreedomtostimulategreaterhousinginvestment(10) Reducingwelfarecostandintroducehigherpay(11) Increaseemploymentandreducedisabilityemploymentgap(12) Continuetoreformfinancialservicesthroughregulatoryandindustryengagement(13) Openvariousmarketsupfurtherthroughreducedadministration(14) Focusonstimulatingexportsfurther(15) RebalancingNorth-Southeconomicimbalancethrough£13billioninvestmentin
‘NorthernPowerhouse’
ManyoftheseinitiativesseektoaddressseveralfactorsbelievedtocontributetoregionalproductivityvariationscapturedwithinNUTS-3data.71ThevariationsinproductivityacrossUKregionsdepictedintheearlierportionofthisreportcouldbedrivenbythethreeeffectsdepictedinFigure6.
68HMTreasury.Fixingthefoundations:Creatingamoreprosperousnation.July2015.69HouseofCommonsBusiness,InnovationandSkillsCommittee:TheGovernment’sProductivityPlan.SecondReportofSession2015–16.
70HMTreasury.Fixingthefoundations:Creatingamoreprosperousnation.July2015.71Rice,P.,andVenables,J.(2004).Opcit.

25
Benefitsofbeingclosertoeconomicmass:
• Knowledgespillover• Thicklabourmarkets• Closeproximitytosuppliersandcustomers
àDoublingeconomicmassanareahasaccesstoraisesproductivityby3.5%
àBelowaverageaccesstocitiesequalspoorerperformance
• 10%riseindegrees=1%riseinproductivity
• 10%increasewithoutdegree=0.7%lowerproductivity
Figure6:EffectcontributingtoregionalproductivityvariationsSource:Rice,P.,andVenables,(2004)72
Thethreeeffectsdepictedaspotentiallycontributingtoregionalproductivityvariationinclude:
(1)Alreadyproductiveareasinfluenceearningsthroughthecreationandattractionofhigherpayingjobs,oftenrequiringgreaterskillsandcomplexity-thiscreatesfurtherdemand;(2)Proximitytolargercities,orareaswithaconcentrationoffacilities(‘economicmass’)canraiseincomeandproductivity,withthedensityofactivityhavingbeenshowntohaveapositiveeffectonproductivity;(3)Themixofeducationinthepopulation,withahigherproportionoftheworkingpopulationhavingdegreesincreasingproductivity.73Researchindicatesthatbenefitsalsoexistinfirmsbeingcloserto‘clustered’cities,orlocationsofconcentratedindustriesintermsofknowledgetransferbetweenindividualsandorganisationstofosterproductivityandinnovation.74Estimatesarethata10%reductioninaveragejourneytimesintheUKcouldraiseproductivityby1.2%to2.4%dependingonthedensityoftheareas.75BelowaverageaccesstocitieshasbeenestimatedtobeacontributingfactortothepoorerperformanceofregionsofScotland,Wales,theSouthWestandNorthEast.76Atrendtowardsmoreflexibleworkingpracticescouldassistinovercomingsomechallengesofdistance,withsomeGovernmentdigitalinitiativesalsoaimedatupgradingdigitalskills.77
72Ibid.73Ibid.74Muro,M.,andKatz,B.,(2010).TheNew‘ClusterMoment’:HowRegionalInnovationClustersCanFostertheNextEconomy,inEntrepreneurshipandGlobalCompetitivenessinRegionalEconomies;Chapter5;pp:93-141.Emerald.
75Rice,P.,andVenables,J.(2004).Opcit.76Rice,P.,andVenables,J.(2004).Productivity:understandingregionaldifferences.CEPDiscussionPaper162.CentreforEconomicPerformance.LondonSchoolofEconomicsandPoliticalScience.
77http://www.gov.scot/Resource/0044/00448804.pdf
• Highproductivityareasbenefitfromalargershareofjobsinhighpayingoccupations
1. Productivitydrivesspatialvarianceinearnings(Occupational):66%ofUKspatialvariationinearningisattributabletovariationsinproductivity
2. Proximitytoeconomicmassraisesincome:Averageearningsincreasewhenaccessto‘economicmass’iswithincloserproximity
• Travelwithin40minutesdrivingtimemaximisesproductivityopportunity.
• Noeffectbeyond80minutesdrivingtime
3. Educationalqualificationsdrivehigherproductivity:Regionalproductivityvariationisaffectedbythedegreeofeducationattained.
• Increasingthe%ofwork-forceeducatedto1stdegreelevelandreducing%withsub-degreesraisesproductivity

26
TheoptionsavailabletodiminishsomeoftheproductivityvariationshighlightedarestructuralandpotentiallyareaffectedbyGovernmentpoliciesoutlinedinthissectionbothforlongertermgrowthandinadynamiccapacity.Managersdictatelocationandundertakerecruitmenttoattaintherequiredmixofskillsandqualificationsfortheorganisation,whilstindividualsmakechoicesonwheretowork,commuting,andtheeducationtheyattain.Suchdecisionsareoftencomplexandensconcedwithinbroadersocial,financial,andotherconsiderations.Firmsandindividualsmaydirectlyfactormassproximityintotheirdecisionsorinothercases,thisisasecondaryfactor.

27
3. FirmSpecificFactors:DefiningGranularProductivityEnhancingOpportunities
Firm-specificfactorshavebeenshowntoenhanceproductivity.78Threeareashavebeenreviewedinthelastsectionsofthisreport,andtheopportunitiestoenhanceproductivitypresented,basedonappliedresearchthathasoccurred.Insomecases,theresultsobtainedhavebeenstatisticallysignificant:adoptionofattributes,suchasgoodmanagementpractices,haveshownastatisticallysignificantcorrelationwithfirmperformance.79Inotherwords,betterperformingfirmsarebetterrun.ThethreeareasoutlinedinFigure7willbereviewedinthesubsequentsectionsofthisreporttodefineopportunitiesthatcanenhancefirmlevelproductivity:managementpractices;changingworkforcepractices;ICTandmobility.
FosteringUKProductivityEnhancement
LSE&McKinseyandCo,Stamford+,ManagementPracticesresearch:20,000
interviews
AdditionalLSEresearch:Productivityenhancing ICTand
Mobility
LSEandadditionalresearch:ChangingWorkforcePatterns
Figure7:Reviewingfirm-levelareastoenhanceproductivity
Whilsta‘onesizefitsall’modelforproductivityenhancementdoesnotexist,firmscanadoptarangeofpracticesandstrategiesthatmaximisethepotentialforsuccessintheirspecificenvironmentandcompetitivescenario.
4. ManagementPractices:The‘Lever’forFirm-LevelProductivityEnhancement
4.1 DefiningManagementPractices
“Humanfactorsaremorelikelytocausefailurethanhardwareandsoftwaredeficiencies.”
Howland,2000
Theterm‘managementpractices’lacksaconcretedefinition.Theconceptcanbestbereviewedasanamalgamationofitstwoprincipalparts:
“Management”:80theprocessofleadinganddirectingallorpartofanorganisationthroughthedeploymentandmanipulationofresources.
“Practice”:81theactualapplicationofaplanormethod,asopposedtothetheoriesrelatingtoit.
Thenotionofmanagementpracticesisbroad,butcan,atafundamentallevel,bedefinedaswhatanorganisation’smanagersdo:howtheyplan,deliver,andutilisethefirm’sassets,bothhumanandcapital.Managersare‘influencers’intheuseofthefirm’sassetswithresearchhighlightingthat,“topexecutivesvaryconsiderablyintheirmanagementstyles….raisingquestionsastowhymanagersmaybehavesodifferentlyinapparentlysimilar
78Ibid.79Bloom,N.,andVanReenen,N.(2010).WhyDoManagementPracticesDifferacrossFirmsandCountries?JournalofEconomicPerspectives.Vol:24(1);pp:Pages203–224.
80en.wikipedia.org/wiki/Management81http://www.askoxford.com/concise_oed/practice?view=uk

28
economicenvironments.”82Firmsachievingbetterperformancehavebeenfoundtobebettergovernedingeneral,withmanagersalsooftenreceivinghighercompensationasanincentivetomaximiseperformance.83Thefirm’sCEO/Managerplaysacrucialroleindrivingthefirm’sperformance,strategy,andsetting‘acceptablepractices’.84Notwomanagersarealike,withCEOs/Managersinterpretingthesameenvironmentdifferently,andtheseinterpretationsleadingtothedevelopmentofspecificpoliciesandactions.Thesedifferencesultimatelyaffectorganisationalperformance.85Managementpracticesaremorethantheattributesoftopmanagershowever;overtimetheyformpartoftheorganisationalstructureandbehaviourofthefirmandadoptedintheorganisation.86
Managerialpracticescanbestrategicandincludebusinessplans;visionstatements;memos;technologyplans;memosandpresentations(ibid),ortheycanbeoperational.87Theycanincludeabroadrangeofactivitiesincluding:HRpractices;Productionpractices;Financialpractices;otherfunctionalpractices(Marketing;Operational;others).Appropriateandwell-executedpracticesareparticularlyrelevantforUKmanagersconsideringslowergrowthintheUK-followingtherecentrecessionandtheUK’slaggingG7positioninproductivity,asoutlinedintheprevioussectionsofthisreport.
Theabilityofmanagerstoembraceandadapttonewtechnology;engageininnovation,andaddressprocessesandelements,canimprovetheircompetitivepositionandproductivity.88Themaininhibitorsfortheexploitationofnewtechnologiesmostoftenappeartobealackofknowledge,poormanagementskillsandqualificationsforbothentrepreneursandemployees.89Adoptingbestpracticesinthefirmisarguablythemostinfluentialandrelevantmeansofimprovingitsproductivityandpositioningitforlong-termsuccess.90UKRegionsreflectaheterogeneousmixoffirmsoperatingwithineach,representingthesectorsdefinedearlierinthisreport.WithUKproductivity18%belowtheaverageoftheotherG7countries,representingthelargestproductivitygapsince1991whentheONSdataseriesbegan91,theadoptionofbestpracticesmanagementcouldhelptoaddressthisshortfall.
4.2 EstablishingBestPractices
“Alargenumberoffirmsareextremelybadlymanagedwithineffectivemonitoring,targetsandincentives.Wepresentcompellingevidencethatbettermanagerialpracticesaresignificantlyassociatedwithhigherproductivity.”
Bloometal,2005.
82Bertrand,M.,andSchoar,A.(2003).ManagingwithStyle:TheEffectofManagersonFirmPolicies.QuarterlyJournalofEconomics.Vol:118(4);pp:1169-1208.
83Ibid.84Lefebvre,L.A.,Lefebvre,L.,Mason,R.,(1997).TheInfluencePrisminSMEs:ThepowerofCEOsPerceptionsonTechnologyPolicyandItsOrganisationalImpacts,ManagementScience.Volume.43(6)
85Ibid.86Bloom,N.,etal,(2005).Opcit.87Suitaris,V.(2001).StrategicInfluencesofTechnologicalInnovationinGreece.BritishJournalofManagement.Volume12;pp:131-147.
88Chesbrough,H.(2006).OpenBusinessModels:HowtoThriveInTheNewInnovationLandscape.HBS.89Buhalis,D.,Deimezi,Q.,(2003).ITPenetrationandE-commerce:DevelopmentsinGreece,ElectronicMarkets.Volume13(4);pp309-324.
90Bloom,N.,andVanReenen,J.(2010).WhyDoManagementPracticesDifferacrossFirmsandCountries?TheJournalofEconomicPerspectives:Vol:24(1);pp:203-224.
91HouseofCommonsLibrary,(2016).ProductivityintheUK.BriefingPaper.Number06492,October.

29
Agapexistedinthedefinitionandexplorationoffirm-levelmanagementpracticesthataddressedthequery:doesmanagementmatter?Leadingresearch,commencedin200292,continuestoassessthis,withresultsconfirmingastatisticallysignificantcorrelationbetweengoodmanagementpracticesandfirmperformancewith20,000interviewsundertakenwithfirmsin35countriesinfoursectors.93ThisutilisedatoolkittoassessmanagementpracticesacrosskeyareasthataffectfirmperformancedevelopedbyMcKinseyandCoforuseexclusivelyintheLSEstudy.AdditionalstudieswerealsoundertakenonasmallersampleoffirmsviasitevisitsandinterviewsofmanagersinProduction,HR,Technologyandshop-floorworkers,toprovidedeeperinvestigations.
Theresultsalsoindicatedastatisticallysignificantrelationshipbetweenmanagementpracticesandfirmperformance.94Thisdualapproachandextensiveworkremaintheonlyempiricalinvestigationatthisscaleandbreadthtoassesskeyfactorscontributingtofirmproductivity.95Thesebestpracticesareingeneralagnosticoffirmlocationandcanbeappliedacrossgeographiesandsectors.
4.3 AddressingManagementPracticestoOptimiseFirm-LevelProductivity
Afirm’smanagementpracticesdrivethecraftingandexecutionofstrategiesthatcanmaximiseproductivity.96‘Badpractices’correctedcantransformabusinessandescalateitsproductivity.97TheapplicabilityoftheLSE-McKinseyresearchanditsutilisationinover20,000instancesin35countriesisrepletewithexamplesofmanagerswhohavereviewedtheirbusinessandimprovedperformancebyaddressingfour‘straightforward’practicesinoperations,performance,targetsandtalent:
• OperationManagement:Howeffectivelyhavemodernmanagementtechniquesbeenintroducedinthecompany:whywerethesemodernprocessesintroduced,forhowlonghavethesepracticesbeeninplace,howareotherdepartmentsofthecompany,outsideofthecompany,involvedinimplementingtheseprocesses?
• Performancemonitoring:Howwelldoestheperformancemonitoringsysteminformmanagersandtheiremployees'oftheirday-to-dayoperations:howdoprocessesandattitudesarescreened,howmeaningfularemetricsinrelationtohowfrequentlytheyaremeasuredandreviewed,towhatdegreethedetectionofdifferentlevelsofprocess-basedperformanceleadstoadequateandconsequentialprocess?
• Targetsetting:Howtightlyaretargetslinkedtothecompany'swiderobjectives:aretargetscoveringasufficientlybroadsetofmetrics,howstronglyareshortandlongtermtargetsconnected,howwellaretheycascadeddownandclarifiedtoworkers?
92ThisstudyisbeingundertakenbytheLSE’sCentreforEconomicPerformance,aleadinginterdisciplinaryEuropeaneconomicsresearchcenter,incollaborationwithMcKinseyandCoandremainstheleadingresearchonmanagementpracticesatfirm-levelglobally,commencingin2002andcontributedtosincethattimebothinexpansionto35countriesandinassessingfirmsfromfoursectors.
93Bloom,N.,etal.(2005).OpCit.94Grous,A.(2011).Grous,A.(2011).LSEmimeo.95Themethodology,sampleset,questionnairesandotherelementsareavailableat:http://worldmanagementsurvey.org
96Bender,S.,etal.(2016).ManagementPractices,WorkforceSelectionandProductivity.CEPDiscussionPaperNo1416.CentreforEconomicPerformance.LondonSchoolofEconomicsandPoliticalScience.
97https://hbr.org/2012/10/the-radical-beauty-of-three-si

30
• Talentmanagement:Howarepeoplemanaged:towhatdegreeispeoplemanagementemphasizedwithinthecompany,howcarefularehiringpolicies,howcloselyarepayandpromotionslinkedtotheabilityandeffortofemployees,howareunder-performersdealtwith,andhowarebest-performersretained?
Atotalof18sub-areashavebeendefinedacrossthesepracticesandprovidetheopportunitytoreviewandaddressafirm’soperation.Theinitialandpredominantmanagementpracticesapproachthatcommencedoveradecadeagohasbeendevelopedtoassessamanufacturing/productiondrivenenvironment.Thishasalsobeenadaptedtocoverretail,hospitalsandschools.Thefundamentalfourpracticesunderpinningthesearethesamehowever,withvariationsoccurringinthe18sub-areastoadaptthemforrelevance.Table4definesthemanufacturing/productionfocusedapproachtoassessmanagementpracticesthatformsthecoreapproach.
Manufacturing/ProductionFirm
OperationsManagement
Moderntechniques Whatmodernorleanpracticeshavebeenadopted?
Bestpractices:Allmajoraspectsofmodern/leanmanufacturinghavebeenintroduced(Just-in-time,automation,flexiblemanpower,supportsystems,attitudesandbehaviour)inaformalway
Rationaleforadoption Whatfactorsledtotheiradoption?
Bestpractices:Modern(lean)manufacturingtechniqueswereintroducedtoenableustomeetourbusinessobjectives(includingcosts)
PerformanceMonitoring
Processdocumentation Howareproblemsexposedandcorrected?
Bestpractices:Exposingproblemsinastructuredwayisintegraltoindividuals'responsibilitiesandresolutionoccursasapartofnormalbusinessprocessesratherthanbyextraordinaryeffort/teams
Performancetracking Whatkindofindicatorsareusedforperformancetracking?
Bestpractices:Performanceiscontinuouslytrackedandcommunicated,bothformallyandinformally,toallstaffusingarangeofvisualmanagementtools.
Performancereview Howdoyoureviewtheseperformanceindicators?
Bestpractices:Performanceiscontinuallyreviewed,basedonindicatorstracked.Allaspectsarefollowedupensurecontinuousimprovement.Resultsarecommunicatedtoallstaff
Performancedialogue Howdoyoureviewtheseperformanceindicators?
Bestpractices:Regularreview/performanceconversationsfocusonproblemsolvingandaddressingrootcauses.Purpose,agendaandfollow-upstepsarecleartoall.Meetingsareanopportunityforconstructivefeedbackandcoaching.
Consequencemanagement Whatwouldhappenifafollowupplanagreedduringoneofyourmeetingswerenotenacted?
Bestpractices:Afailuretoachieveagreedtargetsdrivesretraininginidentifiedareasofweaknessormovingindividualstowheretheirskillsareappropriate
TargetSettingTypeoftarget Whattargetsaresetforthecompany?
Bestpractices:Goalsareabalanceoffinancialandnon-financialtargets.

31
Seniormanagersbelievethenon-financialtargetsareoftenmoreinspiringandchallengingthanfinancialsalone(e.g.60%marketshareby2003)
Interconnectionofgoals Whatisthemotivationbehindyourgoalsandhowaretheycascadeddowntotheindividualworkers?
Bestpractices:Corporategoalsfocusonshareholdervalue.Theyincreaseinspecificityastheycascadethroughbusinessunitsultimatelydefiningindividualperformanceexpectations.
TimeHorizon Whatkindoftimescaleareyoulookingatwithyourtargets?Areyourgoalssetindependentlyofeachother?
Bestpractices:Longtermgoalsaretranslatedintospecificshorttermtargetssothatshorttermtargetsbecomea"staircase"toreachlongtermgoals
Goalsarestretching Howtoughareyourtargets?Doyoufeelpushedbythem?
Bestpractices:Goalsaregenuinelydemandingforalldivisions.Theyaregroundedinsolid,solideconomicrationale
Clarityofgoalsandmeasurement
Ifyourstaffwereaskedaboutindividualtargets,whatwouldtheysay?
Bestpractices:Longtermgoalsaretranslatedintospecificshorttermtargetssothatshorttermtargetsbecomea"staircase"toreachlongtermgoals
TalentManagementInstillingatalentmindset Howdoseniormanagersshowthatattractinganddevelopingtalentisa
toppriorityinyourcompany?
Bestpractices:Seniormanagersareevaluatedandheldaccountableonthestrengthofthetalentpooltheyactivelybuild
Buildingahighperformanceculture
Howdoesyourappraisal/rewardsystemwork?
Bestpractices:Westrivetooutperformthecompetitorsbyprovidingambitiousstretchtargetswithclearperformancerelatedaccountabilityandrewards
Makingroomfortalent Ifyouhadaworkerwhocouldorwouldnotdohis/herjobwhatwouldthecompanydo?
Bestpractices:Longtermgoalsaretranslatedintospecificshorttermtargetssothatshorttermtargetsbecomea"staircase"toreachlongtermgoals
Developingtalent Howwouldyouidentifyanddevelopyourstarperformers?
Bestpractices:Longtermgoalsaretranslatedintospecificshorttermtargetssothatshorttermtargetsbecomea"staircase"toreachlongtermgoals
Creatingadistinctiveemployeevalueproposition
Whatmakesitdistinctivetoworkatyourcompanyasopposedtoyourcompetitors?
Bestpractices:Weprovideauniquevaluepropositiontoencouragetalentedpeoplejoinourcompanyaboveourcompetitors
Retainingtalent Ifyouhadastarperformerwhowantedtoleavewhatwouldthecompanydo?
Bestpractices:Wedowhateverittakestoretainourtalent.Source:LSE-McKinseyManagementMattersSurvey.Alsoavailableonline98
Table4:Managementpracticescheck-listformanufacturing/productionbusinesses
Thisapproachisvalidacrossorganisationaltypesincludingcorporates,largefirms,smalltomediumenterprisesandhasbeentestedacross20,000interviewsinmultiplecountries.
98http://worldmanagementsurvey.org/benchmark-your-organization/benchmark-your-manufacturing-firm/

32
4.4 WhyDoesManagementMatter?
Identifying,correctingandutilisingbettermanagementpracticeshavebeenshowntobeeffectiveinimprovingfirmperformance.99Extensiveresearchandthereal-worldapplicationofprinciplestoimprovemanagementpracticessince2002hasconfirmedthepotentialresultsavailabletofirmsthatcanmanagebetter:100
• Defectsreducedby50%;• Inventoryreducedby20%;• Outputraisedby10%;• Firmsthatimprovepracticesby1pointinthereviewoftheiroperationscorrelate
withsignificantpotentialperformanceimprovements:
o 23%higherproductivityo 14%highermarketcapitalisationo 1.4%higherannualsalesgrowthrate
Theimprovedresultsfromenhancedmanagementpracticescarrynumerousorganisationalbenefits:
• Staffretention:Rewardingandretaininggoodemployeeshasapositiveimpactonthefirm,withtheaveragefinancialimpactofthelossofanemployeeestimatedtobe£30k,comprisedofalossofoutput(£25k)andthelogisticalcostofabsorbinganewworker(£5k).101LabourturnoverwasestimatedtocosttheUKeconomy£4.1bnin2013.102
• Inventorymanagement:Reducingthefirm’sinventory,accountsoutstanding,andcashconversioncycleimprovesthefirm’svalueandprofitability.103Addressingpracticessurroundingthisareacangeneraterapidresultsforthefirm.
• Fasterandmoreaccurateproduction:Applyingsimpleleanandmodernstreamliningprinciplesandconsolidatingteamstoimprovelocalworkflowscanproducerapidgainswithinthreeweekstotwomonths.Morecomplicatedissuesthatrequirelongerdatacollectionandanalysiscantakesixtoeighteenmonths.104Thebenefitscanbedramatic,withFordintheUSincreasingproductivityby30%offrontaxlesforitstrucksandSUV’sthatresultedinanadditional$2billioninprofit.105
• Linkingstrategywithdelivery.Acontinuousreviewandimprovementprocesstosetappropriatetargetsand‘extend’thefirm’smanagersandemployeestodelivercansustainprofitabilityandproductivity.106Resultshavefoundthatproductivityis
99https://hbr.org/2012/10/the-radical-beauty-of-three-si100Ibid.101OxfordEconomics-Unum.(2014).TheCostofBrainDrain.102Ibid.103Garcia-Turel,P.,J.,andMartinez-Solano,P.(2007).EffectsofworkingcapitalmanagementonSMEprofitability.InternationalJournalofManagerialFinance.Vol:3(2);pp.164–177.
104TajS.,andBerro,L.(2006).Applicationofconstrainedmanagementandleanmanufacturingindevelopingbestpracticesforproductivityimprovementinanauto-assemblyplant.InternationalJournalofProductivityandPerformanceManagement.Vol.55(3/4);pp.332–345.
105 Robinson, R. (1999). Welcome to OR territory OR/MS Today. August; pp. 40-3. 106McAdam,R.,andBailie,B.(2002).Businessperformancemeasuresandalignmentimpactonstrategy.InternationalJournalofOperations&ProductionManagement.Vol:22(9);pp.972–996.

33
optimisedwhentargetsareexplicitlyincludedinstrategic/businessplansandutilisedsubsequentlywithinthefirmandlinkedbacktothis.107
A‘planofaction’ofenhancingproductivitybyfirmsintheUKcouldinclude:
1. Reviewthemanagementpracticesdefinedinthispaper.2. Usethemasaguidetoassesswherethefirmispositionedandconsideroptionsto
addresswherepracticesappeartobedivergenttothis.3. Undertakeself-analysisbasedonthesemanagementpracticeswithbenchmarksand
optionstoself-assessafirm’smanagementpractices.The‘WorldManagementSurvey’isthefirstcross-country,cross-industrydatasetbuilttomeasurethequalityofmanagementpracticesinestablishments.Itassessessub-themesforeachpracticeandprovidesascoreforthefirmincludingfeedback,toassistinidentifyingareasthatcouldrequirefocus.108
4. Useasecondaryself-analysistoolsuchastheReadyBusinessIndicator,developedbyVodafoneUK,tobenchmark‘businessreadiness’inlinewithdigitaltransformationandidentifyareasforpotentialfocus.109
5. Addressareasrequiredwithbothfirmresourcesandotherswheremanagementrequiresadditionalexpertise.
Theaboveprovidesanexpedient,testedapproachtoquicklyaddressingandquantifyingthequalityoffirmpractices.Ifutilisedasaguide,benefitscanaccrueashasbeenshownonnumerousoccasionsinternationally.
4.5 ComplacencyisnotanOptionAdoptingbestpracticesmanagementshouldnotbeleftto‘crisis’scenariosorwheneconomicorotherpressureoccurs.Organisationsneedtoperiodicallyre-structureandre-aligntorespondtomarketchanges:researchindicatesthatorganisationsthatbelievethattheircurrentconfigurationwillpermitthemtosurvivethroughanyfuturescenariosareorganisationsthatareunlikelytoseethefuture.110Managersshouldneverbecomesocomfortableinaccommodatingtheircurrentexternalenvironmentthattheycan’taltertorespondtoenvironmentalchanges.111Attemptingtochangetoolatecanresultinthefirm’sdemise.112
LeadingresearchacrosstheEUhasshownthatcurrentinvestmentinafirm’sinnovationsandITwillhaveadirectbearingonfuturecompetiveness:firmsthatare‘thrivers’arethosethatinvestinbestpracticesandITthroughoutthebusinesscycle.113Inparticular,firmsthatareconstantlyassessingtheirperformance,theirenvironmentandforecastingfutureissues
107Ibid.108http://worldmanagementsurvey.org/benchmark-your-organization/109http://readybusiness.vodafone.co.uk110 Ulen, T. (2010) Responding to change: internal and external factors in organizational success. Journal of Institutional Economics. Vol: 6(1): pp: 133–137 111Ibid.112Posner,R.(2004),Catastrophe:RiskandResponse,NewYork:OxfordUniversityPress.113http://www.businesswire.com/news/home/20090901005446/en/Important-Research-Innovators-Beating-Recession-Pulling-Competitors

34
arethosewiththehighestpotentialtosurvive.114‘Thrivers’aretwiceaslikelytosucceedinobtainingafastROIandreinvestcostsavingsintoITinnovationandefficiency.Recessionsandotherexternalshockspresentanopportunity,withthesecompaniespreparedinthefaceofdownturnstorespondandsurvive.Resultsindicatethatwhile52%ofthesetypesof‘thriver’businessesmayhavebeenimpactedbytherecession,only28%haveobservedadecreaseinsales.115Thesetypesofbusinessesaremuchmorelikelytosurvivenegativeshocksandadverseconditionsthanthosethatare‘Hiders’,thathavenotadjustedanykeyelementsaheadofthis,or‘Survivors’-firmsthatmaymakeitthroughsuchconditionsbutcannotadjusttothemlongtermanddonoteventuallysurvive.UKbusinessesfacecontinuedchallengesfromarangeofissues:EU-drivenpoliticalandlegalchanges;economicconditionsincludinganysofteningofdemand;cyber-securityanddata-centricchallenges;alteringworkforcepractices;governmentlegislationonpensionandotherworkforcerequirements;workingcashflowandaccesstofunds;andothers.Firmswhosemanagersareengagedintheirbusinessandcontinuouslyseektomaximiseperformanceandproductivitystandthehighestchanceofmakingitthroughnegativecycleswiththefactorsrequiredtosurviveandprosper.Familyownedfirmshaveshownnegativeresultsinadjustingtochangescomparedtootherfirmtypesandwithgreaterresistancetochangeandnegativeproductivity:instillingbestmanagementpracticesandtechnologyadoptioninthesefirmtypescanhaveparticularlypositivepotentialbenefits,butappliesasaprincipalacrossallfirmtypes.116
4.6 ManagingforGrowth
Best-practicefacilitatesmanagementattentionbeingtargetedtokeydevelopmentactivitiesacrossallbusinessownershiptypes.Researchindicatedthattheimprovementofmanagementpracticeswasachievedbymanagersinseveralways117:
• Firmmanagersworkingatcapacityundertookatwo-foldstrategy:(1)delegatedtasksinitiallyandfocusedonfirmexpansionviaexportingornationally;and(2)afterafurtherperiod,employedadditionalresourceswhoundertookdedicatedexportdutiesornewchannelandrelatedopportunities,supportedbytheadditionalbusinessgrowth;
• SoughtexportassistancefromGovernmentagenciesaboutexporting;• Partneredwithadditionalorganisationsfromtheoutsettodistributegoodswithout
furtherresourcerecruitment,withsomeadditionaldutiesbeingundertakenbyfirmmanagersand/orfurtherdelegation.
114Ibid.115Ibid.116Ward,J.,L.(1997).GrowingtheFamilyBusiness:SpecialChallengesandBestPractices.FamilyBusinessReview.Vol:10(4);pp:323–337.
117LSEResearchacross50firmsforManagementMatters:2009-2012.

35
5. InformationandCommunicationsTechnology
“Businesssuccessincreasinglydependsontheorganization’sabilitytofusethepowerofITintothefabricofbusinessprocessesandbusinessnetworks.ThecontinuouslygrowingimportanceofITrequiresorganisationstointegrateITdecisionswithintheircommonplanninganddecision-makingprocessesatallorganizationslevels.”
VanderZeeandDeJong,(1999).1185.1 ICTAdoptionFactors
“EvidencehasshownthateffectivedeploymentofICT,orthefailuretodoso,aredeterminantsofproductivitygrowthfarmoreimportantthanICTexpenditure.InordertogetthemostoutoftheirICT,companieswillhavetomakesophisticateduseofICTandmanagetheprocessofchangerequiredtoembedtechnologyinthecompanyorganisation.”
VanZoest,(2003).119
InformationandCommunicationsTechnology(‘ICT’)hasthepotentialtobeamajortransformativetoolforproductivityinthefirm.120TherelationshipbetweenICTinvestmentandfirmperformancecanbecomplexandmultifaceted,andmoderatedamongstotherfactorsbycompanystrategyandmanagerialpractices.121NineoutoftenSMEsinOECDcountriesareequippedwithcomputersandeightoutoftenhaveInternetpenetration.122
AccesstoanduseofICTcanpermitSMEstobecomeorremainprofitable,exploittheirintellectualpropertyandempowertheiremployeestoutilisetechnology‘onthemove’orwithgreaterfunctionalitythaninthepast.123SMEswithhighproductivitygrowtharemorelikelytoadoptagreaternumbersofadvancedICTsandforthesetobeusedtofosterinnovationandproductivity.124AllthreefirmtypesutiliseICTtovaryingdegrees,withanumberoffactorsincreasingasfirmsizeincreases:sophisticationoftechnologyutilisedincludingsecurity,infrastructure,functionality;integrationwithEnterprisesystems;analyticsandreporting,andotherattributes.125Asiteratedthroughoutthispaper,thekeyleveragetomaximizingthepowerofICTtofosterproductivityismanagementpractices:whilstICTandmanagementpracticesarecomplementary,thelatteristheleverforincreasesinproductivity.Firmswithbetterpracticesaremoreproductive,profitable,andhavehighersalesgrowththanthosewith
118VanderZee,J.T.M.andDeJong,B.(1999).Alignmentisnotenough:integratingbusinessandinformationtechnologywiththebalancedbusinessscorecard.JournalofManagementInformationSystems.Volume16(2);pp:137–156.
119VanZoest,A.,(2000).UKBusinessesandICTs:WhereistheProductivityGrowth?120Brynjolfsson,E.,andHitt,L.M.(2003).ComputingProductivity:Firm-LevelEvidence.MITSloanWorkingPaper4210-01,SloanSchoolofManagement,eBusiness@MITWorkingPaper139;June.
121Rondeau,P.J.,etal.(2006).Howinvolvement,ISmanagementeffectiveness,andend-usercomputingimpactISperformanceinmanufacturingfirms.Information&Management.Vol:43(1;pp93-107.
122OECD(2004),ICT,E-BusinessandSMEs123Stroeken,J.(2001).TheadoptionofITbySMEs:TheDutchcase.JournalofEnterprisingCulture.Volume:9(1);pp:129-152.
124Higón,D.,A.,(2012).TheimpactofICToninnovationactivities:EvidenceforUKSMEs.InternationalSmallBusinessJournal.Vol.30(6);pp.684-699.
125Hollenstein,H.(2004).DeterminantsoftheadoptionofInformationandCommunicationTechnologies(ICT):Anempiricalanalysisbasedonfirm-leveldatafortheSwissbusinesssector. StructuralChangeandEconomicDynamics.Vol:15(3);pp:315–342.

36
‘worse’practices.126Figure8depictsresultsindicatingthatICTadoptedwithbettermanagementpracticesachieves20%productivityimprovementcomparedtoonlya2%upliftwhentechnologyisadoptedwithpoorpractices.127
Figure8:ManagementpracticesandICTadoptioncomplementarity
FirmswhichadoptorganisationalchangesandintroduceICTdisplayahigherfrequencyofproductivityimprovementandhigherratesofinnovation.128TheadoptionofICTbyfirmshasbeenlinkedtoseveralbenefits,enhancedwhenthisoccurswithgoodpractices:129
• Productivityenhancement;130• Greaterinnovation;131• Processimprovement;132• Flexibleorganisationalstructures.133
Complementaryinvestmentsinskills,organisationalchangeandinnovationarealsoviewedasinstrumentalinfacilitatingthesuccessfuluseofICT,andaffectingfirmperformance.134Withoutthesesupportingelements,theeconomicimpactofICTmaybelimited.135
126VanReenen,Jetal.(2006)ManagementPractices,Work—LifeBalance,andProductivity:AReviewofSome
RecentEvidence.OxfordReviewofEconomicPolicy(Winter)22(4):pp:457-482.127Dorgan,S.J.,andDowdy,J.J.(2004).WhenITLiftsProductivity.McKinseyQuarterly;4.128Brynjolfsson,E.,andHitt,L.(2000).BeyondComputation:InformationTechnology,Organization
TransformationandBusinessPerformance.JournalofEconomicPerspectives;Vol:14;pp:23-48.129Mundlak,Y.(1961).EmpiricalProductionFunctionFreeofManagementBias.JournalofFarmEconomics.
Volume43(1);pp:44-56.130Morikawa,M.(2004).InformationtechnologyandtheperformanceofJapaneseSMEs.SmallBusiness
Economics.Vol:23(3);pp:171–177.131Koellinger.,P.(2008).Therelationshipbetweentechnology,innovation,andfirmperformance-Empirical
evidencefrome-businessinEurope.ResearchPolicy.Vol:37;pp:1317–1329.132Ibid.133Gera,S.,andGu,W.,(2004).Theeffectoforganisationalinnovationandinformationtechnologyonfirmperformance.InternationalProductivityMonitor;No.9.
134James,J.A.Bhalla.(1994).FlexibleSpecialization,NewTechnologiesandFutureIndustrializationinDevelopingCountries.Futures.July/August.
135OECD,(2004).TheEconomicImpactofICT:Measurement,EvidenceandImplications,Paris.

37
Ultimately,thekeyfactorbelievedtoaffecttechnologyadoptionandproductivityis‘managerialquality’deliveredbyboththeCEO/Managerandmiddlemanagers,withpracticesformingpartoftheorganisationalstructureand‘behaviour’ofthefirmthatevolvesovertimewithsuccessiveleaders.136Competition,organisationalpracticesandotherstrategiesinfluencethevalueofICTinvestmentsandinternalworkorganisation,137withineffectivemonitoring,alackofanyorappropriatetargetsettingandincentives,resultinginlowerproductivityandinefficientuseofICT,irrespectiveoflocation.138
5.3 ChangingSocioeconomicDrivers
Organisationsandindividualshaveaplethoraofcommunicationsoptionsavailabletothemforwork,socialtasks,andablurringofthelinebetweenthetwo.Organisationscantodayadoptanarrowernumberoftechnologyoptionsandstillenhanceproductivity,withthisparticularlyapplicabletoSMEsandsoletraders.Asfirmsincreaseincomplexity,sizeandgeographicaldisbursement,additionalcomponentsareoftenobservedsuchasEnterpriseapplicationsfordata,security,email,andotherareas,facilitatedbymobilebroadbandinparticular.139Individualsarenowworkingandlivinginanerawherefixedtelephonelinesarebecominglessrelevant;mobileinteractive,entertainmentandworktasksarebecomingingrainedas‘normal’,andpersonaldevicessuchassmartphones,tabletsandlaptopshavebecomeubiquitous.140ThenewgenerationofMillennialandGenerationZemployeesintheworkplacearecitizensofthemostdiverseandsophisticatedmedia,computerandmobileenvironmentever141andfarsurpasstheexperienceofBabyBoomers(GenerationX).142ThisishavingasignificantimpactonhowbusinessesadoptanduseICT.Fourfifthsoforganisationsalsobelievethatdigitaltransformationwillbecriticaltotheirorganisationwithintwoyears,andover90%ofemployeesbelieveitisthecorrectapproach.143Managersinlargerfirmsarebecomingmoreawarethatemergingtechnologieslikesocialmediaandmobilecommercerequireadifferentcultureandskillsthanutilisedinthepast:144
136Syverson,C.(2004a).MarketStructureandProductivity:Aconcreteexample.JournalofPoliticalEconomy.
112(6);pp:1181-1222.137Brynjolfsson,E.,Hitt,L.M.(1995).Informationtechnologyasafactorofproduction:Theroleofdifferences
amongfirms.EconomicInnovationofNewTechnology.Volume3(3);pp:183-199.138Black,S.andLynch,L.(2001).HowtoCompete:TheImpactofWorkplacePracticesandInformation
TechnologyonProductivity.ReviewofEconomicsandStatisticsVolume83(3);pp.434-445.139Ciprinan,A,etal(2011).TheProceedingsoftheInternationalConference:Marketing-FromInformationtoDecision;pp:21-35.
140Akman,I.,andRehan,M(2016).Examinationoffactorsinfluencingemployees’adoptionofmobilecommerceandservicesinTurkey,EconomicResearch-EkonomskaIstraživanja;Vol29(1);pp:770-781.
141Gupta,O.,Gulati,G.(2014).Psycho-analysisofMobileapplicationsusageamongGenerationZTeens.InternationalJournalonGlobalBusinessManagementandResearch.August;pp80-95.
142http://socialmarketing.org/archives/generations-xy-z-and-the-others/143MITSloaneManagementReview(2013).ResearchReport:EmbarkingDigitalTechnology.ANewStrategicImperative.
144Ibid.

38
5.4 EnhancingProductivitywithICT
BothfirmsandindividualscanadoptICTtoenhancetheirproductivity.TherangeofICTavailabletofirmsissignificantandinvolvesbothexternalandinternalcomponentsanddrivers.Figure9depictstheconsolidatedenvironmentinwhichapplicationsandtechnologyareimplemented.
Figure9:Impingingcommunicationfactorsdrivebothfrontandbackendselections
Firmscanselectfromfixedandmobiletechnologycomponentstomeettheirbusinessrequirements.BeforereviewingtheICTavailable,itisrelevanttooutlinetheenablingnetworksacrossmobilebroadband;fixedsuperfastbroadbandandinternetaccess.Themost‘disruptive’ofthesecontinuestobemobilebroadband–drivenbythecontinuingrolloutof4Gservices.145ThegrowthoffixedandmobilebroadbandintheUKcontinues,althoughruralareasarestillatsomedisadvantagetodenserurbanareasforhigherspeed4G:aroundhalfofUKpremisesarecovered,butthisincreasesto88%for3Gand93%for2G,asdepictedintable5.CoverageiscontinuingtogrowacrosstheUK.
Table5:OutdoormobilecoveragefromallUKoperators
Source:OFCOM,ConnectedNations2015,p8.146
Theageofthesmartphonehasarrived,withOFCOMdata147indicatingthat:
• Smartphoneshaveovertakenlaptopsasaninternetuser’sprincipaldevice• Twohoursperdayarespentonsmartphones,twiceaslongaslaptopsandPCs• 4Gsubscriberssurgedfrom67%to39.5millionover2015
145Basole,R.,C.(2008).Enterprisemobility:Researchinganewparadigm.InformationKnowledgeSystems
Management.Vol:(7)1,2;pp.1-7.146https://www.ofcom.org.uk/__data/assets/pdf_file/0028/69634/connected_nations2015.pdf147Ofcom,(2015).CommunicationsMarketReport.

39
• Increaseacrossdata-drivenactivities:onlineshopping;TV;messaging;face-to-faceandvoicecalls;videoandpicturesharingandothers.
TheavailabilityofsuperfastbroadbandtopremisesisafurtherenablerofbusinessesadoptingproductivityenhancingICT,andbasictelephoneservice.Thishasalsobeenincreasing,with83%oftheUKhavingaccessto63Mbit/s,upfrom75%in2013,asindicatedintable6.
Table6:Coverageofsuperfastbroadbandcoverage
Source:OFCOM,ConnectedNations2015,p16.148
Around27%ofUKbusinesseshavetakenupsuperfastbroadbandintheUK(8million).149Anadditional22%havenottakenthisup,yieldingatotalpotentialfigureofaroundhalfofallUKbusinesses.150Thespeedofsuperfastbroadbandrollouttosomeruralandurbanareasisatopicofdebate,withtheGovernmenttargeting95percentpenetrationoftheUKbyDecember2017andtheprovisionofbasicaccessof2MbpsforallfromDecember2015.151TheUKCultureSecretaryhasstatedthatreachingthefinalfivepercentinruralareaswouldbe‘challenging’,buthasconcurrentlyindicatedthat,"thebenefitsofsuperfastbroadbandareclearfromincreasingproductivityandeconomicgrowthtotransformingfamilyentertainmentathome…Wehopetofindwaysinwhichthosebenefitscanbebroughttoevenmorepeople."152Ofcom,theUK’scommunicationsregulator,haspublishedconclusionsfromastrategicreviewofdigitalcommunicationsintheUK,includingademandthatBTprovideassistancetorivalsbypermittingthemaccesstoitsinfrastructuretolayfibreamongstothers.153Increasedbroadbandpenetration,coupledwithhighspeedsandbusinessadoption,areintegraltotheadoptionofmanyservicesbyindividualsandfirmsalikeandcanimproveproductivity.154Firmsutiliseabroadrangeoftechnologyservicesthatreflectfirmtype,size,
148https://www.ofcom.org.uk/__data/assets/pdf_file/0028/69634/connected_nations2015.pdf149Ibid.150Ibid.151https://www.gov.uk/guidance/broadband-delivery-uk152http://www.telegraph.co.uk/news/2016/05/05/ministers-halt-automatic-broadband-roll-out-for-rural-families-b/
153https://www.ofcom.org.uk/__data/assets/pdf_file/0016/50416/dcr-statement.pdf154Colombo,G.,M.,andCroce,A.(2013)ICTservicesandsmallbusinesses’productivitygains:AnanalysisoftheadoptionofbroadbandInternettechnology.InformationEconomicsandPolicy.Vol:25(3);pp:171–189.

40
location,andotherfactors.Graph22depictstheprincipalservicesthatUKbusinessesutiliseICTforindescendingorderofuse,withemailthemostprevalent.Someoftheseareenabledbybroadbandwhilstothersreflectabroadarrayofbusinessservices.
Graph22:UseofapplicationsbyUKSMEs
Source:BroadbandStakeholderGroup(2015);Ofcom,2014.155
5.5 APortfolioofOptions
TheUKissecondtotheUSintermsofICTassetsasapercentageofgrossfixedcapitalformation,at20%versus25%respectively.156Firm-levelresearchandcasestudyworkwithinthemanagementpracticesstreamacrossasampleofaround50firmstodatehasindicatedseveralareasofconcernrelatedtoICTadoptionbymanagersinCorporatesandSMEs.Graph23depictsthetopfiveforeachofthesetwofirmtypes.Thepriorityforcorporatemanagerswasthesecurityofdataaccessedexternallybyemployees,whilstforSMEManagers,connectivitytotheirintranetfromamobiledevicewasthemostpressingICT-relatedpriority.
155Ofcom.(2014)SMEexperienceofcommunicationsservices–aresearchreport.October16,and:BroadbandStakeholderGroup,(2015).ThebroadbandrequirementsofsmallbusinessesintheUK.August.AblendedrateforapplicationusebybothsmallandlargerSMEswasutiliseddrawingondataforbothtodefinethischart.
156Miller,B.,andAtjinson,R.(2014).RaisingEuropeanProductivityGrowthThroughICT.

41
Graph23:TopfiveareasidentifiedbyCorporate&SMEmanagersandemployeesforICTadoptionSource:LSEresearch
Additionalresearchhasindicatedthataround50%ofBritishbusinessmanagersandpublicsectormanagersdonotfeelthattheirbusinesswillbeabletoaddresskeychallengesoverthenextfiveyears.157Theuseofdigitaltechnologyishoweverseenaskeyenablingmodetoassistwithchange,withYouGovdatafromasurveyof1,110Britishmanagersindicatedthatthetopfiveusesofdigitalwereperceivedasbeing:
• Deliveringhigherqualitycustomerservice(74%)• Providinghigherqualityproductsandservices(72%)• Providingvalueformoney(65%)• Costcontrol(65%)• Profitabledelivery,andgeneratingareturnforinvestors(53%)
Thekeychallengehoweverisexecution:firmsoftendon’tadoptreadilyavailableandcost-effectiveICTordigitalmeasures.Researchindicatestwoprimaryreasonsthatthisoccurs:(1)75%offirmmanagers,particularlyinSMEs,arenotawareofthetechnologyanddigitaloptionsthatcanfacilitateproductivityenhancement;(2)amongstmanagerswhoareawareofsomeoptions,overtwo-thirdswerenotawarewheretheycouldseekassistancefrom,withthemajoritybelievingthatthisrequired‘expensiveconsultants’,or‘hiringanITmanager’,withneitheroptioncost-effectiveforthemajorityofsmallerfirms.158
5.6 MakingtheRightCall
ICTadoptionbyfirmsreflectstheirdecisionmaker’smanagementpractices.Considerableresearchhasidentifiedseveralwaysinwhichproductivityisbeingenhancedacrosstheprivateandpublicsector,includingemergencyservicesandlawenforcement.Thefollowing157YouGovSurvey,commissionedbyVodafoneUK,of1,130managers,undertakenonline16-23September2015.http://mediacentre.vodafone.co.uk/pressrelease/millions-of-british-businesses-dont-feel-ready-to-deal-with-the-future-of-digital-technology/
158LSEResearchforManagementMatters.50firmsub-samplefromprimarysample.
SME
Corporate

42
reflectanumberofpotentialareasofICTadoptionthatPublicSector,Corporates,LargeFirmsandSMEscanundertaketoenhanceproductivity.
5.6.1 MobileBroadband:Casestudy-PoliceandEmergencyServices159
ThesocioeconomicimpactoftheadoptionofmobilebroadbandbyemergencyservicesincludingPoliceandAmbulancecanbesignificant.Thiscallsforastep-changefromtoday’suseofnarrowerdata,withthepotentialtobothbecomemoreefficientwithasmallernumberofpoliceofficersonthebeatfollowingbudgetaryreductionsinsomeareasandforambulanceservices,intheabilitytoreducefatalitiesduealackofreal-time,accuratedataonpatienthistoryavailable.160ThetransformativeeffectofmissioncriticalmobilebroadbandhasthepowertoeffectchangebothatthefrontandbackendofPoliceandEmergencyServices.EstimatesarethattheadoptionofmobilebroadbandbyPoliceintheUKwithend-to-endchangescouldresultina10%productivityupliftreflectedbyanimprovedabilitytoundertakeinterventioninscenarioswhereotherwisethisisnotoccurring.161Thiswouldequatetoa£1billionbenefittotheeconomyannually.ExamplesofICTboostingproductivityintheUKarealreadyoccurring:• WiltshirePolice’smobileandremoteworkingsolutionthatisestimatedtohaveresulted
ina10%productivityincrease:theequivalentofadding89officersbutwithoutthe£4millionannualcost.162
• BritishTransportPolicealsoexperiencedasimilarproductivityincreasefollowingasimilarimplementation.163
• EstimatesforUKTrafficPoliceindicatethatproductivityimprovementsfromequippingTrafficPolicewithmobilebroadbandwiththeappropriateaccesstools(tablets/laptops)andintegrationwithback-officeelementstopermita‘mobileoffice’withrealtimeaccesstorequireddata,coulddeliversocioeconomicbenefitsof£520mperannum.164
IntheUS,similarausteritychallengeshaveresultedinPoliceForcesadoptingmobilebroadbandcommunicationstoincreasethepresenceoffirstresponders.AnexampleistheCityofAltoonainPennsylvania,whichlikeothermanyUSPoliceForcessoughttoempowerofficerstoworkmoreeffectivelyandfaster,withsimilarPoliceForcesinneighbouringareasachievinganefficiencyimprovementfromwirelessbroadbandbyatleast10percent.165ThisPoliceForceexceededtheobjective,providingaccesstocriticaldatainformationsourcesandtheabilitytouploadfieldreportsdirectly.
Thebenefitsofmobilebroadbandhavewideapplicabilityacrossthepublicandprivatesector.
159Grous,A.(2013).SocioeconomicValueofMissionCriticalMobileApplicationsforPublicSafetyintheUK.LSE.http://www.lse.ac.uk/businessAndConsultancy/LSEEnterprise/pdf/tetraReport.pdf
160Ibid.161Ibid.Calculationsandestimatesofthisareprovidedinthereport.162 http://www.straighttalkonline.com/cio-articles/going-mobile-wiltshire ; and Policing Plan for Wiltshire
2012/13. 163 http://www.straighttalkonline.com/cio-articles/going-mobile-wiltshire 164Grous,A.(2013).Opcit.165http://business.motorolasolutions.com/publicsafety/pdfs/Altoona_CS_FINAL.pdf

43
5.7 ICTandConnectivity:WiderUseandBenefits
ThebenefitsofICTconnectivitytothefirmarenumerousandenableefficienciesacrosstheactivitychainformany:166
• E-commerce:Firmsdisplayamixedpictureintheadoptionofe-commercepermittingthemtotradeelectronicallywithsuppliers.Thisareaisbelievedtorepresentanopportunityforgrowthwithprimaryresearchindicatingavariedscenariodependingonfirmsizeasdepictedintable7:
Table7:adoptionofe-commercetofacilitatetransactionsbetweenfirmsandsuppliersSource:LSEresearch2006-2011.
• LinkingwithSuppliers:SixprincipaltypesofICThavebeenidentifiedforcommunicationbetweenfirmsandtheirsuppliers.167Table8summarisestheutilisationofthesebyfirmsfromprimaryresearch.
Table8:Communicationmodeswithsuppliersandfirmadoption.Source:LSEresearch2006-2011.
Meetingsandthetelephoneareutilisedtoahighdegreebyfirms,whilstaminorityutilisefacsimiletoahighdegree.Thiswasprimarilyduetothesubstitutioneffectfromemail,withalmostallfirmsutilisingemailtoahighdegree.Overthreequartersoffirmsutilisedfaxingtoamediumdegreewithemailcontinuingtoerodethis,andtheexpectationthatwithinafurther24-36months,thismodewillbereducedsignificantly.TheopportunityexistsforcontinuedadoptionofICTtosubstituteforsomeofthesemodesandtoenhancedeliveryofinformation.
• Mobileworkforce:Oneofthemostsignificantareasofopportunityforenhancingproductivityisthecontinuedmobilisationoftheworkforce.168Theenhancedadoptionofdigitalandmobiletechnologybyorganisationsisdrivenlargelybysocial
166Kleijnen,J.,P.,C.(1982).Quantifyingthebenefitsofinformationsystems.DepartmentofBusinessandEconomics.TilburgUniversity(KatholiekeHogeschoolTilburg).5000LETilburg,Netherlands.
167Chiarvesioa,M.,DiMariab,E.,Micellib,S.(2004).FromlocalnetworksofSMEstovirtualdistricts?EvidencefromrecenttrendsinItaly.ResearchPolicy.Volume33;pp:1509–1528.
168Teodoro,B.,etal(2014).Themotivationsandexperiencesoftheon-demandmobileworkforceProceedingsofthe17thACMconferenceonComputersupportedcooperativework&socialcomputing;pp:236-247.
Firm type
% of firms without e-commerce
Unsuitable to firm's process
Lack of internal
resourcesHigh costs
Safety concern of transaction
% of firms with e-
commerceAdequate
investmentInadequate Investment
Low but increasing investment
SME 22% 67% 17% 17% 13% 33% 66%Large Firm 17% 75% 25% 26% 33% 17% 50%Very Large Firm 0% 22% 80% 20%Total 39% 61%
InvestmentNo Investment
High Medium LowMeetings 70% 13% 17%Telephone 83% 17%Fax 4% 78% 26%E-mail 91% 9%Videoconferencing 26%Integration bteween softwareware applications 22% 52%CAD sharing 17%
% of firms adoptingCommunication Mode High Medium LowMeetings 70% 13% 17%Telephone 83% 17%Fax 4% 78% 26%E-mail 91% 9%Videoconferencing 26%Integration bteween softwareware applications 22% 52%CAD sharing 17%
% of firms adoptingCommunication Mode

44
factors:theoccurrenceofdual-careercouples;169growthinsingleparentfamilies;millennialsjoiningtheworkforceandanincreaseintheinvolvementofmeninchildcare.170With54%ofUKworkersabletoworkremotely,171organisationsareincreasinglyrequiredtofacilitatethiswith:deviceaccess;securelog-in;integrationwithback-officesolutions;usagepolicies;monitoringandsurveillanceofdataexchanges,andotherfactors.Databreachesinparticularcanhaveanegativeeffectonshareholdervaluewithfirmsneedingtoaddresssecurityandmonitoringwhenlarger;thisislessofanissueforsmallerfirmsbutisstillafactor.172
Theutilisationofmobilebroadband;digitalconnectivity;B2Bopportunities;remoteworking,andotherICT-enabledareasofactivitywillcontinuetogainimportanceforenterprises.Enablingthesesecurely,efficientlyandexpedientlycanbenefitboththefirmandtheemployee.Researchindicatesthat61%ofemployeesnowusetheirhomebroadbandservicetoaccessworkapplications,andthat24%useamobiledataconnectionviatheirsmartphone,tabletorlaptopwithbroadbanddongle.173Thistrendisexpectedtocontinuetogrowaspenetrationoftheseenablingtechnologiesincreasesandorganisationsrecognisethebenefitsaccruingtoemployeesandfirm-productivityalike.
6. FlexibleWorkforcePractices
6.1 AnEvolvingWorkplace
Today’sworkforceisdifferent.Itreflectstheinterplaybetweentechnologyandchangingsocialvaluesandworkpractices.174Thesehavecausedgreaterwork-familystruggleasfamiliesstrivetobalancethetwo.175Organisationsareincreasinglyintroducingflexibleworkplacepractices(FWP)bothasameansofaddressingthis,inadditiontoaresponsetoeconomicpressuretoreducecostsincludingofficespaceandoperatingcosts.176Studiesrevealthatmorethantwo-thirdsofworkerswhoutiliseFWPindicatethatworkingflexiblyenablesthemtoworkmoreintently,exercisinggreaterintensiveandextensiveeffort.177
Additionalfirm-levelresearch178hasindicatedthatemployers’enthusiasmforFWPisoftenbalancedbyamore‘cautious’approachfromemployerswhoseektoensurekeyelements
169Gordon,C.,etal.(2015).FlexibleSmallFirms?WhySomeSmallFirmsFacilitatetheUseofFlexibleWorkplacePolicies.CanadianJournalofSociology.Vol.40(1);pp.1-24.
170Marshall,K.(2006).Converginggenderroles.PerspectivesonLabourandIncome.Vol7(7);pp5-17.171https://yougov.co.uk/news/2015/10/20/30-uk-office-workers-are-more-productive-when-work/172Gatzlaff,K.,M.,andMcCullough,K.,A.(2010).TheEffectofDataBreachesonShareholderWealth.RiskManagementandInsuranceReview.Vol:(13)1;pp:161–83.
173Morarresearchof8,000firmsin10countries:http://www.vodafone.com/business/global-enterprise/vodafone-study-75-percent-of-global-companies-leverage-flexible-working-policies-2016-02-08
174Gordon,C.,etal.(2015).FlexibleSmallFirms?WhySomeSmallFirmsFacilitatetheUseofFlexibleWorkplacePolicies.CanadianJournalofSociology.Vol.40(1);pp.1-24.
175Gordon,C.(2014).FlexibleWorkplacePractices:Employees'ExperiencesinSmallITFirms.RelationsIndustrielles/IndustrialRelations.Vol(69)4 ;pp766-784.
176Vance,C.M.,andPaik,Y.(2015).ManagingaGlobalWorkforce.Routledge.177Kelliher,C.,andAnderson,D.(2010).Doingmorewithless?Flexibleworkingpracticesandtheintensificationofwork.HumanRelations.Vol63(1);pp83-106.
178LSEResearchwithin20firmsforthisstudyfromdiscussionswithCOOs,CFOs,CEO,andHRHeads,andfrommanagementpracticesstudies2007-2016includingothermanagersandemployeesfrom50organisationsintotalfrom4regions:UK,US,EU,AsiaPac/India.

45
areaddressed.Graph24depictsthetopfivebenefitsflaggedbyemployeesandthetopfivefactorsflaggedbyemployerswhenimplementingaworkfromhome(WFH)strategy.
Graph24:Topfiveworking-from-homeissuefromemployersandemployees.Source:LSEresearch2012-2016.179
TheprimaryfactordrivingemployeestoseekWFH,whereitisnotmandatedbyanorganisation,iswork-lifebalance,withover95%ofemployeessampledindicatingthis.Theresultsarecongruentwithotherresearchthathighlightsthepriorityofthisconsiderationformanyincludingyoungerworkers.180Millennialspresentopportunitiesandchallenges:theyaredigitallyveryactive;rapidlybroadcasttheirviews,moodsandemotionsonline;believethat‘theycandoanything’;havethemostacceleratedlife-cycleexpectationsofanysegment;andarethemostproficientwithmultipledigitaltools.181Thelackofcommutingtime,greaterproductivityandfewerdistractions,allcomprisebenefitscitedbyemployeesforFWP.182Theconcernsofemployerswerearoundsecurity(90%);technologicalrequirements(88%);monitoringofdata,emails,andotherinformationbeingexchangedbetweenthefirmandremoteworker(85%)despiteacknowledgementbymanythata“loggedinemployeeislikehe/sheishere”;andtherequirementtoensuretheemployeeis‘visible’whenloggedinandworking(80%),withchallengesperceivedinschedulingmeetingswhenattendanceisrequiredinperson(68%).Becauseofthesesociallyspurredchanges,acomplementaryleveloftechnologicalchangehasbeenoccurringasorganisationsadopt‘empowering’optionsthatenableemployeesto
179Ibid180McDonald,&Hite.(2008).Thenextgenerationofcareersuccess:ImplicationsforHRD.AdvancesinDevelopingHumanResources.Vol:10(1);pp:86-103.
181Ibid.182Nicklin,J.M.,etal.,(2010).Flexibleworkarrangements,jobsatisfaction,andturnoverintentions:themediatingroleofwork-to-familyenrichment.JournalofPsychology.Vol:144(1):pp:61-81.
Employee
Employer

46
accessEnterpriseelementsagnosticoflocation.183The‘alwayson’organisationismeetingthe‘alwaysavailable’digitalgeneration,withpotentialbenefitsaccruingtobothifthisunionismanagedappropriately.WithoverhalfoftheUKpopulationabletoworkremotely,organisationshavebeenaddressingtheorganisational,culturalandtechnicalimpedimentstoworkingfromanywhere,withresultinganestimated4millionpeopleoutofaworkingpopulationof30millionnowdoingso.184
6.2 BenefitsofFlexibleWorkforcePractices
Flexibleworkforcepracticeshavebeenshowntogenerateanumberofbenefitsforemployeesthatcanleadto:highemployeesatisfaction;jobsatisfaction;185work-lifeenhancements;andimprovedpersonalandorganisationalefficiencyintheprocess.186Productivitycanbelinkedtoemployees‘feelingmorecontent’;187‘happier’andimprovingtheirwell-being.188Collectively,thesefactorshavebeenshowntoincreaseemployeeproductivityby10-12%,189whenfacilitatedbyappropriatemanagementpractices.190Afurtherbenefitcitedforthegreateruseofflexibleworkingpracticesisreducedabsenteeismduetoemployeehappinessandjobsatisfaction.191Thecurrentlyestimatedcostof£30ktoreplaceaUKworker(£25kforlossofoutputand£5kcostofanewworker)equals£4.13billionperannumtotheUKeconomy192,withsomeofthiscostreducedthroughgreaterretentionofemployees.Flexibilityhasbeenfoundtobeakeyfacilitator‘enriching’theemployeewhointurncandirectapositiveinfluenceintheorganisationandcarrythisovertotheirpersonallivesandintheprocess,displayalowerabsenteeismandturnover.193Anoverarchingorganisationalcomponentofflexibleworkingpracticesistheculturecreatedtheorganisationhasaninterestinthewell-beingofitsemployees194andisinclusive.195In2012,theGovernmentlaunchedits‘AnywhereWorking’initiativebeforetheLondonOlympicswhichprovidedcasestudiesandadviceonhomeworking.183Suprateek,S.etal(2012).Managingemployees'useofmobiletechnologiestominimizework-lifebalanceimpacts.MISQuarterlyExecutive.Vol11(4);pp.143-157.
184CarbonTrust.(2015). Homeworking:helpingbusinessescutcostsandreducetheircarbonfootprint.185Bockerman,P.,andIlmakunnas,P.(2012).TheJobSatisfaction-ProductivityNexus:AStudyUsingMatchedSurveyandRegisterData.Industrial&LaborRelations;Vol65(2);pp244-262.
186Shah,A.(2014).InternalMarketing'sEffectsonEmployeeSatisfaction,Productivity,ProductQuality,ConsumerSatisfactionandFirmPerformance.AmericanJournalofManagement.Vol(14)4;pp:33-39.
187VanderVoordt,T,J,M.(2004).Productivityandemployeesatisfactioninflexibleworkplaces.JournalofCorporateRealEstate.Vol:6(2);pp:133-148.
188Oswald,A.J.,etal.(2014).HappinessandProductivity.JournalofLaborEconomics.Vol:33(4);pp:789-822.189Ibid.190Harjo,E.B.,etal(2012).TheImpactofManagementPracticesonPassion,IntellectualCapital,Engagement,andPerformanceofEmployees.EuropeanConferenceonIntellectualCapital:86-XIV.
191Balmforth,K.,andGardner,D.(2006).Conflictandfacilitationbetweenworkandfamily:Realizingtheoutcomesfororganizations.NewZealandJournalofPsychology.Vol:35(2);pp:https://www.carbontrust.com/media/507270/ctc830-homeworking.pdf69–76.
192OxfordEconomics.(2014).TheCostofBrainDrain-Understandingthefinancialimpactofstaffturnover.193Wayne,J.H.,etal.(2007).Work–FamilyFacilitation:Atheoreticalexplanationandmodelofprimaryantecedentsandconsequences.HumanResourceManagementReview.Vol:17;pp:63–76.
194Grover,S.L.,andCrooker,K.J.(1995).Whoappreciatesfamily-responsivehumanresourcepolicies:Theimpactoffamily-friendlypoliciesontheorganizationalattachmentofparentsandnonparents.PersonnelPsychology.Vol:48;pp:271–289.
195Ryan,A.,M.,andKossek,E.,E.(2008).Work–lifepolicyimplementation:Breakingdownorcreatingbarrierstoinclusiveness?HumanResourceManagement.Vol:47;pp:295–310.

47
Combinedwithotherinitiativesaimedatreducingenergycostsforhomeowners,suchasreducedcommuting,lowerofficespaceandlessenergyconsumption,ithasbeenestimatedthattheconversionofafurther4millionUKemployeestoengageinworkingfromhomecouldsaveover3milliontonnesofcarbonemissionsperannumandreducecostsby£3billionintheprocess.196
Surveyresultsonflexibleworkingpracticesfrom8,000firmsin10countriescoveringSMEs,PublicSectorandmultinationalcorporatesin2015indicatedseveralperformance-relatedbenefitsofflexibleworkingpractices:197
• 61%ofrespondentssaidtheircompany’sprofitsincreased• 83%reportedanimprovementinproductivity;• 58%believedthattheirorganisation’sreputationhadbenefitspositivelyfromflexible
workingpractices.
Additionally,teamworkwasreportedtohaveimprovedin61percentofUSorganisationsadoptingflexiblepractices,with60%ofUSemployeesindicatingthatthesehadimprovedwork-lifebalance.Employeesin77%oftheseorganizationsalsoindicatedthatmoralehadincreasedbecauseofflexibleworkingpractices.198
6.3 AdoptingFlexibleWorkforcePractices:TechnologicalEnablersforProductivity
Whentheappropriateconditionsarepresenttofosterflexibleworkingpractices,productivityandotherorganisationalattributessuchasemployeejobsatisfaction;happiness;enthusiasmcanimprove.199Sometechnologiespermitengagementtobeestablishedforremoteflexiblework(primaryenablingcomponents)whilstothersfacilitatetherequiredfirm-levelcontrols(secondarycomponentssuchas;security;integration,andothers).200PrimaryfactorsareembeddedinthreetechnologiesthatpermitConnecting,CommunicatingandCollaborating:201
(i) Connecting:Threeprincipalenablingtechnologiesareaavailableforremoteworking:[1]Broadband:Severalbroadbandoptionsareavailable,withthisaccessmodebeingakeyenablerforconnectivitytootherfunctionality:
1. Broadband:89%ofUKhouseholdshadinternetaccessin2016,202Greaterspeedsprovideenhancedworkingability,withslowerspeedsinsomeareas,oralackofconnectivityimpedingtheabilitytoutilisefixedbroadband.203
2. Mobile:Smartphonepenetrationis76%.2043. Othertechnologiesareaavailablebutusedtoalesserdegree:Satellite.
196https://www.carbontrust.com/media/507270/ctc830-homeworking.pdf197MorarResearch:http://www.vodafone.com/business/global-enterprise/vodafone-study-75-percent-of-global-companies-leverage-flexible-working-policies-2016-02-08
198Ibid.199Black,S.,andLynch,L.,M.(2006).HowtoCompete:TheImpactofWorkplacePracticesandInformationTechnologyonProductivity.TheReviewofEconomicsandStatistics. Vol.83(3);pp:434-445.
200http://www.ariadne.ac.uk/issue57/guy201Ibid.202http://www.ons.gov.uk/peoplepopulationandcommunity/householdcharacteristics/homeinternetandsocialmediausage/bulletins/internetaccesshouseholdsandindividuals/2016#household-internet-access
203http://www.ippr.org/files/publications/pdf/unbuffering-business_Oct2016.pdf?noredirect=1204http://www.mobilenewscwp.co.uk/2016/03/10/gfk-uk-smartphone-market-is-bucking-the-trend/

48
[2]VirtualPrivateNetwork:Requiresaconnection,andestablishestheconnectingdeviceasanextensionofthenetworkbeingconnectedto.
[3]Wireless:Wi-Fiaccessalsoprovidestheabilityfornetworkaccess.
(ii) CommunicatingTechnologies:Multiplemodesofcommunicatingexist:1. Email2. Telephony3. OnlineChat4. VirtualMeetings5. FileTransfer6. VoiceoverInternetProtocol(VOIP)
(iii) CollaborationTechnologies:Numerousmodesofcommunicatingexist:
1. Wikis2. SocialNetworkinge.g.Facebook(workplaceversion)3. SharedApplicationse.g.CollaborativedynamicnetworksincludingOffice365,
Yammer,GoogleDocs,andWebchat
Tobesuccessful,thesefactorsneedtobeembeddedinawiderorganisationalenvironmentthatoffersworkersandthefirmseveralelements:
• Support:24x7oftenforemployeesfacingIToraccessorrelatedissues• Security:Numeroussecurityconsiderationsneedtobefactoredinenablingremote
accesssuchasfirewalls;encryption;best-practicespasswordpoliciesandothersthatcanbereadilyandeasilyappliedincludingbyindividualsandSMEs.
• Integration:Theorganisation,largeorsmall,mustsuccessfullyintegrateitscommunicationtechnologiestothedegreerequiredtoeffectaccessthatpermitsemployeestoundertaketheirrolesseamlesslywhilstprovidingtheappropriatetracking,reporting,databaseelements(tovalidateusersandmaintainactiverepositoriesoftheirstatus),andotherfunctions.

49
Conclusion
TheUKischaracterisedbydifferingproductivityacrossregions.Whilstitisdifficulttoprovidespecificcontributoryexplanationsregionbyregion,researchhashighlightedsomebroaderelementsthatcouldaffectregionalproductivityvariationsincludingaccesstolargecities,commutingtimesandskills.Theseprovideabackdroptomoregranularfactorsthatareagnosticoflocation:howindividualfirmsarerun.Thisisthekeythatcanunlockthepotentialofassetsandintheprocess,enhanceproductivity.Asoutlinedthroughoutthisreport,productivityhasthepowertotransform.TheUK’slaggingproductivitytoG7andotherEuropeancountriesoffersanopportunitytomakeincrementalchangesatboththemicroandmacrolevel,assistedbypolicy,andimprovehowfirmsoperate.Researchspanningadecadeofdevelopment,collaborationbetweenleadingmanagement-studyorganisations,andfirm-levelinvestigationin35countriesand20,000interviewswithfirmmanagers,hasprovidedoneoftheonlybenchmarksforcodifyinggoodmanagementpracticesandtheopportunityforfirmstoreviewandaddressshortfalls.Managementpracticesareonecomponentofthejourneytounlockingthepowerofproductivitywithinthefirm:theyarethelever.Technologyadoptionisafurtherenablingmodethatifspurredbygoodpracticescanmaximisetheproductivepotentialwithinthefirm.Itisnotisolatedfromitssocioeconomicenvironmenthowever:itsemployees’outlookandworkethicreflectssocialandtechnicalinfluencingfactors.Theadventoftheinternet,digital,andmobiletechnologieshasdisruptedpreviouswork-lifeparadigmsandusheredanewgenerationofexpectations,technologyadoptionandoutlook.Organisationshavebeenrespondingwithmoreflexibleworkingpracticesthatutiliseconnecting,communicatingandcollaborativetechnologies.Threestepstounlockingproductivity:
(1)Enhancingmanagementpractices:Theproductivity-enhancingbenefitsofmanagementpracticescanincreasefirmproductivitybothwhenappliedalone,butinanoptimalmannerwhenaddressedwithtechnologyadoption(2)IncreasedadoptionofICT:TheuseofICTtoenhanceproductivity,andinparticular,mobilebroadbandconnectivityvia3Gand4GbothforEnterpriseaccessandforSMEandsoletraderuse‘inthefield’isakeyareaofopportunityforUKbusinesses.Socialandtechnologicalchangescontinuetospuradigitallyawareandmobileworkforceandconsumersalikewhocanadoptastep-changeinEnterprisefunctionality.205Thisextendstothepublicsectorwheretheadoptionof‘connected-ICT’viamobilebroadbandamongstPoliceandEmergencyServiceshasbeenusheringnewlevelsofproductivity.206(3)Workforceflexibility:Whencombinedwithfacilitatingelementssuchasmanagementpractices(empoweringworkerflexibility)andremotedigitalandmobileservicesandapplications,flexibleworkforcecanimprovepersonalwork-lifebalance,create‘happier’employeesandimproveorganisationalproductivity.207205Lee,S.B.,etal.(2016)Technostressfrommobilecommunicationanditsimpactonqualityoflifeandproductivity.TotalQualityManagement&BusinessExcellence.Vol:(27)7-8;pp:775-790.
206http://www.gsma.com/spectrum/wp-content/uploads/2014/09/Impact_of_Mobile_Broadband_in_Egypt_v100.pdf
207Shah,A.(2014).InternalMarketing'sEffectsonEmployeeSatisfaction,Productivity,ProductQuality,ConsumerSatisfactionandFirmPerformance.AmericanJournalofManagement.Vol(14)4;pp:33-39.

50
Maximisingthepowerofproductivityrequiresalignmentbetweenkeycomponents:managementpractices;technology;flexibleworkingarrangements.Locationcanprovideadditionalfactorsforconsiderationattheregionallevelbutultimately,researchhasconfirmedthatproductivityenhancementmuststartwithhowthingsaredonetoaddresswhytheymightnotbeoptimal.Businessesfaceaclimateofunprecedentedchange–fromdemographicshiftswiththemulti-generationalworkforce,toincreasingtechnologicalchangeandafast-evolvingbusinessandconsumerlandscape.Assessmentofafirm’smanagementpracticesleadingtoaregularcycleofreview,coupledwithhowthefirmisintegratingtechnologyandworkforcemanagementpolicies,iscriticaltooptimisingperformance.Thekeytounlockingthepowerofproductivitymaybelessofa‘key’andmoreofa‘combinationnumber’.