the physical state of forest cover and … gordon tanui and christopher k. saina university of...
TRANSCRIPT

European Journal of Agriculture and Forestry Research
Vol.6, No.1, pp.37-49, February 2018
___Published by European Centre for Research Training and Development UK (www.eajournals.org)
37
ISSN: 2054-6319 (Print), 2054-6327(online)
THE PHYSICAL STATE OF FOREST COVER AND LAND USE IN KENYA: A
CASE OF NANDI HILLS FORESTS IN NANDI COUNTY, KENYA
Julius Gordon Tanui and Christopher K. Saina
University of Eldoret, Eldoret, Kenya
ABSTRACT: The Nandi Hills and Forests in the Nandi County are major water catchments
for the Lake Victoria. However, these resources have faced significant decline and
degradation in recent times, thereby impacting the hydrological quality and quantity in the
Lake Victoria Basin. This study was informed by the observed degradation of the Nandi Hills
and Nandi Forests, epitomized by the receding forest cover, drying up of previously
permanent streams, instances of mudslides and rock falls, and downstream flooding. This
paper sought to establish the state of and use of the Nandi Hills/Forests as water catchment
area in Nandi County, Kenya. The study adopted a mixed methodological design which
incorporated both qualitative and quantitative methodologies. The mixed methodological
approaches used in this study were the concurrent triangulation and nested/embedded
designs. A four-tier analysis was carried out once all the data had been coded and grouped.
The analysis covered three categories of the population in the study area; namely the
households, institutions and community groups, and analysis of Landsat images for change
detection. Analysis of the Landsat images revealed a grim state of the receding natural forest
cover. However the uptake of on-farm forestry by the locals is seen as a potential remedy for
the dwindling forest cover.
KEYWORDS: Land Cover, Land Use, Nandi Hills/ Forests, Water Catchment, ecosystem
services, Water towers.
INTRODUCTION
Forests serve diverse ecological functions and provide numerous environmental and socio-
economic benefits to society (Food and Agriculture Organization [FAO], 2009). The
continuous monitoring of the state of forest cover is essential in estimating forest loss or its
increase in order to take any appropriate actions to counter any loss of forest cover. Despite
the importance of trees and forest resources to human existence and economic development,
current trends show that forest fragmentation, degradation, inadequate regeneration, and
mismanagement are threatening the supply of vital ecosystem services and provisions (Temu
& Ogweno, 2007).human livelihoods depend on forest ecosystems for its essential services
and any loss is a threat to human survival.
Land Cover
The Global Forest Resources Assessment 2005 (FAO, 2006) emphasized that forest area
provides the first indication of the relative importance of forests in a country or region. Forest
area is relatively easy to measure, and this variable has therefore been selected as one of the
48 indicators for monitoring progress towards the Millennium Development Goals agreed by
the United Nations (particularly Goal 7 – Ensuring environmental sustainability). The
structure and composition of forests are increasingly influenced by global phenomena such as
the presence of introduced species, climate change, and anthropogenic alterations of
European Journal of Agriculture and Forestry Research
Vol.6, No.1, pp.37-49, February 2018
___Published by European Centre for Research Training and Development UK (www.eajournals.org)
38
ISSN: 2054-6319 (Print), 2054-6327(online)
biogeochemical cycles (Newman, 1995; Vitousek et al., 1997; Simberloff, 2000; Dale et al.,
2001; Honnay et al., 2002). Major transformations of forest ecosystems have occurred or are
underway, in many cases resulting in substantial losses of timber values or commercial
extinction of valuable tree species, along with a reduction in native biodiversity (Liebhold, et
al., 1995; Laurance, 1999; Simberloff 2000; Hoekstra et al., 2005). In addition to global
influences, forests are also being shaped by regional and local forces.
Forests provide an array of economic resources, and different harvesting techniques are
prone to achieve manifold yields from the same environment. The incredibly robust
management techniques are those which shun open-access utilization of resources, through
tenure and usufruct mechanisms allowing for long-term and exclusive access by individuals
or communities (Caldecott et al., 1994). They continue to elaborate that where such
techniques have been embraced, the necessity for exterior intervention may be reduced to
technical counsel and monitoring, to guarantee sustainable harvests. Barring such harvesting
may lead to economic loss to the local people and trigger their antagonism. Alternatives in
such a case may comprise traditional utilization of segments inside conservation areas, buffer
zones bordering them, or community lands in a different place, which may all be accessible
for particular types of persistent exploitation by locals. Moreover, forests often experience the
cumulative and often fragmentary impacts of development stresses such as road-building, oil
and gas development, urban and suburban encroachment, and agriculture (Forman 2000;
Trombulak & Frissell, 2000; World Resources Institute, 2000; Schneider et al., 2003). This
combination of disturbance and developmental pressures can reduce biodiversity and
diminish the capacity of forests to continue providing ecological goods and services of the
same quantity and quality in perpetuity (Toman & Ashton, 1996; Costanza et al., 2000). In
response to these concerns, many ecologists have argued that resource managers should focus
on maintaining ecological resilience, defined here as the capacity of natural systems to absorb
disturbances without undergoing change to a fundamentally different state e.g., (Holling,
1973; Holling, 1986; Peterson et al., 1998).
Whenever a resource is exploited, several different interests are put into conflict. Two major
ones are economic interests and environmental interests. Economic factors are easy to
measure. The cost of exploitation and financial return for this expenditure are the primary
issues. The environmental viewpoint is often difficult to put into monetary terms and must
often rely on ethical and biological arguments to temper the economic arguments. Modern
forest management practices in many parts of the world involve a compromise between these
two points of view (Enger et al., 1992).
Global Forest Outlook
Data on the status of and trends in area of forest are crucial to decisions related to forest and
land-use policies and resource allocations, but they need to be combined with information on
the health and vitality of forests and their socio-economic and environmental functions and
values. FRA 2005 (FAO, 2006), points out that forests cover 30% of the total land area with
the total forest area in 2005 being just under 4 billion hectares (ha), corresponding to an
average of 0.62 ha per capita. However, the area of forest is unevenly distributed. For
example, 64 countries with a combined population of 2 billion have less than 0.1 ha of forest
per capita. The ten most forest-rich countries account for two-thirds of total forest area. Seven
countries or areas have no forest at all, and an additional 57 have forest on less than 10% of
their total land area.
European Journal of Agriculture and Forestry Research
Vol.6, No.1, pp.37-49, February 2018
___Published by European Centre for Research Training and Development UK (www.eajournals.org)
39
ISSN: 2054-6319 (Print), 2054-6327(online)
Africa accounts for just about 16.1% of the global forest cover which is around 0.64 million
ha. Although the tropics boast of the largest area under forest, they are faced with the largest
rate of deforestation (FAO, 2009). Forest loss caused by a complex set of social and
economic pressures is a concern, contributing to losses of biological diversity, degradation of
forests, and have contributed significantly to global warming (Glenday, 2006; Haili, 2007).
Among the major factors contributing to forest degradation are conversion of forests to
farmland and poor forest management, including inappropriate logging, forest fires, and
increased harvesting of wood fuels and other forest products for household use (Glenday,
2006; World Rainforest Movement [WRM], 2006).
Progress towards sustainable forest management in Africa appears to have been limited
during the last 15 years despite some indications that the net loss of forest area has decreased
and that the area of forest designated for conservation of biological diversity has increased
minimally and the continued, rapid loss of forest area (the largest of any region during this
15-year period) is particularly disconcerting (FAO, 2006).
Forest Status in Kenya
In Kenya, gazetted forests represent less than 2.5% of the total land area. The country has
about 37.6 million ha of natural woody vegetation outside forests, consisting of 24.8 million
ha of bush land, 10.8 million ha of wooded grassland and 2.1 million ha of woodland. A
further 9.54 million ha of woody vegetation is found on farmland and in settlements (Kenya
Forestry Department, 2001). Kenya’s closed canopy forests are estimated to cover 1.24
million hectares. This is just about two per cent of the country’s land area and these are
largely confined to the wetter, cooler parts of the country. According to Ogweno and Oduori
(2001), these forests can be classified into four types: (a) Coastal Forest (b) Afro-montane
forest comprising east and west mountain forests (c) Guineo-Congolan upland forests and (d)
the small outlier forests in dry zones, like the Kitui and Machakos hill tops and the Taita hills.
Also to be included here are forest patches in Western Kenya and Riverine forests. Recent
estimates, based on remote sensing, indicate that Kenya’s forest cover now stands at a critical
1.7 per cent (UNEP, 2001). This is against, the minimum international recommended forest
cover of 10 % (see figure 1).
European Journal of Agriculture and Forestry Research
Vol.6, No.1, pp.37-49, February 2018
___Published by European Centre for Research Training and Development UK (www.eajournals.org)
40
ISSN: 2054-6319 (Print), 2054-6327(online)
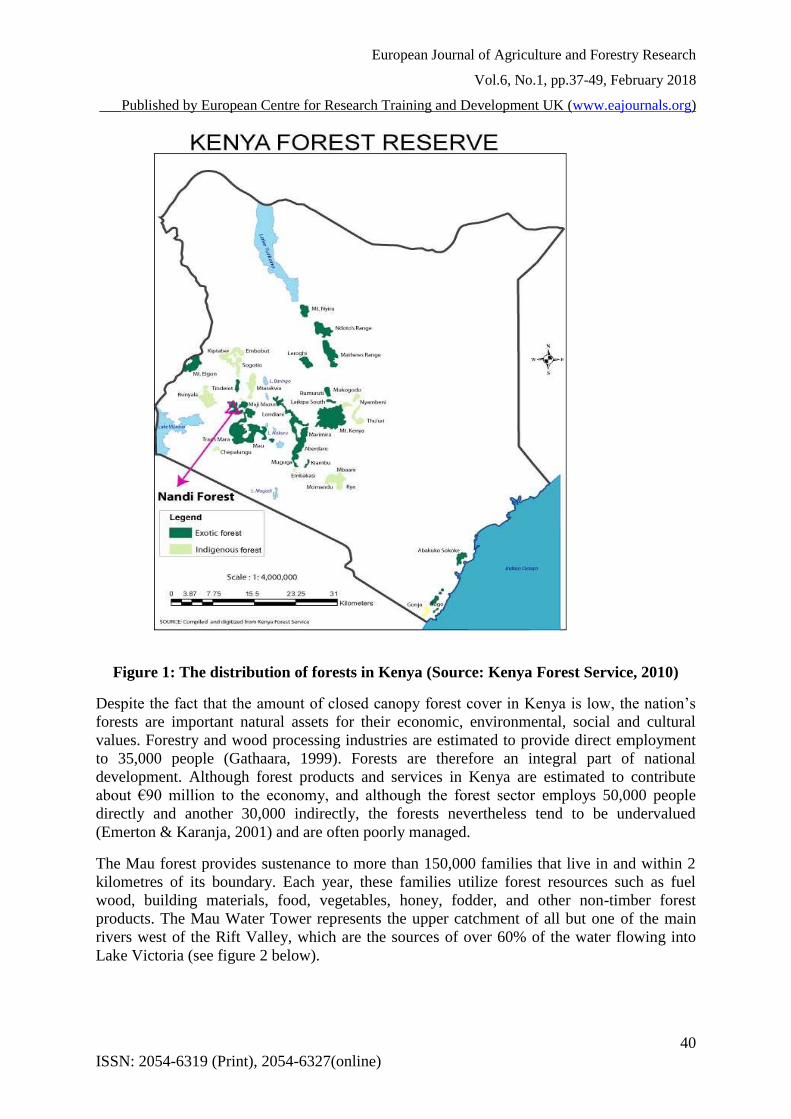
Figure 1: The distribution of forests in Kenya (Source: Kenya Forest Service, 2010)
Despite the fact that the amount of closed canopy forest cover in Kenya is low, the nation’s
forests are important natural assets for their economic, environmental, social and cultural
values. Forestry and wood processing industries are estimated to provide direct employment
to 35,000 people (Gathaara, 1999). Forests are therefore an integral part of national
development. Although forest products and services in Kenya are estimated to contribute
about €90 million to the economy, and although the forest sector employs 50,000 people
directly and another 30,000 indirectly, the forests nevertheless tend to be undervalued
(Emerton & Karanja, 2001) and are often poorly managed.
The Mau forest provides sustenance to more than 150,000 families that live in and within 2
kilometres of its boundary. Each year, these families utilize forest resources such as fuel
wood, building materials, food, vegetables, honey, fodder, and other non-timber forest
products. The Mau Water Tower represents the upper catchment of all but one of the main
rivers west of the Rift Valley, which are the sources of over 60% of the water flowing into
Lake Victoria (see figure 2 below).
European Journal of Agriculture and Forestry Research
Vol.6, No.1, pp.37-49, February 2018
___Published by European Centre for Research Training and Development UK (www.eajournals.org)
41
ISSN: 2054-6319 (Print), 2054-6327(online)
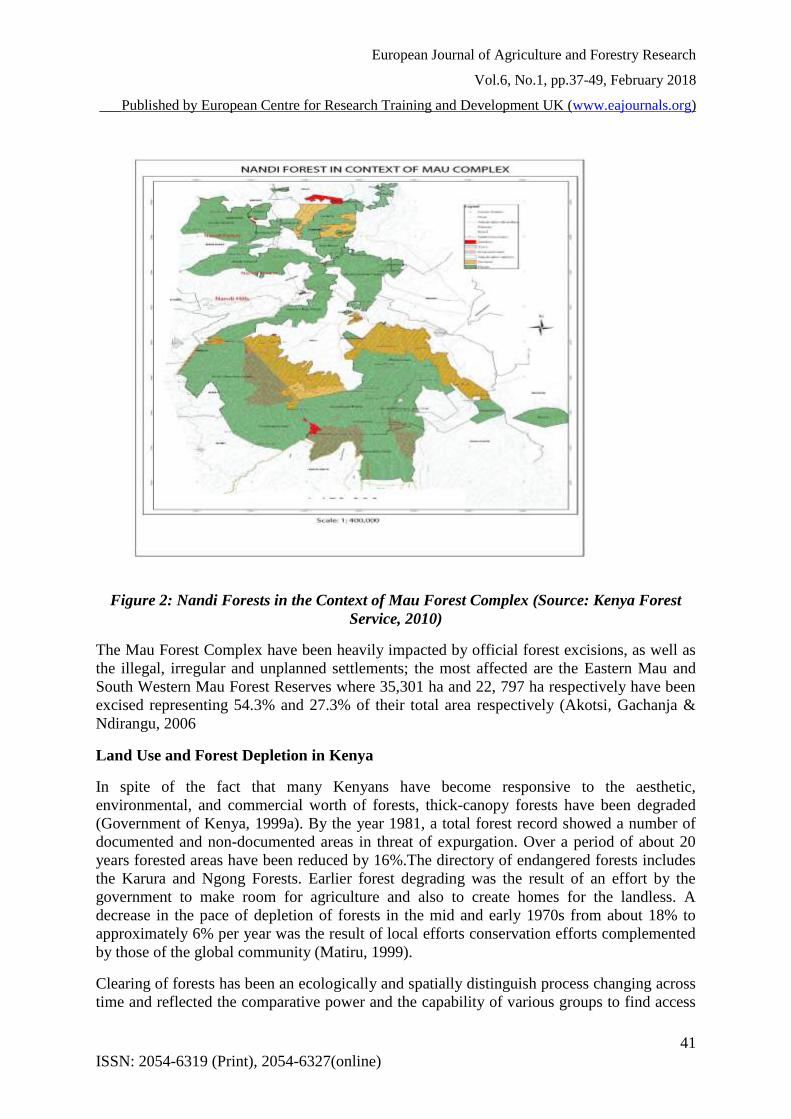
Figure 2: Nandi Forests in the Context of Mau Forest Complex (Source: Kenya Forest
Service, 2010)
The Mau Forest Complex have been heavily impacted by official forest excisions, as well as
the illegal, irregular and unplanned settlements; the most affected are the Eastern Mau and
South Western Mau Forest Reserves where 35,301 ha and 22, 797 ha respectively have been
excised representing 54.3% and 27.3% of their total area respectively (Akotsi, Gachanja &
Ndirangu, 2006
Land Use and Forest Depletion in Kenya
In spite of the fact that many Kenyans have become responsive to the aesthetic,
environmental, and commercial worth of forests, thick-canopy forests have been degraded
(Government of Kenya, 1999a). By the year 1981, a total forest record showed a number of
documented and non-documented areas in threat of expurgation. Over a period of about 20
years forested areas have been reduced by 16%.The directory of endangered forests includes
the Karura and Ngong Forests. Earlier forest degrading was the result of an effort by the
government to make room for agriculture and also to create homes for the landless. A
decrease in the pace of depletion of forests in the mid and early 1970s from about 18% to
approximately 6% per year was the result of local efforts conservation efforts complemented
by those of the global community (Matiru, 1999).
Clearing of forests has been an ecologically and spatially distinguish process changing across
time and reflected the comparative power and the capability of various groups to find access

European Journal of Agriculture and Forestry Research
Vol.6, No.1, pp.37-49, February 2018
___Published by European Centre for Research Training and Development UK (www.eajournals.org)
42
ISSN: 2054-6319 (Print), 2054-6327(online)
into Kenya’s forest resources (Emerton & Karanja, (2001). Between the years 1990 and 1995,
the cover of forests changed by 17%, mainly as a result of the settlement of landless people.
Systematic analyses also show that a number of blocks of forests were illegally acquired by
the then land owners (Akotsi et al., 2006). Recently the decrease of forests through removal,
pressures in population and change in climate is approximately at about to 5,000 hectares
annually, while depletion through forest excisions and fires is estimated at almost 15,000
hectares each year (Government of Kenya, 1999a).
The case of Nandi County, Nandi Forests
Land cover change detection and its variations are required so as to comprehend global
change in environment. Of deep interests are the impacts of rain forest in the tropics
ramifications which changes due to the extent and strength. The growth in ramification is
related either to human or natural sources (Geist & Lambin, 2001). Both biodiversity
influences are immensely important in the tropics (Gaston & Blackburn, 2000). The activities
of the East African BIOTA are presently concentrating on the Nandi Forest and its fragments
(Kohler, 2004). Retrieval of information about land cover change and therefore forest
ramification and disturbance is conducted for the larger area of Nandi Forest and connected
areas of forests. Here, the findings from satellite data form a chief contribution of processing
spatial-information for registering man-made influences on these forests through time. The
various ecological and/or biological subprojects of East African BIOTA allow investigation
of local variations in ecosystems and biodiversity in relation to global environmental change
(Kohler, 2004).
The forests of the Nandi District are on an escarpment of between 200m and 300m in
elevation. Recently, there has been a continuous debate on whether such islands of forests
would have become a wider area of forest if not they have been owned and managed by the
Guinean Congo rain forest (Kokwaro, 1988). These forests exist in one of the earth’s most
populated rural settings (Blackett, 1994) with an average population density of 600 per km2
on land which is vigorously used for home-based agriculture. The forest reserves play a
significant role in providing for their basic needs of local people such as building material
and firewood (Kokwaro, 1988). An increase in illegal and legal activities since colonial times
in the early 20th century to date have led to forest depletion and have resulted in only
relatively small patches of compact forests are remaining, with the much tampered with
Nandi Forest deemed to have decreased to only about 120 km² by the year 1980 (Kokwaro,
1988).
MATERIALS AND METHODS
The study employed a mixed methodological design which incorporated both qualitative and
quantitative methodologies. The mixed methodological approaches used in this study were
the concurrent triangulation and nested/embedded designs. A four-tier analysis was carried
out once all the data had been coded and grouped. The sample frame of the study is for
persons above 18 years in Nandi County and there was heterogeneity in the population in the
sample frame due to variety of issues such as: spacio-topographical exposure to the forests,
urbanization, intermarriages, migration, education levels and even economic statuses. Nandi
North forest is located within Nandi North District of the western parts of the Rift Valley
Province of Kenya. This forest lies on the edge of the Nandi escarpment about 5 km east of
European Journal of Agriculture and Forestry Research
Vol.6, No.1, pp.37-49, February 2018
___Published by European Centre for Research Training and Development UK (www.eajournals.org)
43
ISSN: 2054-6319 (Print), 2054-6327(online)
the Kakamega Forest. It stretches for more than 30 km from North to South and is no more
than 5 km wide for most of its length. The Nandi South forest falls within the Nandi South
District which was carved out of the greater Nandi in 2003 (Nature Kenya, 2009). Nandi
Hills is a highland area of lush green rolling hills at the edge of the Great Rift Valley in the
former Rift Valley Province of Kenya and is part of the once extensive Nandi South Forest.
To alleviate some of these causes of heterogeneity to the closest achievable extent, the
sampling units were hence delimitated based on the administrative boundaries (largely per
district and finely per division). All the districts (4 districts) in the Nandi County were
sampled. Relevant stakeholders (in the management of the Nandi Forests) other than the
mainstream local community were also purposively sampled to obtain data. The desired
sample size of households for simple random sampling was obtained from a formula as used
by Fisher et al (1998) which yielded a sample size of 306 respondents. Oral interview
schedules, questionnaires, Digital cameras and review of documented literature were used in
data collection.
RESULTS
Land Use in the Nandi Hills District of Kenya
A database on land use within the administrative boundaries of the Nandi District was
generated via GIS and Remote Sensing (Landsat images of 1994, 1999, 2003 and 2008,
thematic layers clipped from Kenya and Nandi District images that include forests and
vegetation), ground truthing (observations and photographs taken in the field from 2007 to
2010), questionnaires completed by members of the sample of households, and key informant
interviews.
Remote Sensing and GIS
Remote Sensing and GIS data were generated by obtaining Landsat images from the
Regional Centre for Mapping of Resources for Development in Nairobi. Broad classes of
land use/land cover were established and classified images of the land cover prepared
following the supervised classification criteria. These included: forest (areas under total forest
cover), shrubs (areas with continuous un-interrupted interrupted shrub cover), tea (areas with
total tea vegetation cover), grasslands (areas with continuous un-interrupted and interrupted
grass cover) and bare ground. The preliminary images interpretation was done in reference to
the five land use and/or land cover classes. These included land use land cover typologies
from 1994, 1999, 2003 and 2008 from the respective Landsat images. The results of
spatiotemporal variability in land use based on false colour composite Landsat images
prepared from the clipped bands 2, 3 and 4 of the 1994, 1999, 2003 and 2008 revealed the
variation in land cover and land uses within the study sites. PCA was undertaken for the
acquired images for purposes of change detection for the five classes of the training area.
Areas for supervised classification were computed using Idrisi Kilimanjaro GIS analysis area
computation software. This classification was carried out by prompting the software to run
GIS analysis for specific areas in the training site. During the supervised classification of the
satellite data for change detection, the analysis software was instructed to adhere to the earlier
created land use classes. The preliminary images interpretation was done in reference to the
five land use and or land cover classes (created during the initial interpretation). These

European Journal of Agriculture and Forestry Research
Vol.6, No.1, pp.37-49, February 2018
___Published by European Centre for Research Training and Development UK (www.eajournals.org)
44
ISSN: 2054-6319 (Print), 2054-6327(online)
included land use land cover typologies from 1994, 1999, 2003 and 2008 from the respective
Landsat images (the classes were created based on observers’ own image interpretation
skills).
The resultant Landsat images for detection of changes of different land uses and land cover
classes in the study area are presented below (processed Landsat satellite images of 1994,
1999, 2003 and 2008 in Figures 3, 4, 5 and 6 respectively).
Figure 3: Processed Landsat image of the study area (1994)
Figure 4: Processed and analyzed Landsat image of the study area (1999)

European Journal of Agriculture and Forestry Research
Vol.6, No.1, pp.37-49, February 2018
___Published by European Centre for Research Training and Development UK (www.eajournals.org)
45
ISSN: 2054-6319 (Print), 2054-6327(online)
Figure 5: Processed Landsat image of the study area (2003)
Figure 6: Processed Landsat image of the study area (2008)
European Journal of Agriculture and Forestry Research
Vol.6, No.1, pp.37-49, February 2018
___Published by European Centre for Research Training and Development UK (www.eajournals.org)
46
ISSN: 2054-6319 (Print), 2054-6327(online)
The total area covered by each of the five land use/land cover types in 1994 and 2008 as
mapped from the Landsat satellite images, as well as the changes that were calculated by
subtracting the sum of the areas of each cover class in 2008 from their corresponding areas in
2003, 1999 and 1994, are summarized in Table 1 below.
Table 1: Representation of the spatiotemporal variation in land use between 1994 and
2008
Land use / Land
cover Class
1994 Area
(km2)
1999 Area
(km2)
2003 Area
(km2)
2008 Area
(km2)
Forest 51.3477 42.8328 63.9441 42.1317
Shrubs 26.2089 37.0593 28.8207 31.0905
Tea 15.7302 32.7798 25.3332 25.4745
Grassland 23.6512 23.4234 17.4258 29.9916
Bare ground 31.1589 12.0006 12.5721 19.4085
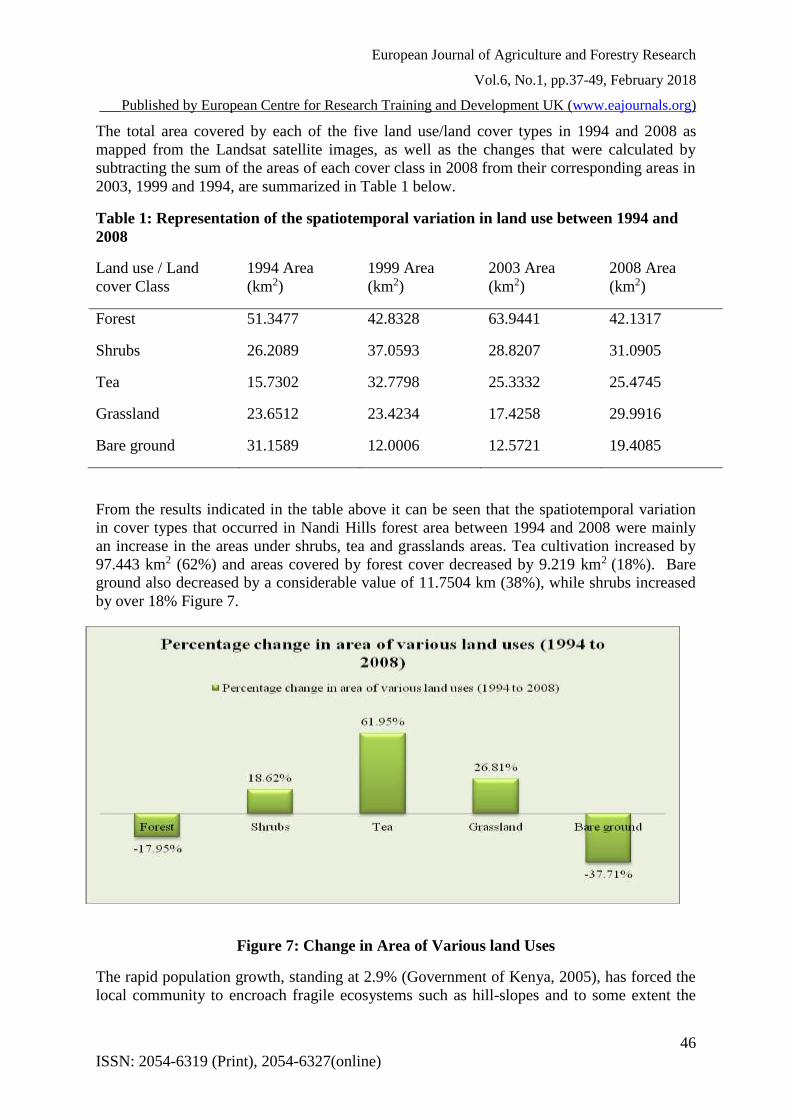
From the results indicated in the table above it can be seen that the spatiotemporal variation
in cover types that occurred in Nandi Hills forest area between 1994 and 2008 were mainly
an increase in the areas under shrubs, tea and grasslands areas. Tea cultivation increased by
97.443 km2 (62%) and areas covered by forest cover decreased by 9.219 km2 (18%). Bare
ground also decreased by a considerable value of 11.7504 km (38%), while shrubs increased
by over 18% Figure 7.
Figure 7: Change in Area of Various land Uses
The rapid population growth, standing at 2.9% (Government of Kenya, 2005), has forced the
local community to encroach fragile ecosystems such as hill-slopes and to some extent the
European Journal of Agriculture and Forestry Research
Vol.6, No.1, pp.37-49, February 2018
___Published by European Centre for Research Training and Development UK (www.eajournals.org)
47
ISSN: 2054-6319 (Print), 2054-6327(online)
forest ecosystem including wetlands. Coupled with rapid urbanization, the immigration of
foreign communities into the area has diluted the cultural stimulus of the native community,
which has provided the driving factor for the effective management of the Nandi Hills
Forests. Nevertheless, formal environmental approaches have attempted to re-energize
effective
As noted earlier, two thirds of the forest communities is aware of the existence of the forests
and have proximal knowledge of changes to the forest ecosystem, information on the reality
of their progressive destruction or conservation still remains a vital aspect that requires
attention. It is for this reason that an extensive GIS database was generated in this study and
maps were draw to illustrate spatiotemporal variations in land use in the water catchments
regions of Lake Victoria in the Nandi District of western Kenya.
CONCLUSION
It was found that the forest cover of Nandi Forest has suffered severe deforestation and
degradation through heavy exploitation resulting from an escalating demand for timber and
fuel wood, land for cropping and grazing. The depletion and degradation of the Nandi Forest
was found to be a threat to ecosystem diversity and a fundamental influence on the declining
standard of living of many households.
RECOMMENDATION
It is important to explore both the observable and perceived impacts of land use change; how
both perceived and observable impacts differ across different types of socio economic classes
and proximity to forest ecosystems and the reasons views may differ across groups on the
utilization practices of forest resources. This will help in further disaggregating the awareness
creation mechanisms relevant to the various cohorts or socioeconomic classes of the
community. There’s need to take appropriate actions to stop the deforestation and
degradation that was found to be rampant in the area in order to ensure that the ecosystem
diversity is maintained and even improved.
REFERENCES
Akotsi, E., Gachanja, M. & Ndirangu, J. (2006). Changes in the Forest Cover in Kenya’s
Five Water Towers, 2003-2005. Nairobi: Department of Resource Surveys and Remote
Sensing.
Blackett, H. L. (1994). Forest Inventory Report of the Mathews Range Forest Reserve. 8, 1-
14. Nairobi: Kenya Indigenous Forest Conservation Programme (KIFCON).
Caldecott, J. O., Jenkins, M. D., Johnson, T. & Groombridge, B. (1994). Priorities for
Conserving Global Species Richness and Endemism. Cambridge, UK: World
Conservation Press.
Costanza, R., Daly, M., Folke, C., Hawken, P., Holling, C.S., Mcmichael, A.J., Pimentel, D.,
& Rapport, D. (2000). Managing our Environmental Portfolio. Bioscience, 50,149–155.
European Journal of Agriculture and Forestry Research
Vol.6, No.1, pp.37-49, February 2018
___Published by European Centre for Research Training and Development UK (www.eajournals.org)
48
ISSN: 2054-6319 (Print), 2054-6327(online)
Dale, V.H., Joyce, L.A., Mcnulty, S., Neilson, R.P., Ayres, M.P., Flannigan, M.D., Hanson,
P.J., Irland, L.C., Lugo, A.E., Peterson, C.J., Simberloff, D., Swanson, F.J., Stocks,
B.J., & Wotton, B.M. (2001). Climate Change and Forest Disturbances. Bioscience, 51,
723–734.
Emerton, L., & Karanja, F. (2001). Valuation of Forest Resources in East Africa. Nairobi,
Kenya: African Centre for Technology Studies (ACTS) and World Conservation Union
(IUCN) Eastern Africa Regional Office (EARO).
Enger, D. E., & Smith, B. F. (1992). Environmental science: A study of interrelationships.
(4th Ed). Washington DC, USA: Brown Publishers.
Food and Agriculture Organization. (2006). Global forest resources assessment 2005:
Progress Towards Sustainable Forest Management. FAO Forestry Paper No. 147.
Rome, Italy: UN Food and Agriculture Organization, FAO.
Food and Agriculture Organization. (2009). State of the World’s Forests 2009. Rome, Italy:
UN Food and Agriculture Organization, FAO.
Forman, R.T.T. (2000). Estimate of the area Affected Ecologically by the Road System in the
United States. Conservation Biology, 14, 31–35.
Gaston, K. J., & Blackburn, T. M. (2000). Pattern and processes in macroecology. Oxford:
Blackwell Scientific.
Gathaara, G. (1999). Aerial Survey of the Destruction of Mt Kenya, Imenti and Ngare Ndare
Forest Reserves. Nairobi: Kenya Wildlife Service (KWS).
Geist, H.J & Lambin, E.F. (2001). What Drives Tropical Deforestation? LUCC Report Series
No. 4. CIACO: Louvain-la-Neuve.
Glenday, J. (2006). Carbon Storage and Emissions Offset Potential in an East African
Tropical Rainforest. Forest Ecology and Management, 235, 72-83.
Government of Kenya (1999a): The Forestry Master Plan for Kenya. Ministry of
Environment and Natural Resources. Nairobi: Government Printer.
Government of Kenya. (2005). Nandi District Strategic Plan 2005 - 2010 for the
Implementation of National Population Policy for Sustainable Development. Nairobi:
National Coordination Agency for Population and Development (Ministry of Planning
and National Development
Hoekstra, J. M., Boucher, T. M., Ricketts, T. H., & Roberts, C. (2005). Confronting a Biome
Crisis: Global Disparities of Habitat Loss and Protection. Ecology Letter, 8, 23–29.
Holling, C. S. (1986). The Resilience of Ecosystems: Local Surprise and Global Change. In
W.C. Clark & R.E. Munn (eds) Sustainable Development of the Biosphere (pp. 292–
397. Cambridge, UK: Cambridge University Press.
Holling, C.S. (1973). Resilience and stability of ecological systems. Annu. Rev. Ecology
Evolution, 4, 2–23.
Honnay, O., Verheyen, K., Butaye, J., Jacquemyn, H., Bossuyt, B., and Hermy, M. (2002).
Possible effects of habitat fragmentation and climate change on the range of forest plant
species. Ecology Letter, 5, 525–530.
Kenya Forest Working Group/East African Wildlife Society. (2001). Forest excision in
Kenya and their Impacts. Nairobi: UNEP.
Kohler, W. (2004). Aspects of international fragmentation. Review of International
Economics, 12 (5), 793-816.
Kokwaro, J. O. (1988). Conservation Status of the Kakamega Forest in Kenya: The
Easternmost Relic of the Equatorial Rainforests of Africa. Monographs in Systematic
Botany (Missouri Botanical Garden), 25, 471-489.
Laurance, W.F. (1999). Reflections on the Tropical Deforestation Crisis. Biological
Conservation, 91, 109–117.

European Journal of Agriculture and Forestry Research
Vol.6, No.1, pp.37-49, February 2018
___Published by European Centre for Research Training and Development UK (www.eajournals.org)
49
ISSN: 2054-6319 (Print), 2054-6327(online)
Liebhold, A. M., Macdonald, W. L., Bergdahl, D., & Maestro, V. C. (1995). Invasion by
Exotic Forest Pests: A Threat to Forest Ecosystems. Forest Science, 41, 1-49.
Matiru, V. (Ed.). (1999). Forest Cover and Forest Reserves in Kenya: Policy and Practice.
Nairobi: Kenya Forest Working Group.
Newman, E.I. (1995). Phosphorus inputs to terrestrial ecosystems. Journal of Ecology, 83,
713–726.
Ogweno, D. O. & P. O. Odwori. (2001). Modeling forest plantation development in Kenya.
Discovery and innovations, (Special Edition), 2001.
Peterson, G. D., Allen, C. R., & Holling, C. S. (1998). Ecological resilience, biodiversity, and
scale. Ecosystems, 1, 6–18.
Schneider, R. R., Stelfox, J. B., Boutin, S., & Wasel, S. (2003). Managing the cumulative
impacts of land uses in the Western Canadian Sedimentary Basin: A modelling
approach. Conservation Ecology, 7(1), 8. Available online at:
http://www.ecologyandsociety.org/vol7/iss1/art8/print.pdf
Simberloff, D. (2000). Global Climate Change and Introduced Species in United States
Forests. Science and Total Environment, 262, 253–261.
Temu, A., & Ogweno, D. (2007). Global Forestry Education Guidance and Monitoring: how
Imperative is it? In A. Temu, A. Kiwia, J. Kaboggoza, J. Kung’u, S. Chamshama, & B.
Chikamai (Eds.), New Perspectives in Forestry Education. Nairobi, Kenya: World
Agroforestry Centre (ICRAF).
Toman, M. A., & Ashton, P. M. (1996). Sustainable Forest Ecosystems and Management: A
Review Article. Forest Science, 42, 366–377.
Trombulak, S.C., & Frissell, C. A. (2000). Review of Ecological Effects of Roads on
Terrestrial and Aquatic Communities. Conservation Biology, 14, 18–30.
United Nations Environment Programme (2001). An Assessment of the Status of the World’s
Remaining Closed Forests. Nairobi: UNEP/DEWA/TR 01-2.
Vitousek, P. M., Aber, J. D., Howarth, R. W., Likens, G. E., Matson, P. A., Schindler, D. W.,
Schlesinger, W. H., & Tilman, D. G. (1997). Human Alteration of the Global Nitrogen
Cycle: Sources and Consequences. Ecological Application, 7, 737–750.
World Rainforest Movement. (2006). Excessive paper consumption: The Impacts of
Injustice. World Rainforest Movement (WRM) bulletin No. 109. Retrieved June 12,
2011, from http://www.wrm.org.uy/bulletin/
World Resources Institute (2000). Canada’s Forests at a Crossroads: An Assessment in the
Year 2000. Washington, D.C: World Resources Institute.