the philippines - fao
TRANSCRIPT

225
The Philippines
Westley R. RosarioBureau of Fisheries and Aquatic ResourcesDagupan, PhilippinesE-mail: [email protected]
Rosario,W. R. 2008. The Philippines. In A. Lovatelli, M.J. Phillips, J.R. Arthur and K. Yamamoto (eds). FAO/NACA Regional Workshop on the Future of Mariculture: a Regional Approach for Responsible Development in the Asia-Pacific Region. Guangzhou, China, 7–11 March 2006. FAO Fisheries Proceedings. No. 11. Rome, FAO. 2008. pp. 225–240.
INTRODUCTIONFor the past several years, aquaculture has dominated the fisheries sector and is considered at the forefront of the government’s food security and poverty alleviation programmes. Seaweeds and milkfish are the top-two commercially important species produced from aquaculture. Other species are tilapia, grouper, siganids and mussels.
With the vast growing population of the country, the need to expand aquaculture areas is obvious, from the traditional freshwater and brackishwater ponds to marine farming in fish pens and cages. The increasing volume of produce from cages compared to the modest production from fishponds has encouraged fish farmers to venture into deep-water-based or off-shore aquaculture enterprises.
The proliferation of fish pens and fish cages in shallow, narrow tributaries and rivers has resulted in occasional fish kills. These structures have obstructed the tidal flow of freshwater into brackishwater ponds, thereby affecting pond production in some areas. Moreover, polluted water caused by excessive feed inputs resulted to some extent in retardation in the growth of oysters. The continuous increase in the number of structures may also have contributed to siltation in aquaculture zones.
The establishment of mariculture parks is foreseen to play a significant role in solving these negative impacts. It also aims to promote zoning in municipal waters by delineating areas for mariculture and providing opportunities for marginal farmers to engage in off-shore fish-cage operation.
This paper will include information on the current status and challenges in the establishment of mariculture parks including the management concepts, legal mandates, organization, technical services offered, opportunities, constraints and issues.
OVERVIEW OF THE FISHERIES SECTORContribution to world productionIn 2003, the Philippines ranked eigth among the top fish-producing countries in the world, with a total production of 3.62 million tonnes of fish, crustaceans, molluscs and aquatic plants. The production constitutes 2.5 percent of the total world production of 146.27 million tonnes (FAO, 2004).
The Philippines aquaculture production of 0.459 million tonnes in 2003 was eleventh in the world, contributing 1.1 percent to the total global aquaculture production of 42.3 million tonnes and amounting to about US$600 million in terms of farm-gate value (FAO, 2004).
The Philippines is also the world’s second-largest producer of aquatic plants (including seaweeds), having produced a total of 0.989 million tonnes or nearly 8 percent of the total world production of 12 million tonnes (FAO, 2004).

The future of mariculture: a regional approach for responsible development in the Asia-Pacific region226
TABLE 1Five-year fish production trend, 2000–2004 (Source: bFAR, 2004)
YearQuantity(tonnes)
% Increase(Decrease)
Value(1 000 PHP)
% Increase (Decrease)
2000 2 993 332.00 2.38 98 622 134.00 6.82
2001 3 166 530.00 5.79 106 944 716.00 8.44
2002 3 369 524.00 6.41 113 258 218.00 5.90
2003 3 619 282.38 7.41 119 866 326.00 5.83
2004 3 926 173.36 8.48 138 846 377.29 15.83
Contribution to national economyIn 2004 the fishing industry contributed 2.3 percent and 2.4 percent to the country’s gross domestic product (GDP), equivalent to some PHP 111 billion and PHP 48 billion for current and constant prices, respectively (Table 1 and Figure 1).
The industry’s contribution to the Gross Value Added (GVA) in Agriculture, Fishery and Forestry Group is 14.9 percent (PHP 111 billion) and 21.6 percent (PHP 48.7 billion) out of the total PHP 742 billion and PHP 225 billion at current and constant prices, respectively. It has the largest share next to agricultural crops.
The fishing industry provided employment to a labour force of more than 1.6 million nation
wide (NSO 2002). Of the total labour force, 1.3 million are employed in the municipal fisheries, 226 195 in commercial fisheries and 16 497 in the aquaculture sector.
Performance of the fishing industryIn 2005, the total fisheries production reached 4.16 million tonnes (Table 2). In that year, the aquaculture sector provided the highest share of 45.5 percent, while commercial and municipal fisheries contributed 27.3 percent and 27.2 percent, respectively.
Total fisheries production grew from 3.17 million tonnes in 2001 to 4.16 in 2005. The average total annual production within the period 2001–2005 was 3.648 million tonnes.
From 2001 to 2005, the contribution of aquaculture to total fish production increased steadily from 38.5 percent in 2001 to 45.5 percent, for a five-year average contribution of 41.6 percent to the total production (Table 2). In comparison, commercial and municipal fisheries productions have similar contributions of about 30 percent and 29 percent, respectively, to the total fish production. Within the aquaculture subsector, production grew at an average rate of 11.6 percent per year between 2001 and 2005. The aquaculture growth rate in fish production in 2005 was a 10.4 percent increase over the year 2004.
TABLE 2 Volume (x1 000) of fish production by subsector, 2001–2005 (Source: bFAR, 2004 and preliminary data from bureau of Statistics)
YearTotal
production (tonnes)
Commercial Municipal AquacultureVolume(tonnes)
% ofTotal
Volume(tonnes)
% of Total
Volume(tonnes)
% of Total
Annual growth (%)
2001 3 166 976 30.8 969 30.6 1 221 38.5 10.8
2002 3 369 1 042 30.9 989 29.4 1 338 39.7 9.6
2003 3 619 1 109 30.6 1 055 29.2 1 454 40.2 8.6
2004 3 924 1 137 28.9 1 059 26.9 1 726 43.9 8.7
2005 4 163 1 135 27.3 1 132 27.2 1 895 45.5 10.4
Avg. 3 648 1 079.8 29.7 1 040.8 28.7 1 526.8 41.6 9.6

227Section 2 – Country experiences
Marine waters productionProduction in 2004 reached 23 542.35 tonnes in marine cages and 14 294.42 tonnes in pens. Commodities produced include milkfish, grouper and other marine species (Table 3 and Figure 2).
TABLE 3 Production (tonnes) from marine waters, 2004 (Source: bFAR, 2004)
Culture environment
Total Milkfish Grouper Others
Fishcage 23 542.35 23 179.06 136.45 226.84
Fishpen 14 294.42 14 172.61 33.69 88.12
Total 37 836.77 37 351.67 170.14 312.96
Brackishwater productionFor the year 2004, production from brackishwater fishponds was 253 848.52 tonnes, the bulk of which was the production of milkfish. Fish pens recorded a production of 4 499.50 tonnes, while fish cages added about 4 205.71 tonnes. Commodities from brackishwater production are milkfish, tiger prawn, white shrimp, endeavour prawn, tilapia and other species (Table 4 and Figure 3).
TABLE 4 Production (tonnes) from brackishwater, 2004 (Source: bFAR, 2004)
Culture environment
Total Milkfish Tiger prawn
White shrimp & endeavour
prawnTilapia Others
Fishpond 253 848.52 200 530.90 35 916.52 2 029.60 9 045.93 6 325.57
Fishcage 4 205.71 4 056.08 - - 115.90 33.73
Fishpen 4 499.50 4 388.30 - - 97.30 13.90
Total 262 553.73 208 975.28 35 916.52 2 029.6 9 259.13 6 373.20
Mariculture productionRegional production from mariculture yields a total of 1 235 761.09 tonnes. Seaweeds contributed the largest share of 97.5 percent. The rest is contributed by oysters and mussels, with percentage shares of 1.3 percent and 1.2 percent, respectively (Table 5). Regional production trend showed that the Autonomous Region in Muslim Mindanao (ARMM) remained the highest contributor of mariculture products, followed by Regions IV-B and IX, respectively (Figure 4).

The future of mariculture: a regional approach for responsible development in the Asia-Pacific region228
TABLE 5Production (tonnes) from mariculture by region and commodity, 2004 (Source: bFAR, 2004)
Region Total Oysters Mussels SeaweedsI 2 704.65 2 677.15 - 27.50
II 325.50 319.00 - 6.50
III 6 772.77 6 147.10 598.30 27.37
IV-A 30 008.44 343.44 4 227.00 25 438.00
IV-B 329 140.43 - - 329 140.43
V 17 748.99 47.02 735.17 16 966.80
VI 62 971.60 5 354.73 6 633.25 50 983.62
VII 83 594.05 187.94 - 83 406.11
VIII 16 213.00 2.00 2 840.00 13 371.00
IX 155 102.67 312.21 4.50 154 785.96
X 39 155.64 - - 39 155.64
XI 1 670.36 524.72 - 1 145.64
ARMM 472 514.80 - - 472 514.80
CommoditiesThe top three major aquaculture commodities are seaweeds, milkfish and tilapia (Table 6 and Figure 5). Seaweeds recorded the highest volume, constituting 70.2 percent of the total aquaculture production. Milkfish ranked second with a share of 15.9 percent, followed by tilapia with 8.5 percent. The rest contributed 5.4 percent.
TABLE 6Major species produced by aquaculture, 2004 (Source: bFAR, 2004)
Species Quantity (tonnes) Percent (%)Seaweeds 1 204 807.56 70.2
Milkfish 273 593.36 15.9
Tilapia 145 860.36 8.5
Others 92 757.38 5.4
Total 1 717 026.66 100
SeaweedsIn the Philippines, seaweed is the most valuable commodity produced from aquaculture. More than 800 species of seaweed have been recorded in the Philippines. The major commercial seaweeds are Eucheuma, Kappaphycus, Gracilaria and Caulerpa. Others include Codium, Gelidiela, Halymenia, Porphyra and Sargassum.
Production of seaweeds has continuously increased from 707 039 tonnes in 2000 to 1 204 808 tonnes in 2004. The yearly improvement in production can be attributed to high market demand, better prices and good weather conditions that encouraged farmers to expand their areas for seaweed culture.

229Section 2 – Country experiences
TABLE 7Seaweed production, 2000–2004 (Source: bAS and bFAR, 2005b)
YearProduction
(tonnes)2000 707 039
2001 785 795
2002 894 856
2003 988 888
2004 1 204 808
Seaweed culture is now emerging as an important and major livelihood in the coastal areas, specifically in Regions ARMM, IV-B and IX. The provinces of Tawi-Tawi, Sulu, Basilan, Palawan, Antique, Bohol, Quezon, Zamboanga del Norte, Camarines Sur, Eastern Samar, Surigao del Sur, Zamboanga Sibugay, Lanao del Norte and Maguindanao are potential areas for seaweed culture.
Seaweeds contributed 31 percent to the total 2004 fisheries production (Table 7 and Figure 6). Kappaphycus alvarezii and Euchema denticulatum are the major species cultivated. The culture methods used by farmers are fixed bottom monoline and floating monoline.
The seaweed industry employs between 100 000 and 120 000 people. Of the total individuals employed, 90 percent are seaweed farmers and the rest are seaweed processors and traders. Sixty-five percent of the total production is processed into semi-refined chips/carrageenan, 13 percent is exported raw (dried) and the remaining 22 percent is processed into refined carrageenan.
The Philippines is among the top producers of seaweeds in the world, specifically the red seaweeds – next to the People’s Republic of China and Japan. In 2004, about 24.8 million tonnes valued at PHP 1.2 billion was exported to the United States of America, France, Republic of Korea, China and China, Hong Kong SAR.
Problems and constraintsThe main problems facing seaedweed cultivation in the Philippines are:
pollution in production areas;inadequate supply of dried seaweeds for processing leading to processors’ losses;the peace and order situation in seaweed-producing areas;diseases affecting seaweeds (e.g. ice-ice);inconsistency in quality due to adulteration of the processed product with foreign materials; and increasing competition in Eucheuma production from other countries such as Malaysia, Indonesia and some African nations.
MilkfishMilkfish is an important aquaculture commodity. Over the past five years, production has steadily increased from 194 023 tonnes in 2000 to 269 930 tonnes in 2004, with an average annual growth rate of 8.7 percent (Table 8 and Figure 7). Harvests from the different culture environments were as follows:
freshwater contributed 10 percent to the total milkfish production; brackishwater recorded the highest share of 77.4 percent due to improved technology such as increase in stocking density and expansion of operations; andmarine fish cages and fish pens contributed 12.6 percent.
•••••
•
••
•

The future of mariculture: a regional approach for responsible development in the Asia-Pacific region230
TABLE 8Milkfish production, 2000–2004 (Source: bFAR, 2005a)
YearProduction (tonnes)
2000 194 023
2001 225 337
2002 231 968
2003 246 504
2004 269 930
Based on regional milkfish production and requirements in the year 2004, regions I, III, IV-A & B, VI, IX, XI and XII recorded a surplus, while deficits were incurred in regions II, NCR, V, VI, VII, VIII, X, ARMM and Caraga. However, based on the national production, a surplus of more than 100 000 tonnes was determined (Table 9).
TABLE 9 2004 milkfish production and requirements at 1.98 kg per capita consumption (Source: bAS, 2004; bFAR, 2005a)
Region PopulationProduction
(tonnes)Consumption
(tonnes)Gap
I 4 422 483 48 634.3 8 756.5 39 878.1
II 3 032 872 240.4 6 005.1 (5 764.7)
III 8 297 012 58 794.0 16 428.1 42 365.9
NCR 11 070 287 3 160.0 21 919.2 (18 759.2)
IV-A 10 940.575 32 665.9 21 662.3 11 003.6
IV-B 1 612 601 3 582.7 3 192.9 389.8
V 5 079 867 1 669.9 10 058.1 (8 388.2)
VI 6 778 143 63 991.7 13 420.7 50 571.0
VII 5 970 149 7 582.0 11 820.9 (4 238.9)
VIII 4 058 787 2 362.4 8 036.4 (5 674.0)
IX 3 452 079 9 776.3 6 835.1 2 941.2
X 3 013 186 5 907.4 5 966.1 (58.7)
XI 5 771 878 12 446.9 11 428.3 1 018.6
XII 2 910 459 13 311.7 5 762.7 7 549.0
ARMM 2 330 394 2 004.6 4 614.2 (2 609.6)
Caraga 2 393 402 3 799.7 4 738.9 (939.2)
Total 82 663 599 269 930.2 163 673.9 109 284.5

231Section 2 – Country experiences
Problems Problems faced by milkfish culture in the Philippines include:
degradation of quality fingerling stocks due to inbreeding;insufficient supply of quality milkfish fry in far-flung areas;high cost of farm inputs and poor quality feeds;lack of manpower to effectively transfer technology to the municipal level;marketing layers that stand between producer and consumer; and lost opportunities to participate in the global market for value-added products.
GOVERNMENT PROGRAMMES/INTERVENTIONSSeaweedsInterventions of the government through the Department of Agriculture, Bureau of Fisheries and Aquatic Resources (DA-BFAR) include:
expansion of seaweeds farming in traditional areas (currently there are 57 seaweed nurseries nation wide, using lantay technology in non-traditional areas);introduction of seaweed farming in non-traditional areas;adoption of appropriate technologies to increase productivity;conduct of research and development;improvement of post-harvest techniques;establishment of semi-processing plants in strategic areas;promotion of seaweed and seaweed products;credit facilitation/credit access;monitoring of seaweed price; andorganization of seaweed farmers.
MilkfishIn line with the implementation of the Medium-Term Philippine Development Plan (MTPDP) 2005–2010 to support President Gloria Macapagal Arroyo’s (PGMA) 10-point agenda, BFAR is expected to:
Expand the present milkfish production areas by 3 190 ha. The expansion is expected to generate a total of 86 260 jobs and an annual milkfish production increment of at least 25 000 tonnes.Establish additional central hatcheries in strategic areas to sustain the supply of cheap but high-quality milkfish fry to fish farmers all over the country through the Philippine Bangus Development Program. The intervention is expected to help reduce the cost of fingerlings by 50 percent.Establish lead price including tri-media information dissemination of wholesale and farm gate prices in fish ports in order to reduce percentage of mark-up of marketing layers by 20–30 percent. The long-term goal is to eliminate marketing layers through the organization of cooperatives and provision of credit facilities.
The Philippine Bangus Development Program is a government intervention that aims to ensure the sustainable supply of milkfish fry. The programme utilizes the simple protocol of producing milkfish fry on a commercial scale. The concept includes the use of government, academic and private hatcheries as satellites. Central hatcheries will produce good-quality eggs that will be sold to the satellites for hatching and larval rearing.
Currently, there are 2 714 breeders being utilized for the programme. The central milkfish hatcheries and satellite hatcheries established nation wide are as follows:
Central HatcheriesBFAR-NIFTDC, Dagupan City BFAR-CALAPE, BoholBFAR Sta. Lucia, Palawan
••••
•
•
•••••••••
•
•
•
•••

The future of mariculture: a regional approach for responsible development in the Asia-Pacific region232
BFAR-Naujan, Oriental MindoroBFAR-Tiwi, AlbayHipolito-Damortis, Sto, Tomas, La UnionHautea-Dumangs, IloiloIbabao-Kalibo, AklanRivera-Cabangan, Zambales
Satellite HatcheriesArgao, Cebu - operationalBais City, Negros Occidental (operational)University of Northern Philippines (UNP), Sta. Maria, Ilocos Sur (operational)Young-Bolinao, Pangasinan (operational)San Felipe, Zambales (100 percent completed)Claveria Cagayan (launched 24 January 2006)Bongabon, Oriental Mindoro (under construction – 25 percent completed)
In 2005 milkfish egg production reached 195 million eggs. The recorded fry production is 9.6 million. Total clients served were 188.
Establishment of marine parks management concept of mariculture park The objectives of this programme include:
employment generation and poverty alleviation in the countryside;promotion of marine fish culture as an alternative source of livelihood for marginalized and sustenance fisher folk;development of an area with appropriate equipment and infrastructure that will allow fishermen, fish farmers and investors to operate cost-effectively and securely;development of skilled and technically capable fisher folk to support the mariculture industry; and promotion of the use of environmentally friendly inputs and farm management practices.
The project will be implemented at the village level wherein local government unit (LGU) participation is needed in zoning a parcel of at least 100 ha of coastal municipal water to be declared as a mariculture park. It will utilize modern floating cages that tolerate 2–3 m wave action and that will last at least five years with little maintenance.
A component of the park is an Executive Management Council (EMC) that governs the establishment of a grid-type “community” storm-mooring system and cluster of marine sea-cages. Aside from providing the necessary security for the cages during seasonal rough weather, a standardized mooring facility is expected to help prevent problems of uncontrolled growth and expansion, encroachment, entanglement of moorings and navigational hazards.
The following sections describe the features and activities within different stakeholders and management units (see Figure 8).
Featuresmulti-product onshore warehouse, cold storage and ice plant facility service as well as ferry boats;sufficient navigational lanes and a communal mooring system;internal and external security;well-defined sites for investment category for small, medium and large-scale investors;
••••••
•
•••
•••••••
••
•
•
•

233Section 2 – Country experiences
readily available mooring support services for small-scale operators; andavailability of seeds and feeds supplier, cage fabricator and manpower services.
1 DA as the Executing Agency.
BFAR-SEAFDEC-LGU Signatories of the MOA.
EMC-Executive Management Committee takes charge for the over-all administration of the Marine Park Project.
BFAR-RD coordinates with the EMC on day-to-day operations.
RD as Project Management Unit (MPMU) Project Manager.
Project Management Unit (MPMU) implements the day-to-day operations of the MP.
Benefits to the LGU per hectareMayor’s/business permitsPHP 1 500/mooring space/year x 30 spaces/ha = PHP 45 000Executive Management Council rentalsPHP 5 000/mooring space/year x 30 spaces/ha = PHP 150 000employment benefits as outlined below:Direct:
caretaker (60), security (2), maintenance (5)Indirect:
cage fabricators (360), mooring development (15),fry producer (133), transport and handling (5 346)
other business/permits value-adding (milkfish deboning) cage suppliers
•••••
••
•••

The future of mariculture: a regional approach for responsible development in the Asia-Pacific region234
feed suppliers fish dealers warehouse ice plant and cold storage milkfish hatchery operations milkfish nursery operations
Legal mandatesRepublic Act No. 8550
Section 47: Code of Practice for Aquaculture (FAO 214)Section 51: License to Operate Fish Pen, Fish Cage, Fish Traps and Other
Structures for Fish Culture and Other Fishery Products Section 53: Grant of Privileges for Operation for Fish Pens, Cages, Corrals/
Traps and Similar Structures Section 54: Insurance for Fish Pond, Fish Cages and Fish Pens (FAO 215) Section 55: Non-Obstruction to Navigation (FAO 216)Section 56: Non-Obstruction to Defined Migratory Paths (FAO 217) Section 57: Registration of Fish Hatcheries and Private Fishponds, etc. (FAO
218)
DA-DENR Joint Memorandum Order No. 01 (series of 2000) Article III, Sec. 3. Code of Practice for Aquaculture Article IV, Sec. 1.a.3-4-5. Zonation of existing or potential areas for mariculture,
sea farming or sea ranching operations; navigational lanes and passage in fishery areas; migration paths of migratory fishes
Municipal Fisheries Ordinance Municipal Resolution declaring, reserving or segregating an area for Mariculture
Zone (in coordination and collaboration with DENR/FARMC) Stipulations of fees and rentals (Mayors Permit/Annual Lease)
Development processThe development process occurs in the following sequence:
Site selection and prioritization Pre-assessment of site suitability Public hearing/consultations Municipal resolution Municipal ordinance Development plan RRA/EIA Organization of EMC Detailed survey/ECC Subdivision plan Installation layout (mooring/cages) Training/IECLease/permit issuance Operation and management Regular monitoring (physico-chemical)
•••••••••••••••
•
•
•
••••••

235Section 2 – Country experiences
Technical servicesTechnical services for the mariculture parks are described below in Table 10.
TABLE 10Technical assistance
Project Operations UnitProject Assistance/Information, Education
Component Unit1. Oversee the project staff assigned at the project
site
2. Implement all projects at the BFAR R&D Area
Develop/implement work plan for every project
Assign appropriate project staff, including on-the-job trainees
Implement project monitoring and evaluation
Implement researches
3. Render technical assistance to locators at different stages of project development, such as:
Project installation
Grow-out/culture techniques
Harvesting
Post-harvest activities
4. Render services as resource persons during dialogues/conferences, trainings and other related activities
Provide technical back-up staff to the EMC during project deliberation and conferences
1. Recommend guidelines for the Project Operations
2. Prepare Management Plan and programme for the future development and long-term sustainability of the Mariculture Park.
3. Production of Project Operation Manual
4. Develop brochures for the whole MP
5. Develop manuscript for R&D results
6. Develop new project proposals and implement pilot models at the BFAR R&D Area
7. Provide assistance in the preparation of locators’ business plan outline
8. Provide assistance to locators’ documentation requirements (Mayor’s Permit/lease agreement)
9. Assist with other information needs of the locators
10. Act as resource persons during community dialogues, conferences, trainings and other related activities
11. Develop IEC materials
Management and operation Hatchery and nursery Species selection Species selection Cage maintenance PCP-environmental impact monitoring Harvest and post-harvest
Status of mariculture parksTable 11 shows the status of mariculture parks in the Philippines.
••••••

The future of mariculture: a regional approach for responsible development in the Asia-Pacific region236
TAB
LE 1
1 S
tatu
s o
f m
aric
ult
ure
par
ks
SITE
/LO
CA
TIO
NST
ATU
SR
EMA
RK
SSa
mal
Isla
nd
Mar
icu
ltu
re P
ark
Lau
nch
ed a
nd
est
ablis
hed
11
Au
gu
st 2
001
in D
avao
. No
w o
n it
s 3rd
yea
r o
f o
per
atio
n (
4 lo
cato
rs, 4
co
op
erat
ives
an
d
clu
ster
of
fish
erfo
lks;
11
cag
es a
ll en
gag
ed in
sem
i-in
ten
sive
po
lycu
ltu
re s
yste
m (
milk
fish
))
Fully
op
erat
ion
al w
ith
BFA
R D
emo
cag
es a
nd
3 lo
cato
rs in
fu
ll o
per
atio
n. B
FAR
tec
hn
o-d
emo
cag
es n
ow
co
nta
in 3
000
p
om
pan
o, 2
000
sn
app
er a
nd
2 5
00 g
rou
per
fin
ger
ling
s. A
no
ther
12
x 12
m c
age
has
bee
n s
et f
or
seed
ing
.
Re-
esta
blis
hed
26
mo
ori
ng
lin
es in
th
e m
aric
ult
ure
par
k.
Co
nst
ruct
ed a
nd
dep
loye
d 3
2 u
nit
s (2
x2)
squ
are
cag
es o
wn
ed b
y C
ora
l Aq
ua
Ven
ture
s st
ock
ed w
ith
hig
h-v
alu
e sp
ecie
s.
For
recr
eati
on
al p
urp
ose
s, t
hey
pla
nn
ed t
o c
om
bin
e th
eir
cag
es w
ith
flo
atin
g c
ott
ages
an
d r
esta
ura
nts
fo
r th
e p
ub
lic
wh
ile p
rom
oti
ng
eco
-to
uri
sm in
th
e ar
ea. M
ain
tain
ed 5
7 co
mp
artm
ents
an
d r
esto
cked
wit
h v
ario
us
hig
h-v
alu
e sp
ecie
s lik
e ab
alo
ne,
co
bia
, sn
app
er a
nd
gro
up
er.
Mo
st lo
cato
rs h
arve
sted
an
d r
esto
cked
th
eir
cag
es w
ith
fin
ger
ling
s. J
oro
na
Aq
uav
entu
res
op
ted
fo
r st
agg
ered
h
arve
stin
g t
o b
e p
roce
ssed
in t
hei
r o
wn
pro
cess
ing
pla
nt.
Co
ron
a A
qu
atic
Res
ou
rces
Tra
din
g w
as c
on
sist
ent
wit
h t
hei
r fi
sh p
roce
ssin
g a
ctiv
itie
s an
d e
xpan
sio
n p
rog
ram
me.
Tw
o u
nit
s o
f 19
x18
m c
ages
wer
e ea
ch s
tock
ed w
ith
25
000
milk
fish
fin
ger
ling
s. O
ther
new
ly c
on
stru
cted
cag
es w
ere
sto
cked
wit
h m
ilkfi
sh a
nd
po
mp
ano
. Nin
e u
nit
s o
f ca
ges
wit
h s
tock
s ar
e n
ow
ava
ilab
le, w
hile
fab
rica
tio
n o
f ad
dit
ion
al
cag
es is
on
-go
ing
to
mee
t th
e 30
-un
it t
arg
ets.
Mo
nte
verd
e A
qu
aven
ture
s re
sum
ed it
s o
per
atio
n w
ith
on
e u
nit
10
x10
m c
age
read
y fo
r re
-in
stal
lati
on
. See
din
g h
as
bee
n s
ched
ule
d in
Ju
ly 2
005.
GE
catt
le T
rad
ing
’s t
hre
e u
nit
s o
f 10
x 1
0 m
cag
es r
ead
y fo
r se
edin
g, w
hile
fab
rica
tio
n o
f ad
dit
ion
al u
nit
s is
on
-go
ing
. Th
e co
nst
ruct
ed f
loat
ing
ho
use
hav
e b
een
sch
edu
led
fo
r in
stal
lati
on
.
Ind
ivid
ual
fis
h-c
age
op
erat
ors
an
d f
ish
erfo
lk in
th
e vi
cin
ity
no
w m
ain
tain
a s
ub
stan
tial
nu
mb
er o
f si
gan
id f
ing
erlin
gs
for
the
inve
sto
rs.
LGU
fai
led
to
pro
vid
e p
arce
l of
lan
d
for
war
eho
use
an
d a
uxi
liary
ser
vice
ar
ea. M
ore
loca
tors
are
en
cou
rag
ed.
Mas
inlo
c-Pa
lau
ig, Z
amb
ales
M
OU
wit
h D
A-B
FAR
/LG
Us
and
SEA
FDEC
sig
ned
Jan
uar
y 20
02. M
un
icip
al r
eso
luti
on
s en
do
rsed
by
resp
ecti
ve
San
gg
un
ian
g B
ayan
, RR
A/P
rofi
le c
om
ple
ted
. Bo
un
dar
ies
and
bo
uys
est
ablis
hed
.
Fin
al c
op
y o
f th
e En
viro
nm
enta
l Im
pac
t St
atem
ent
(EIS
) su
bm
itte
d t
o t
he
EMB
-DEN
R C
entr
al O
ffic
e fo
r re
view
. An
in
ven
tory
of
exis
tin
g f
ish
cag
e u
nit
s w
as m
ade
on
30
Mar
ch 2
004
tog
eth
er w
ith
th
e cu
rren
t w
ater
qu
alit
y as
sess
men
t o
n t
he
pro
po
sed
sit
e. T
he
ECC
gra
nte
d t
o B
FAR
was
, ho
wev
er, c
ance
lled
.
NIP
AS
excl
usi
on
req
ues
t en
do
rsed
to
D
ENR
. Aw
aiti
ng
Mu
nic
ipal
Ord
inan
ces
fro
m b
oth
mu
nic
ipal
itie
s an
d la
you
t/d
evel
op
men
t p
lan
pre
par
ed b
y R
egio
n
III.
Sub
ic-M
oro
ng
, Mab
ayo
Co
vePu
blic
co
nsu
ltat
ion
wit
h lo
cal o
ffic
ials
co
nd
uct
ed; a
wai
tin
g f
orm
al e
nd
ors
emen
t to
SB
of
Mo
ron
g, S
ite
asse
ssm
ent
con
du
cted
by
Reg
ion
III.
8 lo
cato
rs v
isit
ed t
he
site
. LG
U d
ecid
ed
to o
per
ate
and
man
age
the
site
on
th
eir
ow
n a
dm
inis
trat
ion

237Section 2 – Country experiences
Sila
ng
un
Bay
, Zam
bal
esSu
rvey
ass
essm
ent
join
tly
con
du
cted
by
BFA
R-N
DC
P te
am, M
OA
fo
rmal
ly s
ign
ed b
etw
een
AFP
-ND
CP
and
DA
-BFA
R la
st
13 F
ebru
ary
Imp
lem
enta
tio
n/d
evel
op
men
t p
lan
p
rep
ared
. Det
aile
d R
RA
co
nd
uct
ed
join
tly
by
BFA
R-P
hili
pp
ine
Nav
y an
d
ND
CP.
Op
erat
ion
an
d m
anag
emen
t to
be
pri
vate
ly a
dm
inis
tere
d b
y a
corp
ora
tio
n.
Ho
nd
a B
ay, P
alaw
anSi
te t
o b
e id
enti
fied
by
Reg
. IV
For
imp
lem
enta
tio
n
Rag
ay B
ay, C
amar
ines
Su
r Su
rvey
ass
essm
ent
join
tly
con
du
cted
by
BFA
R-L
GU
tea
m. P
rofi
le a
nd
dev
elo
pm
ent
pla
n p
rep
ared
by
the
LGU
.Fo
r im
ple
men
tati
on
Sto
. To
mas
Co
ve, L
a U
nio
nLa
un
ched
an
d e
stab
lish
ed 1
7 O
cto
ber
200
2 in
St.
To
mas
, La
Un
ion
27 in
vest
ors
wer
e aw
ard
ed w
ith
M
aric
ult
ure
Zo
ne
Eco
no
mic
A
gre
emen
t.
Reg
ion
1A
sses
sed
16
site
s fo
r p
rop
ose
d s
eaw
eed
mar
icu
ltu
re z
on
es in
th
e fo
ur
pro
vin
ces
of
Reg
ion
1.
Esta
blis
hed
sev
en s
eaw
eed
mar
icu
ltu
re z
on
es in
Pas
uq
uin
an
d B
ado
c, Il
oco
s N
ort
e; C
abu
gao
, San
tiag
o a
nd
San
Es
teb
an, I
loco
s Su
r; D
aso
l an
d B
alao
an P
ang
asin
an.
Tilik
Co
ve, L
ub
ang
Isla
nd
Surv
ey a
sses
smen
t jo
intl
y co
nd
uct
ed b
y B
FAR
-LG
U t
eam
20
Oct
ob
er 2
003
Ord
inan
ce d
raft
ed b
y LG
U. L
imit
ed
site
s su
itab
le f
or
Mar
icu
ltu
re P
roje
ct.
SEA
FDEC
-AQ
D Ig
ang
, G
uim
aras
Su
b-p
rovi
nce
Mar
icu
ltu
re P
ark
Pilo
t-D
emo
an
d T
rain
ing
Pro
ject
fu
lly o
per
atio
nal
JMA
NTT
P Pr
oto
typ
e M
aric
ult
ure
Par
k
Sam
ar-L
eyte
Exis
tin
g M
arip
arks
est
ablis
hed
in L
eyte
as
of
2004
2 n
ew a
reas
pro
po
sed
in B
ilira
n a
nd
Tac
lob
an
3 ex
isti
ng
Mar
ipar
ks e
stab
lish
ed in
Sam
ar
2 p
rop
ose
d n
ew s
ites
in Q
uin
apo
nd
an a
nd
Mar
abu
t, S
amar
8 M
aric
ult
ure
Zo
ne
Esta
blis
hed
42 u
nit
s o
f ca
ges
inst
alle
d
Pro
du
ctio
n o
f 20
05: 2
55 t
on
nes
Ave
rag
e p
rod
uct
ion
/un
it 7
.5–8
to
nn
es
Mal
ajo
g, C
alb
ayo
g N
oth
ern
Sa
mar
an
d B
asey
Eas
tern
Sa
mar
11 B
FAR
dem
o c
ages
(9
un
its
squ
are
and
2 u
nit
s ci
rcu
lar)
mai
nta
ined
at
the
mar
icu
ltu
re p
arks
loca
ted
. 47
cag
es (
32
squ
are
GI p
ipes
, 4 u
nit
s ci
rcu
lar
and
11
un
its
squ
are)
inst
alle
d b
y in
vest
ors
wh
ile r
egu
lar
tech
nic
al a
ssis
tan
ce w
as
pro
vid
ed b
y B
FAR
.
SITE
/LO
CA
TIO
NST
ATU
SR
EMA
RK
S
TAB
LE 1
1 C
on
tin
ued

The future of mariculture: a regional approach for responsible development in the Asia-Pacific region238
Mariculture Park Region VIIIExisting
Malajog,Calbayog Nothern Samar (300 ha)Basey Eastern Samar (400 ha)Merida, LeyteOrmoc Bay, Northern Leyte (600 ha, launched 7 December 2005)Ormoc/ Merida Mariculture Zone (100 ha)Babatngon, Leyte ( 950 ha, launched 27 December 2004)Sta Rita, Mariculture Park, Western Samar (500 ha)Liloan, Sagud Bay, Southern Leyte (75 ha, launched 30 July 2004)San Jose City, Northern Samar (3 150 ha, launched 30 June 2004)Lawaan, Eastern Samar (launched 4 August 2004)
ProposedBiliran/Leyte, LeyteQuinapondan Mariculture Zone, Eastern SamarMarabutTacloban, Leyte
Sea cagesEstablished 8 mariculture zonesNo. of established cages: 142 unitsProduction as of 2004: 255 tonnesAverage production/unit: 7.5–8 tonnes
Challenges and opportunitiesThe challenges and opportunities for mariculture parks include the following:
Macro-scale benefitsFood securityEmployment generationLong-term sustainability
Micro-scale benefitsAncillary services (seed stocks, ice-plant, cold storage, feed warehouses, ports, etc.)Post-harvest facilities, road and transport accessLesser investment costAmenities (water supply, power supply, communications, guard house, working platforms)Full securityRevenue assurance to LGUs
Other opportunitiesTax incentives (ITH)Crop insuranceChoice of commercially important speciesMarket assuranceFish health management servicesISO/HACCP standardsProgrammatic compliance to DENR (EIA/EIS/ECC)Other livelihood opportunities
Environmental issuesOver the last few years, the rapid development of marine fish-cage and fish-pen culture in certain areas of the Philippines has led to unsustainable production. In 2002 for example, fishkills occurred in milkfish culture areas in Pangasinan and in tilapia areas
••••••••••
••••••••
••••
••••
•••
••••
••

239Section 2 – Country experiences
in Taal Lake. Possible reasons for these fishkills are: euthrophication, over production, overstocking of cages and pens, toxic algal tide or algal bloom, poor production management and reduction of water refreshment due to poor zoning and regulation.
In 2005 a study on Environmental Monitoring and Modelling of Aquaculture Areas was conducted. The primary objective was to undertake an environmental survey of the risk areas and adapt a mathematical model based on MOM Standard (Modeling–Ongrowing fish farms-Monitoring) developed by Norway for the prediction of impact of the fish cages on the recipient water. The study was implemented in collaboration with AKVAPLAN NIVA and the Norwegian Agency for Cooperation and Development (NORAD).
The survey was conducted in Bolinao marine waters, Dagupan City River system and Taal Lake during summer, rainy and cold seasons. The following activities were conducted:
detailed survey of production in the area (including physical area, production, statistics etc);analysis of the bathymetry;profiling of temperature, salinity and oxygen levels through the water;sediment analysis;survey of current speed and direction;recording of tidal range observations; andmonitoring of wind direction, frequency and speed.
Initial results of the survey in Bolinao showed that there are 460 fishcages, 266 fishpens and 254 mussel farms. Soil samples taken by grabs are grey to black in colour and with a hydrogen sulphide (H2S) smell.
Results of the survey in Dagupan showed that there are 124 fishcages, 553 fishpens, 528 fish traps and 94 oyster farms. Soil samples taken by grabs have no smell, with greyish silty sediment. Oysters were found to abound in the river.
The initial findings were:food conversion rate was varied and was relatively poor (1.5 to 3:1);impact was relatively high in areas where there are large numbers of fishcages;impact was relatively low in areas where there is a mix of fish and mollusc culture (fed species and extractive species);carrying capacity was not related to numbers of structures but to fish production; andcarrying capacity varied through the year depending on other factors (dynamic)
The initial recommendations were to come up with constructive and implementable recommendations that allow efficient production and minimize impact. An example is the use of feeding trays. In this way a farmer has better food conversion rate (more fish per kilogram of feed) and there is less impact on the environment (reduction of nutrients and organic material released to the environment).
CONCLUSIONSWith the increasing population, the government has to choose between food security/sustainability and environmental protection/conservation. The government has to decide which areas to regulate for mariculture and which areas to allow open access to fish farming.
Another issue to consider is zonation vs. degradation. Mariculture areas should be identified but properly regulated to prevent degradation of the rivers and seas.
Government policies/regulations have to be put in place to prevent environmental degradation, thereby sustaining production. Research and development should focus in determining the carrying capacity of water. The Local Government Units (LGUs) should ensure that their fishery ordinances are strictly enforced, giving emphasis to the interest of the less fortunate fish farmers.
•
••••••
•••
••

The future of mariculture: a regional approach for responsible development in the Asia-Pacific region240
REFERENCES BAS. 2004. Preliminary data on the volume of production by sub-sector and region.BFAR. 2004. Philippine fisheries profile. Quezon City, Department of Agriculture, Philippines. 62 pp. BFAR. 2005a. Commodity roadmap: milkfish. Quezon City, Bureau of Fisheries and
Aquatic Resources.BFAR. 2005b. Commodity roadmap: seaweeds. Quezon City, Bureau of Fisheries and
Aquatic Resources.BFAR-NIFTDC. Report on the Philippine Bangus Development Program. FAO. 2004. FishStat Plus. FAO Fisheries Department, Fishery Information, Data and
Statistics Unit, Rome, FAO.NSO. 2002. Census of fisheries. Manila, National Statistics Office.

241
Thailand
Renu YashiroDepartment of FisheriesRayong, ThailandE-mail: [email protected]
Yashiro, R. 2008. Thailand. In A. Lovatelli, M.J. Phillips, J.R. Arthur and K. Yamamoto (eds). FAO/NACA Regional Workshop on the Future of Mariculture: a Regional Approach for Responsible Development in the Asia-Pacific Region. Guangzhou, China, 7–11 March 2006. FAO Fisheries Proceedings. No. 11. Rome, FAO. 2008. pp. 241–250.
bACKGROUNDThailand has a coastline of 2 769 km, of which 1 875 km is facing the Gulf of Thailand from Trad to Narathiwat Province, and the remaining 894 km faces the Andaman Sea from Satul to Trang Province. Coastal and marine aquaculture in Thailand has a long history that dates back to when mass seed production from hatcheries first succeeded in raising marine shrimp (banana shrimp, Penaeus merguiensis and black tiger shrimp, P. monodon) and Asian seabass (Lates calcarifer) around 1969 to 1976. Coastal and marine aquaculture has developed under the administration of the Ministry of Agriculture, Department of Fisheries (DOF). The Coastal Fisheries Research and Development Bureau has 19 Coastal Fisheries Research and Development Centers (CFRDC) and three Coastal Aquaculture Research and Development Stations. Provincial Fisheries Offices (PFO) in 24 coastal provinces also have the duty of supporting development of coastal aquaculture and enforcing the fisheries laws and regulations. The national fisheries development policies on aquaculture development are as follows:
increase aquaculture production sufficiently in both quantity and quality for domestic consumption and export;accelerate research in support of commercial aquaculture industries to increase trade volume, improve quality standards and reduce production costs;develop sustainable marine shrimp culture systems for domestic trade as well as for export; anddevelop the production and marketing of ornamental fish and aquatic plants for export in order to raise the income from aquaculture.
MARINE AQUACULTURE PRODUCTS DEMAND, TRADE AND MARKETSAnalysis of marine aquaculture products demand, trade and markets trend in Thailand
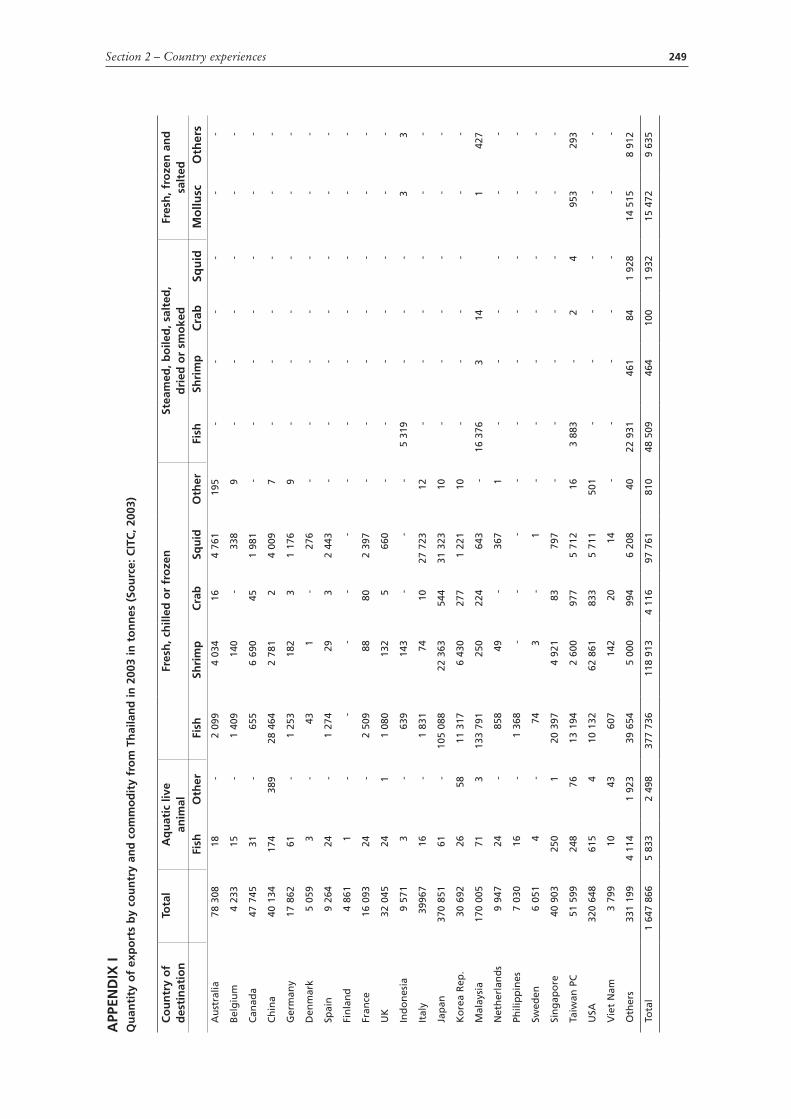
Demand for export, product demand, trade and marketsThe foreign trade in fisheries commodities was 1 647 866 tonnes by quantity and more than US$4 377 million by value in 2003. The major exports are fresh chilled and frozen marine shrimps (118 913 tonnes) and fishes (377 736 tonnes) and their products. Marine shrimps (chilled or frozen) were exported mainly to the United States of America (62 861 tonnes) and Japan (22 363 tonnes). Marine fishes were exported to Malaysia (133 791 tonnes), Japan (105 088 tonnes), the People’s Republic of China (28 464 tonnes), Singapore (20 397 tonnes), Taiwan Province of China (13 194 tonnes) and the Republic of Korea (11 317 tonnes) (CITC, 2003). Italy imported 27 723 tonnes of fresh chilled or frozen squids. Tuna is the major fish exported with >326 402 tonnes both packed in
•
•
•
•

The future of mariculture: a regional approach for responsible development in the Asia-Pacific region242
air-tight and non-air tight containers in 2003, mainly for the United States of America, Australia, Canada, Japan and the United Kingdom (see Appendix I).
Thailand imported products of more than US$1 162.8 million in value and 1 095 059 tonnes in quantity in 2003, mostly fresh chilled or frozen fish (>950 000 tonnes) (Table 1) from Indonesia, Japan, Taiwan Province of China, Republic of Korea, China and the United States of America. The other major imported seafoods were fresh, frozen or salted molluscs from Malaysia (18 255 tonnes) and shrimps in non-air tight containers from Indonesia and Malaysia (3 276 and 1 536 tonnes, respectively).
Marine aquaculture for domestic marketsThe main species supplied for the domestic market are finfish, some small shrimps and mussel. Marine fishes are sent by truck or car to northern Thailand. Shrimp, fish and molluscs from farm sites along the coastline are always transported as fresh chilled or frozen products to Bangkok and other local destinations within one or two days. Goods will be sent directly to the market and to distributors who will use small cold storage or ice boxes. Live fish and molluscs are preferred by restaurants. Food safety standards are being applied.
TABLE 1Quantity of imported seafood by selected country and commodity, 2003 (tonnes)
Country of Origin TotalLive Fresh chilled or frozenFish Fish Shrimp Crab Squid
Australia 10 444 - 1 042 172 - -
Canada 6 528 - 1 907 1 847 2 433 -
China 24 696 1 17 598 1 522 53 432
EU 16 252 - 13 325 648 249 379
Indonesia 262 861 4 252 436 1 529 - 4 367
India 11 364 - 5 730 4 304 23 1 169
Japan 107 423 5 100 007 309 63 1 219
Malaysia 34 525 31 6 645 2 403 14 654
Philippines 3 384 2 3 290 10 - 6
Republic of Korea 40 536 - 30 368 151 72 1 178
Singapore 1 109 1 963 - - -
Taiwan PC 123 124 1 122 026 11 - 281
USA 20 667 - 14 573 218 265 -
Viet Nam 10 145 - 2 679 1 440 43 2 164
Others 422 272 4 38 2533 11 960 2 399 12 937
Total 1 095 059 49 955 122 26 524 5 614 24 777
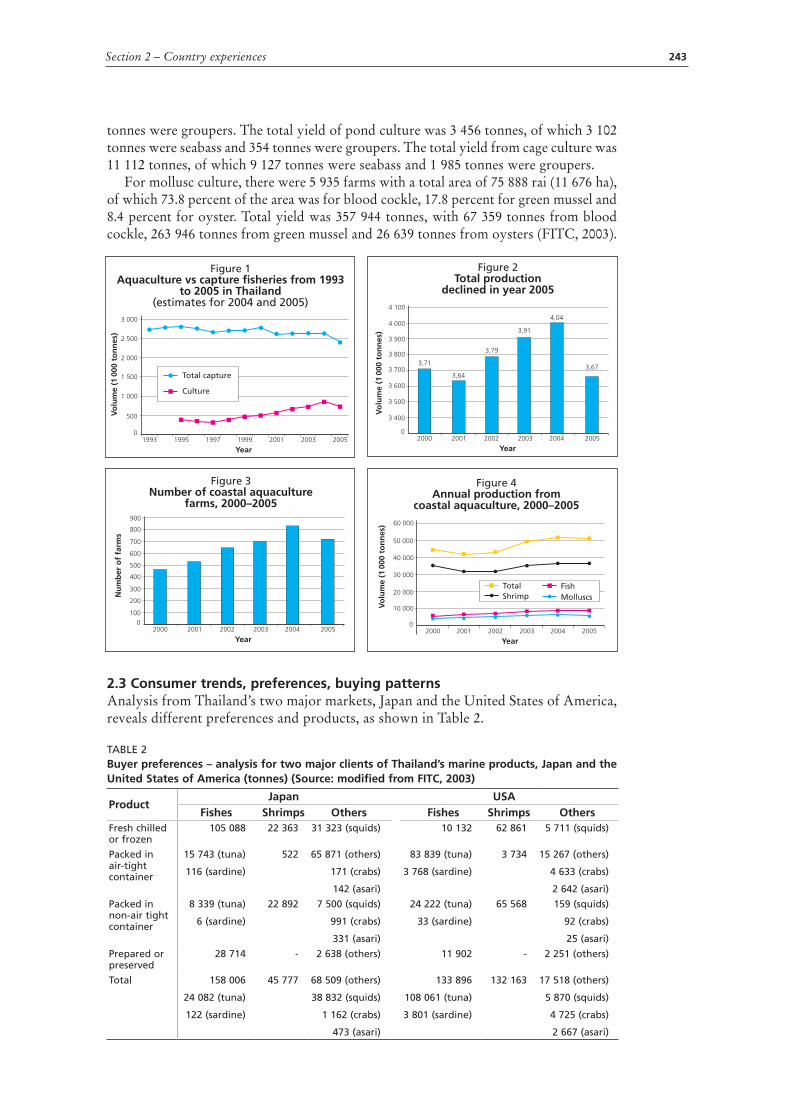
Role of aquaculture versus fisheriesData from the 13-year period since 1993 show that capture fisheries tended to decline, while the culture production has increased and only declined again in 2005 (Figures 1 and 2). The average supply was 73.1 percent from marine capture and 14.2 percent from mariculture, clearly indicating that the main supplies of seafood were from capture fisheries rather than culture. The majority of coastal aquaculture is shrimp, fish and mollusc farming. Their production and the number of farms are shown in Figures 3 and 4.
In 2003 there were 34 977 shrimp farms with a total pond area of 512 620 rai (82 019.2 ha; 1 rai =1 600 m2), with a total yield of 330 725 tonnes. Production was 194 909 tonnes of black tiger shrimp, 132 365 tonnes of white shrimp, 2 849 tonnes of banana shrimp and 602 tonnes of other shrimp.
For finfish culture, there were 8 226 farms, out of which there were 1 073 pond operators and 7 153 cage operators with a total area of 6 625 rai (1 019.23 ha, 1 ha = 6.5 rai), with a total yield of 14 568 tonnes, of which 12 229 tonnes were seabass and 2 339
243Section 2 – Country experiences
tonnes were groupers. The total yield of pond culture was 3 456 tonnes, of which 3 102 tonnes were seabass and 354 tonnes were groupers. The total yield from cage culture was 11 112 tonnes, of which 9 127 tonnes were seabass and 1 985 tonnes were groupers.
For mollusc culture, there were 5 935 farms with a total area of 75 888 rai (11 676 ha), of which 73.8 percent of the area was for blood cockle, 17.8 percent for green mussel and 8.4 percent for oyster. Total yield was 357 944 tonnes, with 67 359 tonnes from blood cockle, 263 946 tonnes from green mussel and 26 639 tonnes from oysters (FITC, 2003).
2.3 Consumer trends, preferences, buying patternsAnalysis from Thailand’s two major markets, Japan and the United States of America, reveals different preferences and products, as shown in Table 2.
TABLE 2buyer preferences – analysis for two major clients of Thailand’s marine products, Japan and the United States of America (tonnes) (Source: modified from FITC, 2003)
Product Japan USA
Fishes Shrimps Others Fishes Shrimps OthersFresh chilled or frozen
105 088 22 363 31 323 (squids) 10 132 62 861 5 711 (squids)
Packed in air-tight container
15 743 (tuna)
116 (sardine)
522 65 871 (others)
171 (crabs)
142 (asari)
83 839 (tuna)
3 768 (sardine)
3 734 15 267 (others)
4 633 (crabs)
2 642 (asari)
Packed in non-air tight container
8 339 (tuna)
6 (sardine)
22 892 7 500 (squids)
991 (crabs)
331 (asari)
24 222 (tuna)
33 (sardine)
65 568 159 (squids)
92 (crabs)
25 (asari)
Prepared or preserved
28 714 - 2 638 (others) 11 902 - 2 251 (others)
Total 158 006
24 082 (tuna)
122 (sardine)
45 777 68 509 (others)
38 832 (squids)
1 162 (crabs)
473 (asari)
133 896
108 061 (tuna)
3 801 (sardine)
132 163 17 518 (others)
5 870 (squids)
4 725 (crabs)
2 667 (asari)

The future of mariculture: a regional approach for responsible development in the Asia-Pacific region244
Market chain organization, market trends and vulnerability The seafood market chains in Thailand are divided into many channels for shrimp, fish and other aquatic animals. The market chain for marine shrimp is rather complicated, involving hatcheries, nurseries, grow-out farms and harvest/partial harvest, with sales to domestic markets and cold stores, and processing for export. Thailand has developed standards for hatcheries, nurseries and farms under a Good Aquaculture Practice (GAP) and Code of Conduct (COC) programme. There are 24 Raw Materials Inspection Units for coastal shrimp farms for checking quality, diseases and antibiotic residues of shrimp. Aside from fresh chilled products and products frozen in many ways, shrimp are also processed in steamed, cooked and precooked forms in different packages or containers. Factories as well as cold storages are also operated under international standards to ensure safety and quality of products.
Market chains for fish and molluscs are more common than for shrimp. Most of the finfish are from capture fisheries. The chain starts from the fishermen to the fish landing, then to middlemen or collectors, who place the product in cold storage or in ice boxes to distribute to the market, and then to consumers or exporters. For cultured finfish, farmers will sell their products to a wholesaler via middlemen or direct, then distribute to consumers via sellers in the market or to exporters.
For molluscs, harvests will be transported to markets, either via distributors or directly, or to exporters. Some will be processed and then repacked and sold.
LIVELIHOOD OPPORTUNITIES RELATED TO MARICULTURE DEVELOPMENTInformation on coastal communities, poverty status, livelihoods, trends and vulnerability, and identification of key target communitiesCoastal communities comprise fishermen and their families. The main operations are small-scale fisheries and aquaculture (gill netting, net-cage culture; blood cockle, mussel and oyster culture; aquatic animal collection, etc.). Farming of marine fish is connected to the wild capture fishery, as fishers collect fish from their traps/fishing gear for use as seed and feed. Survey results from the National Statistic Office and DOF on small fishery households (SFH) in fisheries show a total of 50 732 households, of which the Province of Songkhla had the biggest number (6 175 households) followed by Krabi, Phang-nga and Nakhon Si Thamarat. The top income of SFH was from Samut Prakan Province, with US$4 7361, and the lowest income was from Samut Songkhram with US$1 829 per household per year (Table 3).
Songkhla Lake fisheries communities in Songhkla, southern Thailand provide an example of good aquaculture and fisheries management, with cage culture of seabass, small-scale shrimp culture, culture of green mussel and small fishing boats all operating. Technical cooperation and services to promote Good Aquaculture Practice (GAP) by the National Institute of Coastal Aquaculture (NICA), the Institute of Coastal Aquatic Health Research (ICAHR) and the Provincial Fisheries Officer (PFO) have helped this development. Coastal Fisheries Patrols are also assigned to enforce laws and regulations in Songkhla Lake.
According to Boonchuwong and Lawapong (1999), on average each marine fishfarmer in the Andaman sea coast of southern Thailand owns four cages (4x4x4 m3 each). The average production is 210 kg/cage (175 fish), with a size range from 1.0–1.2 kg from a culture period of 9–12 months. The production cost is US$3.5/kg, of which 75 percent is feed cost. Most farmers start to harvest fish after nine months of culture at a selling price of US$7.3 /kg.
1 Calculated from Table 3 using an exchange rate of US$1 = 40 baht (B).

245Section 2 – Country experiences
TABLE 3Average annual income for small households in fisheries commodities by province(Source: Office of National Statistics and Department of Fisheries, 2000)
ProvinceTotal
income (b)Capture fisheries
Non-fisheriesincome
Trat 106 017 87 463 3 107 525 14 922
Chanthaburi 96 410 84 933 604 773 10 100
Rayong 102 195 75 484 1 122 563 25 026
Chonburi 140 864 122 428 2 391 1 344 14 701
Chachoengsao 133 283 87 159 14 274 27 566 4 284
Samut Prakan 189 454 164 132 4 107 96 21 119
Samut Sakhon 171 754 102 335 2 234 19 164 48 021
Samut Songkhram 73 179 59 533 - 833 12 813
Petchaburi 100 061 91 425 22 65 8 549
Prajoub Kiri Khan 135 223 119 938 - - 15 285
Chumphon 155 001 128 018 1 473 4 789 20 721
Surat Thani 86 274 70 778 - 2 787 12 709
Nakhon Si Thamarat 94 912 86 482 339 22 8 069
Songkhla 76 811 52 598 1 906 1 776 20 531
Pattani 96 277 89 426 - - 6 851
Narathiwat 78 570 67 342 33 1 11 194
Ranong 92 627 77 039 318 2 857 12 413
Phang-nga 76 686 66 821 39 775 9 051
Phuket 103 987 72 121 203 407 31 256
Krabi 74 786 54 974 - 1 523 18 289
Trang 68 428 54 561 - 154 13 713
Satul 74 516 65 487 2 181 36 6 812
Total 2 327 315 1 880 477 34 353 66 056 346 429
Markets and coastal community development linkagesDevelopment of coastal communities is necessary for sustainable management of coastal fisheries and aquaculture. Suitable roles for women in coastal fisheries and aquaculture are very important. The harvest in some seasons provides an over supply to local markets, and women get involved in preservation and preparation of products such as shrimp paste, dried fish and mussel and fish sauce. The PFO in every coastal province is also active in providing training on preservation and fisheries products.
EXISTING AND POTENTIAL MECHANISMS FOR TECHNOLOGY TRANSFERTechnology for mariculture had been transferred in Thailand through many channels. These include via discussions and meetings in small groups or seminars that can be done at any time at the CFRDC of DOF in coastal provinces. DOF then provides training that is divided into (i) training for trainers, technicians and fisheries officers, in order to be good trainers; and (ii) training for farmers and other stakeholders through lectures, workshops, demonstrations and practicals in laboratory or on farm, including study tours to view activities at other sites.
The DOF also has a website (www.fisheries.go.th) for information dissemination. Every PFO and CFRDC can have its own website where farmers and other interested stakeholders can gain knowledge and ask questions.
The future of mariculture: a regional approach for responsible development in the Asia-Pacific region246
Present training activities and likely future requirements
TrainingAnnually 25 000 farmers and other interested parties are trained through training courses for fisheries technology and fish farming. These courses include basic techniques and practical methods for aquaculture, including inland aquaculture. The typical training curriculum includes:
culturing of economically important fishes including ornamental fishes, pond culture, cage culture, etc.breeding and nursing of aquatics species; homemade formulated diet for fish culture;diseases and prophylactic measures; andpreserving and processing of aquatic species.
Aside from such training courses, DOF sets up demonstration sites in selected fisheries communities and assists with mobile clinics, which includes technical assistance to farmers to help solve their problems, water analysis, disease diagnostics, etc.
Training for technicians and government officers through training of trainer programmes is provided to update the knowledge of officers and technicians (trainers). Special emphasis in recent years has been on training in GAP, COC and other measures.
SeminarsSpecial seminars are provided on the breeding and culture of selected aquatic animals, such as Babylon snail and of selected groupers and clown fishes. Food safety for fisheries production programmeThis programme was set up to promote clean seafood and its production for domestic markets and export. Many training programmes with this concept have been conducted to train government officers, farmers and other stakeholders.
Developing information technology IT for fisheries is needed to provide up-to-date information and for compilation and dissemination of relevant information to farmers and the general public.
EXISTING MAJOR MARICULTURE SPECIES AND FARMING TECHNOLOGIESCoastal aquaculture in Thailand involves the culture of shrimp, fish, shellfish and small quantities of other aquatic animals.
Status of farming of selected speciesMarine finfish farming in Thailand began four or five decades ago. The two predominant species groups are groupers and seabass, which are cultured in both earthern ponds and coastal cages. Most of the seabass farms are located in estuarine areas, but almost all groupers are cultured in cages located in more marine waters. Bays or coastal enclosed areas protected from wave action and strong winds are preferred.
Grouper culture has proved to be commercially viable, depending on the export market in the region. The price for live fish weighing 1.2–1.5 kg has been US$9–10 each or US$7–8/kg since the 1990s, with limited long-term price fluctuations. Most fishfarmers culture grouper in floating netcages in sheltered coastal areas with salinity ranging from 12 to 30 ppt.
Due to unreliable and limited hatchery production, the majority of grouper seed are obtained from the wild. Grouper fry of size 1.0–2.5 cm are usually collected from the coastal areas of Songkhla and Pattani provinces from October to March. The fry
•
••••

247Section 2 – Country experiences
are reared up to a size of 7–10 cm prior to stocking in grow-out cages. The majority of these seed are exported to other countries. Seed of sizes longer than 10 cm are collected using traps, and the fish are stocked directly into grow-out cages without nursing. Fishfarmers prefer this type of seed to the reared fry because of the shorter grow-out period and better survival. The quantity of fish produced from cage culture is steadily increasing and its future appears to be promising.
The grouper culture system involves a series of farms specialized in one of several areas: Hatcheries produce fertilized eggs
– broodstock ponds (outdoor) – induced spawning – natural spawning
Fertilized eggs → fry farm – nursing indoor (raise to 3 cm total length) – nursing outdoor
Fingerling farms → until 7–9 cm total lengthGrow-out farm → market size (600–700 g)
– pond culture (10–14 months) – cage culture (8–10 months from 6 cm)
Fry and fingerling productionThe demand for live marine finfish such as groupers and seabass for consumption has increased. To produce marine fish seed, we have to understand the reproductive biology and physiology of each species.
TABLE 4 Production yields from grouper culture and their food used, in weight (tonnes), 1999–2002
Year Seabass/Feed Groupers/Feed Total feed
Weight FCR=7.5 Weight FCR=5.5 used
1999 6 056 54 120 1 143 7 339 61 459
2000 7 752 70 040 1 312 8 299 78 339
2001 8 003 72 750 1 443 9 507 82 257
2002 11 032 105 100 1 170 7 794 112 894
The use of destructive fishing methods has destroyed the habitats on which reef-associated species such as groupers depend for shelter and food. The requirements needed to assist the development of marine finfish culture are as follows:
efficient live feed production in the hatchery/nursery;steady supply of live feeds for commercial-scale culture of difficult species; strong government support for the industry and research;seed supply centers in the country and region;good cooperation between fisheries organizations, information networks, market chains and research laboratories (fisheries institution/university integration); and continuation of government policies/plans for hatchery-reared seed to restock over-exploited coastal fisheries.
Hatcheries that produce groupers are the five main government hatcheries and two private hatcheries in Rayong Province. The government hatcheries, with names of key R&D species, are listed below:
Southern regionNational Institute of Coastal Aquaculture (NICA), Songkhla Province
Epinephelus coioides, E. malabaricus
•••••
•
•
•
••
•

The future of mariculture: a regional approach for responsible development in the Asia-Pacific region248
Krabi Coastal Fisheries Research and Development Center, Krabi E. coioides, E. lanceolatus, E. fuscoguttatus
Satul CFRDC, Satul E. coioides, E. malabaricus
Eastern regionRayong CFRDC, Rayong Province
Cromileptes altivelis Trat Coastal Aquaculture Station, Trat Province
Plectropomus leopardus
Cobia (Rachycentron canadum) has been produced at Phuket and Satul CFRDC since 2004, and at Rayong CFRDC in 2005.
Future prospects for finfish research and development (R&D) include:developing closed recirculation systems for fish hatcheries and nurseries; providing education and training on marine fish farming; and organizing an enhanced network for cooperation among fish culturists (the whole cycle) using IT.
Priorities for research and development R&D for shrimp, finfish and molluscs should be on:
developing suitable feeds for each species (and each life stage);changing traditional destructive culture methods, such as feeding with small fresh fish by training fishfarmers to use formulated feeds, and other means to make the transition to formulated feeds;improving disease prevention and prophylactic measures;enhancing the capacity and awareness of all aquatic farms to follow GAP and later, to practice more comprehensive environmentally friendly farming under the Code of Conduct (COC) in order to have sustainable aquaculture in Thailand and the region.
Identification of better management practices (bMPs) for existing farmed species and systems to mitigate environmental impactsFreshwater runoff is the major cause of impacts on mariculture in Thailand. The DOF has been active with a GAP and COC for all shrimp farming areas since 2003. These programmes should also be applied to other aquatic animal farming systems. The COC, in particular, will mitigate environmental impacts as a result of applying environmentally friendly practices. Laws and regulations protecting the environment also need strengthening. Youth are more aware of the environment and the need for better environmental management and should be involved in educational and awareness programmes to enhance the environmentally sustainable development of aquaculture.
REFERENCE CITC. 2003. Fisheries statistics of Thailand. No.6/2005 Fishery Information Technology
Center, Department of Fisheries, Ministry of Agriculture and Cooperatives, 91 pp.
•
•
•••
••
••
•
•
249Section 2 – Country experiences
APP
END
IX I
Qu
anti
ty o
f ex
po
rts
by
cou
ntr
y an
d c
om
mo
dit
y fr
om
Th
aila
nd
in 2
003
in t
on
nes
(So
urc
e: C
ITC
, 200
3)
Co
un
try
of
des
tin
atio
nTo
tal
Aq
uat
ic li
vean
imal
Fres
h, c
hill
ed o
r fr
oze
nSt
eam
ed, b
oile
d, s
alte
d,
dri
ed o
r sm
oke
dFr
esh
, fro
zen
an
d
salt
edFi
shO
ther
Fish
Shri
mp
Cra
bSq
uid
Oth
erFi
shSh
rim
pC
rab
Squ
idM
ollu
scO
ther
sA
ust
ralia
78 3
08
18
-
2 09
9 4
034
16
4 76
1 19
5 -
-
-
-
-
-
Bel
giu
m4
233
15
-
1 40
9 14
0 -
33
8
9
-
-
-
-
-
-
Can
ada
47 7
45
31
-
655
6 69
0 45
1
981
-
-
-
-
-
-
-
Ch
ina
40 1
34
174
389
28 4
64
2 78
1 2
4 00
9
7
-
-
-
-
-
-
Ger
man
y17
862
61
-
1
253
182
3 1
176
9 -
-
-
-
-
-
Den
mar
k5
059
3 -
43
1
-
276
-
-
-
-
-
-
-
Spai
n9
264
24
-
1 27
4 29
3
2 44
3
-
-
-
-
-
-
-
Fin
lan
d4
861
1 -
-
-
-
-
-
-
-
-
-
-
-
Fran
ce16
093
24
-
2
509
88
80
2 39
7
-
-
-
-
-
-
-
UK
32 0
45
24
1 1
080
132
5 66
0
-
-
-
-
-
-
-
Ind
on
esia
9 57
1 3
-
639
143
-
-
-
5 31
9
-
-
-
3
3
Ital
y39
967
16
-
1 83
1 74
10
27
723
12
-
-
-
-
-
-
Jap
an37
0 85
1 61
-
10
5 08
8 22
363
54
4 31
323
10
-
-
-
-
-
-
Ko
rea
Rep
.30
692
26
58
11
317
6
430
277
1 22
1
10
-
-
-
-
-
-
Mal
aysi
a17
0 00
5 71
3
133
791
250
224
643
-
16 3
76
3
14
1
427
Net
her
lan
ds
9 94
7 24
-
85
8 49
-
36
7
1
-
-
-
-
-
-
Phili
pp
ines
7 03
0 16
-
1
368
-
-
-
-
-
-
-
-
-
-
Swed
en6
051
4 -
74
3
-
1
-
-
-
-
-
-
-
Sin
gap
ore
40 9
03
250
1 20
397
4
921
83
797
-
-
-
-
-
-
-
Taiw
an P
C51
599
24
8 76
13
194
2
600
977
5 71
2
16
3 88
3
-
2
4
953
29
3
USA
320
648
615
4 10
132
62
861
83
3 5
711
501
-
-
-
-
-
-
Vie
t N
am3
799
10
43
607
142
20
14
-
-
-
-
-
-
-
Oth
ers
331
199
4 11
4 1
923
39 6
54
5 00
0 99
4 6
208
40
22
931
4
61
84
1
928
14
515
8
912
Tota
l1
647
866
5 83
32
498
377
736
118
913
4 11
697
761
810
48 5
0946
410
01
932
15 4
729
635

The future of mariculture: a regional approach for responsible development in the Asia-Pacific region250
Qu
anti
ty o
f ex
po
rts
by
cou
ntr
y an
d c
om
mo
dit
y fr
om
Th
aila
nd
in 2
003
in t
on
nes
(So
urc
e: C
ITC
, 200
3)
In a
irti
gh
t co
nta
iner
sN
ot
in a
irti
gh
t co
nta
iner
sPr
epar
ed o
r p
rese
rved
Sard
ine
Tun
aO
ther
Shri
mp
Cra
bSq
uid
Asa
riSa
rdin
eTu
na
Shri
mp
Cra
bSq
uid
Asa
riFi
shSh
rim
pC
rab
Oth
erA
ust
ralia
1 42
0 26
626
7
632
202
207
1 32
6
1 98
0 3
614
-
48
341
4 48
1
-
-
56
5
Bel
giu
m
-
-
-
-
-
-
-
-
-
-
-
-
-
Can
ada
429
23 6
60
137
263
422
1 1
443
-
1
627
7 21
5 1
69
-
-
-
-
-
Ch
ina
-
-
-
-
-
-
-
-
-
-
-
-
-
Ger
man
y34
9
081
515
15
4 70
-
-
-
-
-
-
-
-
-
-
Den
mar
k
-
-
-
-
-
-
-
-
-
-
-
-
-
Spai
n
-
-
-
-
-
-
-
-
-
4
200
-
-
-
Fin
lan
d13
2 4
218
248
-
-
-
-
-
-
-
-
-
-
Fran
ce
-
-
-
-
3 43
5 -
-
-
-
-
-
-
-
Un
ited
Kin
gd
om
173
14 6
89
1 30
7 20
9 33
2 14
8
-
-
772
-
9 1
6 76
6
-
-
13
2
Ind
on
esia
-
-
-
-
-
-
-
-
-
-
-
-
-
Ital
y
-
-
-
-
2 82
8 3
7 98
7 31
-
-
-
-
Jap
an11
6 15
743
65
871
52
2 17
1 14
2
6 8
339
22 8
92
991
7 50
0 33
1 28
714
-
-
2
638
Ko
rea
Rep
.-
-
-
-
-
-
-
-
-
-
-
-
Mal
aysi
a4
193
1 95
6 61
6 2
1
-
-
-
-
-
-
3
899
-
-
115
Net
her
lan
ds
426
2 80
6 14
5 11
7 35
21
9 7
-
-
-
-
-
-
-
-
-
-
Phili
pp
ines
-
-
-
-
-
-
-
-
-
-
-
-
Swed
en4
068
596
25
113
-
-
-
-
-
-
-
-
-
-
Sin
gap
ore
2 20
5 1
631
761
3 29
22
-
-
-
-
-
-
5
615
-
-
81
Taiw
an P
C28
1
706
1 35
5
-
1 3
-
-
-
-
-
-
-
-
-
-
USA
3 76
8 83
839
15
267
3
734
4 63
3 16
2
642
3
3 24
222
65
568
92
15
9 25
11
902
-
-
2
251
Vie
t N
am
-
-
-
-
-
-
-
-
-
-
-
-
-
-
Oth
ers
30 8
41
136
379
7 07
1 1
346
1 95
6 84
4 20
2
2
039
26 5
95
8 21
5 22
1
285
168
49 0
26
9
-
3 02
8
Tota
l43
765
326
402
101
521
6 43
67
905
1 08
14
712
2 0
8469
026
108
279
1 11
310
057
897
114
603
9-
8 81
0

251
Viet Nam
Le XanResearch Institute for Aquaculture No 1Bac Ninh, Viet NamE-mail: [email protected]
Xan, L. 2008. Viet Nam. In A. Lovatelli, M.J. Phillips, J.R. Arthur and K. Yamamoto (eds). FAO/NACA Regional Workshop on the Future of Mariculture: a Regional Approach for Responsible Development in the Asia-Pacific Region. Guangzhou, China, 7–11 March 2006. FAO Fisheries Proceedings. No. 11. Rome, FAO. 2008. pp. 251–255.
bACKGROUNDViet Nam has more than 3 200 km of coastline with many bays and coastal areas, and thus thousands of hectares of brackish and marine areas with favourable natural conditions that are suitable for mariculture development. However, mariculture in Viet Nam has only developed within the past few years. The Vietnamese government has plans for the future development of mariculture and hopes to reach the target of 200 000 tonnes of farmed marine fishes by the year 2010.
Mariculture in Viet Nam’s national economyAfter only a few years of development, Viet Nam has become one of the top shrimp-producing countries in the world. In 2005 total production of fisheries in Viet Nam was 3 432 million tonnes, including:
1 437 million tonnes of aquaculture production;330 000 tonnes of shrimp;400 000 tonnes of catfish;22 289 tonnes of crab;114 570 tonnes of molluscs; and20 257 tonnes of seaweeds.
With its favourable potential, including natural conditions, Viet Nam wishes to develop mariculture and to elevate it to an important sector that contributes to economic development, creating jobs, assisting in poverty alleviation and increasing living standards for the people.
The domestic market in Viet Nam has great potential for the consumption of marine fisheries products because shrimp, fish and molluscs are preferred foods. In the Vietnamese diet, 40–50 percent of the daily protein consumption comes from aquatic products. Marine fishes are preferred to freshwater fishes because of their value. With a population of more than 80 million people and living standards increasing day by day, Viet Nam has a high and growing demand for seafood. Cities and industrial zones are growing or forming, which creates local markets for seafood consumption. Like the Japanese and Chinese, the Vietnamese people prefer live seafood, which mostly comes only from aquaculture. Furthermore, Viet Nam is near markets in China, Hong Kong SAR and the southwestern part of the People’s Republic of China. In recent years, ten tonnes of mariculture products, such as groupers, clams and lobsters have been sold daily in these markets.
With nearly 30 coastal provinces and half of the Vietnamese population living in coastal areas, mariculture plays an important role in poverty reduction. From the end
••••••
The future of mariculture: a regional approach for responsible development in the Asia-Pacific region252
of the twentieth century, the Government of Viet Nam has had policies to reduce fishing, especially in coastal areas. Over the last five years, marine fishery production has only increased slightly, mainly from offshore fishing. The government has issued policies to support the shift of fishermen from fishing to aquaculture. These policies have promoted the important role of mariculture in Viet Nam’s economy. Although mariculture has just developed within the last three to four years, the Ministry of Fisheries of Viet Nam has carried out its master plan for sustainable development as a guideline for local authorities to plan detailed aquaculture areas and issue their own policies to increase the development of mariculture. The Government of Viet Nam hopes to reach a target of 200 000 tonnes of marine fishes from mariculture by the year 2010 through its specific policies and methods.
CURRENT STATUS OF MARICULTURE IN VIET NAMSeed productionViet Nam began research on fish reproduction in 1996–1997. As of 2005, the following fish species have been reproduced:
Orange-spotted grouper (Epinephelus coioides)Currently, the Research Institute of Aquaculture No. 1 (RIA 1) can reproduce orange-spotted grouper with a 13–15 percent survival rate from larvae to fry (4–5 cm in length) over 60 days. The survival to 90 days (8–10 cm length) is 8–9 percent. Every year, with its facilities, RIA 1 can produce some 400 000–500 000 fry. This technology has been transferred to local areas in order to meet the demand of commercial mariculture.
Cobia (Rachycentron canadum)Rachycentron canadum is a species for mariculture with high commercial value. Currently, Viet Nam is one of a few countries that have successfully researched and established the breeding technology and commercial farming of this species. The species has very favourable breeding characteristics; the maturation rate of captive broodstock is about 65–78 percent; the spawning rate is more than 70 percent, the egg fertilization rate more than 60 percent, the hatching rate of eggs more than 70 percent; and survival rate from larvae to fingerling (5–6 cm in length) is on average 5 percent. In 2005 the survival rate had been increased to 15–20 percent. The technology has been transferred by RIA 1 to some private hatcheries. Over the past three years, RIA 1 has produced 250 000–400 000 fry (5–6 cm) per year for marine fish farms.
Red drum (Scaenops ocellatus)In 2003 artificial seed reproduction technology for red drum became well established. The maturation rate of broodstock is more than 72 percent, the egg fertilization rate is more than 75 percent, the egg hatching rate more than 80 percent; and the survival rate from larvae to 60-day fry more than 22 percent. In 2003, approximately 350 000 fry were produced, a figure that increased to 400 000 in 2004 and to 500 000 in 2005. The technology can be transferred to private hatcheries to increase the number of fry.
Seabass (Lates calcarifer) and Waigieu seaperch (Psammoperca waigiensis)RIA II and the University of Fisheries have successfully researched this technology. Now RIA I can manage this technology and transfer it to hatcheries. In 2005, research stations produced more than 400 000 fry (3–4 cm in length) to supply fish farms.
Molluscs, crabs and other speciesViet Nam has conducted successful research on the artificial seed production of mud crab, swimming crab, sea urchin and Babylonia snail, as summarized below (Table 1):
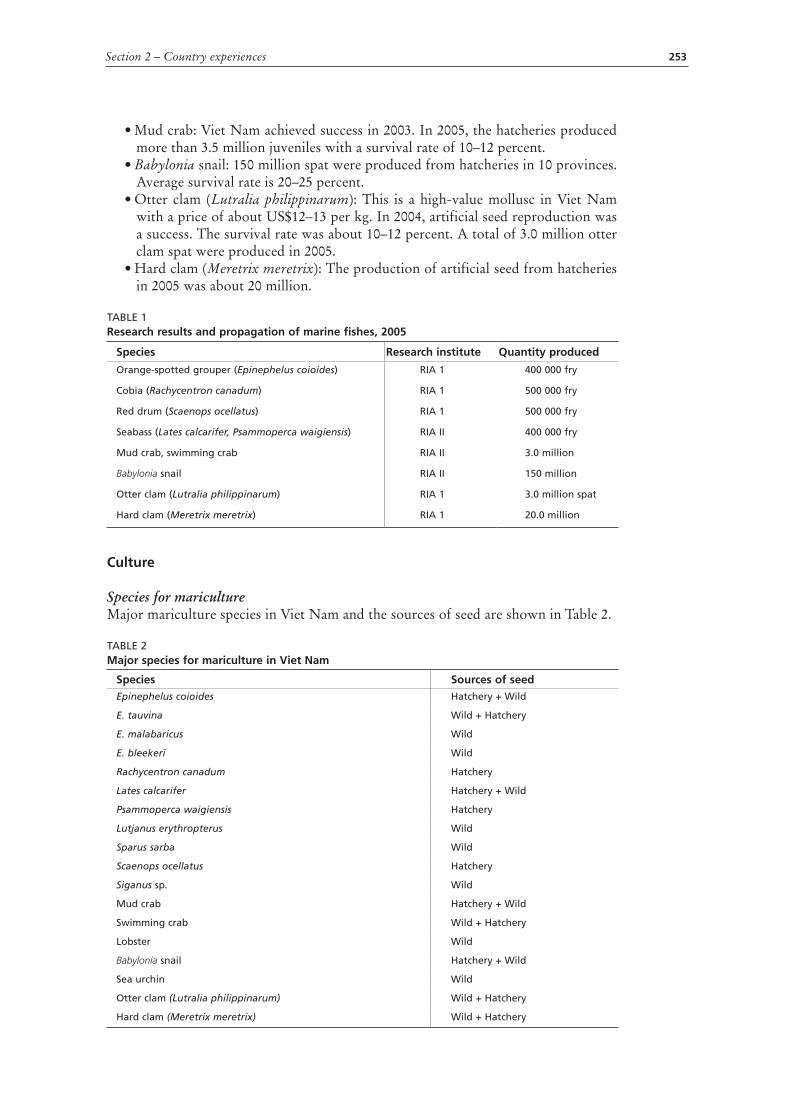
253Section 2 – Country experiences
Mud crab: Viet Nam achieved success in 2003. In 2005, the hatcheries produced more than 3.5 million juveniles with a survival rate of 10–12 percent.Babylonia snail: 150 million spat were produced from hatcheries in 10 provinces. Average survival rate is 20–25 percent.Otter clam (Lutralia philippinarum): This is a high-value mollusc in Viet Nam with a price of about US$12–13 per kg. In 2004, artificial seed reproduction was a success. The survival rate was about 10–12 percent. A total of 3.0 million otter clam spat were produced in 2005.Hard clam (Meretrix meretrix): The production of artificial seed from hatcheries in 2005 was about 20 million.
TABLE 1 Research results and propagation of marine fishes, 2005
Species Research institute Quantity produced
Orange-spotted grouper (Epinephelus coioides) RIA 1 400 000 fry
Cobia (Rachycentron canadum) RIA 1 500 000 fry
Red drum (Scaenops ocellatus) RIA 1 500 000 fry
Seabass (Lates calcarifer, Psammoperca waigiensis) RIA II 400 000 fry
Mud crab, swimming crab RIA II 3.0 million
Babylonia snail RIA II 150 million
Otter clam (Lutralia philippinarum) RIA 1 3.0 million spat
Hard clam (Meretrix meretrix) RIA 1 20.0 million
Culture
Species for maricultureMajor mariculture species in Viet Nam and the sources of seed are shown in Table 2.
TABLE 2Major species for mariculture in Viet Nam
Species Sources of seedEpinephelus coioides Hatchery + Wild
E. tauvina Wild + Hatchery
E. malabaricus Wild
E. bleekeri Wild
Rachycentron canadum Hatchery
Lates calcarifer Hatchery + Wild
Psammoperca waigiensis Hatchery
Lutjanus erythropterus Wild
Sparus sarba Wild
Scaenops ocellatus Hatchery
Siganus sp. Wild
Mud crab Hatchery + Wild
Swimming crab Wild + Hatchery
Lobster Wild
Babylonia snail Hatchery + Wild
Sea urchin Wild
Otter clam (Lutralia philippinarum) Wild + Hatchery
Hard clam (Meretrix meretrix) Wild + Hatchery
•
•
•
•

The future of mariculture: a regional approach for responsible development in the Asia-Pacific region254
Cage cultureAccording to the Department of Aquaculture of the Ministry of Fisheries (2004), there were 40 059 cages in 2004 (excluding cages for cultivated pearls). Production of marine fish from cage culture in 2005 is estimated as 5 000 tonnes. Cage farming of lobster produced another 1 795 tonnes.
Cage culture is found mostly in the provinces of Quang Ninh, Hai Phong, Thanh Hoa, Nghe An, Ha Tinh, Phu Yen and Ba Ria–Vung Tau. There are two kinds of cages found in Viet Nam:
Cages with wooden frame with a size of 3x3x3 m or 5x5x5 m. This is the most popular cage in most provinces. Norwegian-style cages (produced in Viet Nam) that are popular in Nghe An and Vung Tau with plastic frames that can withstand a Force 9–10 storm and waves.
Pond cultureMariculture in ponds has been developed since 2002–2003 in some northern and central provinces. Fish species for this type of culture are Epinephelus coioides, Lates calcarifer, Psammoperca waigiensis, Sparus sarba and Scaenops ocellatus. Production of fish from pond culture is on average 12–13 tonnes per year.
Current status and problems of mariculture
Aquatic animal seedViet Nam has the technology for reliable reproduction of five mariculture species, but this is still mainly on an experimental scale in research institutes. The quantity of seed is insufficient and the price is high. Farmers usually source seed from the wild or import from China or Taiwan Province of China.
Grow-out cultureViet Nam is developing mariculture in closed bays in coastal areas that are sheltered from waves and wind. This farming is done mainly by small-household-operated cages. For this reason, market production is not concentrated and the product is mostly sold for the live fish trade. Almost all households use trash fish as food for mariculture, causing negative environmental impacts. Pollution in some culture areas is critical due to high cage densities without master planning. Cage culture in the open sea is not developed due to high investment costs and marketing concerns for large volumes of product from such systems.
Fish diseaseFish disease is associated with high densities of farms and poor seed quality. Vaccine development through research has just started. However, vaccine development is difficult for marine fish farming because of the many species of fish that are cultured and the wide variety of diseases. For this reason, seed quality, environmental management of mariculture and disease prevention must be the highest priority.
Technology transferTransfer of technology started in 2004–2005 but considerable constraints remain. Difficult and high-risk technology and lack of capital are major problems that constrain the uptake of technology at the farm level.
Mariculture was developed to assist households in transferring from coastal fishing to farming. In the future, a diverse mariculture development is required, including cage culture, pond culture and polyculture (e.g. 1 shrimp crop and 1 fish crop per year) that may assist farmers to manage risk and help in poverty reduction. However, environmental problems need urgent attention to ensure that water quality can be maintained for sustainable development.
•
•

255Section 2 – Country experiences
FUTURE DEVELOPMENT STRATEGY By 2010, the plan of the Government of Viet Nam is to achieve a production of 200 000 tonnes of farmed marine fish per year. To achieve this target, given the current state of mariculture development, natural and social conditions, investment, technology and market, we consider the strategy for development of mariculture in Viet Nam from 2006–2010 as follows:
Seed reproduction Seed is the first condition for development. It is necessary to hasten development of technology for seed production and the transfer technology to hatcheries. This requires:
Research on reproduction technology that is based on a multispecies hatchery approach with species that have a high market demand. Emphasis should be placed on fish that can enter frozen market chains (red drum, sea carp, red seabream) and fish low in the food chain (Siganus, milkfish, mullet). Work to manage and control broodstock quality for high-value species and to expand research on genetic quality in broodstock.Studies on high-quality seed, including specific pathogen-free (SPF) seed production; andExploration of vaccines for selected species with potential for high-volume production.
Hatcheries that are inactive or have limited activities should be rehabilitated and developed to increase the number and output of high-quality seed from hatcheries.
Commercial mariculture The development of grow-out systems for mariculture requires a number of priority activities:
Local governments should hasten the preparation of master plans to identify and plan areas for mariculture, including marine fish and mollusc culture. Local-level policies and methods for development of mariculture should be specified in the plans. Intensive cage culture should not be concentrated at one place.Research on new culture technology, high productivity, biosecurity and safe product is required to support development of a modern industry. Feeds and feed management need urgent attention (including use of floating food) to assist and encourage farmers to adopt quality formulated diets to reduce use of trash fish.Fish species should be developed for mass production, based on pelleted feed, for culture in cages and ponds. Focus should be on markets that accept fresh, frozen or filleted product, such as red snapper, mangrove snapper, red drum and seabream.Multi-species culture should be developed for cages in closed and semi-closed bays and for pond culture. Shrimp ponds can be used to culture marine fish to produce export products and improve the pond environment. Hasten polyculture in shrimp culture areas in order to reduce shrimp disease, increase the effective use of land and improve the environment.
Intensified cooperation with Asian and other countries should be promoted to learn and exchange experiences in seed reproduction and marine culture fish, disease prevention and more generally, to facilitate rapid development of sustainable mariculture.
REFERENCEMoF. 2004. Annual report: aquaculture in Vietnam. Ministry of Fisheries, Viet Nam.
•
•
•
•
•
•
•
•
•


257
The Pacific Islands
Ben PoniaSecretariat of the Pacific CommunityAnse Vata, New CaledoniaE-mail: [email protected]
Ponia, B. 2008. The Pacific Islands. In A. Lovatelli, M.J. Phillips, J.R. Arthur and K. Yamamoto (eds). FAO/NACA Regional Workshop on the Future of Mariculture: a RegionalApproach for Responsible Development in the Asia-Pacific Region. Guangzhou, China,7–11 March 2006. FAO Fisheries Proceedings. No. 11. Rome, FAO. 2008. pp. 257–260.
bACKGROUNDMariculture is a primary development option for the Pacific region1 because it is essentially a coastal region with a network of some 500 inhabited islands. The region covers an exclusive economic zone (EEZ) of 32 million km2 comprising 8 million inhabitants. Three-quarters of the population live in rural areas, often in remote locations.
Geographically and culturally the Pacific is often divided into three main areas: Melanesia, to the west, comprises the bulk of the landmass; Micronesia, to the north, is mostly atoll formations; and Polynesia, the triangular area in the central and eastern part of the region, is a mixture of high volcanic islands and atolls. The Pacific region is a hotspot for ethno-biodiversity, which translates into a diverse setting for aquaculture development.
KEY COMMODITIESCultured pearlsThe world’s supply of cultured black pearls from black-lip pearl oyster (Pinctada margaritifera) is provided almost entirely by French Polynesia and the Cook Islands, where the oysters are naturally plentiful. In these countries the pearl industry is the second most important economic sector after tourism. French Polynesia reached a peak in annual production in 1999 valued at US$164 million (Institut des statistiques de Polynésie française). In the Cook Islands, a production of about US$9 million was achieved in 2000 (Cook Islands Government Statistics). Thereafter an overproduction of poor quality pearls and disease mortality (particularly in the Cook Islands) reduced the total value of exports to around US$128 million in 2005. Elsewhere in the region, pearl farms have been established in the Fiji Islands, Marshall Islands, Federated States of Micronesia, Solomon Islands, Kiribati, Papua New Guinea and Tonga.
Marine prawnsNew Caledonia is the largest producer of marine prawns in the region. In 2004 the country produced 2 200 tonnes (worth US$22 million) of the western blue prawn (Litopenaeus stylirostris). The domestic demand is estimated at 540 tonnes (Source: Government Statistics).
There are a number of marine prawn farms operating in the Pacific Islands, such as in French Polynesia, Fiji, Vanuatu and Saipan, raising a variety of species (i.e. Penaeus monodon, L. vannamei and L. stylirostris).
1 The region is defined in this report as that area encompassing the 20 Pacific Island member countries and territories of the Secretariat of the Pacific Community (SPC).

The future of mariculture: a regional approach for responsible development in the Asia-Pacific region258
Kappaphycus seaweedFor the past decade Kiribati has been the main source of seaweed in the Pacific. In 1999, 1 200 tonnes were exported with a value of US$360 000. In the past five years, a single atoll, Fanning Island, has been almost the sole producer of seaweed
In the late 1980s, Fiji rejuvenated its seaweed farming and for five years after that exported around 500 tonnes per annum. Thereafter production declined drastically, reportedly due to domestic marketing and distribution problems. The government has recently launched an aggressive campaign to rejuvenate the industry in the Lau Group atoll lagoons.
In 2002, seaweed farming was revived in the Solomon Islands after an earlier project ceased in 1991. Although this programme has restricted its target sites, the production has increased exponentially from just 4 tonnes in 2002 to an anticipated export crop of 500 tonnes for 2006 (Source: Government Statistics).
OthersThe Pacific is an important source in the global marine ornamental industry. Most of the trade involves wild-caught fish, corals and invertebrates. About 75 percent of the region’s export is from Fiji, where the industry is worth some US$19 million.
Giant clam cultivation for the marine ornamental market is one of the most common forms of aquaculture in the region. Commercial hatchery production occurs in Fiji, Palau, Marshall Islands, Tonga, Vanuatu, Cook Islands, Kiribati, Samoa and American Samoa. There are probably between 30 000–50 000 giant clam pieces exported per annum.
Coral cultivation for the ornamental market is done in several countries, particularly Fiji, Vanuatu and Marshall Islands. The largest commercial farm, in Fiji, produces 25 000 pieces from 40 species. In 2003 the annual trade in live rock was estimated at 700 000 tonnes, almost entirely wild harvested, with just 50 000 pieces currently under cultivation.
Several species of marine fish are farmed for commercial purposes. In French Polynesia the majority of commercial barramundi farms have turned their interest towards the local fish species moi (Polydactylus sexfilis) and the batfish (P. orbicularis). Several countries raise milkfish (Chanos chanos) for the tuna baitfish industry. Other varieties of marine finfish are also farmed.
Mozuku seaweed (Cladosiphon sp.) has a sushi market in Japan, traditionally supplied from Okinawa Island. However the seaweed occurs naturally in the sub-tropical belt of the Pacific. In Tonga about 250–350 tonnes of mozuku is harvested per year, of which between 50–100 tonnes is cultivated. The dried product exported to Japan fetches up to US$150/kg.
Perhaps the most interesting technology to emerge in recent times is the use of crest nets or light traps to attract settling larvae. The use of crest nets has been tested for a number of years in the region, particularly in the Solomon Islands and French Polynesia. In the latter, one commercial operator handles up to 160 species of fish and crustaceans, targeting ornamental species. Trial production of food species has been also successful.
Marine aquaculture products demand, trade and marketsThe major constraint to market access in the Pacific is its remoteness, which leads to poor transportation links. Freight costs are high and space is scarce. It is particularly so for the high-value fresh or live food markets overseas.
Processing technology for high-value food products has been applied to overcome the hurdle of sea freight and meet stringent quality controls. The best example of this is mozuku seaweed (Cladosiphon sp.) from Tonga and paradise prawns (L. stylirostris) from New Caledonia, which are exported by sea to the demanding sushi market in Japan where they are reconstituted and eaten raw. For mozuku seaweed a patented drying technology was developed that reduces the seaweed to 25 times its original volume.

259Section 2 – Country experiences
Given the diverse range of produce and the distances between farming centers, the marketing chains tend to operate separately, and so there are few examples of cooperative marketing approaches in the region. There are also geopolitical divisions under which traditional trading partnerships have been well forged. For example, French territories enjoy a special trading relationship with the European Union, as do the United States of America affiliated territories with the mainland. However, some producers remain outside these arrangements, and much work needs to be done to break down trade barriers between countries within the region.
Unstable production in the past had constrained long-term market development and regionally coordinated efforts. This can be attributed to a variety of reasons such as natural disasters, currency devaluation, economic downturns, political instability and even apathy among farmers. Another destablizing factor has been the tendency to fall prey to “travelling salespersons” and “spot prices”, so that inflated market opportunities have fuelled hopes of success that were unfulfilled and expectations of high profits that did not materialize. Such problems have set back long-term development.
LIVELIHOOD OPPORTUNITIES RELATED TO MARICULTURE DEVELOPMENTThere are diverse types of fisheries in the Pacific but the majority of coastal fisheries are of a subsistence or semi-commercial nature. Commercial coastal fisheries often suffer from a “boom-bust” cycle caused by overfishing. In particular, this applies to slow-moving invertebrates such as trochus (Trochus niloticus) and sea cucumber (holothurians).
The consensus is that aquaculture may be a useful intervention to help sustain resource management of these types of fisheries, but it is unlikely that aquaculture alone will solve the problem. One reason for this is the long period before harvesting takes place. Also traditional tenure systems make it difficult to secure legally enforceable property rights, particularly if it impedes access to fishing grounds.
Many of the Pacific region’s coastal dwellers in the rural areas rely on subsistence lifestyle and strong communal support. Therefore they often need cash for basic requirements, staple foods, school fees, church donations and other purposes.
The introduction of Kappaphycus seaweed has provided positive examples of mariculture providing rural livelihoods with household cash. Its relative ease of production and stable farm-gate price are suited to the rural lifestyle. Furthermore there are often few sources of cash income, and these may involve intensive manual labour such as copra making, sea cucumber collection or tuna fishing, which restricts the entry of women. Seaweed farming has therefore opened up an alternative pathway for women to earn money.
There is a general perception that the cash paid to women for seaweed is better directed towards essential household needs, i.e. education, health, food etc. as compared to the cash paid to men, which has been widely seen as being spent on household non-essentials such as alcohol.
EXISTING AND POTENTIAL MECHANISMS FOR TECHNOLOGY TRANSFERAquaculture research and development (R&D) has been a challenging experience for the region. Many of the early ventures failed because projects were simply initiated on the basis of their technical feasibility for cultivation and did not incorporate a holistic approach that included economic (marketability), social (labour costs) and environmental (impact on biodiversity) factors.
Even so, the applied research necessary to properly assess the biotechnical basis for aquaculture remains incomplete for many species. Furthermore, development agencies often lack the skills to translate research findings into practical extension training modules that farmers are able to understand and apply. There remains a critical need to build extension services capacity.

The future of mariculture: a regional approach for responsible development in the Asia-Pacific region260
Similarly, there is limited capacity for socio-economic and environmental planning. Very few countries have proper systems for governance of aquaculture. There are hardly any policies and regulations specific to managing the aquaculture sector.
Bottlenecks in technology transfer have occurred when government-funded programmes became competitors with the private sector. The underlying requirement is that there is a need for a clear and agreed national development strategy that outlines the roles and responsibilities of key stakeholders within the sector. Such fundamental planning is lacking in many countries.
The Pacific region is fortunate to have a network of about a dozen key mariculture facilities in operation. Most are operated under government programmes that make collaboration possible through inter-governmental organizations such as the Secretariat of the Pacific Community (SPC). Essentially this provides a focal body through which lessons can be shared and a country can avoid the duplication of trials and pitfalls experienced elsewhere. Such a body also enables the region to prioritize common issues and act in a collective manner to deal with them.