improving lucf ghg inventory and the fao fra: the philippine case rodel d. lasco environmental...
TRANSCRIPT

IMPROVING LUCF GHG IMPROVING LUCF GHG INVENTORY and the INVENTORY and the FAO FRA: FAO FRA: the Philippine Case the Philippine Case
Rodel D. LascoRodel D. LascoEnvironmental Forestry ProgrammeEnvironmental Forestry ProgrammeUniversity of the PhilippinesUniversity of the Philippines
Introduction
evolution of GHG inventory in the LUCF sector in the Philippines
research efforts in improving GHG inventory in LUCF
The role of the FAO FRA project

I. Changes in forest and woody biomass
2 THE IPCC GUIDELINES FOR LUCF
DATA NEEDS:•area of forests•annual growth rate•carbon fraction of dry matter•commercial harvest•fuelwood use •other wood used
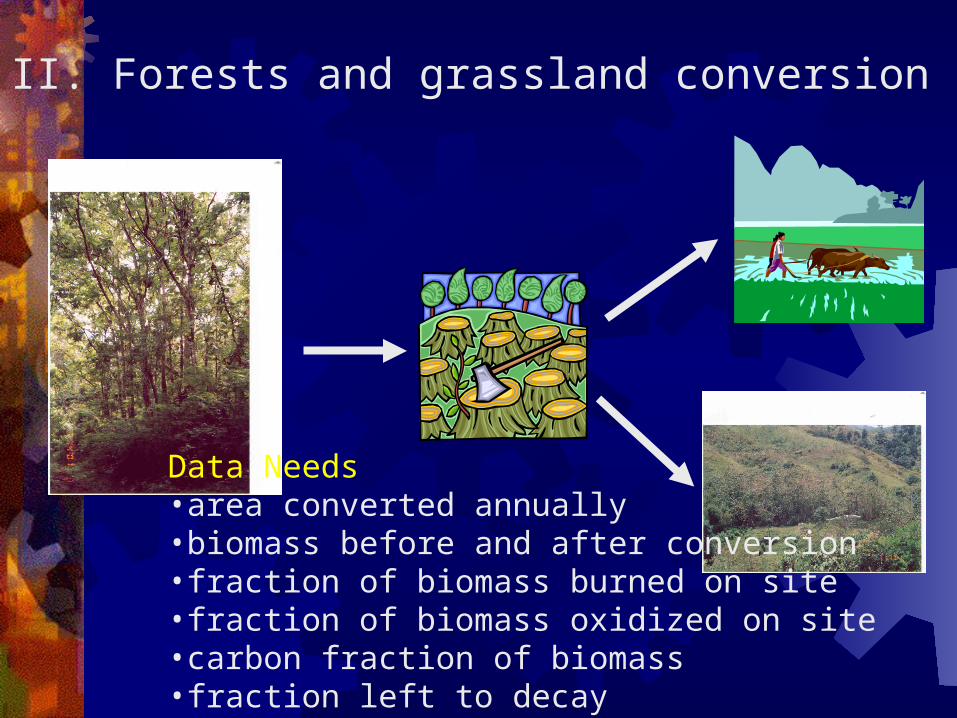
II. Forests and grassland conversion
Data Needs•area converted annually•biomass before and after conversion•fraction of biomass burned on site•fraction of biomass oxidized on site•carbon fraction of biomass•fraction left to decay

III. CO2 emissions and uptake by soils
Data Needs:•Soil carbon•Land area•Base factor •Tillage factor•Input factors•Annual C loss rate•Total annual lime

Relationship among IPCC module categories
Worksheet 5-2
Worksheet 5-3
Worksheet 5-4
Worksheet 5-5
Worksheet 5-6

3 EVOLUTION OF GHG INVENTORY IN THE PHILIPPINE LUCF SECTOR
Source
1990 inventory(1997 US Country
Studies)1990 inventory(1998 ALGAS)
1994 inventory(1999 Philippine
Nat. Comm.)
Change in Forests and biomass stocks -48654 2622 -68323
Forest and grassland conversion 120738 80069 68197
Abandonment of managed lands -1331 -1331 Not determined
Net Emissions 70,753 81,360 -126
Total Philippine emissions 128,620 164,103 100,738
% of total emissions 55.01 49.58 -0.13
In Gg CO2 equivalent
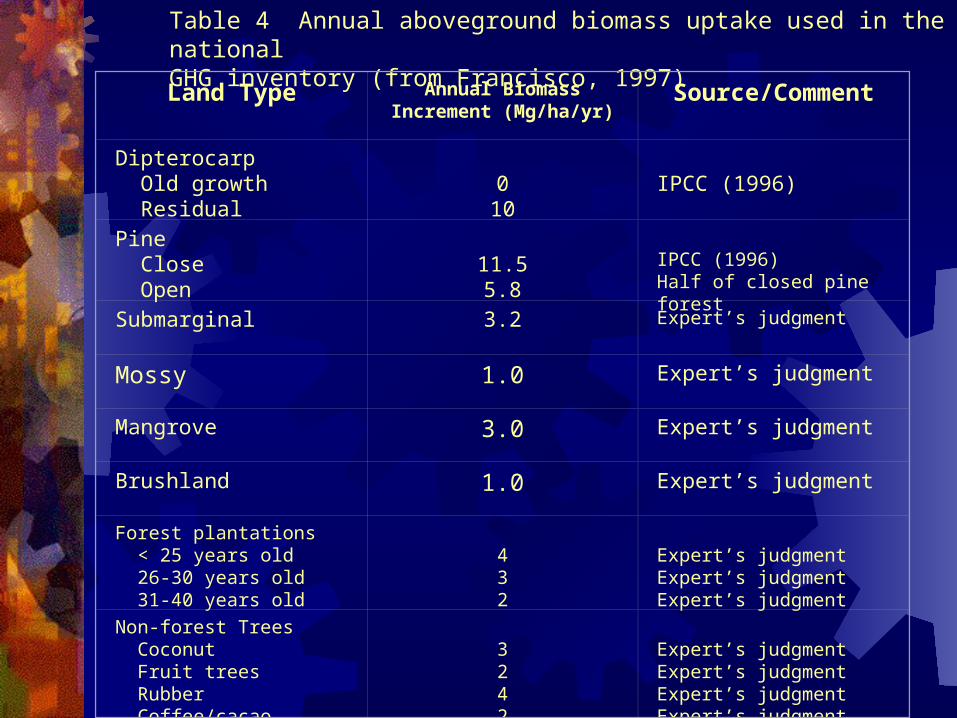
Table 4 Annual aboveground biomass uptake used in the Philippine national GHG inventory (from Francisco, 1997)
Land Type Annual Biomass Increment (Mg/ha/yr)
Source/Comment
Dipterocarp Old growth Residual
0
10
IPCC (1996)
Pine Close Open
11.55.8
IPCC (1996)Half of closed pine forest
Submarginal 3.2 Expert’s judgment
Mossy 1.0 Expert’s judgment
Mangrove 3.0 Expert’s judgment
Brushland 1.0 Expert’s judgment
Forest plantations < 25 years old 26-30 years old 31-40 years old
432
Expert’s judgmentExpert’s judgmentExpert’s judgment
Non-forest Trees Coconut Fruit trees Rubber Coffee/cacao
3242
Expert’s judgmentExpert’s judgmentExpert’s judgmentExpert’s judgment
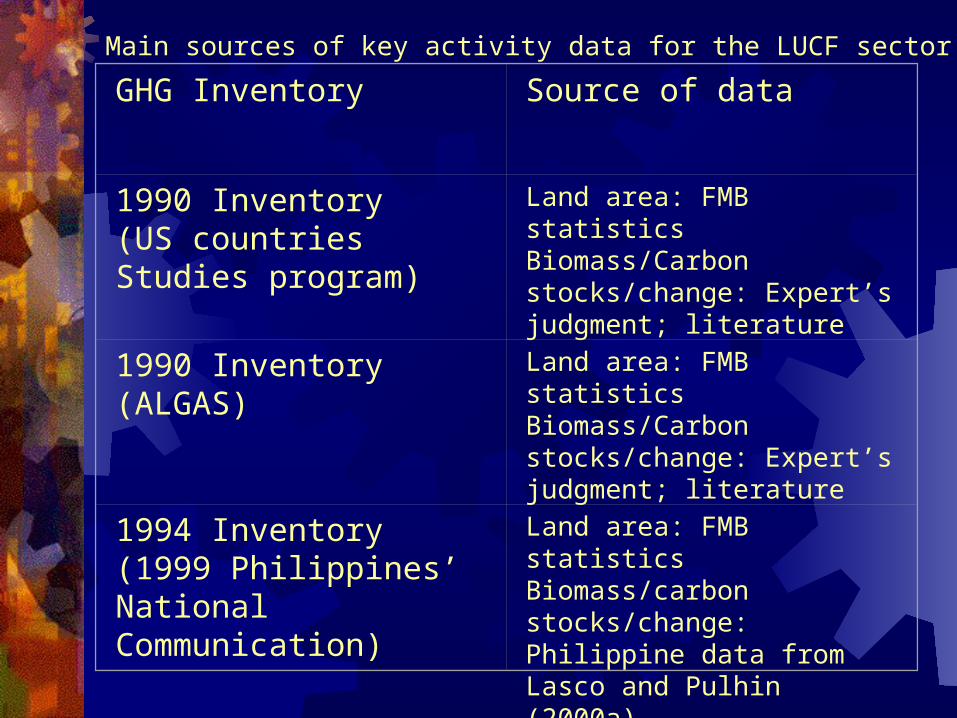
Main sources of key activity data for the LUCF sector
GHG Inventory Source of data
1990 Inventory (US countries Studies program)
Land area: FMB statisticsBiomass/Carbon stocks/change: Expert’s judgment; literature
1990 Inventory(ALGAS)
Land area: FMB statisticsBiomass/Carbon stocks/change: Expert’s judgment; literature
1994 Inventory(1999 Philippines’ National Communication)
Land area: FMB statisticsBiomass/carbon stocks/change: Philippine data from Lasco and Pulhin (2000a)

4 Research Efforts to Improve GHG Inventory
LUCF research intensified in the last few years
Through Environmental Forestry Programme

189 (48%)
2.3 (0.6%)
1.2 (0.3%)4.8 (1.2%)
SOC= 191 (49%)Roots = 4.3 (1.1%)
Fig. 1 Carbon density (t/ha) of natural forests in Leyte, Philippines
Total C density= 393 t/ha

0
20
40
60
80
100
120
140
160
180
tC/ha
OGF SGF Gmelina (6yr) Agroforestry Grassland
Fig. Carbon density of various land cover in the project site

0.0
1.0
2.0
3.0
4.0
5.0
6.0
7.0
8.0
tC/ha/yr
OGF SGF Gmelina Eucalyptus Acacia Mahogany Dipterocarp Agroforestry Grassland
Fig. Carbon MAI of various land cover in project site

Table 6 Comparison of results between the 1994 inventory and latest inventory
Source
Mtons CO2 or CO2 equivalent
1994 Inventory(Philippine NC,
1999)
1997-98 Inventory(Lasco 2001)
Biomass growth
-111
-222
Harvests 42 31
On site and off site burning
36 25
Decay 33 23
Net Absorption
<1 (0.126)
-142

FAO FRA in the Philippines Objective: to develop capacities of forest
institutions to design, plan, implement forest inventory projects and manage information
Using systematic inventory sampling design 82 1 x 1km field observation sites (FOS) Eventually: 395 FOS nationwide four 20 x 250m plots per FOS Bio-physical and socio-economic variables will be
collected Tree diameter, height; biodiversity; soil samples

Potential Synergy with GHG Inventory
FRA could provide key activity data: area of forest types
With minimal cost: above-ground and below ground carbon can be measured

STEP 1
A B C D E
Area of Forest/Biomass
Stocks(Mha)
Annual Growth Rate(t dm/ha/yr)
Annual Biomass
Increment[x 1 yr]
(Mt dm)
Carbon Fraction of Dry Matter
Total Carbon Uptake
Increment(kt C)
Forest
Dipterocarp C = A x B
E = C x D x
1000
Old Growth 0.805 2.10 1.69 0.50 845
Residual 2.730 6.50 17.75 0.45 7,932
Pine 0.228 5.80 1.32 0.45 591
Submarginal 0.475 3.20 1.52 0.45 679
Mossy 1.040 1.00 1.04 0.45 465
Mangrove 0.112 3.00 0.34 0.45 150
Tree Plantation 0.518 12.00 6.22 0.43 2,680
Upland farms 14.120 3.00 42.36 0.45 19,062
Brushland 2.232 3.20 7.14 0.45 3,214
Grassland 2.447 0.00 0.00 0.4 0
SUBTOTAL 35,619
FRA data


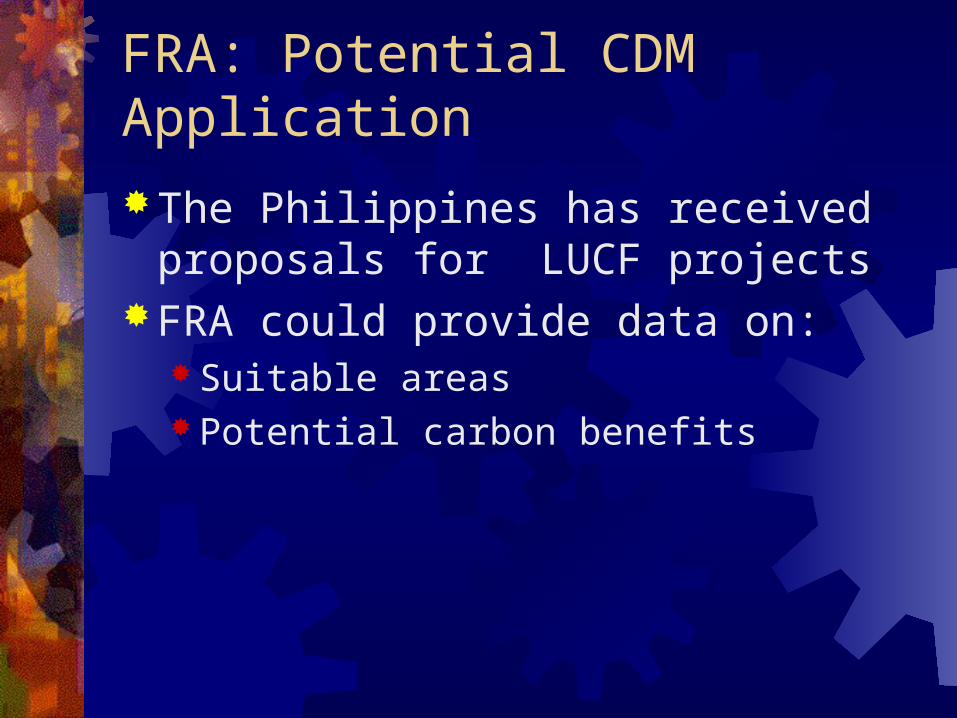
FRA: Potential CDM Application
The Philippines has received proposals for LUCF projects
FRA could provide data on: Suitable areas Potential carbon benefits

An Example: Mitigation Potential OGF Dipterocarp forests will be protected for biodiversity Rehabilitate open grassland areas and degraded brushland
areas by reforestation/afforestation and natural regeneration Main determinant for additional areas under mitigation is the
demand for wood products
High Scenario correspond on 25-year Master Plan aggressive tree planting program (100-150,000 ha/yr)
Low Scenario 50% of high scenario

Annual Rate of Area Development High Scenario Low Scenario Year 2000-2009 Short rotation plantation 40,000 20,000 Long rotation plantation 40,000 20,000 Forest regeneration 10,000 5,000 Forest protection Bio-energy 10,000 5,000 Year 2010-2019 Short rotation plantation 45,000 22,500 Long rotation plantation 45,000 22,500 Forest regeneration 20,000 10,000 Forest protection Bio-energy 15,000 7,500 Year 2020-2030 Short rotation plantation 55,000 27,500 Long rotation plantation 55,000 27,500 Forest regeneration 25,000 12,500 Forest protection Bio-energy 15,000 7,500

HS2008 LS
HS2012 LS
Short rotation
Long rotation
Regeneration
Forest conservation
Bioenergy
0
2,000
4,000
6,000
8,000
10,000
12,000
14,000
16,000
18,000
Year/Scenario
Option
CARBON STOCKS ('000 t)
Short rotation
Long rotation
Regeneration
Forest conservation
Bioenergy

Concluding Remarks Large uncertainty remains on LUCF GHG
inventory Much progress has been done in the last few
years but much remains to be done The FAO FRA presents a great opportunity to
improve GHG inventory dramatically a nationwide systematic sampling design Carbon measurements can be incorporated Results may also be useful for CDM
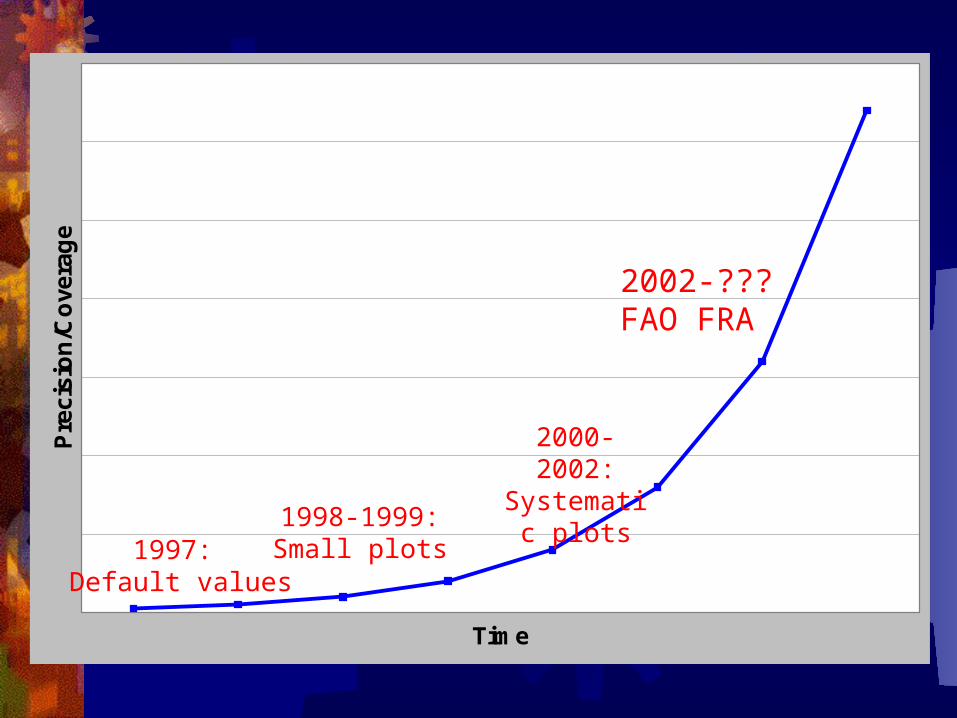
Time
Pre
cisi
on
/Co
vera
ge
1997: Default values
1998-1999:Small plots
2000-2002:Systematic plots
2002-???FAO FRA

“People always talk about the weather,but nobody actually does anythingabout it.”
Mark Twain
Thank you!!!