the open fuels & energy science journal · of the vessel, providing an oxygen ... 50 the open...
TRANSCRIPT
Send Orders for Reprints to [email protected]
48 The Open Fuels & Energy Science Journal, 2017, 10, 48-67
1876-973X/17 2017 Bentham Open
The Open Fuels & Energy ScienceJournal
Content list available at: www.benthamopen.com/TOEFJ/
DOI: 10.2174/1876973X01710010048
RESEARCH ARTICLE
Comparison of Two Coal-Gasifier-Designs with Moving-Bed andInternal-Circulating-Fluidized-Bed Configuration in One Reactor
Martin Schurz*, Alexander Laugwitz, Steffen Krzack and Bernd Meyer
Department of Energy Process Engineering and Chemical Engineering, TU Bergakademie Freiberg, Fuchsmühlenweg9, Reiche Zeche, 09596 Freiberg, Germany
Received: February 08, 2017 Revised: May 19, 2017 Accepted: June 13, 2017
Abstract:
Background:
Coal gasification is the promising technology for syngas routes to produce chemicals or transportation fuels. Additionally, it enablesclean power generation from coal in Integrated Gasification Combined Cycles (IGCC). So far, coal fines with high ash contentscould not be feasibly used in such routes.
In this regard, the Internal Circulation gasifier (INCI) is designed to gasify high-ash coal fines efficiently. The staged system iscombining a moving bed, a fluidized bed and a jetting fluidized bed in one reaction chamber.
Method:
The present paper substantially describes the laboratory-scale prototype development in the COORVED-project (“CO2-reduction byinnovative gasifier design”) based on the INCI gasification principle of about 50-125 kW thermal input. Information about thegasifiers compounding, especially the reaction chamber, peripheral components and applied measurement systems are given.
Results:
Experimental results are presented, confirming the targeted, typical flow pattern inside the reaction chamber. Furthermore technicaland operational limits of the COORVED prefiguration are discussed. Based on these results a major design change of the reactionchamber is required and explained in detail. Additionally, results of the feedstock variation from coke to lignite are shown.
Conclusion:
Finally, the operability of the INCI gasification principle is proven by a stationary operating system with controlled ashagglomeration.
Keywords: Fluidized bed gasification, High-ash coal, COORVED gasifier, INCI, Internal circulation, Ash agglomeration.
1. INTRODUCTION
1.1. Concept of Internal Circulation Gasification Principle
The INCI gasifier, which was developed and patented by the TU Bergakademie Freiberg, is designed to beespecially suitable for high-ash coal fines [1 - 9]. It provides the possibility to convert this difficult feedstock, whichusually remains unused, into a synthesis gas. Gräbner et al. [10] are defining the thermodynamically optimal operationtemperature for coals with different ash contents (5-45 wt.% (wf)). This optimal temperature is found between 1,200 Kand 1,600 K for a 30 bar gasifier. As an example, a high-ash South African coal with an ash content of 25.3 wt.% (wf)
* Address correspondence to this author at Department of Energy Process Engineering and Chemical Engineering, TU Bergakademie Freiberg,Fuchsmühlenweg 9, Reiche Zeche, 09596 Freiberg, Germany; Tel: +49-(0)3731-39 4483; E-mail: [email protected]

Comparison of Two Coal-Gasifier-Designs The Open Fuels & Energy Science Journal, 2017, Volume 10 49
has an optimal exit gas temperature of 1,253 K or 1,408 K for maximizing cold gas efficiency or syngas yield,respectively. Thus the targeted gas outlet temperature for the INCI gasifier concept is 1,270-1,370 K in order toapproach the thermodynamically optimum for a wide range of high-ash coals. The mean operational temperature in thereactor is 50-100 K higher. This temperature is between the ash softening and fusion temperature for most coals. In thistemperature range, coal particles tend to be sticky. If the volume fraction of particles is sufficiently high, agglomeratesmight be formed. These conditions can be found in agglomerating fluidized-bed gasifiers, such as the U-Gas gasifier[11 - 13], the AFB (or ICC CAS) gasifier [14] or the KRW gasifier [15]. These agglomerating fluidized-bed gasifiersachieve carbon conversion rates above 95%. Based on the U-Gas-technology the company Synthesis Energy Systems iscurrently marketing fluidized bed gasifiers with ash-agglomertion. Gräbner [3] mentioned two U-Gas-gasifiers each of400 t/d coal currently operating in China, Zaozhuang City. Also the AFB-gasifier is currently operating in China withunits up to 324 t/d coal [3]. However, a post treatment of the bottom ash and dust is still necessary in these commercialash-agglomerating gasifiers. The INCI gasifier concept is a combination of an agglomerating fluidized-bed and amoving-bed gasifier. Combining several flow patterns inside the gasifier allows for internal post-gasification of carbon-containing agglomerates. The major drawback of fluidized bed gasifiers of restricted carbon conversion can beeliminated by the ash agglomeration. Thus, a selective separation of ash from the fluidized bed is possible, whichreduces the carbon losses by the bottom product. As a result, the overall carbon conversion rate is above 99% and anexternal post-treatment of the bottom product is not required. Bituminous coal, lower in reactivity, can be successfullyconverted as well. Due to its raw gas outlet temperature (1,270-1,370 K), the INCI gasifier shows the highest cold gasefficiency and syngas yield, compared to the other investigated gasifiers, if high-ash coals are processed [10, 16].Difficulties of ash agglomerating gasification processes, working just in a small range of feedstock specific optimalsettings, can be neglected in the INCI-gasifier, due to its manifold opportunities of precise local temperature control.The increased oxygen consumption compared to non-agglomerating fluidized bed gasifiers [3] is also balanced by thehigh performance regarding the achievable cold-gas-efficiency and syngas-yield in the INCI-gasifiaction-process. Thesimulation-based expectations on the industrial-scale INCI-plant are given by Gräbner [3], leading in high values forcold-gas-efficiency > 83.5% and syngas-yield > 1.85 m3(H2+CO;STP)/kg(waf) at a carbon conversion above 99%. Thecalculation for the industrial scale unit (thermal capacity: 500 MW) is based on heat losses (heat transferred to thewater-wall) of about 1.5%. The INCI gasifier is showing very good performance compared to other fluidized bedgasifiers, especially for high-ash coals.
1.2. Flow Pattern of INCI Gasification Principle
As shown in Fig. (1) and mentioned in [1 - 5], the INCI gasifier combines different flow patterns in one reactionchamber. A moving bed can be found at the bottom. Here, the post-gasification of carbon-containing agglomerates takesplace using an oxygen-containing secondary gasification agent. Above the moving bed different fluidized-bed zonesevolve with height. Between the moving bed and the level of coal feeding and injection of the primary gasificationagent, a bubbling or turbulent fluidized bed is present. Gases, leaving the moving bed at its top, serve as fluidizationagent. These gases are a mixture of syngas from post-gasification and unreacted secondary gasification agent. Thetemperature in this fluidized-bed zone is below the ash sintering point (Tsinter), thus no formation of agglomerates ispossible there. For some ashes the sinter temperature can be several hundred Kelvin below the initial deformationtemperature [11, 17, 18]. Because the targeted particles are coal fines, usually < 500 μm, a lower fluidization velocity isrequired in comparison to conventional fluidized beds.
At a certain height, the primary gasification agent is added. Several nozzles are distributed around the circumferenceof the vessel, providing an oxygen-steam mixture as high-velocity gas jets. Because the nozzles are positioned in aboxer arrangement, these jets will conjoin and an up-flowing central gas jet evolves. In this manner, a jetting fluidizedbed, described e.g. in [19, 20], is established. At the same level the coal is fed. Oxygen in the central jet promotesexothermic combustion reactions. Consequently, the jet will yield a central flame-like zone, with temperatures (Tjet)above 2,300 K. Due to the nature of a free jet, a recirculation cell emerges. Whilst the fast up-flowing jet has a voidfraction close to unity, the down flow in the annular region shows an increased particle volume fraction. The higherparticle load in the recirculation cell is expected to protect the reactor wall from high flame temperatures. Moreover, therecirculation cell will increase the particle residence time in this main reaction zone. As indicated in Fig. (1), theaverage temperature in the recirculation cell (Trecirc.cell) is below the ash fusion temperature. However, in this jettingfluidized-bed zone particle agglomeration is expected to take place as the temperature is above Tsinter. Note that besidesan adequate temperature, a certain degree of carbon conversion or a certain minimum for the bed ash concentrationmust be reached, before agglomeration can occur [11, 17, 21, 22]. The hot central jet induces considerable thermal

50 The Open Fuels & Energy Science Journal, 2017, Volume 10 Schurz et al.
buoyancy. The particles from the bubbling fluidized bed below are sucked into the jetting fluidized bed zone abovecontinuously by means of pressure differences resulting from different velocities, which ensures constant presence offuel in the oxygen rich zone, especially in interaction with control of the expansion height of the lower fluidized bed.
Fig. (1). Scheme of an INCI-gasifier [23] - graphic modified.
At the upper end of the main reaction zone, at the changeover to the post-gasification area, fine particles tend toform strands and clusters rather than traveling upwards isolated from each other. This increases the probability forfurther agglomeration of circulating and entrained fines. Moreover, the entrainment velocity of strands is increased,compared to the single particles, which reduces particle discharge at the top. No oxygen is present in this upper zoneand endothermic reactions lead to a decrease of temperature to the targeted outlet temperature of approx. 1,270 – 1,370K. In regard to reduce degradation and fouling at the surfaces of gas outlet ducts and subsequent heat exchangers,attention should be paid on keeping the outlet temperature below the obstruction temperature (Tobstruction), which isspecific to a certain ash [23]. Especially the melting behavior of the fuels mineral matter under reducing atmosphere andthe residual carbon content of the dust in the raw gas is having an influence on solids depositions in downstreamequipment [3] and on the temperature limit in the upper fast fluidized bed. Due to agglomeration of fines in the jettingzone and the fast fluidized zone, fly ash carry over is reduced. However, it is known from fluidized bed gasification,that a certain amount of carbon containing fly ash particles can serve as surface for condensing alkali and earth alkalimetals [24]. Thus, degradation and fouling of exit ducts and heat exchanger surfaces is markedly reduced. Hence, acertain amount of fly ash carry over is appreciated. If necessary, downstream particle separation (e.g. via candle filter)and subsequent recycle into the gasifier can be applied.
The agglomerates, generated in the hot zones, are too heavy for fluidization under the given flow conditions. Theyfall down and form a moving bed at the bottom of the reaction chamber. These agglomerates have a carbon content ofapprox. 5-20 wt.%. Secondary gasification agent is fed from below. It is a mixture of oxygen and steam or carbondioxide. For the avoidance of hot spots in the moving-bed, the upper limit of oxygen content should be in the range of10-15 vol.%. Thus, temperatures are kept below the ash sintering temperature to avoid clinkering and to ensure a stableflow through the bed. The flow rate of secondary gasification agent is set to meet the required fluidization velocity forthe bubbling fluidized bed zone directly above the moving bed. Post-gasified agglomerates have carbon contents below5 wt.%. They are discharged at the bottom by means of a rotary grate as applied for conventional moving-bed dry-bottom gasifiers [3].

Comparison of Two Coal-Gasifier-Designs The Open Fuels & Energy Science Journal, 2017, Volume 10 51
Preliminary work, investigating the targeted conditions in the central hot reaction zone (flame zone) and the regionabove, which is dominated by endothermic reactions, is presented in [7]. Here an inverse diffusion flame was developedand configured to represent the condition in the INCI gasifier. Experimental investigations and numerical simulationsare in accordance and show the expected overall behavior of the oxidizing hot reaction zone and endothermic reactionzone above. Additional preliminary work is designated to numerical simulation of the flow pattern inside the reactionchamber [25]. It is shown how an Euler-Euler based approach is able to predict the fluidization behaviour and particledistribution for ambient, non-reacting conditions. Both preliminary works indicate that the targeted operational principleis feasible.
2. EQUIPMENT
2.1. Laboratory-Scale INCI Coal Gasifier COORVED
The implementation of the INCI gasification principle was carried out by two different lab-scale gasifier designs.Within the framework of the COORVED project the gasifier unit was successfully started-up at TU BergakademieFreiberg, in 2014 [6].
There are several modifications of the COORVED gasifier compared to the large-scale INCI unit, as indicated in[4].
The reactor, shown in Fig. (2), is a vertical tube reactor of about 5.5 m in height.
Fig. (2). Segmented construction of the COORVED reactor [4]- graphic modified.
At the bottom of the reaction chamber, a cone valve sluice is applied to discharge the moving bed. Fly ash particlesare separated and collected in the raw gas filter, operating up to 823 K.
Primary gasification agent is fed through a lance in the third segment (see Fig. 2). Depending on temperature,volume flow and nozzle diameter (3-4 mm) a nozzle gas exit velocities of 30-100 m/s can be set. The superficial gasvelocity, resulting from feeding of secondary gasification agent below, is crucial. It can be influenced by the mass flowand electrical pre-heating. Both gasification agents can be pre-heated up to 523 K to avoid cold zones and steamcondensation.

52 The Open Fuels & Energy Science Journal, 2017, Volume 10 Schurz et al.
Several reactor segments are equipped with temperature and pressure measurement tools to gain information aboutnecessary process data and to prevent critical conditions.
After the raw gas leaves the reactor at the top, gas analysis is done by a gas phase chromatograph (GC) 3000 MicroGC (Inficon) and a Fourier-Transform-Infrared-Spectrometer (FTIR) CX-4000 FT-IR (Ansyco).
A radiometric level detection is installed at the two lower reactor segments. It is divided into two separatemeasurements, a vertical rod radiator (based on cesium-137) and sensor above the secondary gas inlet and a radiometricspot measurement at the upper end of segment 2 (Fig. 3).
Fig. (3). Schematic arrangement of the radiometric measuring equipment.
The measurement system enables for estimation of the accumulated solids in the moving-bed and the bubbling-fluidized-bed zones of the reactor.
2.2. Reaction Chamber Design
In the present paper two steps of the prototype development of the lab-scale gasifier COORVED are compared witheach other. Both are designed for 50-125 kW thermal input. The first version (V1), which was already described [4 - 6],and the second design, the reaction chamber (V2), are opposed to each other in Fig. (4).
Fig. (4). Central part of COORVED reaction chamber in a) design V1 and b) the modified configuration V2.
The whole V1-reaction chamber from the bottom, where the ash agglomerate sluice is situated, to the raw gas ducton the top is of constant inner diameter. Hence, all segments, except the reactors top, are composed of a double layer
Comparison of Two Coal-Gasifier-Designs The Open Fuels & Energy Science Journal, 2017, Volume 10 53
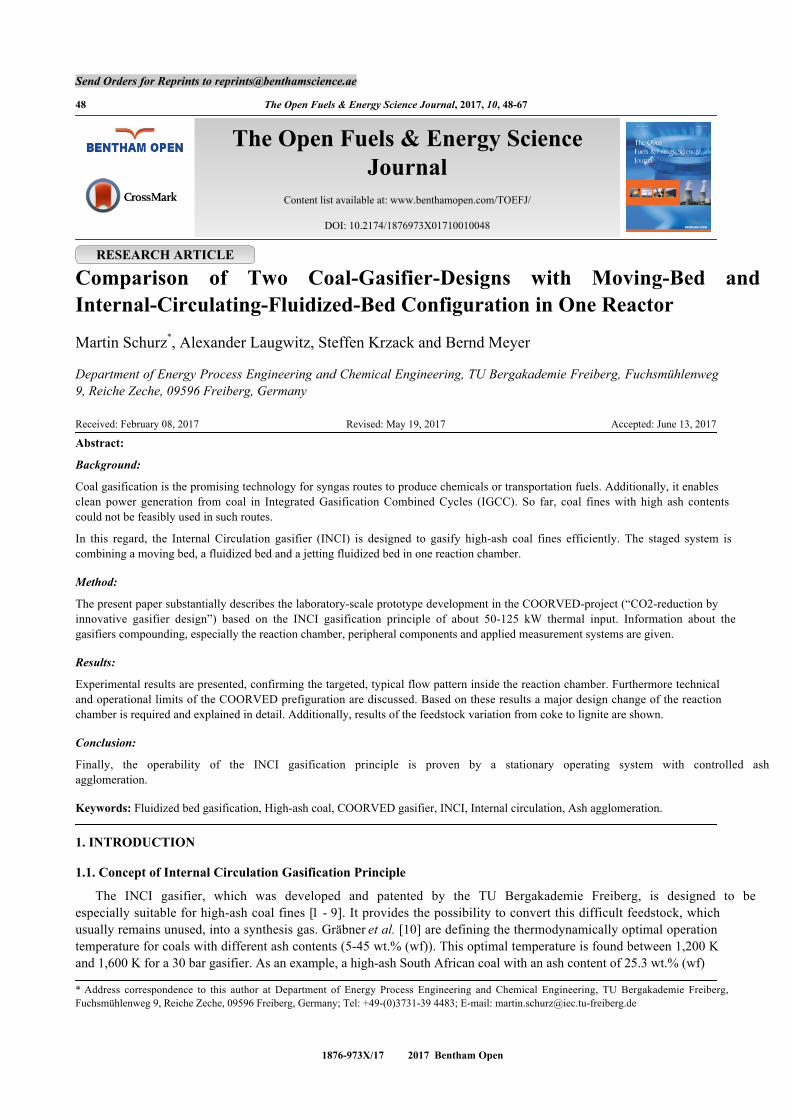
insulation of aluminosilicate mats, a vacuum molded padding, each with embedded 12 kW electrical heaters made ofchrome-iron-aluminum-alloy, and a ceramic reaction tube with an inner diameter of 150 mm (Fig. 5).
Fig. (5). Simplified scheme of a single reactor segment in V1 without measurement ports – as partially described in [4]- modifiedside view.
The top reactor segment differs from the segments below. It is not equipped with electrical heaters and the vacuummolded padding is replaced by several layers of aluminosilicate mats.
In the central part (segment 3 to 4) (see Fig. 4) the recirculation cell emerges and the main part of the carbonconversion is expected to take place. Thus, the third, fourth and fifth segments are each equipped with three opticalports in addition to temperature and pressure sensors. The optical ports of the reactor are prepared for particle-image-velocimetry-measurement, to visualize the flow conditions in the recirculation cell, and for optical temperaturemeasurement, which is not installed yet in gasification operation due to transmissivity issues of the inner glasses.
Modifications of the reactor design V2 were done especially in the reaction chambers inner diameter (see Fig. 4 –b). The inner diameter of segment 1 and 2 is reduced from 150 mm to 100 mm, which reduces the minimum requiredsecondary gas volume flow to prevent settling of unreacted feedstock particles. The inner diameter of the main reactionzone (segments 3 and 4) is widened from 150 mm to 300 mm. The connection between the reduced and the enlargedradius is done by a 60° conical widening. By increasing the cross section the superficial gas velocity in the mainreaction zone in essentially decreased. Therefore, the higher distance between the reactors inner wall and the centralflame zone and the raised ratio between superficial gas velocity in the main reaction zone and primary gas nozzle outletvelocity result in improved conditions for the formation of the recirculation cell. Moreover, the risk of ash or slagdeposits on the reactors wall is expected to be lower. Furthermore, the connector between segments 4 and 5, from aninner diameter of 300 mm to 150 mm, is also realized as a cone of 60°.
In start-up-operation, the refractory lined central part of the reactor is heated up by a natural gas burner until thewall in segment 3 reaches a temperature of 1023 K. During gasification operation, segments 5 and 6 are incipientlyelectrical heated as heat losses are high due to the slim design.
3. EXPERIMENTAL
3.1. Feedstock Characterization
Two different feedstocks were utilized in the COORVED reactor for the present paper, a powdery hearth furnacecoke made of Rhenish lignite, hereinafter simply called coke, and dried Lusatian lignite, henceforth referred as lignite.The feedstocks were specified by the framework of the COORVED project. The coke was applied both in reactordesign V1 and V2, whereas the lignite was only fed in V2 as a mixture with the coke.
The powdery hearth furnace coke is produced at a pyrolysis temperature of 1,173 – 1,223 K and has an inner surfacearea of about 300 m2/g (BET; according to DIN 66131 and 66132 with nitrogen at 77 K). The coke is not further pre-treated. The utilization of coke, especially as the feedstock of choice for pre-heating, is reducing the risk of tar and oildeposition. Furthermore the high fusion temperature of the cokes mineral components avoids slagging operation inheat-up-phase even at high oxygen supply. Another key advantage is the high carbon content of the coke, leading tocarbon-containing residues in the moving bed zone, which are especially favorable in the pre-heat-procedure of the

54 The Open Fuels & Energy Science Journal, 2017, Volume 10 Schurz et al.
lower reactor section.
By reasons of its moisture content (11.4 wt.% in delivery condition) the feeding properties of the fine lignite wereunfavourable. The material needs to be dried to at least 7.0-8.0 wt.% moisture content to ensure continuous input. Dueto its high volatile matter and the in-situ production of highly reactive coke, the utilization of coal is advantageous foragglomeration-promoting conditions in the main reaction zone. The fast reaction of the volatiles and the coke withoxygen results in raised local temperatures. The increased temperature in the central flame zone is beneficial forpartially melting of the fuel ash, which is necessary for the formation of agglomerates.
Both powdery feedstocks have a comparably particle size distribution (Table 1).
Table 1. Particle size distribution, heating value, bulk density, surface area for coke and lignite.
Fuel Volume based particle distribution – Q3 Heating valuein kJ/kg (wf)
Bulk densityin kg/m3
10% 50% 90%in µm
Coke 13.8 79.3 239.9 29.8 525Lignite 13.1 67.9 232.1 25.4 461
German DIN Standard 66165-2 51900 51705wf: water free
According to the DIN Standard, the sample moisture (DIN 51718), proximate analysis (DIN 51718, 51719 and51720) and ultimate analysis (DIN 51732) of both feedstocks are given in Table 2.
Table 2. Proximate and ultimate analyses of coke and lignite.
Fuel Proximate analysis Ultimate analysisMoisture Ash Volatiles CFix* C H N Sc O*
wt.% wt.%(wf)
wt.%(wf)
wt.%(wf)
wt.%(waf)
wt.%(waf)
wt.%(waf)
wt.%(waf)
wt.%(waf)
Coke 0.96 10.01 4.77 85.22 98.49 0.26 0.27 0.44 0.54Lignite 11.40 5.69 52.06 42.25 69.18 4.91 0.71 0.49 24.71
wf: water free; waf: water and ash free; *: calculated by difference; c: combustible
Table 3 shows the results of the XRF ash analyses according to DIN 51729-10.
Table 3. XRF analyses of coke ash and lignite ash.
Fuel Oxide content in wt.%Na2O MgO Al2O3 SiO2 K2O CaO TiO2 Fe2O3 BaO SO3 Balance
Cokea 3.43 17.74 4.12 0.57 1.61 31.34 0.23 12.52 0.35 16.84 11.25
Lignitea d.l. 9.90 4.30 9.38 0.19 25.17 0.22 26.82 0.12 22.00 1.90wf: water free; d.l.: below detection limit; a: ash 450 °C
The XRF-analyses are showing differences in the content of components influencing the ash fusion behavior.Especially the iron content, which absolute amount is almost doubled in case of lignite, is identified to play animportant role in ash agglomeration [11, 22].
Table 4 summarizes the ash fusion behaviour of the mineral matter according to DIN 51730 and the additionalInitial shrinking temperature, defined by Schimpke et al. [26].
Table 4. Ash fusion behavior of coke and lignite.
FuelAtmospheric
conditions
Observed characteristicInitial shrinking
temperatureInitial deformation
temperatureSoftening
temperatureHemisphericaltemperature Fusion temperature
in K
Cokea Oxidizing 1,263 1,613 1,632 1,668 > 1,883Reducing 1103 1,544 1,584 1,650 1,764
Lignitea Oxidizing 1303 1,541 1,633 1,656 1,763Reducing 1103 1,573 1,593 1,696 1,751

Comparison of Two Coal-Gasifier-Designs The Open Fuels & Energy Science Journal, 2017, Volume 10 55
Depending on the process conditions, reducing or oxidizing atmospheres are crucial. Lignite and coke show reducedtemperatures of the characteristic fusion behaviour under reducing atmosphere compared to oxidizing atmosphericconditions. The probably most important discrepancy between coke and lignite is the comparatively low fusiontemperature for lignite ash in oxidizing atmosphere in contrast to the significantly higher values of the cokes mineralmatter.
3.2. Experimental Design
The first course of operation in reactor design V1 focuses on the formation of the flow profile, mainly the movingbed zone and the recirculation cell as well, e.g. to determine the minimum secondary gas velocity, required to transporta minimum amount of solids up to the primary gas nozzle. This is necessary to feed carbon into the oxygen containingflame zone. Furthermore, a sufficient accumulation of solids in the moving bed needs to be confirmed.
The primary oxygen flow and the influence of thermal buoyancy, caused by the flame, on the formation of thecirculation cell and the moving bed are examined in the second experimental series.
The last set of experiments in V1 covers the implementation of the lessons learned to increase the carbon conversionand to increase the probability of particle or ash agglomeration. Therefore, a minimum temperature is required toachieve a certain carbon conversion. On the other hand, the reactor temperature near the wall must not exceed the ashfusion temperature to avoid slagging operation.
The conditions of the targeted runs are summarized in Table 5.
Table 5. Process parameter variation of first experimental campaign in V1.
Exp. goals Varied process parameters
Minimum secondary volume flowFeedstock CokeSecondary gas composition N2, CO2/H2OSecondary gas flow in m3/h(STP) 11.94- 22.12
Formation of recirculation cell;Temperature distribution
Feedstock CokePrimary gas composition N2, CO2 /H2O, O2
Primary gas flow in m3/h(STP) 4.5-5.4Secondary gas composition N2, CO2 /H2O, O2
Secondary gas flow in m3/h(STP) 13.60-14.23Stoichiometric air ratio 0.24-0.33Total steam/O2-ratio or CO2/O2-ratio in kg/m3(STP) 1.13-3.76
High carbon conversion
Feedstock CokePrimary gas composition N2, CO2 /H2O, O2
Primary gas flow in m3/h(STP) 5.4-7.0Stoichiometric air ratio 0.33-0.42Total steam/O2-ratio or CO2/O2-ratio in kg/m3(STP) 1.53-2.56
The next campaign, having almost the same experimental goals like explained before, was carried out in reactordesign V2. Due to the design changes, the development of different flow patterns inside the reaction chamber is in focusof the experimental work again (Table 6). Particularly, the formation of the moving bed, changes in the requiredsecondary gas flow, the proof of the recirculation cell and the formation of the flow pattern in the new conical part ofthe main reaction zone, need to be investigated. The next step is the comparison of the two gasifier designs regardingachievable carbon conversion and ash agglomeration. Finally, a change in the feedstock has been necessary to verify theINCI gasification principle.
Table 6. Process parameter variation of second experimental campaign in V2.
Experimental goals Varied process parameters
Minimum secondary volume flow; Formation of recirculation cell;Formation of spouted bed
Feedstock CokePrimary gas composition N2, CO2, O2
Primary gas flow in m3/h(STP) 6.0-11.0Secondary gas composition N2, CO2, O2
Secondary gas flow in m3/h(STP) 6.00-9.00Stoichiometric air ratio 0.27-0.39Total steam/O2-ratio or CO2/O2-ratio in kg/m3(STP) 2.64-3.30

56 The Open Fuels & Energy Science Journal, 2017, Volume 10 Schurz et al.
Experimental goals Varied process parameters
High carbon conversion;Low wall temperatures
Feedstock CokePrimary gas composition N2, CO2 /H2O, O2
Primary gas flow in m3/h(STP) 6.75-7.00Secondary gas composition N2, CO2/H2O, O2
Secondary gas flow in m3/h(STP) 6.75-7.50Stoichiometric air ratio 0.39-0.46Total steam/O2-ratio or CO2/O2-ratio in kg/m3(STP) 2.88-3.14
Ash agglomeration
Feedstock Mixture coke/lignitePrimary gas composition N2, CO2 /H2O, O2
Primary gas flow in m3/h(STP) 9.00Secondary gas composition N2, CO2/H2O, O2
Secondary gas flow in m3/h(STP) 6.75Stoichiometric air ratio 0.42Total steam/O2-ratio or CO2/O2-ratio in kg/m3(STP) 2.49
3.3. Evaluation of Experimental Data
The gasification operation in COORVED reactor requires online monitoring. The most important parameters, likethe carbon conversion XC, the cold gas efficiency ηCGE and the syngas yield ySyn, can be determined based on the raw gas(RG) composition and volume flow.
(1)
(2)
(3)
with:
y(n)RG;wf … Volume fraction of the gas component n in the dry raw gas,
RG;wf … Volume flow of the dry raw gas,
CO2;PGA /SGA … Volume flow of carbon dioxide in primary or secondary gasification agent,
x(C)fuel … Carbon mass fraction of the fuel,
… Mass flow of the fuel,
LHVRG /fuel … Lower heating value of raw gas or fuel.
4. RESULTS AND DISCUSSION
4.1. Particle Separation and Formation of Flow Pattern Below the Primary Gas Nozzle
The particle distribution in segment 2 and 3 is influenced by several parameters, e.g. gas velocity, viscosity, densityand particle properties. A minimum gas velocity in the lower bubbling-fluidized bed is required to expand the bed up tothe inlet of primary gasification agent. Because the feedstock has a certain size distribution, some particles will betransported up to the level of primary gasification agent injection, whilst others remain in the lower bubbling-bed zoneor in the moving bed respectively. The calculated particle entrainment velocity, corresponding to Kunii et al. [27], issufficient consistent with the experimental data of the maximum entrained particle size (see Table 7).
For high secondary gas flow rates the fine coke is carried out of the main reaction zone after inappropriate shortresidence time. This leads to an undesired decrease in carbon conversion in the gasification process. Anotherdisadvantage of a high superficial gas velocity in the lower segments is the hindered formation of the recirculation cell
(Table 6) contd.....
� � � � � � � �� �� �
2 2; 2 4 ; ; ;; 100 %C molar RG wf CO PGA CO SGARG wf
Cfuel molarfuel
M y CO y CO y CH y COS V V VX
x C m V
� � � � � �� � �
� �
�CO SGAV V VCV VV
G f CO GA
fuel molarm Vfuel mm
; 100 %RG wfRGCGE
fuel fuel
VLHVLHV m
� � � �RG fVR 100fuelm
� � � � ;2 ;
RG wfsyn RG wf
fuel
Vy y CO y H
m� � � ��
RG fVRfuelm
V
V
fuelm

Comparison of Two Coal-Gasifier-Designs The Open Fuels & Energy Science Journal, 2017, Volume 10 57
due to a lower shear rate between primary gas nozzle outlet velocity and the gas coming from beneath the primary gasnozzle. The risk of a blockage of the feedstock inlet by a fast increasing moving bed level is obviated even at the lowersecondary gas flow rate of 14.23 m3/h(STP). The main function of the secondary gas, to carry the feedstock to the mainreaction zone, needs to be preserved for safety reasons. Hence, a secondary gas flow lower than 14.23 m3/h(STP) at thegiven temperature is not recommended.
Table 7. Particle entrainment calculation and experimental results (823 K, coke).
Sec. gasflow rate
in m3/h(STP)
Superficial gas velocity inSegment 2
in m/s
Entrained max. particle size - calc.acc. to Kunii et al. [27]
in µm
Max. entrained particle size -experimental results
in µm
Entrained fraction offeedstock
in %22.12 1.05 300 250 > 9914.23 0.67 220 200 > 90
Further experiments show the influence of high oxygen contents in the primary gas. If the primary oxygen flowexceeds 2.5 m3/h(STP) the increasing flame temperature leads to improved thermal buoyancy. Consequently, the gasflow velocity beneath the primary gas nozzle increases and larger particles can be fluidized and carried from the lowerbubbling fluidized bed up to the level of primary gasification agent injection. Moreover, less particles drop down ontothe moving bed. The evidence of that facts have been provided by the radiometric rod and spot measurement, showingno further increase in moving bed level and bubbling fluidized bed density above 2.5 m3/h(STP) oxygen and evenslightly decreasing values for higher oxygen flow rates (Fig. 6). The radiometric measurement delivers an integral valueof the moving-bed height and/or the bubbling-fluidized-bed density, in which 100% equates a fixed bed over the wholemeasured area.
Fig. (6). Influence of oxygen content in primary gas on relative change of bed density and bed level in reactor design V1.
Based on the findings of the oxygen addition further experiments can be conducted with lower secondary gas flowsif the primary oxygen flow exceeds 2.5 m3/h(STP). The gas flow rate of 13.60 m3/h(STP), leading in a superficial gasvelocity of 0.64 m/s in segment 2, has been identified to be the lower limit of the secondary gas flow rate forgasification operation. As mentioned before, in the gasification process a sufficient low superficial gas velocity isbeneficial.
In reaction chamber design V2 the secondary gas volume flow can be reduced to the range of 6.00-9.00 m3/h(STP)through the changes in the lower reactor section. Consequently, the resulting superficial gas velocity amounts to0.88-1.16 m/s in the upper segment 2 or lower segment 3 respectively. Reasons for the raise in superficial gas velocity,compared to V1, are depending on the evolving flow pattern in the lower main reaction zone, the conical part, of V2.The ratio of 1:3 between the reaction tube diameter in the lower part (segment 1 and 2) and the main reaction zonediameter (segment 3 and 4), the angle of the conical widening and the set gas velocities combined with the powderyfeedstock are causing the formation of a spouted bed, as described by Duarte et al. [28]. The bed consists of an annularmoving-bed and a fast fluidized central flow with recurrent particle throw-offs. The necessary fast base fluidizationrequires higher superficial gas velocities below the conical widening. The formed spouted bed has advantages for the
0
1
2
3
4
5
0
20
40
60
80
100
0:00:00 2:30:00 5:00:00
Pri
mary
ox
yg
en f
low
in m
³/h
(S
TP
)
Mo
vin
g-b
ed l
evel
an
d b
ub
bli
ng
flu
idiz
ed b
ed d
ensi
ty i
n %
Operating hours in hh:mm:ss
Normalized moving-bed/bubbling-fluidized bed level
(radiometric rod measurement)
Bubbling fluidized-bed density (radiometric spot
measurement)
Primary oxygen flow

58 The Open Fuels & Energy Science Journal, 2017, Volume 10 Schurz et al.
gasification process, first of all for the accumulation of carbon-containing solids in the lower main reaction zone. Theparticle buildup and the evolving spouts into the flame zone are beneficial for the conversion process and ashagglomeration.
4.2. Comparison of the Local Fluid-Bed Status in Designs V1 and V2
To exemplify the general flow pattern in gasification for both reactor designs the REH-diagram [29] is used (Fig. 7).It shows the operation in V1 and V2 result in similar flow conditions, both corresponding to INCI-gasificationprinciple.
Fig. (7). REH-diagram of flow pattern in exemplary gasification operation for V1 and V2.
The required settings for the illustration in REH-diagram are given in Table 8, where Drct. Specifies the innerreaction tube diameter and T is the average temperature in the respective reactor zone. Both values are influencing thespecific superficial gas velocity vgas which is crucial for the evaluation of the fluid status for particles of a defined Sauterdiameter dp,S.
Table 8. Operating conditions of gasification in V1 and V2 for REH-Diagram.
Reactor design Reactor zone Area inREH-diagram
Drct.
in mmT
in Kvgas
in m/sdp,S.
in mm
V1
Fixed bed I 150 790 0.64 5.0Bubbling fluidized bed II 150 849 0.69 1.0Jetting Fluidized Bed - 150 1579 2.0 0.079
Upper post-gasification zone III 150 1189 1.52 0.079
V2
Fixed bed I 100 861 0.75 5.0Bubbling fluidized bed II 100 773 0.68 1.0Jetting Fluidized Bed - 300 1428 0.3 0.068
Upper post-gasification zone III 150 1215 1.05 0.068
Area I in REH-diagram, below the minimum fluidization line, is showing the fixed bed or moving bed conditions.At the given flow conditions the ash agglomerate of the average size of 5.0 mm stays in fixed bed. Particles with a
I
II
III
IV
V1
V2

Comparison of Two Coal-Gasifier-Designs The Open Fuels & Energy Science Journal, 2017, Volume 10 59
diameter below 2.0 mm (V1), or 2.1 mm (V2) respectively, are fluidized and can be found in the bubbling fluidized bedzone above (area II in REH-diagram between the minimum fluidization line and the entrainment line), which isconsistent with the experimental findings, showing pre-agglomerates < 2.0 mm and oversize grain of the feedstock inthat zone. Particles of the diameter less than 0.24 mm (V1) or 0.22 mm (V2) are entrained into the main reaction zone,which can be reflected in the experimental findings, too, showing the fluidization of the bigger part of the feedstock(according to Table 7).
The following main reaction zone, the jetting fluidized bed zone, can’t possibly be illustrated in the REH-diagramdue to its complex flow pattern, especially the recirculation cell, and the high gradients in temperature and gascomposition.
The post gasification zone above (upper fast-fluidized bed) shows significant flow differences in comparison of bothreactor designs. The superficial gas velocity in V1 results in single particle entrainment below 0.42 mm in diameter andfor particles less than 0.33 mm in V2. In both designs particles of the average diameter cannot be entrained when theyare forming particle strands, but V1 is operating closer to area IV in REH-diagram, and thereby closer to particle strandentrainment. In design V1 particles below 0.04 mm in diameter are entrained even in strands, while V2 showsentrainment only for particle strands with a grain size < 0.02 mm. Reasons for the differences in flow pattern of V1 andV2 in area III of the REH-diagram are based on the overall lower gasification agent supply in V2, resulting in asignificant lower superficial gas velocity in the upper post gasification zone (see Table 8). Additionally, it needs to beconsidered, that because of the widened diameter of the reaction tube in V2 the superficial gas velocity in the mainreaction zone is much lower than inside the entry to the tightened post gasification zone, whereby just smaller particlescan enter the upper reactor part. Experimental results confirm that conclusion, since filter dust contains about 90% ofparticles below 0.1 mm. In geometry V1 this beneficial step in superficial gas velocity is missing and thus the majorpart of the residual solids reaching the upper main reaction zone is entrained. However, the overall amount of filter dustexiting the reactor by raw gas is reduced in V2 by ash agglomeration and by the shown advantageous flow pattern in thecentral and upper reaction tube.
4.3. Formation of the Circulation Cell
Due to the very low inner diameter of the lab-scale gasifier, the formation of a sufficient large recirculation cellneeds to be confirmed, especially for the slim design V1. Therefore, Schimpke et al. [4] investigated the flow patternsabove the primary gasification agent nozzle in a cold gas test facility of COORVED reactor geometry V1. Theexperimental results show good accordance with CFD-simulations of Laugwitz et al. [5]. Besides the investigation ofthe flow pattern in a cold system or CFD simulations a hot reactive system needs to be demonstrated.
In consequence of the difficulties in the transparency of the optical ports in gasification operation the determinationof the formation of the recirculation cell is done by temperature measurement in the central zone. Therefore, thedependency on the settings of the primary gas composition, especially its volume fraction of oxygen, needs to beexamined. The oxygen content is increased stepwise by replacing the same amount of nitrogen in the primary gas (seeFig. 8). Thus, the total primary gas volume flow and consequently the gas velocity exiting the nozzle can be keptconstant up to 3.25 m3/h(STP) of oxygen in the primary gas for design V1. The primary gas mixture includes at least 0.5m3/h(STP) of carbon dioxide. via the displayed temperature distribution the exact dimension of the recirculation cell isnot allocable, but recycled hot gas of the flame zone is detectable. Thus, the temperatures can indicate the formation ofa recirculation cell around the flame zone. But the evidence of the recirculation in the hot reactive system needs to beproduce by optical measurements later on, as it was done by Schimpke et al. [4] in the cold test facility before.
Fig. (8). Formation of the recirculation cell around the flame zone in reactor design V1 and V2 in coke gasification depending on theprimary gas oxygen flow and concentration.
O2
: 27
vo
l.%O
2: 5
3 v
ol.%
O2
: 80
vo
l.%O
2: 8
9 v
ol.%
0
250
500
750
1000
1250
1500
S2 wall S3 wall S4 wall S5 wall
Tem
pe
ratu
re in
K
Thermo couple position
V1
1.00 m³(STP)/h 2.00 m³(STP)/h3.00 m³(STP)/h 4.00 m³(STP)/h
Primary O2
O2: 4
4 v
ol.%
O
2: 6
4 v
ol.%
O2: 8
4 v
ol.%
0
250
500
750
1000
1250
1500
S3 wall S3 center S4 wall S5 wall
Tem
pe
ratu
re in
K
Thermo couple position
V2
2.75 m³(STP)/h 4.00 m³(STP)/h
5.25 m³(STP)/hPrimary O2

60 The Open Fuels & Energy Science Journal, 2017, Volume 10 Schurz et al.
Even though, the primary gasification agent is actually injected into segment 3, Fig. 8 - V1 shows that the reactiontube temperature in segment 4 is as sensitive to the oxygen content in the primary gas as in segment 3 up to an oxygenflow of 2.0 m3/h(STP), which equates to about 53 vol.% oxygen in the primary gas. This effect occurs similarly forexperiments using steam or carbon dioxide, respectively. It arises from the positioning of the thermocouples in thereaction tube close to the wall (see Fig. 9). Generally, an increase in oxygen addition results in a higher central flametemperature and thus intensifies the recirculation. For oxygen flows less than 2.0 m3/h(STP), the recirculation cell iscomparably small and is not extended to the reactors inner wall. Thus, the region close to the reactors wall is not heatedup by hot, recycled reaction gases but moderated by the cooler secondary gas coming from beneath (see Fig. 9-a).
Fig. (9). Scheme of recirculation influence on temperature in segment 3 and 4 in reactor design V1 for a) low oxygen, b) highoxygen supply and c) in design V2 for high oxygen supply.
As a consequence, thermocouple TC S3 does not react to increased central temperatures as much as thermocoupleTC S4. In the investigated range, the maximum height of the recirculation cell is sufficiently below the position ofthermocouple TC S4. Thus, the temperature measurement in segment 4 is not effected by the intensification andenlargement of the recirculation cell from a fluid mechanical point of view. Only the increase in mean operationtemperature due to an increase in oxygen supply is measured by thermocouple TC S4. At primary oxygen flows above2.0 m3/h(STP), starting at 55 vol.% of oxygen, the temperature rise in segment 3 is much larger than before. It can beargued, that the recirculation cell is extended over the whole tube diameter (Fig. 9-b). Therefore, hot reaction gases aretransported to the wall, which results in a strong increase in temperature measured by thermocouple TC S3. In contrast,the temperature measurement above, e.g. thermocouple TC S4, shows an almost linear increase with oxygen supply forthe investigated flow range, even above 2.0 m3/h(STP). Thus, mean temperatures in segment 4, 5 and higher are notaffected by the size of the recirculation cell in the investigated range.
In Fig. (8) - V2 a minor effect of the primary oxygen flow on the reactors wall temperatures in reactor design V2can be observed. It should be noted, that the overall primary gas volume flow is about 67% higher for experiments inV2 than for V1. Up to a primary oxygen flow of 4.0 m3/h(STP) or about 64 vol.% oxygen, showing intense influence inreactor design V1, significantly implication cannot be seen in V2. Results are based on the simple fact, that thethermocouples distance to the flame zone is doubled in V2 (see Fig. 9 – c). With increasing oxygen flows within theconsidered range there is still no substantial rise in temperature at the walls in segment 3 and 4. For this reason anadditional temperature measurement (TC S3 center) needed to be installed. It is positioned 50 mm below the primarygas nozzle on the exact central axis of the reaction tube. Even though it is situated quite underneath the primary gasinlet an appreciable influence on the temperature by further increased oxygen addition is existent (starting from 4.75m3/h(STP) or about 76 vol.% oxygen). A simple effect of the flames radiation can be excluded due to the fact that thethermocouple is located right in the shade of the primary gas nozzle and additionally surrounded by gas with a highsolid load due to the spouted bed beneath. The further rise in temperature from the wall of segments 4 to segment 5,compared to segment 3, for all oxygen settings is based on the blending of the comparatively cold flow at the reactorswall and the hot central flow resulting from the flame in the conical constriction below thermocouple S5 wall.

Comparison of Two Coal-Gasifier-Designs The Open Fuels & Energy Science Journal, 2017, Volume 10 61
Additionally the thermocouples TC 4 and TC 5 are positioned closer to the reactors central axis than TC 3 due to thereaction tubes lower inner diameter in both upper segments. In V2 the higher temperature of the wall in segment 5compared to V1 at the highest settings of oxygen is the result of an increased total air ratio for the experiment in V2.
An advantageous finding is the overall lower wall temperature near the flame zone in design V2, without theformation of a hot spot at the wall close to the position of the primary oxygen inlet. Thus, the reactor design V2 allowsfor experiments with higher total stoichiometric air ratios compared to design V1.
4.4. Coke Gasification Experiments
With the results of the preliminary investigations and the gained process understanding, the first gasification runswith the experimental aim of high carbon conversion can be realized in design V1. Constant settings have been defined,such as a secondary gas volume flow of 13.60 m3/h(STP), pre-heated to 493 K, and the pre-heating of reactor segment 2to 823 K, to ensure the major part of the solids mass flow of 10 kg/h enters the main reaction zone. Within the firstgasification runs the minimum amount of 0.5 m3/h(STP) oxygen in the secondary gas, combined with a certainminimum of oxygen in the primary gas, is identified to allow for totally autothermal operation. Not only the oxidizationis providing the necessary heat in the lower two reactor segments, but also the heat transfer from the main reaction zonevia the bubbling fluidized bed.
To gain a sufficient high carbon conversion in the overall gasification process, the primary gas composition andtotal amount need to be varied and optimized. Most important influence seems to have the oxygen flow rate, which isdirectly connected to the average temperature in the main reaction zone. Limiting facts in reaction chamber design V1are the wall temperature in segment 3, which used to be the highest measured temperature and characterizes the risk ofslagging operation, next to the primary gas velocity at the nozzles exit. A highly accelerated gas jet is advantageous forthe formation of the recirculation cell, but due to growing disruptive forces with increasing gas velocity it is unfavorablefor the formation of ash agglomerates. Based on the coke ash softening temperatures (according to Table 4) themaximum permitted wall temperature has been set to 1,573 K. Consequently, the maximum amount for the primary gasoxygen flow, until the wall temperature limit is reached, can be defined as 4.9 m3/h(STP) (λ=0.32 incl. secondaryoxygen of 0.5 m3/h(STP)) for the gasification of 10 kg/h coke in the reactor design V1 (Table 9 –A-1). This adjustmentgoes along with a carbon conversion of only 63.5%, which is, due to the resulting insufficient ash concentration in themain reaction zone, not enough to gain ash agglomerates. Moreover, there is still some slightly ash caking visible at thevery hot parts of the ceramic reaction tube. Probably, the thermocouple position in segment 3 does not exactly hit thepoint of highest temperature. The risk of slagging is preventing from further oxygen addition in the primary gas. Thus,to get better experimental results it is necessary to reduce the wall temperature significantly, while the carbonconversion is increased. Additional settings are changed, such as lowering the pre-heating temperature of the secondarygas flow by 48 K and replacement of the inert gas content in secondary gas by additional temperature moderating gascomponents (Table 9 – A-2).
Table 9. Coke-gasification (10 kg/h in V1): Operational settings, results and temperatures in segments 3–5.
Exp.
Settings Results
Wall Temperaturein K
Primary gas flow inm3/h(STP);
Preheat-temp. in K
Secondary gas flow inm3/h(STP);
Preheat-temp. in K
Total air ratio λ;CO2/O2 or H2O/O2-ratio in
kg/m3(STP)
Carbon conversion XC in%;
Cold gas efficiency ηCGE
in %;Syngas yield ySG in
m3/kg(STP)
A-1O2: 4.9
H2O: 0.5Temp.: 500
O2: 0.5H2O: 7.1N2: 6.0
Temp.: 493
λ: 0.32Mod./O2: 1.18
XC 63.5ηCGE 40.5ySG 1.05
S3: 1,570S4: 1,308S5: 1,180
A-2O2: 5.5
H2O: 0.6Temp.: 496
O2: 1.0H2O: 7.1CO2: 6.0
Temp.: 445
λ: 0.39Mod./O2: 2.76
XC 84.8ηCGE 52.7ySG 1.34
S3: 1,383S4: 1,298S5: 1,196
The further temperature moderating gas addition (moderator) into the secondary gas in experiment A-2 needs to bedone with carbon dioxide, due to technical limitations of steam supply. The mentioned changes result in a temperaturedrop in segment 3 of about 187 K. Approximately one quarter of the temperature decrease can be attributed to the

62 The Open Fuels & Energy Science Journal, 2017, Volume 10 Schurz et al.
reduced pre-heating. The lowered heat input in segment 3 allows for raise in the oxygen flow without exceeding thedefined temperature maximum of 1,573 K. Thus, in the second step the overall oxygen flow was elevated by 1.1m3/h(STP) to 6.5 m3/h(STP) (λ=0.39). A carbon conversion of 84.8% was achieved. Nonetheless, agglomeration wasnot observed. The low cold gas efficiency is the result of high heat losses of about 20-25% of the total thermal input,caused by the laboratory-scale unit.
The raw gas composition of both experiments (Table 10) is showing a comparatively high carbon dioxide content inexp. A-2, which is caused by the additional added moderator.
Table 10. Product gas composition (water and purge gas free) of exp. A-1 and A-2 (coke- gasification in V1).
Exp. Gas component CO CO2 H2 CH4Hydrocarbons
C2-C4H2S
A-1 Volume fractionin % (wf, pgf)
44.6 27.5 27.8 < 0.1 d.l. d.l.A-2 41.6 41.3 17.0 < 0.1 d.l. d.l.
wf: water free pgf: purge gas free (Nitrogen free) d.l.: below detection limit
In summary, the carbon conversion using reactor design V1 is obviously not high enough to allow foragglomeration of the processes solid residues. One reason is the remaining high average carbon content in the fluidizedbed of about 60 wt.%, based on an assumed inert ash content at a carbon conversion of about 85%. As can be seen fromother fluidized bed reactors, an agglomeration (and defluidization) not occurs until the carbon content reaches asufficient low value. The required minimum bed ash content is 65 wt.% [22] up to 70 wt.% [11], dependent on coalrank.
Due to the fact, that a higher operation temperature is not feasible, the particle residence time in the hot mainreaction zone needs to be increased to gain higher bed ash contents. The particle entrainment cannot easily be changedby switching operating parameters, due to the reactors optimal flow conditions. This implies that the equipment’s innerdiameter needs to be changed, as it is realized in reaction chamber design V2.
With the modifications of V2 the maximum measured wall temperature is reduced by 150-300 K for gasificationexperiments with similar stoichiometric air ratios to that in V1 (see Fig. 10 – a). This conclusion is valid for the cokegasification in carbon dioxide-oxygen-atmospheres and steam-oxygen-atmospheres. Based on that result, a higher totalair ratio is attainable without exceeding limiting wall temperatures. Due to the increased primary oxygen addition intothe primary gas the achievable carbon conversion, even at comparatively low wall temperatures, is higher than in designV1 (Fig. 10 – b). Therefore, most of the assumed advantages of design V2 compared to V1 are demonstrated, already. Itshould be noted, that the results presented in Fig. (10) are merely valid for a qualitative comparison of point clouds, dueto the wide range of experimental settings (see Table 5 and Table 6).
Fig. (10). Comparison of reactor design V1 and V2: a) maximum measured wall temperature depending on the total air ratio, b)
1000
1100
1200
1300
1400
1500
1600
0.00 0.10 0.20 0.30 0.40 0.50
Max
imu
m w
all t
em
pe
ratu
re in
K
Total stoich. air ratio
O2/CO2 V1 O2/H2O V1
O2/CO2/H2O V1 O2/CO2 V2
O2/H2O V2 O2/CO2/H2O V2
a)
V2
V1
0
20
40
60
80
100
1000 1100 1200 1300 1400 1500 1600
Car
bo
n c
on
vers
ion
in %
Maximum wall temperatur in K
O2/CO2 V1 O2/H2O V1
O2/CO2/H2O V1 O2/CO2 V2
O2/H2O V2 O2/CO2/H2O V2
b)
V2
V1

Comparison of Two Coal-Gasifier-Designs The Open Fuels & Energy Science Journal, 2017, Volume 10 63
carbon conversion depending on the maximum measured wall temperature.
Variations of the solids mass flow are showing a tendency for the final gasification progress depending on thethermal input. The results of the mass flow variation indicate that the optimum for reactor design V2 is sufficient below10 kg/h for the coke gasification (Fig. 11).
Fig. (11). Dependence of the carbon conversion on the thermal input in reactor design V2.
Due to the expected decrease in carbon conversion, caused by the cool down of the upper post gasification zonebased on the higher specific heat losses at lower thermal capacity in autothermal operation, a lower limit of the solidsmass flow can be assumed, too.
The reactor design V2 shows technological advance, especially due to the higher accumulated amount of solids inthe main reactions zone. The inertia of the gasifier is increased compared to reaction chamber design V1. The maximumcarbon conversion, which is reached in coke gasification in the reactor design V2 (See Table 11) in a mixture of carbondioxide, steam and oxygen, is in the same magnitude as in design V1 (see Table 9).
Table 11. Coke-gasification (8.3 kg/h in V2): Operational settings, results and temperatures in segments 3–5.
Exp.
Settings Results
Wall Temperaturein K
Primary gas flow in m3/h(STP);
Preheat-temp. in K
Secondary gas flow in m3/h(STP);
Preheat-temp. in K
Total air ratio;CO2/O2 or H2O/O2-ratio in
kg/m3(STP)
Carbon conversion XC in%;
Cold gas efficiency ηCGE in%;
Syngas yield ySG inm3/kg(STP)
B-1
O2: 5.25H2O: 1.25CO2: 1.25
Temp.: 473
O2: 1.00H2O: 2.45CO2: 2.49N2: 1.01
Temp.: 493
λ: 0.46Mod./O2: 1.66
XC 84.6ηCGE 54.6ySG 1.37
S3: 1,307S4: 1,221S5: 1,271
Due to the lower necessary secondary gas volume flow, the raw gas composition of the experiment B-1 (Table 12)shows a higher carbon monoxide content in the water and nitrogen free gas, compared to the experiments A-1 and A-2in reactor design V1.
Even though the amount of solids in the main reaction zone is increased and the ash content in the fluidized bed isabout 65 wt.% (based on assumed inert ash content), no ash agglomeration occurs in experiment B-1. Reason can beassumed in the gasification behavior of the coke. Due to its low reactivity the partial oxidation of the coke is not
0
20
40
60
80
100
0.00 5.00 10.00 15.00 20.00
Car
bo
n c
on
vers
ion
in %
coke mass flow in kg/hr
O2/CO2 V2 O2/H2O V2 O2/CO2/H2O V2

64 The Open Fuels & Energy Science Journal, 2017, Volume 10 Schurz et al.
concentrated to a very small reaction volume, but extended to a larger reaction zone. Consequently the temperature hasa lower local maximum and ash agglomeration is unlikely for the investigated coke gasification.
A change in feedstock to in-situ produced coke via lignite utilization is a solution.
Table 12. Product gas composition of exp. B-1 (coke- gasification in V2; water and purge gas free).
Gas component CO CO2 H2 CH4Hydrocarbons
C2-C4H2S
Volume fractionin % (wf, pgf) 53.5 33.1 13.3 < 0.1 d.l. d.l.
wf: water free pgf: purge gas free (Nitrogen free) d.l.: below detection limit
4.5. Lignite-Coke-Mixture Gasification
The change in feedstock to in-situ produced coke via lignite utilization is a solution for the limitation by low cokereactivity. To reduce the influence of tar formation, the feedstock is a half-half-mixture of the hearth furnace coke andLusatian lignite.
Moisture evaporation and devolatilization of that mixture require an increase in secondary oxygen flow to providethe necessary heat especially in segments 1 and 2. The feedstock mass flow is increased to 11.5 kg/h to ensure acomparably thermal input to the coke experiments. To avoid slagging of the new feedstock, a quite high primary carbondioxide flow is necessary to keep the temperature in the main reaction zone sufficient low. The spouted-bed temperatureis relatively high due to the oxidization of volatiles in the lower segment 3. In Table 13 – C1 settings and results of thecoal-coke-mixture operation are summarized.
Table 13. Coke-coal-mixture-gasification (11.5 kg/h in V2): Operational settings, results and temperatures in segments 3–5.
Exp.
Settings Results
Wall Temperaturein K
Primary gas flow in m3/h(STP);
Preheat-temp. in K
Secondary gas flow in m3/h(STP);
Preheat-temp. in K
Total air ratio;CO2/O2 or H2O/O2-ratio in
kg/m3(STP)
Carbon conversion XC in%;
Cold gas efficiency ηCGE in%;
Syngas yield ySG inm3/kg(STP)
C-1O2: 5.00
CO2: 4.00Temp.: 498
O2: 1.75CO2: 4.49N2: 0.50
Temp.: 470
λ: 0.41Mod./O2: 2.49
XC 84.5ηCGE 50.1ySG 1.08
S3: 1,362S4: 1,301S5: 1,384
Experiment C-1 shows a carbon conversion of the same magnitude like in experiments A-12 and B-1 at moderatewall temperature in the main reaction zone. The comparatively low values of syngas-yield and cold-gas-efficiency areaffected by the high heat losses of the laboratory-scale equipment.
The product gas composition of experiment C-1 (see Table 14) is indicating comparatively high carbon dioxidecontent, as it is coming along with the addition of carbon dioxide being the only moderator and again by reasons of thesmall scale gasifiers with its high specific heat losses.
Table 14. Product gas composition of exp. C-1 (coke-coal-mixture-gasification in V2; water and purge gas free).
Gas component CO CO2 H2 CH4Hydrocarbons
C2-C4H2S
Volume fractionin % (wf, pgf) 51.7 43.0 5.2 < 0.1 d.l. d.l.
wf: water free pgf: purge gas free (Nitrogen free) d.l.: below detection limit
No tars or oils in the product gas have been recognized. Thus, higher hydrocarbons, produced via low temperaturepyrolysis, are destroyed in the hot main reaction zone by crossing the flame. Affirmatively, the gas chromatographydetects no higher hydrocarbons at the product gas exit, even for the early start-up procedure with comparatively lowtemperature. The turbulence, caused by the jet and recirculation cell around the primary gas nozzle, is thereforeexpected to be very beneficial for the system.
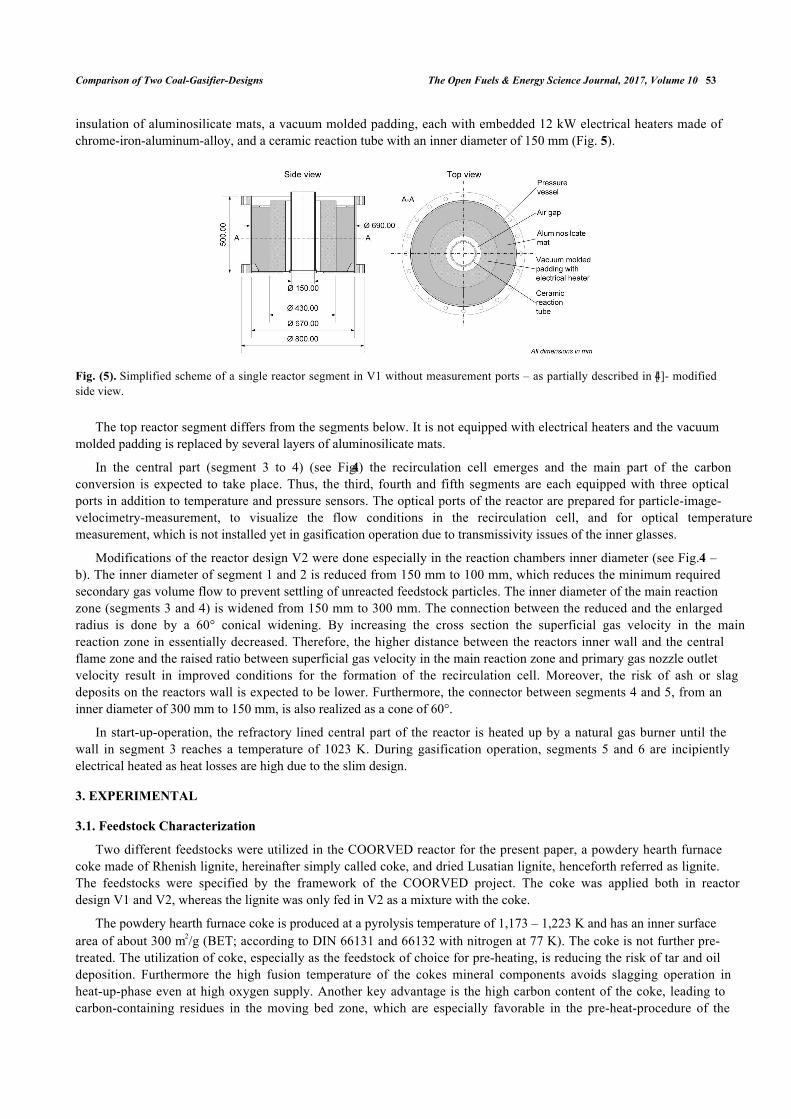
The major drawbacks imposed by pure coke as feedstock have been solved. With the use of lignite-coke-mixtureand all combined beneficial influences on the process, the ash agglomeration occurred. The agglomerates are showing a
Comparison of Two Coal-Gasifier-Designs The Open Fuels & Energy Science Journal, 2017, Volume 10 65
wide range in size, from very small conglomerates of the size of the largest feedstock particles up to approx. 10 mm(Fig. 12). They can be found in the bottom product, mixed with bigger coke particles from the start-up procedure.
Fig. (12). Agglomerates of lignite-coke-gasification in reactor design V2: a) photography of falling agglomerate via optical excess inprocess, b) screened agglomerates from bottom product.
The results of the ultimate analysis of the agglomerates (see Table 15) confirm the expected very low carboncontent.
Table 15. Ultimate analysis of ash agglomerates (coke-coal-mixture-gasification in V2).
Element C H N St
Content in wt.% (waf) 0.25 – 1.50 < 0.07 < 0.09 0.2 – 4.0waf: water and ash free
CONCLUSION
The laboratory-scale internal circulation gasifier COORVED has been successfully started-up. The fundamentalfunctionality of the flow pattern such as the formation of recirculation cells in the jetting-fluidized bed and theemergence of the moving bed in the lower reactor segments are proven. The possibility to control the temperature in thecrucial segments of the reaction chamber, by different parameters, like addition of oxygen and moderators, as well asgas pre-heating temperature, is determined. As a result of further equipment optimization the reactors inner walltemperature could be reduced. The residence time of the particles in the process, by using lower gas amounts, could beincreased, too. Low-reactive coke turned out to be inappropriate for ash agglomeration under the investigated conditionseven in the improved reactor design. Finally, usage of lignite and consequently in-situ coke production in the improvedreactor geometry yield better results. The ash agglomeration was confirmed and the gasifiers bottom ash has an averagecarbon content below 1.0 wt.%. The raw gas in lignite utilization is free of higher hydrocarbons.
ETHICS APPROVAL AND CONSENT TO PARTICIPATE
Not applicable.
CONSENT FOR PUBLICATION
Not applicable.
CONFLICT OF INTEREST
The author (editor) declares no conflict of interest, financial or otherwise.
ACKNOWLEDGEMENT
The authors appreciatively acknowledge the financial funding of the German Federal Ministry of Economic Affairs

66 The Open Fuels & Energy Science Journal, 2017, Volume 10 Schurz et al.
and Energy as well as the co-funding provided by the Poerner Group in the framework of the COORVED project (R&Dnumber: 0327865). Special thanks are regarded to K. Uebel and D. Vogt for numerous productive discussions.
REFERENCES
[1] Gräbner, M.; Uebel, K.; Messig, D.; Meyer, B. Development and modelling of 3rd generation gasifiers for low-rank and high-ash coals, Paper18-1, international conference on coal science and technology 26.-28.10.2009, Cape Town, ZA.
[2] Gräbner, M.; Laugwitz, A.; Meyer, B. Development and modelling of 3rd generation gasification concepts for low grade coals, Paper # 06-1,international conference on IGCC & XtL technologies, 3.-5.5.2010, Dresden, Germany.
[3] Gräbner, M. Industrial Coal Gasification Technologies Covering Baseline and High-Ash Coal; Wiley-VCH: Weinheim, 2015.
[4] Schimpke, R.; Laugwitz, A.; Schurz, M.; Krzack, S.; Meyer, B. Flow pattern evaluation of the internal circulation gasification principle. Fuel,2015, 147, 221-229.[http://dx.doi.org/10.1016/j.fuel.2014.12.039]
[5] Laugwitz, A.; Schurz, M.; Meyer, B. Modeling and experimental investigation of an internally circulating gasifier for high ash coals.Pittsburgh Coal Conference, 2014.Pittsburgh, USA
[6] Schurz, M.; Laugwitz, A.; Krzack, S.; Meyer, B. Start-up of internal circulation gasifier COORVED. 6th International Conference on IGCC &XtL Technologies, 2014.Dresden, Germany
[7] Stelzner, B.; Hunger, F.; Laugwitz, A.; Gräbner, M.; Voss, S.; Uebel, K.; Schurz, M.; Schimpke, R.; Weise, S.; Krzack, S.; Trimis, D.; Hasse,C.; Meyer, B. Development of an inverse diffusion partial oxidation flame and model burner contributing to the development of 3rdgeneration coal gasifiers. Fuel Process. Technol., 2013, 110, 33-45.[http://dx.doi.org/10.1016/j.fuproc.2013.01.005]
[8] TU, Bergakademie Freiberg.; Meyer, B.; Gräbner, M.; Pardemann, R. Verfahren und Vorrichtung zur Flugstromvergasung fester Brennstoffeunter Druck. Patent DE 10 2008 037 318 A1 2010.
[9] TU, Bergakademie Freiberg.; Meyer, B.; Seifert, P.; Krzack, S.; Ogriseck, S.; Rauchfuß, H.; Rieger, M.; Trompelt, M.; Guhl, S. Verfahrenund Vorrichtung zur verschlackenden Vergasung fester Brennstoffe unter Druck. Patent DE 10 2007 006 977 A1 2008.
[10] Gräbner, M.; Meyer, B. Introduction of a ternary diagram for comprehensive evaluation of gasification processes for ash-rich coal. Fuel,2013, 114, 56-63.[http://dx.doi.org/10.1016/j.fuel.2012.01.069]
[11] Mason, D.M.; Patel, J.G. Chemistry of ash agglomeration in the U-Gas process. Fuel Process. Technol., 1980, 3(3-4), 181-206.[http://dx.doi.org/10.1016/0378-3820(80)90003-X]
[12] Goyal, A.; Rehmat, A.; Knowlton, T.M.; Leppin, D.; Waibel, R.T.; Patel, J.G. Support studies for the U-GAS coal gasification process: Part I:Fluidization. Fuel Process. Technol., 1987, 17(2), 169-186.[http://dx.doi.org/10.1016/0378-3820(87)90076-2]
[13] Goyal, A.; Rehmat, A.; Knowlton, T.M.; Leppin, D.; Waibel, R.T.; Patel, J.G. Support studies for the U-GAS coal gasification process: PartII: Combustion characteristics. Fuel Process. Technol., 1988, 17(3), 209-219.[http://dx.doi.org/10.1016/0378-3820(88)90036-7]
[14] Zhang, Y. Biomass fluidized bed gasification for fuel gas. 2010. International Conference on IGCC & XtL Technologies, 3.-5.5.2010,Dresden, Germany.
[15] Haldipur, GB; Schmidt, DK; Smith, KJ A 50-month gasifier mechanistic study and downstream unit Process development program for thepressurized ash-agglomerating fluidized-bed gasification system Final Report - Volume II, 1988.
[16] Gräbner, M.; Meyer, B. Performance and exergy analysis of the current developments in coal gasification technology. Fuel, 2014, 116,910-920.[http://dx.doi.org/10.1016/j.fuel.2013.02.045]
[17] Hsieh, C.R.; Roberts, P.T. A laboratory study of agglomeration in coal gasification; Preprints - American Chemical Society; Division ofPetroleum Chemistry, 1985, Vol. 30.
[18] Bartels, M.; Lin, W.G.; Nijenhuis, J. Agglomeration in fluidized beds at high temperatures: Mechanisms, detection and prevention. Pror.Energy Combust. Sci., 2008, 34(5), 633-666.[http://dx.doi.org/10.1016/j.pecs.2008.04.002]
[19] Gupta, C.K.; Sathiyamoorthy, D. Fluid bed technology in materials processing; CRC Press: Boca Raton, Fla, 1999.
[20] Yang, W. Handbook of fluidization and fluid-particle systems; Marcel Dekker: New York, 2003.[http://dx.doi.org/10.1201/9780203912744]
[21] Chen, D; Tang, L; Zhou, Y; Wang, W; Wu, Y; Zhu, Z Effect of char on the melting characteristics of coal ash. J. fuel chem. and tech., 2007,35(2), 136-40.[http://dx.doi.org/10.1016/S1872-5813(07)60014-0]
[22] Sandstrom, W.A.; Rehmat, A.G.; Bair, W.G. A Fluidized-Bed Ash-Agglomeration Gasifier, Coal Processing Technology, 1977, 3((A78-4340313-44)), 180-186.

Comparison of Two Coal-Gasifier-Designs The Open Fuels & Energy Science Journal, 2017, Volume 10 67
[23] Nikrityik, P.; Meyer, B. Gasification Processes – Modelling and Simulation; Wiley-VCH: Weinheim, 2014.
[24] Adlhoch, W.; Keller, J.; Herbert, P.K. The development of the HTW coal gasification process. 1990.9th conference, gasification powerplantsPalo Alto, California, USA
[25] Laugwitz, A.; Gräbner, M.; Meyer, B. Modeling based development of internally circulating gasifier for high ash coals. Proceedings of thePittsburgh Coal Conference Beiging, China 2013.
[26] Schimpke, R.; Klinger, M.; Krzack, S.; Meyer, B. Determination of the initial ash sintering temperature by cold compression strength testswith regard to mineral transitions. Fuel, 2017, 194, 157-165.[http://dx.doi.org/10.1016/j.fuel.2016.12.066]
[27] Kunii, D.; Levenspiel, O. Fluidization Engineering; Butterworth-Heinemann: Stoneham, 1991.
[28] Duarte, C. R.; Murata, V. V.; Barrozo, M. A. S. A study of the fluid dynamics of the spouted bed using CFD. Braz. J. Chem. Eng., 2005,22(2) São Paulo[http://dx.doi.org/10.1590/S0104-66322005000200014]
[29] Reh, L. Das Wirbeln von körnigem Gut im schlanken Diffusor als Grenzzustand zwischen Wirbelschicht und pneumatischer Förderung.,PhD-thesis: TH Karlsruhe, Germany, 1961.
© 2017 Schurz et al.
This is an open access article distributed under the terms of the Creative Commons Attribution 4.0 International Public License (CC-BY 4.0), acopy of which is available at: https://creativecommons.org/licenses/by/4.0/legalcode. This license permits unrestricted use, distribution, andreproduction in any medium, provided the original author and source are credited.